Cancer Prevention in Eastern North Carolina Task 3: …...3 Cancer Profile of Eastern North Carolina...
153
1 Cancer Prevention in Eastern North Carolina Task 3: Final Report A Cancer Profile of Eastern North Carolina Submitted March 30, 2012 Appendix updated April 4, 2012 Prepared for: Caroline Chappell, MPA Interim Manager, NC Comprehensive Cancer Program North Carolina Department of Health and Human Services Division of Public Health 1922 Mail Service Center Raleigh, NC 27699-1922 Prepared by: C. Suzanne Lea, PhD, MPH Department of Public Health Brody School of Medicine, mailstop 660 East Carolina University Greenville, NC 27834 Contract # 02776-12
Transcript of Cancer Prevention in Eastern North Carolina Task 3: …...3 Cancer Profile of Eastern North Carolina...

1
Cancer Prevention in Eastern North Carolina
Task 3: Final Report
A Cancer Profile of Eastern North Carolina
Submitted March 30, 2012
Appendix updated April 4, 2012
Prepared for:
Caroline Chappell, MPA Interim Manager, NC Comprehensive Cancer Program
North Carolina Department of Health and Human Services Division of Public Health
1922 Mail Service Center Raleigh, NC 27699-1922
Prepared by:
C. Suzanne Lea, PhD, MPH Department of Public Health
Brody School of Medicine, mailstop 660 East Carolina University
Greenville, NC 27834
Contract # 02776-12

2
Project Title: Cancer Prevention in Eastern North Carolina
Grantor: Comprehensive Cancer Program N.C., Division of Public Health, North Carolina Department of
Health and Human Service
Name of Grantee: East Carolina University
Contract #: 02776-12
Effective Period: June 30, 2011 to June 29, 2012
Project Contact:
Suzanne Lea, PhD, MPH Associate Professor
Department of Public Health, Brody School of Medicine
600 Moye Boulevard, mailstop 660
East Carolina University
Greenville, NC 27834
ph. 252.744.4036
email: [email protected]
Key Personnel
Personnel Project/Job title Phone Email
Suzanne Lea, PhD, MPH Principal Investigator (252) 744-4036 [email protected]
Carrie May Research Project
Coordinator
(252) 744-5690 [email protected]
Emily Miller Graduate Assistant [email protected].
edu
Rick Smiley Office of Sponsored
Programs/pre-award
(252)328-9539 [email protected]
Ella Barrett ECU Contracts/budget
management
(252)328-9521 [email protected]

3
Cancer Profile of Eastern North Carolina
for Breast, Cervical, and Colorectal Cancers
March 2012
Authors:
C. Suzanne Lea, Ph.D, MPH
Carrie May, MPH
Emily Miller, BA
Department of Public Health
Brody School of Medicine
East Carolina University
Greenville, NC

4
Acknowledgements
The East Carolina University (ECU), Brody School of Medicine, Department of Public Health,
Project Team for Cancer Prevention in Eastern North Carolina would like to thank the North Carolina
Department of Health and Human Services (NC DHHS), NC Comprehensive Cancer Program for providing
funding and support for developing the Cancer Profile of Eastern North Carolina. Many professionals
made preparation of this profile possible by aggregating and providing data. We would like to thank Dr.
Katherine Jones and Dr. Satomi Imai from the ECU Center for Health Systems Research and
Development who provided summary data for the regional statistical analysis, and Dr. Karen Mulcahy
from the ECU Department of Geography who provided geocoding of cancer access to screening and care
featured in appendix. We appreciate the support of Mr. Gabriel Knop from State Center for Health
Statistics, NC Central Cancer Registry in providing cancer incidence and mortality rates for the eastern
North Carolina, and Tammy Lester from the NC Department of Commerce in providing guidance on
county-level economic data.
5
Table of Contents
Acknowledgements .................................................................................................................................... 4
Introduction .................................................................................................................................................. 8
Methods ....................................................................................................................................................... 9
Types of Cancers ................................................................................................................................... 9
Sources of data....................................................................................................................................... 9
Dates of Data .......................................................................................................................................... 9
Collection of Data ................................................................................................................................. 10
Analysis of Data .................................................................................................................................... 10
Limitations of Data ............................................................................................................................... 11
Methods References ............................................................................................................................ 12
Geography ............................................................................................................................................. 13
Economics ............................................................................................................................................. 13
Demographics ....................................................................................................................................... 14
Burden of Cancer ................................................................................................................................. 14
Cancer Surveillance ............................................................................................................................. 16
Colon and Rectal Cancers (CRC).................................................................................................. 16
Female Breast Cancer ..................................................................................................................... 17
Cervix Uteri Cancer .......................................................................................................................... 18
Cancer Risk Factors ............................................................................................................................ 19
Eastern North Carolina Profile References ...................................................................................... 20
County-Level Profiles ............................................................................................................................... 21
BEAUFORT COUNTY ......................................................................................................................... 22
BERTIE COUNTY ................................................................................................................................ 25
CAMDEN COUNTY ............................................................................................................................. 28
CARTERET COUNTY ......................................................................................................................... 31
CHOWAN COUNTY ............................................................................................................................ 34
CRAVEN COUNTY .............................................................................................................................. 37
CURRITUCK COUNTY ....................................................................................................................... 40
DARE COUNTY ................................................................................................................................... 43
DUPLIN COUNTY ................................................................................................................................ 46

6
EDGECOMBE COUNTY ..................................................................................................................... 49
GATES COUNTY ................................................................................................................................. 52
GREENE COUNTY .............................................................................................................................. 55
HALIFAX COUNTY .............................................................................................................................. 58
HERTFORD COUNTY ........................................................................................................................ 61
HYDE COUNTY ................................................................................................................................... 64
JONES COUNTY ................................................................................................................................. 67
LENOIR COUNTY ................................................................................................................................ 70
MARTIN COUNTY ............................................................................................................................... 73
NASH COUNTY ................................................................................................................................... 76
NORTHAMPTON COUNTY ............................................................................................................... 79
ONSLOW COUNTY ............................................................................................................................. 82
PAMLICO COUNTY ............................................................................................................................. 85
PASQUOTANK COUNTY ................................................................................................................... 88
PERQUIMANS COUNTY .................................................................................................................... 91
PITT COUNTY ...................................................................................................................................... 94
TYRRELL COUNTY ............................................................................................................................. 97
WASHINGTON COUNTY ................................................................................................................. 100
WAYNE COUNTY .............................................................................................................................. 103
WILSON COUNTY ............................................................................................................................. 106
County-Level Profile References ..................................................................................................... 109
Access to CareMammography ............................................................................................................. 110
Methods ............................................................................................................................................... 111
Results ................................................................................................................................................. 111
Colposcopy Service ............................................................................................................................... 113
Methods ............................................................................................................................................... 113
Results ................................................................................................................................................. 113
Exhibit 157. Northeastern Region Colposcopy Referral Sites ............................................................... 114
Colonoscopy ........................................................................................................................................... 115
Methods ............................................................................................................................................... 115
Results ................................................................................................................................................. 115
Hospitals .................................................................................................................................................. 117

7
Methods ............................................................................................................................................... 117
Results ................................................................................................................................................. 117
Federally Qualified Health Centers and Look-Alike Sites ................................................................ 119
Methods ............................................................................................................................................... 119
Results ................................................................................................................................................. 119
Access to Care References .................................................................................................................. 121
Appendices .............................................................................................................................................. 122
Demographic Data by County .......................................................................................................... 123
Cancer Incidence and Mortality Rates by county .......................................................................... 123
Cancer Resource Directory for Eastern North Carolina ............................................................... 136
8
Introduction
In 2009, cancer became the leading cause of death in North Carolina. [1] Some of the primary
reasons for this shift include an aging population and successful management of cardiovascular disease
(CVD), resulting in an increase in cancer incidence and a decline in CDV death rates. Historically, the
eastern region of North Carolina has experienced greater cancer mortality than the rest of North
Carolina as a whole.
The Department of Public Health, Brody School of Medicine at East Carolina University in
collaboration with the North Carolina (NC) Comprehensive Cancer Program, Division of Public Health in
the NC Department of Health and Human Services publishes the “Cancer Profile of Eastern North
Carolina for Breast, Cervical, and Colorectal Cancers” with the aim to provide a brief characterization of
the relationship between the demographic, social, and behavioral aspects of the region with the
incidence and mortality of these screening-preventable cancers. Cancers summaries contained in this
report are the focus of active statewide efforts to increase screening and reduce mortality.
For the purpose of the profile, Eastern North Carolina (ENC) is defined as a 29-county region
which includes: Beaufort, Bertie, Camden, Carteret, Chowan, Craven, Currituck, Dare, Duplin,
Edgecombe, Gates, Greene, Hertford, Hyde, Jones, Lenoir, Martin, Nash, Northampton, Onslow,
Pamlico, Pasquotank, Perquimans, Pitt, Tyrrell, Washington, Wayne, and Wilson counties. The Rest of
North Carolina (RNC) constitutes the remaining 71 counties.
The Cancer Profile is presented by region and 29-counties in alphabetic order. Each geographic
area includes the following description:
Economic,
Demographic,
Cancer surveillance ( incidence and mortality rates for breast, cervical, and colorectal
cancers), and
Risk factor information.
County-specific cancer incidence and mortality data are presented by gender and race, if available.
Since this document is essentially descriptive, no attempt is made to compare or interpret data between
individual counties and no conclusions are provided. We anticipate the reader of this profile may
conclude that challenges remain to reduce the burden of cancer in eastern North Carolina that will
involve individual, health system, and community-based interaction and collaboration to resolve.

9
Methods
Types of Cancers The Cancer Profile focuses on three types of screening-preventable cancers: invasive female
breast cancer, cervical cancer, and colorectal (CRC) cancers. Each of these cancers has screening
modalities for cancer prevention and/or early detection. Rates for invasive cancer are reported; in situ
cancer is omitted.
Sources of data Regional and state demographic and economic data came from several sources. Economic and
demographic data were obtained from the North Carolina Department of Commerce [2] for largest
industry based on numbers of persons employed (2011), county economic tier designations (2011); the
U.S. Census Bureau [4,5] for median household income (2009), percent persons living below the poverty
level (2009) in a county, population counts (2010); and the County Health Rankings website [6] for
estimated high school graduation defined as percent of ninth grade cohort that graduates in four years
(2007-2008), and percent uninsured defined as percent of adults 18-64 without insurance (2007). [6]
Cancer incidence and mortality rates for the region of ENC compared to the RNC were obtained
from the NC Central Cancer Registry [7] while the county-specific cancer incidence and mortality data
were obtained from the State Cancer Profiles, National Cancer Institute (NCI). [8] Healthy People 2010
data were provided by the Centers for Disease Control and Prevention (CDC). [9] Behavioral risk factor
data were obtained from the Behavioral Risk Factor Surveillance System (BRFSS) available through three
sources: the North Carolina State Center for Health Statistics (NC DHHS) [10], the County Health
Ranking Website [6] and through the NC Health Data Explorer (East Carolina University, Center for
Health Systems Research and Development) .[11]
Dates of Data Regional and state demographic and economic data came from several sources [2-6]. These
data are range between the years of 2008 and 2010. Industry data were compiled by the North Carolina
Department of Commerce [2] from data available through the U.S. Department of Labor, Bureau of
Labor Statistics. [12] For example, the population totals are from 2010, median household income data
are from 2009, while high school graduation rates are from 2008. Emphasis was placed on obtaining
data from the same year(s) and source. Where possible, the most recent data were used for the Cancer
Profile.
The latest available incidence and mortality data for ENC, collectively, (29 counties) and the rest
of North Carolina (71 counties) were for the 5-year span of 2004-2008 (North Carolina Central Cancer
Registry). [7] The latest available county-specific incidence rates were for 2004-2008, while the latest
county-specific mortality rates were from 2003-2007 (State Cancer Profiles, NCI, CDC) .[8] Behavioral
Risk Factor Surveillance System (BRFSS) data reported in the Cancer Profile ranges from the years 2003-
2009. [6, 10, 11]

10
Collection of Data The team conducted a website search for data sources for county-level economic and
demographic data. Cancer incidence and mortality rates and cancer risk factor data were identified
from standard sources (Cancer Control Planet and BRFSS). [8,10] The website search resulted in the
creation of an annotated list of potential data sources for the Cancer Profile spreadsheet. Additional
resources were derived through contacts already established by the team. For county-specific data, a
text template was designed to simplify and systematize the process of inputting county-level data.
Utilizing chosen sources, spreadsheets were created and data extracted into Microsoft Excel that
included data specific to each section of the county-specific template. For example, all demographic
data for 29 counties were compiled into a spreadsheet so that rates and percentages could be easily
entered into the text template. Similar spreadsheets were created for county-specific economic, cancer
surveillance, and BRFSS data.
Analysis of Data Some data required further analysis or calculations to derive necessary information for the
Cancer Profile. The measure of largest industry by county was derived from industry data that showed
the numbers employed by type of industry per county. Data for Eastern North Carolina counties were
sorted by number employed by industry (greatest to smallest). The industry with the highest number of
employees was reported as the largest industry in the county. [2] Median household income for Eastern
North Carolina was calculated by taking the median of the median for each county. [4] It is assumed that
the county-specific median values were obtained from a sample and that the 29 county samples are
from the same underlying distribution. County-specific estimated high school graduation rate was
defined as percent of ninth grade cohort that graduated in four years (2007-2008). [6] The estimated
high graduate rate was based on incomplete reporting by some school districts for counties in eastern
NC. County Health rankings used public school survey data for the 2007-2008 school year to estimate
graduate rates in 2010. [6] County-specific percent uninsured was defined as percent of adults 18-64
without insurance (2007). [6]
Utilizing 2010 Census data, the reporting of percent population by age and race in ENC was
derived from totaling the individual county population counts and then calculating it as a percent of the
total population of ENC.[5] For example, all total population counts for ENC counties were added
together to get the total population of ENC (1,401,803, Census 2010). To derive the total African
American population in ENC, the individual county population counts of African American persons were
added together and then divided by the total ENC population for the percent African American in ENC.
For the region-specific data, crude (unadjusted) cancer incidence and mortality rates for ENC
and RNC 71 counties was produced by the NC Central Cancer Registry, 2011.[7] Rates for the 5 year
period 2004-2008 are for adults (age 20 and over) , and use bridged-race population estimates obtained
from the CDC’s National Center for Health Statistics, Vintage 2009. Rates for female breast cancer and
cervix uteri cancer exclude males in population denominators. Regional age-specific rates are
presented for white and African Americans. Hispanic ethnicity is included in white race. Rates based on
counts less than 16 are unstable. ENC regional cancer rates by gender are age-adjusted as provided by
the NC Center for Health Statistics.

11
County-specific cancer incidence (2004-2008) and mortality (2003-2007) rates were obtained
from the State Cancer Profiles from the website Cancer Control P.L.A.N.E.T. (NCI, CDC). [8] The 95%
Confidence Intervals (CIs) for the county rates provide a measure of how certain or uncertain the
estimated rate is and can be used to generally assess how different one rate is from another. Some
incidence and mortality rates were suppressed due to small numbers and instability of rate estimates.
County-specific Incidence rates (cases per 100,000 population per year) are age-adjusted to the 2000 US
standard population (19 age groups: <1, 1-4, 5-9, ... , 80-84, 85+). Rates are for invasive cancer only. For
further information: http://statecancerprofiles.cancer.gov/help/about/descriptions.html#incidence.
Mortality rates were obtained from the State Cancer Profiles from the website Cancer Control
P.L.A.N.E.T. These rates are provided by the National Vital Statistics System at the National Center for
Health Statistics, CDC. [8] For further information:
http://statecancerprofiles.cancer.gov/help/about/descriptions.html#death_rates.
Staff from the Center for Health Systems Research and Develop aggregated BRFSS data for the
ENC section of the Profile (29 counties) and RNC (71 counties). [10]
Limitations of Data County industry data, (measured by numbers employed by industry type) used to determine
largest industry may be suppressed in particular industries due to laws protecting employer
confidentiality. [2] It is unknown how common this was by county.
Data on access to primary care are considered unreliable for the following reasons. Although
the relationship between primary care providers and improved health outcomes is supported in the
literature, this measure has a number of limitations. First, primary care providers are classified by
county, but providers living on the edge of counties or who practice in multiple locations may see
patient populations that reside in surrounding counties. Therefore, this measure may either over- or
underestimate patient access to primary care in some situations since patient-provider interaction is not
restricted by county boundaries. This estimate does, however, suggest access to medical care.
In the Cancer Profile, the cancer incidence and mortality rates for overall ENC cannot be
compared to the cancer incidence and mortality rates of individual counties in ENC because the data
come from two different sources [7,8], and each source uses different population denominators. NC
Central Cancer Registry incidence and mortality rates, used for the Eastern North Carolina Profile are
crude rates. [7] National Cancer Institute, State Cancer Profile incidence and mortality rates, used for
the County-Level Profiles are age-adjusted. [8] The magnitude of differences between RNC and ENC
rates may be compared, as well as rates between ENC counties; the regional rates cannot be compared
to county rates.
Suppression of data due to small numbers may mean that the Cancer Profile reports less cancer
incidence and mortality data for certain counties, especially in regards to specific gender and/or racial
data.
BRFSS results for the ENC Profile as compared to County-Level profiles cannot be compared
because of the use of different population denominators and because of different units of measure (in
some instances). [6,10,11]

12
Methods References 1. NC DHHS, State Center for Health Statistics. (2012, Jan. 9). Leading Causes of Death in North
Carolina. Retrieved from http://www.schs.state.nc.us/SCHS/data/lcd/lcd.cfm.
2. North Carolina Department of Commerce. (2011, Dec 6). AccessNC/EDIS. NC counties with
employment and wages by industry and by occupation. Personal communication, Tammy Lester.
3. North Carolina Department of Commerce. (2011, Dec 7). 2011 County Tier Designations. Retrieved
from http://www.nccommerce.com/research-publications/incentive-reports/2011-county-tier-
designations.
4. U.S. Census Bureau. (2011, Nov 23). State and County Quickfacts: North Carolina. Retrieved from
http://quickfacts.census.gov/qfd/states/37/37013.html.
5. U.S. Census Bureau. (2011, Dec 7). Profile of General Population and Housing Characteristics: 2010,
2010 Demographic Profile Data. Retrieved from
http://factfinder2.census.gov/faces/tableservices/jsf/pages/productview.xhtml?src=bkmk.
6. County Health Rankings (2009). (2011, Dec 7). North Carolina County Health Rankings. Retrieved
from http://www.countyhealthrankings.org.
7. NC Central Cancer Registry, 2011. (2011, Dec 13). 2004-2008 Age-Specific Cancer Incidence and
Mortality Rates for Males and Females for Eastern North Carolina and NC71 (Non-Eastern NC); Rates
Per 100,000.
8. National Cancer Institute. (2011, Nov 23). State Cancer Profiles: North Carolina counties. Death rates
and Incidence Rates. Retrieved from http://statecancerprofiles.cancer.gov.
9. Centers for Disease Control and Prevention. (2011, Nov 9). Healthy People 2010. Retrieved from http://www.healthypeople.gov/2010/document/html/volume1/03cancer.htm.
10. NC DHHS, State Center for Health Statistics. (2011, Dec 16). Behavioral Risk Factor Surveillance
System, System Results, 2005-2009. Retrieved from
http://www.schs.state.nc.us/SCHS/brfss/results.html.
11. North Carolina Health Data Explorer. (2011, Nov 9). Center for Health Systems Research and
Development, East Carolina University, Greenville, NC. Retrieved from http://www.ecu.edu/chsrd/.
12. U.S. Department of Labor, Bureau of Labor Statistics. BLS Handbook of Methods.
http://www.bls.gov/opub/hom/homch5_itc.htm.
13
EASTERN NORTH CAROLINA PROFILE
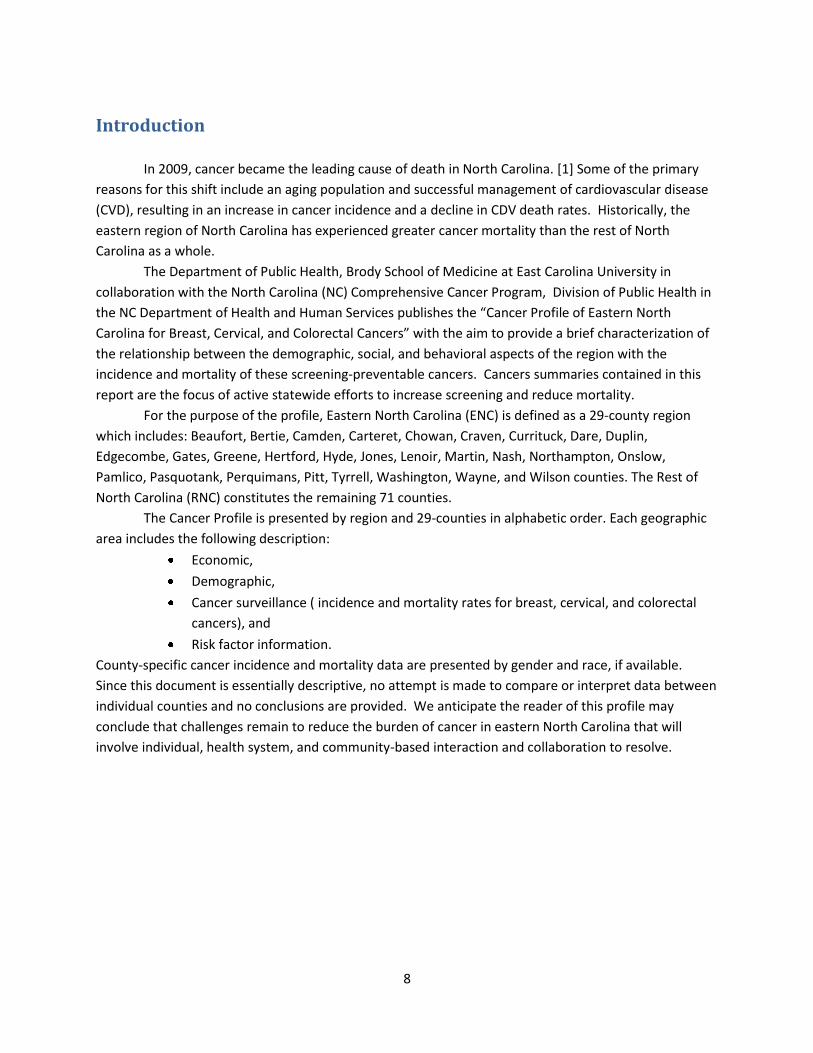
Geography Eastern North Carolina serves a large geographic area of North Carolina that includes 29 of the
100 counties in North Carolina. The 29-county area of Eastern North Carolina (ENC) may be visualized as
including counties to the east of US Interstate 95 and north of US Interstate 40, bordering on the state
of Virginia to the north. It is sometimes referred to as Northeastern North Carolina but for the purpose
of the Cancer Profile, the 29-county region will be referred to as Eastern North Carolina.
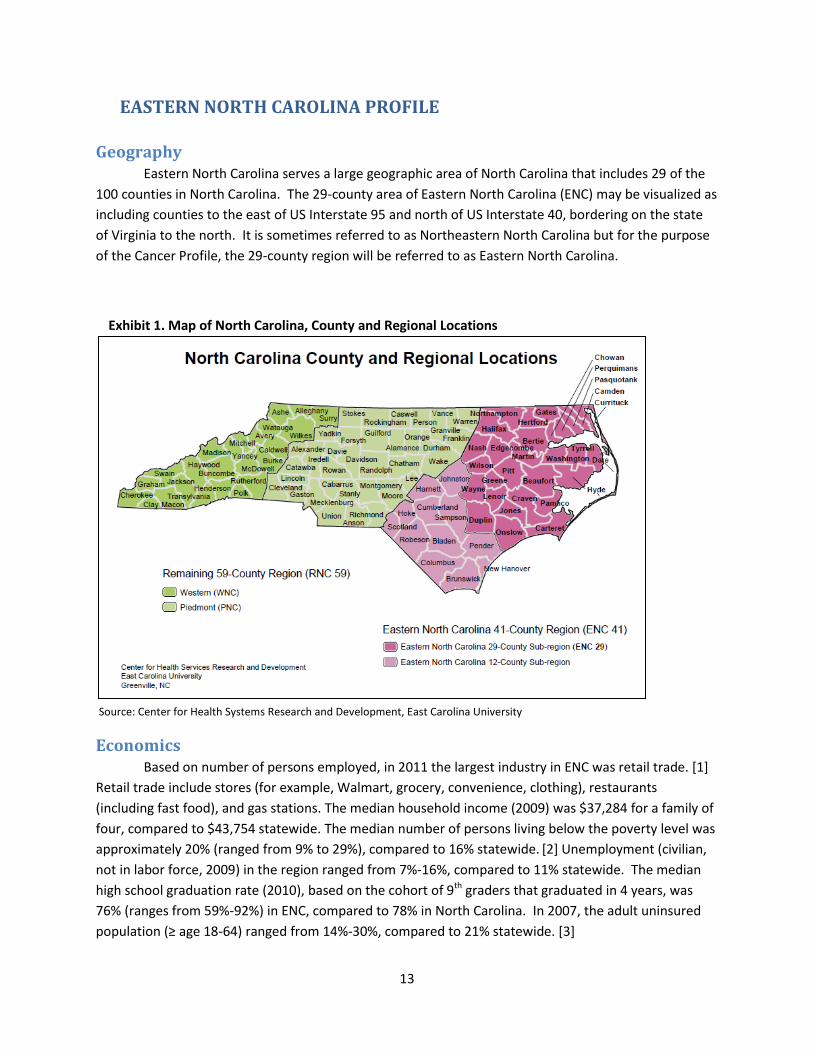
Economics Based on number of persons employed, in 2011 the largest industry in ENC was retail trade. [1]
Retail trade include stores (for example, Walmart, grocery, convenience, clothing), restaurants
(including fast food), and gas stations. The median household income (2009) was $37,284 for a family of
four, compared to $43,754 statewide. The median number of persons living below the poverty level was
approximately 20% (ranged from 9% to 29%), compared to 16% statewide. [2] Unemployment (civilian,
not in labor force, 2009) in the region ranged from 7%-16%, compared to 11% statewide. The median
high school graduation rate (2010), based on the cohort of 9th graders that graduated in 4 years, was
76% (ranges from 59%-92%) in ENC, compared to 78% in North Carolina. In 2007, the adult uninsured
population (≥ age 18-64) ranged from 14%-30%, compared to 21% statewide. [3]
Exhibit 1. Map of North Carolina, County and Regional Locations
Source: Center for Health Systems Research and Development, East Carolina University

14
The NC Department of Commerce annually ranks counties based on economic well being and
assigns each a tier designation. The 40 most distressed counties are designated as Tier 1, the next 40 as
Tier 2, and the 20 least distressed as Tier 3. For 2011, 15 of the 29 ENC counties were designated as Tier
1 (52%), most economically distressed; 11 ENC counties (38%) were designated as Tier 2; and 3 ENC
counties (10%) were designated as Tier 3, least economically distressed. Overall, Eastern North Carolina
counties comprise approximately 38% of all Tier 1 counties, the most economically distressed counties
in the state. [4] Economically, several coastal counties in the region comprise a more affluent
demographic group than counties in the interior coastal plain.
Demographics Based on data from the 2010 US Census, ENC had a total population of 1,401,803 persons. The
population was 23.3% children (<18), 63.3% adults ages 18-64, and 13.4% elders (≥65). ENC was 32%
African American (AA) (22% AA statewide) and 63% white (69% white statewide). Latinos/Hispanics (any
race) comprised 6% of the population in Eastern North Carolina (8% statewide). The overall ENC
population was 51% female and 49% male. [5]
Burden of Cancer For the years 2004-2008, there were 34,167 newly diagnosed cases of cancer in eastern North
Carolina, and 184,700 new cases of cancer in the rest of North Carolina. The total all-cancer incidence
rate for ENC was 7% higher than the all-cancer incidence rate for the rest of North Carolina (718.8 per
100,000 persons compared to 671.2 per 100,000 persons). [6] For cancer-specific ENC compared to RNC
incidence and mortality rates see Exhibit 4 and 5.
During the same time period, of 84,936 statewide cancer deaths, 14,271 (17%) occurred in the
29 eastern North Carolina counties, and 70,665 deaths occurred in the rest of the state. The total all-
cancer mortality rate for ENC was 16% higher than the all-cancer mortality rate for the rest of North
Source: U.S. Census, 2010. Source: U.S. Census, 2010.

15
Carolina (300.2 per 100,000 persons compared to 256.8 per 100,000 persons). [6] For cancer-specific
ENC vs. RNC incidence and mortality rates see Exhibit 4 and 5.
Racial disparities in cancer incidence and mortality rates appear to be more pronounced in the
eastern region of the state. For example, in 71-county area of RNC, the African American breast cancer
rate was 9% higher than the white rate (39.6 per 100,000 persons compared to 36.1 per 100,000
persons. In ENC, for 2004-2008, the African American breast cancer mortality rate was 47% higher than
the white rate (56.6 per 100,000 persons compared to 38.4 per 100,000 persons). See Exhibit 6 and 7.
[6]
Exhibit 5. Cancer Mortality Rates (crude) per 100,000 population, 2004-2008
Type of cancer ENC-29 RNC-71
Colon/Rectum 27.3 22.7
Female Breast 44.0 36.1
Cervix Uteri 4.8 3.3
Source: NC Central Cancer Registry, 2011
Exhibit 4. Cancer Incidence Rates (crude) per 100,000 population, 2004-2008
Type of cancer ENC-29 RNC-71
Colon/Rectum 76.2 64.3
Female Breast 201.5 181.4
Cervix Uteri 12.6 10.8
Source: NC Central Cancer Registry, 2011
Source: NC Central Cancer Registry, 2011
Source: NC Central Cancer Registry, 2011
CRC Female Breast Cervical
Whites 22.6 36.1 2.9
Blacks 25.7 39.6 4.7
0
10
20
30
40
50
60
Rat
e p
er
10
0,0
00
pe
rso
ns
Exhibit 6. Cancer Crude Mortality Rate, Rest of North Carolina (71 counties), by Race, 2004-2008
Source: NC Central Cancer Registry, 2011

16
Cancer Surveillance
Colon and Rectal Cancers (CRC)
The incidence and mortality rates of Colon and Rectal cancers in the 29 county eastern region of
North Carolina were higher than the remaining 71 counties (RNC) for persons 20 years and over. For
2004-2008, the average crude incidence rate for colorectal cancer in ENC was 17% greater (expressed as
a ratio) compared to RNC (76.2 per 100,000 persons compared to 64.3 per 100,000 persons). Similarly,
the average crude mortality rate for colorectal cancer was 18% greater in ENC compared to RNC (27.3
per 100,000 persons compared to 22.7 per 100,000 persons) during 2004-2008.[6]
Within Eastern North Carolina, CRC incidence rates were slightly higher for African Americans
(1% higher) than for whites (77.6 per 100,000 persons compared to 76.6 per 100,000 persons) for 2004-
2008. CRC mortality rates were 25% greater for African Americans than for whites (32.0 per 100,000
persons compared to 25.5 per 100,000 persons) for the same time period.
By gender, ENC CRC incidence rates were higher for males (38% higher) than for females (63.3
per 100,000 persons compared to 43.1 per 100,000 persons) for 2004-2008. CRC mortality rates among
males compared to females were 47% greater (23.2 per 100,000 compared to 15.8 per 100,000 persons)
for 2004-2008.[6]
Source: NC Central Cancer Registry, 2011
CRC Female Breast Cervical
Whites 25.5 38.4 3.7
Blacks 32.0 56.6 7.1
0
10
20
30
40
50
60
Rat
e p
er
10
0,0
00
pe
rso
ns
Exhibit 7. Cancer Crude Mortality Rate, Eastern North Carolina (29 counties), by Race, 2004-2008
Source: NC Central Cancer Registry, 2011
17
Female Breast Cancer
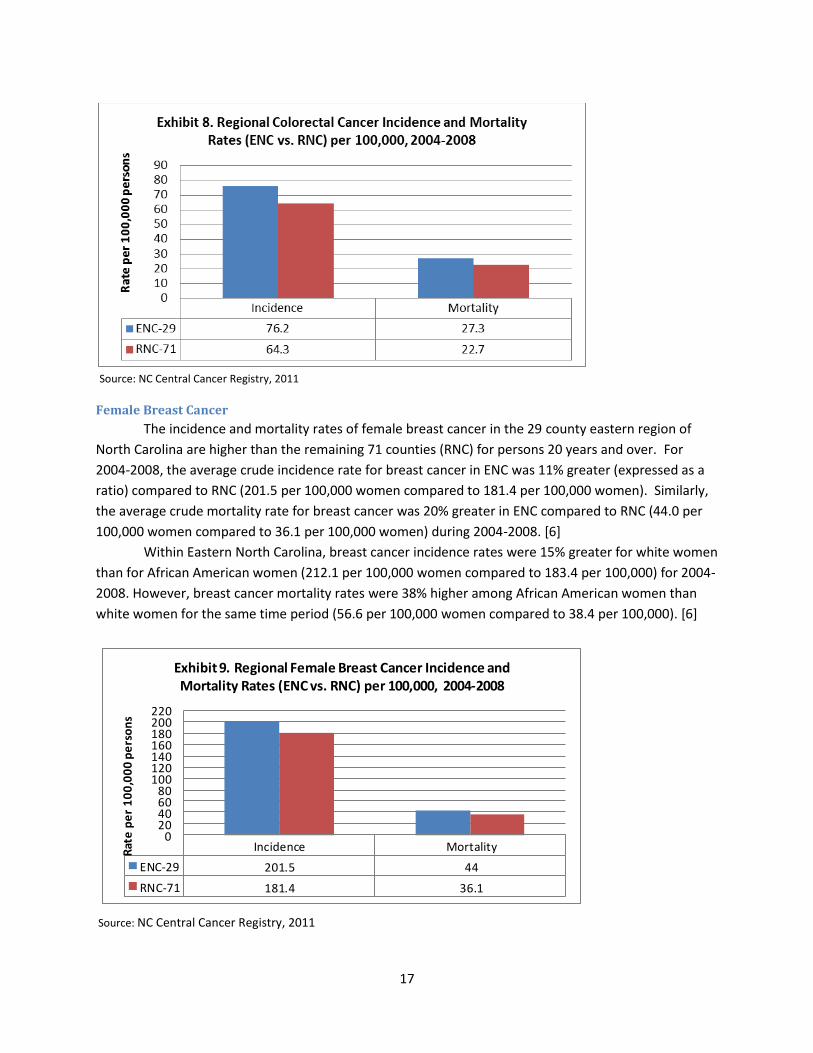
The incidence and mortality rates of female breast cancer in the 29 county eastern region of
North Carolina are higher than the remaining 71 counties (RNC) for persons 20 years and over. For
2004-2008, the average crude incidence rate for breast cancer in ENC was 11% greater (expressed as a
ratio) compared to RNC (201.5 per 100,000 women compared to 181.4 per 100,000 women). Similarly,
the average crude mortality rate for breast cancer was 20% greater in ENC compared to RNC (44.0 per
100,000 women compared to 36.1 per 100,000 women) during 2004-2008. [6]
Within Eastern North Carolina, breast cancer incidence rates were 15% greater for white women
than for African American women (212.1 per 100,000 women compared to 183.4 per 100,000) for 2004-
2008. However, breast cancer mortality rates were 38% higher among African American women than
white women for the same time period (56.6 per 100,000 women compared to 38.4 per 100,000). [6]
Incidence Mortality
ENC-29 201.5 44
RNC-71 181.4 36.1
020406080
100120140160180200220
Rat
e p
er
10
0,0
00
pe
rso
ns
Exhibit 9. Regional Female Breast Cancer Incidence and Mortality Rates (ENC vs. RNC) per 100,000, 2004-2008
Source: NC Central Cancer Registry, 2011
Source: NC Central Cancer Registry, 2011

18
Cervix Uteri Cancer
The incidence and mortality rates of cervical cancer in 29 county eastern region of North
Carolina are higher than the remaining 71 counties (RNC) for women 20 years and over. For 2004-2008,
the average crude incidence rate for cervical cancer in ENC was 15% greater (expressed as a ratio)
compared to RNC (12.6 per 100,000 women compared to 10.8 per 100,000 women). Similarly, the
average crude mortality rate for cervical cancer was 37% greater in ENC compared to RNC (4.8 per
100,000 women compared to 3.3 per 100,000 women) during 2004-2008.[6]
Within Eastern North Carolina, cervical cancer incidence rates were 17% higher (expressed as a
ratio) for African American women than for white women (14.0 per 100,000 women compared to 11.8
per 100,000 women) for 2004-2008. Cervical cancer mortality rates were almost 2-times greater among
African American women than white women for the same time period (7.1 per 100,000 women
compared to 3.7 per 100,000 women).[6]
Source: NC Central Cancer Registry, 2011

19
Cancer Risk Factors Risk factors for cancer include obesity, regular alcohol consumption, and exposure to active and
passive tobacco exposure. BRFSS, a population-based, national telephone survey conducted by the CDC,
found that persons in ENC were more obese (31% vs 28%) and had a higher prevalence of diabetes (11%
vs 9%) than persons in the rest of North Carolina. Eastern North Carolina residents were less likely to
have consumed alcohol in the past 30 days (39% vs 45%) and never smoked tobacco products (52% vs
54%). Almost 56% of ENC female residents reported a mammogram within the past two years. Eastern
North Carolina residents were less likely than the rest of North Carolina to have received a blood stool
test for CRC screening (43% vs. 50%).[7]
Source: Behavioral Risk Factor Surveillance System, Survey Results, 2005-2009
Never Smoked(a)
Obese (b) Alcohol (c) Diabetes (d)Mammogram
(e)CRC screening
(f)
ENC 29 52% 31% 39% 11% 56% 43%
RNC 71 54% 28% 45% 9% 54% 50%
NC 54% 28% 44% 9% 55% 49%
0%
10%
20%
30%
40%
50%
60%
Pe
rce
nt
Exhibit 11. Adult respondents, Behavioral Risk Factor Surveillance System, 2005-2009
a Never smoked, 2005-2009 b Percent obese, 2005-2009 c During the past 30 days, have you had at least one drink of any alcoholic beverage such as beer, wine, a malt beverage, or liquor?, 2005-
2009 d Even told by doctor to have diabetes, 2005-2009 e Mammogram in last two years, woman any age, 2006, 2008 f Colorectal Cancer Screening (Age 50+), A blood stool test is a test that may use a special kit at home to determine whether the stool
contains blood. Have you ever had this test using a home kit?, 2006, 2008.

20
Eastern North Carolina Profile References
1. North Carolina Department of Commerce. (2011, Dec 6). AccessNC/EDIS. NC counties with
employment and wages by industry and by occupation. Personal communication, Tammy Lester.
2. U.S. Census Bureau. (2011, Nov 23). State and County Quickfacts: North Carolina. Retrieved from
http://quickfacts.census.gov/qfd/states/37/37013.html
3. County Health Rankings (2009). (2011, Dec 7). North Carolina County Health Rankings. Retrieved
from http://www.countyhealthrankings.org.
4. North Carolina Department of Commerce. (2011, Dec 7). 2011 County Tier Designations. Retrieved
from http://www.nccommerce.com/research-publications/incentive-reports/2011-county-tier-
designations.
5. U.S. Census Bureau. (2011, Dec 7). Profile of General Population and Housing Characteristics: 2010,
2010 Demographic Profile Data. Retrieved from
http://factfinder2.census.gov/faces/tableservices/jsf/pages/productview.xhtml?src=bkmk.
6. NC Central Cancer Registry, 2011. (2011, Dec 13). 2004-2008 Age-Specific Cancer Incidence and
Mortality Rates for Males and Females for Eastern North Carolina and NC71 (Non-Eastern NC); Rates
Per 100,000.
7. NC DHHS, State Center for Health Statistics, Behavioral Risk Factor Surveillance System, Survey
Results, 2005-2009, http://www.schs.state.nc.us/SCHS/brfss/results.html, accessed October 17,
2011.

21
County-Level
Profiles

22
White68%
African American
26%
Other6%
Exhibit 12. Beaufort County by Race, 2010
BEAUFORT COUNTY
Social and Economic Indicators
Based on number of persons employed, in 2011 the largest industry in Beaufort County was
manufacturing.[1] The median household income (2009) was $38,829 for a family of four, compared to
$43,754 statewide. The percentage of persons living below the poverty level in 2009 was 19%,
compared to 16% statewide.[2] Unemployment (civilian, not in labor force, 2009) in Beaufort County
was 11%, compared to 10.6% statewide. The estimated high school graduation rate (2010) was 75%,
based on the cohort of ninth graders that graduated from high school in four years, compared to 78% in
North Carolina. In 2007, the adult uninsured population (≥ age 18-64) was 19%, compared to 21%
statewide. Forty-seven physicians provided primary care in Beaufort County (2008), which was a
population to primary care physician ratio of 986 to 1.[3]
Demographics:
Based on data from the 2010 U.S. Census, Beaufort
County had a total population of 47,759 with 58
persons per square mile. The county population was
22% children (<18), 60% adults ages 18-64, and 18%
elders. Beaufort County was 26% African American
(AA) (22% AA statewide) and 68% white (69% white
statewide). Latinos/Hispanics (any race) comprised
7% of the population in Beaufort County (8%
statewide) (Exhibit 12). The overall county
population was 52% female and 48% male in
2010.[2]
Cancer Surveillance
Colon and Rectal Cancers (CRC)
Incidence
In Beaufort County, the CRC age-adjusted incidence rate for 2004-2008 was 62.1 (95% CI 53.4, 71.9) per
100,000, which was higher than the overall statewide CRC rate of 46.8 (95% CI 46.1, 47.4). On average,
there were 38 new cases of CRC diagnosed in Beaufort County, and 4,720 new cases across the state for
2004-2008. The CRC age-adjusted incidence rates per 100,000 were 67.8 (95% CI 54.0, 84.2) for males
and 59.1 (95% CI 47.8, 72.6) for females. By race, the CRC age-adjusted incidence rates per 100,000
were 62.2 (95% CI 52.1, 73.9) for whites, and 62.0 (95% CI 45.2, 83.3) for African Americans.[4]
Mortality
In Beaufort County, CRC mortality rates for 2003-2007 were stable and were similar to the North
Carolina rates (all races, both sexes). The CRC mortality rate (2003-2007) was 16.0 (95% CI 11.7, 21.6)
per 100,000, which was lower than the overall statewide CRC mortality rate of 17.3 (95% CI 17.0, 17.7).
Beaufort County did not meet the Healthy People 2010 mortality rate goal (13.9 CRC deaths per
Source: U.S. Census Bureau, State and County
Quickfacts: North Carolina

23
100,000).[4][5] The average annual percentage change in death rates declined at -0.1 percent (95% CI -
1.3, 1.1) for 2003-2007. The CRC mortality rates (2003-2007) by gender were 14.6 (95% CI 9.2, 22.2) for
females and 19.9 (95% CI 12.2, 30.5) for males per 100,000. The CRC mortality rate (2003-2007) per
100,000 by race was 16.2 (95% CI 11.3, 22.9) for whites, and the rate for African Americans was
suppressed due to small numbers of deaths.[4]
Female Breast
Incidence
In Beaufort County, the breast cancer (female, invasive) age-adjusted incidence rate for 2004-2008 was
124.8 (95% CI 107.7, 144.2) per 100,000, which was higher than the overall statewide breast cancer rate
of 123.3 (95% CI 121.9-124.7). On average, there were 41 new cases of invasive female breast cancer
diagnosed in Beaufort County and 6,189 new cases across the state for 2004-2008. Female breast
cancer age-adjusted incidence rates were 123.4 (95% CI 103.9, 146.0) for whites, and 125.5 (95% CI
92.0, 167.5) for African Americans.[4]
Mortality
In Beaufort County, female breast cancer mortality rates for 2003-2007 increased and were similar to
the North Carolina rates (all races). The female breast cancer mortality rate (2003-2007) was 25.8 (95%
CI 18.4, 35.4) per 100,000, which was higher than the overall statewide female breast cancer mortality
rate of 24.8. Beaufort County did not meet the Healthy People 2010 mortality rate goal (22.3 female
breast cancer deaths per 100,000).[4][5] The average annual percentage change in death rates was
stable with no percentage change in the county rate over the five year interval (95% CI -1.5, 1.4) for
2003-2007. The female breast cancer mortality rate (2003-2007) per 100,000 by race was 24.4 (95% CI
16.3, 35.7) for whites, and the rate for African Americans was suppressed due to small numbers of
deaths.[4]
*Age-Adjusted
Source: NCI, State Cancer Profiles
Exhibit 13. Colorectal Cancer Incidence and Mortality Rates per 100,000 persons
Beaufort County North Carolina
CRC Incidence (2004-2008)* 62.1 46.8
CRC Mortality (2003-2007) 16.0 17.3
*Age-Adjusted
Source: NCI, State Cancer Profiles
Exhibit 14. Invasive Female Breast Cancer Incidence and Mortality Rates per 100,000 persons
Beaufort County North Carolina
Breast Cancer Incidence (2004-2008)* 124.8 123.3
Breast Cancer Mortality (2003-2007) 25.8 24.8

24
Cervix
See Eastern North Carolina rates. Beaufort County data for cervical cancer incidence and mortality rates
were suppressed due to small numbers.
Risk Factors and Screening
Beaufort county residents reported higher obesity, smoking, and obesity prevalence than NC statewide. Mammography coverage was higher than statewide in Medicare-enrolled women.
0%
10%
20%
30%
40%
50%
60%
70%
80%
% Smoker % Obese % Alcohol % Diabetes % Mammogram
Exhibit 15. Adult Respondents, Beaufort County, North Carolina Behavioral Risk Factor Surveillance System, 2003-2009
Beaufort County North Carolina
Source: County Health Rankings, North Carolina County Health Rankings; North Carolina Data Health Explorer; NC DHHS, SCHS, BRFSS Survey Results, 2005-2009 Exhibit 16. Adult Respondents, Beaufort County, North Carolina Behavioral Risk Factor Surveillance System, 2003-2009
a. 2003-2009, Percent of adults that report smoking ≥100 cigarettes and currently smoking [3]
b. 2008, Percent of adults that report a BMI ≥30 [3]
c. 2003-2009, Percent of the adult population that reports either binge drinking, defined as consuming more than 4 (women) or 5 (men)
alcoholic beverages on a single occasion in the past 30 days, or heavy drinking, defined as drinking more than 1 (women) or 2 (men) drinks per
day on average [3]
d. 2005-2009, Percent, Has a doctor told you that you have diabetes, Yes response. [6][7]
e. 2006-2007, Percent of female Medicare enrollees age 67-69 that had at least one mammogram over a two-year period [3]
Source: County Health Rankings, North Carolina County Health Rankings; North Carolina Data Health Explorer; NC DHHS, SCHS, BRFSS Survey Results, 2005-2009
Factor
% Smokera % Obeseb % Alcoholc % Diabetesd % Mammograme
Beaufort County 23% 34% 8% 12% 71%
North Carolina 22% 29% 12% 9% 67%

25
White 35%African
American 63%
Other 2%
Exhibit 17. Bertie County by Race, 2010
BERTIE COUNTY
Social and Economic Indicators
Based on number of persons employed, in 2011 the largest industry in Bertie County was
manufacturing.[1] The median household income (2009) was $29,693 for a family of four, compared to
$43,754 statewide. The percentage of persons living below the poverty level in 2009 was 24%,
compared to 16% statewide.[2] Unemployment (civilian, not in labor force, 2009) in Bertie County was
11%, compared to 10.6% statewide. The estimated high school graduation rate (2010) was 74%, based
on the cohort of ninth graders that graduated from high school in four years, compared to 78% in North
Carolina. In 2007, the adult uninsured population (≥ age 18-64) was 18%, compared to 21% statewide.
Nine physicians provided primary care in Bertie County (2008), which was a population to primary care
physician ratio of 2,163 to 1.[3]
Demographics
Based on data from the 2010 U.S. Census,
Bertie County had a total population of
21,282 with 30 persons per square mile.
The county population was 21% children
(<18), 62% adults ages 18-64, and 17%
elders. Bertie County was 63% African
American (AA) (22% AA statewide) and 35%
white (69% white statewide).
Latinos/Hispanics (any race) comprised 1%
of the population in Bertie County (8%
statewide) (Exhibit 17). The overall county
population was 51% female and 49%
male.[2]
Cancer Surveillance
Colon and Rectal Cancers (CRC)
Incidence
In Bertie County, the CRC age-adjusted incidence rate for 2004-2008 was 66.4 (95% CI 52.4, 83.1) per
100,000, which was higher than the overall statewide CRC rate of 46.8 (95% CI 46.1, 47.4). On average,
there were 16 new cases of CRC diagnosed in Bertie County, and 4,720 new cases across the state for
2004-2008. The CRC age-adjusted incidence rates per 100,000 were 62.5 (95% CI 42.8, 88.7) for males
and 68.8 (95% CI 50.0, 93.0) for females. By race, the CRC age-adjusted incidence rates per 100,000
were 49.4 (95% CI 32.6, 73.7) for whites, and 77.5 (95% CI 57.5, 102.4) for African Americans.[4]
Mortality
In Bertie County, CRC mortality rates for 2003-2007 were stable and similar to the North Carolina rates
(all races, both sexes). The CRC mortality rate (2003-2007) was 26.5 (95% CI 17.9, 37.9) per 100,000,
Source: U.S. Census Bureau, State and County
Quickfacts: North Carolina
26
which was higher than the overall statewide CRC mortality rate of 17.3 (95% CI 17.0, 17.7). Bertie
County did not meet the Healthy People 2010 mortality rate goal (13.9 CRC deaths per 100,000).[4][5]
The average annual percentage change in death rates increased at 0.2 percent (95% CI, 1.1, 1.6) for
2003-2007. The CRC mortality rate (2003-2007) by gender was 27.1 (95% CI 16.1, 43.5) for females and
the rate for males was suppressed due to small numbers of deaths. The CRC mortality rate (2003-2007)
per 100,000 by race was suppressed for whites due to a small number of deaths, and the rate for African
Americans was 25.3 (95% CI 14.4, 41.3).[4]
Female Breast
Incidence
In Bertie County, the breast cancer (female, invasive) age-adjusted incidence rate for 2004-2008 was
127.0 (95% CI 100.9, 158.2) per 100,000, which was higher than the overall statewide breast cancer rate
of 123.3 (95% CI 121.9-124.7). On average, there were 17 new cases of invasive female breast cancer
diagnosed in Bertie County and 6,189 new cases across the state for 2004-2008. Female breast cancer
age-adjusted incidence rates were 109.4 (95% CI 72.1, 162.3) for whites, and 142.4 (95% CI 106.9, 186.6)
for African Americans.[4]
Mortality
In Bertie County, female breast cancer mortality rates for 2003-2007 increased and were similar to the
North Carolina rates (all races). The female breast cancer mortality rate (2003-2007) was 37.4 (95% CI
24.0, 56.0) per 100,000, which was higher than the overall statewide female breast cancer mortality rate
of 24.8. Bertie County did not meet the Healthy People 2010 mortality rate goal (22.3 female breast
cancer deaths per 100,000).[4][5] The average annual percentage change in death rates increased at 0.3
percent (95% CI -1.5, 2.1) for 2003-2007. The female breast cancer mortality rate (2003-2007) per
100,000 by race was suppressed for whites due to small numbers of deaths, and the rate for African
Americans was 40.9 per 100,000 (95% CI 23.2, 67.3).[4]
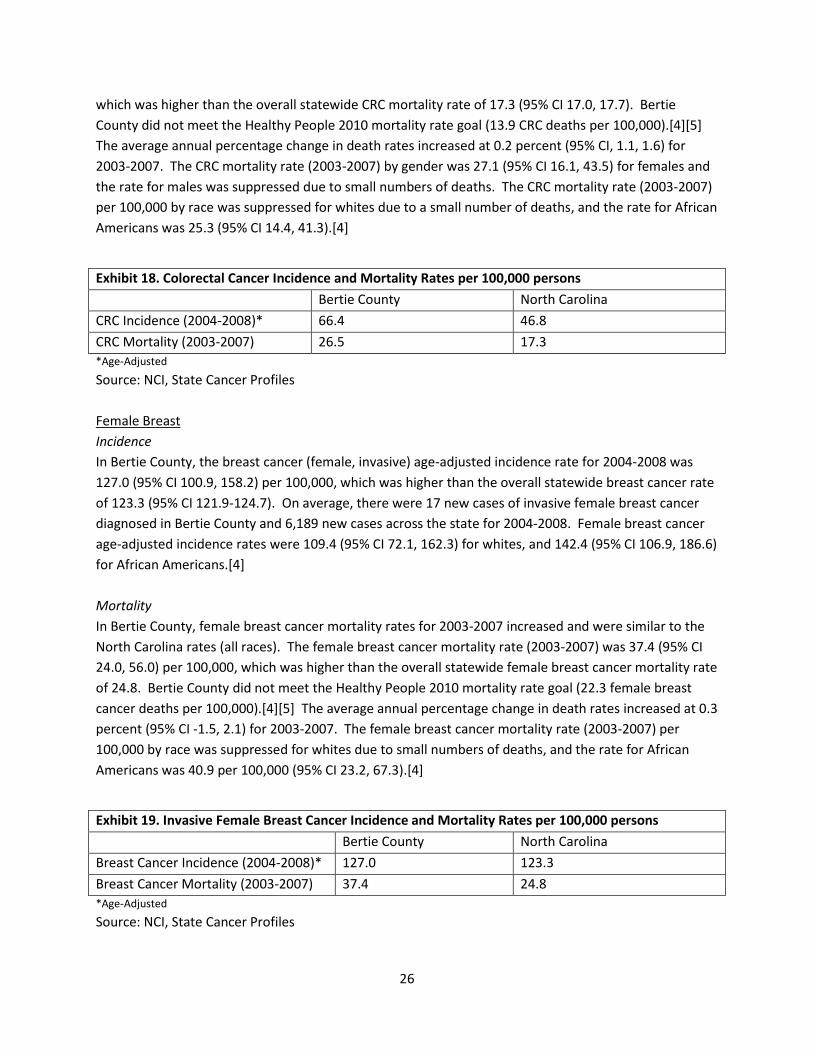
Exhibit 18. Colorectal Cancer Incidence and Mortality Rates per 100,000 persons
Bertie County North Carolina
CRC Incidence (2004-2008)* 66.4 46.8
CRC Mortality (2003-2007) 26.5 17.3
*Age-Adjusted
Source: NCI, State Cancer Profiles
Exhibit 19. Invasive Female Breast Cancer Incidence and Mortality Rates per 100,000 persons
Bertie County North Carolina
Breast Cancer Incidence (2004-2008)* 127.0 123.3
Breast Cancer Mortality (2003-2007) 37.4 24.8
*Age-Adjusted
Source: NCI, State Cancer Profiles

27
Cervix
See Eastern North Carolina rates. Bertie County data for cervical cancer incidence and mortality rates were suppressed due to small numbers. Risk Factors and Screening Bertie county residents were more obese with more diabetics compared to NC statewide. Medicare eligible Medicare-enrolled women had higher mammography prevalence than statewide.
*Data were not available for alcohol behavioral factor at the county level. Source: County Health Rankings, North Carolina County Health Rankings; North Carolina Data Health Explorer; NC DHHS, SCHS, BRFSS Survey Results, 2005-2009 Exhibit 21. Adult Respondents, Bertie County, North Carolina Behavioral Risk Factor Surveillance System, 2003-2009
a. 2003-2009, Percent of adults that report smoking ≥100 cigarettes and currently smoking [3]
b. 2008, Percent of adults that report a BMI ≥30 [3]
c. 2003-2009, Percent of the adult population that reports either binge drinking, defined as consuming more than 4 (women) or 5 (men)
alcoholic beverages on a single occasion in the past 30 days, or heavy drinking, defined as drinking more than 1 (women) or 2 (men) drinks per
day on average [3]
d. 2005-2009, Percent, Has a doctor told you that you have diabetes, Yes response. [6][7]
e. 2006-2007, Percent of female Medicare enrollees age 67-69 that had at least one mammogram over a two-year period [3]
*Data unavailable
Source: County Health Rankings, North Carolina County Health Rankings; North Carolina Data Health Explorer; NC DHHS, SCHS, BRFSS Survey Results, 2005-2009
Factor
% Smokera % Obeseb % Alcoholc % Diabetesd % Mammograme
Bertie County 17% 36% * 13% 72%
North Carolina 22% 29% 12% 9% 67%
0%
10%
20%
30%
40%
50%
60%
70%
80%
% Smoker % Obese % Diabetes % Mammogram
Exhibit 20. Adult Respondents, Bertie County, North Carolina Behavioral Risk Factor Surveillance System, 2003-2009
Bertie County North Carolina

28
White82%
African American
13%
Other5%
Exhibit 22. Camden County by Race, 2010
CAMDEN COUNTY
Social and Economic Indicators
Based on number of persons employed, in 2011 the largest industry in Camden County was retail
trade.[1] The median household income (2009) was $55,985 for a family of four, compared to $43,754
statewide. The percentage of persons living below the poverty level in 2009 was 9%, compared to 16%
statewide.[2] Unemployment (civilian, not in labor force, 2009) in Camden County was 8%, compared to
10.6% statewide. The estimated high school graduation rate (2010) was 80%, based on the cohort of
ninth graders that graduated from high school in four years, compared to 78% in North Carolina. In
2007, the adult uninsured population (≥ age 18-64) was 26%, compared to 21% statewide. Two
physicians provided primary care in Camden County (2008), which was a population to primary care
physician ratio of 4,816 to 1.[3]
Demographics
Based on data from the 2010 U.S. Census, Camden
County had a total population of 9,980 with 42
persons per square mile. The county population was
26% children (<18), 61% adults ages 18-64, and 13%
elders. Camden County was 13% African American
(AA) (22% AA statewide) and 82% white (69% white
statewide). Latinos/Hispanics (any race) comprised
2% of the population in Camden County (8%
statewide) (Exhibit 22). The overall county
population was 50% female and 50% male.[2]
Cancer Surveillance
Colon and Rectal Cancers (CRC)
Incidence
In Camden County, the CRC age-adjusted incidence rate for 2004-2008 was 55.6 (95% CI 35.7, 82.6) per
100,000, which was higher than the overall statewide CRC rate of 46.8 (95% CI 46.1, 47.4). On average,
there were 5 new cases of CRC diagnosed in Camden County, and 4,720 new cases across the state for
2004-2008. The CRC age-adjusted incidence rates per 100,000 for males and females were suppressed
due to small numbers of cases. By race, the CRC age-adjusted incidence rate per 100,000 was 48.6 (95%
CI 28.6, 77.5) for whites, and the rate for African Americans was suppressed due to small numbers of
cases.[4]
Source: U.S. Census Bureau, State and County
Quickfacts: North Carolina

29
Mortality
In Camden County, CRC mortality rates (2003-2007) per 100,000 were suppressed due to small numbers
of deaths.[4]
Female Breast
Incidence
In Camden County, the breast cancer (female, invasive) age-adjusted incidence rate for 2004-2008 was
161.6 (95% CI 116.3, 219.7) per 100,000, which was lower than the overall statewide breast cancer rate
of 123.3 (95% CI 121.9-124.7). On average, there were 8 new cases of invasive female breast cancer
diagnosed in Camden County and 6,189 new cases across the state for 2004-2008. The female breast
cancer age-adjusted incidence rate was 178.1 (95% CI 124.9, 247.2) for whites, and the rate for African
Americans was suppressed due to small numbers of cases.[4]
Mortality
In Camden County, female breast cancer mortality rates (2003-2007) per 100,000 were suppressed due
to small numbers of deaths.[4]
Cervix
See Eastern North Carolina rates. Camden County data for cervical cancer incidence and mortality rates
were suppressed due to small numbers.
Exhibit 23. Colorectal Cancer Incidence and Mortality Rates per 100,000 persons
Camden County North Carolina
CRC Incidence (2004-2008)* 55.6 46.8
CRC Mortality (2003-2007) ** 17.3
*Age-Adjusted
**Suppressed due to small numbers
Source: NCI, State Cancer Profiles
Exhibit 24. Invasive Female Breast Cancer Incidence and Mortality Rates per 100,000 persons
Camden County North Carolina
Breast Cancer Incidence (2004-2008)* 161.6 123.3
Breast Cancer Mortality (2003-2007) ** 24.8
*Age-Adjusted
**Suppressed due to small numbers
Source: NCI, State Cancer Profiles

30
Risk Factors and Screening
Camden county residents had a higher prevalence of obesity and diabetes compared to NC statewide,
but report less smoking.
0%
10%
20%
30%
40%
50%
60%
70%
80%
% Smoker % Obese % Diabetes % Mammogram
Exhibit 25. Adult Respondents, Camden County, North Carolina Behavioral Risk Factor Surveillance System, 2003-2009
Camden County North Carolina
*Data were not available for alcohol behavioral factor at the county level.
Source: County Health Rankings, North Carolina County Health Rankings; North Carolina Data Health Explorer; NC DHHS, SCHS, BRFSS Survey Results, 2005-2009
Exhibit 26. Adult Respondents, Camden County, North Carolina Behavioral Risk Factor Surveillance System, 2003-2009
a. 2003-2009, Percent of adults that report smoking ≥100 cigarettes and currently smoking [3]
b. 2008, Percent of adults that report a BMI ≥30 [3]
c. 2003-2009, Percent of the adult population that reports either binge drinking, defined as consuming more than 4 (women) or 5 (men)
alcoholic beverages on a single occasion in the past 30 days, or heavy drinking, defined as drinking more than 1 (women) or 2 (men) drinks per
day on average [3]
d. 2005-2009, Percent, Has a doctor told you that you have diabetes, Yes response. [6][7]
e. 2006-2007, Percent of female Medicare enrollees age 67-69 that had at least one mammogram over a two-year period [3]
*Data unavailable
Source: County Health Rankings, North Carolina County Health Rankings; North Carolina Data Health Explorer; NC DHHS, SCHS, BRFSS Survey Results, 2005-2009
Factor
% Smokera % Obeseb % Alcoholc
% Diabetesd
% Mammograme
Camden County 19% 32% * 10% 66%
North Carolina 22% 29% 12% 9% 67%

31
White
89%
African American
6%
Other5%
Exhibit 27. Carteret County by Race, 2010
CARTERET COUNTY
Social and Economic Indicators
Based on number of persons employed, in 2011 the largest industry in Carteret County was retail
trade.[1] The median household income (2009) was $44,036 for a family of four, compared to $43,754
statewide. The percentage of persons living below the poverty level in 2009 was 13%, compared to 16%
statewide.[2] Unemployment (civilian, not in labor force, 2009) in Carteret County was 8%, compared to
10.6% statewide. The estimated high school graduation rate (2010) was 79%, based on the cohort of
ninth graders that graduated from high school in four years, compared to 78% in North Carolina. In
2007, the adult uninsured population (≥ age 18-64) was 22%, compared to 21% statewide. Seventy-
three physicians provided primary care in Carteret County (2008), which was a population to primary
care physician ratio of 871 to 1.[3]
Demographics
Based on data from the 2010 U.S. Census, Carteret
County had a total population of 66,469 with 131
persons per square mile. The county population was
19% children (<18), 62% adults ages 18-64, and 19%
elders. Carteret County was 6% African American
(AA) (22% AA statewide) and 89% white (69% white
statewide). Latinos/Hispanics (any race) comprised
3% of the population in Carteret County (8%
statewide) (Exhibit 27). The overall county
population was 51% female and 49% male.[2]
Cancer Surveillance
Colon and Rectal Cancers (CRC)
Incidence
In Carteret County, the CRC age-adjusted incidence rate for 2004-2008 was 45.9 (95% CI 39.6, 52.9) per
100,000, which was lower than the overall statewide CRC rate of 46.8 (95% CI 46.1, 47.4). On average,
there were 40 new cases of CRC diagnosed in Carteret County, and 4,720 new cases across the state for
2004-2008. The CRC age-adjusted incidence rates per 100,000 were 58.0 (95% CI 47.6, 70.2) for males
and 35.2 (95% CI 28.0, 44.0) for females. By race, the CRC age-adjusted incidence rate per 100,000 was
45.0 (95% CI 38.7, 52.2) for whites, and the rate for African Americans was suppressed due to small
numbers of cases.[4]
Mortality
In Carteret County, CRC mortality rates for 2003-2007 declined and were similar to the North Carolina
rates (all races, both sexes). The CRC mortality rate (2003-2007) was 18.3 (95% CI 14.4, 23.0) per
100,000, which was higher than the overall statewide CRC mortality rate of 17.3 (95% CI 17.0, 17.7).
Carteret County did not meet the Healthy People 2010 mortality rate goal (13.9 CRC deaths per
Source: U.S. Census Bureau, State and County
Quickfacts: North Carolina

32
100,000).[4][5] The average annual percentage change in death rates declined at -1.3 percent (95% CI -
2.4, -0.1) for 2003-2007. The CRC mortality rates (2003-2007) by gender were 14.9 (95% CI 10.3, 21.1)
for females and 22.1 (95% CI 15.7, 30.3) for males per 100,000. The CRC mortality rate (2003-2007) per
100,000 by race was 17.4 (95% CI 13.5, 22.2) for whites, and the rate for African Americans was
suppressed due to small numbers of deaths.[4]
Female Breast
Incidence
In Carteret County, the breast cancer (female, invasive) age-adjusted incidence rate for 2004-2008 was
129.0 (95% CI 114.0, 145.7) per 100,000, which was higher than the overall statewide breast cancer rate
of 123.3 (95% CI 121.9-124.7). On average, there were 57 new cases of invasive female breast cancer
diagnosed in Carteret County and 6,189 new cases across the state for 2004-2008. The female breast
cancer age-adjusted incidence rate was 131.7 (95% CI 116.0, 149.2) for whites, and the rate for African
Americans was suppressed due to small numbers of cases.[4]
Mortality
In Carteret County, female breast cancer mortality rates for 2003-2007 increased and were similar to the
North Carolina rates (all races). The female breast cancer mortality rate (2003-2007) was 24.6 (95% CI
18.4, 32.4) per 100,000, which was lower than the overall statewide female breast cancer mortality rate
of 24.8. Carteret County did not meet the Healthy People 2010 mortality rate goal (22.3 female breast
cancer deaths per 100,000).[4][5] The average annual percentage change in death rates declined at -0.9
percent (95% CI -2.1, 0.3) for 2003-2007. The female breast cancer mortality rate (2003-2007) per
100,000 was 23.7 (95% CI 17.5, 31.7) for whites, and the rate for African Americans was suppressed due
to small numbers of deaths.[4]
Cervix See Eastern North Carolina rates. Carteret County data for cervical cancer incidence and mortality rates were suppressed due to small numbers.
Exhibit 28. Colorectal Cancer Incidence and Mortality Rates per 100,000 persons
Carteret County North Carolina
CRC Incidence (2004-2008)* 45.9 46.8
CRC Mortality (2003-2007) 18.3 17.3
*Age-Adjusted
Source: NCI, State Cancer Profiles
Exhibit 29. Invasive Female Breast Cancer Incidence and Mortality Rates per 100,000 persons
Carteret County North Carolina
Breast Cancer Incidence (2004-2008)* 129.0 123.3
Breast Cancer Mortality (2003-2007) 24.6 24.8 *Age-Adjusted
Source: NCI, State Cancer Profiles

33
Risk Factors and Screening Carteret County residents reported a higher prevalence of smoking and alcohol consumption compared
to NC statewide. Mammography completion was higher than statewide in medicare-eligible women.
0%
10%
20%
30%
40%
50%
60%
70%
80%
% Smoker % Obese % Alcohol % Diabetes % Mammogram
Exhibit 30. Adult Respondents, Carteret County, North Carolina Behavioral Risk Factor Surveillance System, 2003-2009
Carteret County North Carolina
Source: County Health Rankings, North Carolina County Health Rankings; North Carolina Data Health Explorer; NC DHHS, SCHS, BRFSS Survey Results, 2005-2009 Exhibit 31. Adult Respondents, Carteret County, North Carolina Behavioral Risk Factor Surveillance System, 2003-2009
a. 2003-2009, Percent of adults that report smoking ≥100 cigarettes and currently smoking [3]
b. 2008, Percent of adults that report a BMI ≥30 [3]
c. 2003-2009, Percent of the adult population that reports either binge drinking, defined as consuming more than 4 (women) or 5 (men)
alcoholic beverages on a single occasion in the past 30 days, or heavy drinking, defined as drinking more than 1 (women) or 2 (men) drinks per
day on average [3]
d. 2005-2009, Percent, Has a doctor told you that you have diabetes, Yes response. [6][7]
e. 2006-2007, Percent of female Medicare enrollees age 67-69 that had at least one mammogram over a two-year period [3]
Sources: County Health Rankings, North Carolina County Health Rankings; North Carolina Data Health Explorer; NC DHHS, SCHS, BRFSS Survey Results, 2005-2009
Factor
% Smokera % Obeseb % Alcoholc % Diabetesd % Mammograme
Carteret County 26% 29% 16% 9% 75%
North Carolina 22% 29% 12% 9% 67%

34
White62%
African American
34%
Other4%
Exhibit 32. Chowan County by Race, 2010
CHOWAN COUNTY
Social and Economic Indicators
Based on number of persons employed, in 2011 the largest industry in Chowan County was retail
trade.[1] The median household income (2009) was $35,944 for a family of four, compared to $43,754
statewide. The percentage of persons living below the poverty level in 2009 was 21%, compared to 16%
statewide.[2] Unemployment (civilian, not in labor force, 2009) in Chowan County was 11%, compared
to 10.6% statewide. The estimated high school graduation rate (2010) was 75%, based on the cohort of
ninth graders that graduated from high school in four years, compared to 78% in North Carolina. In
2007, the adult uninsured population (≥ age 18-64) was 19%, compared to 21% statewide. Twenty
physicians provided primary care in Chowan County (2008), which was a population to primary care
physician ratio of 734 to 1.[3]
Demographics
Based on data from the 2010 U.S. Census, Chowan
County had a total population of 14,793 with 86
persons per square mile. The county population
was 22% children (<18), 58% adults ages 18-64,
and 20% elders. Chowan County was 34% African
American (AA) (22% AA statewide) and 62% white
(69% white statewide). Latinos/Hispanics (any
race) comprised 3% of the population in Chowan
County (8% statewide) (Exhibit 32). The overall
county population was 53% female and 47%
male.[2]
Cancer Surveillance
Colon and Rectal Cancers (CRC)
Incidence
In Chowan County, the CRC age-adjusted incidence rate for 2004-2008 was 51.7 (95% CI 38.6, 68.4) per
100,000, which was higher than the overall statewide CRC rate of 46.8 (95% CI 46.1, 47.4). On average,
there were 11 new cases of CRC diagnosed in Chowan County, and 4,720 new cases across the state for
2004-2008. The CRC age-adjusted incidence rates per 100,000 were 63.6 (95% CI 40.8, 95.2) for males
and 44.6 (95% CI 29.4, 66.3) for females. By race, the CRC age-adjusted incidence rates per 100,000
were 45.6 (95% CI 31.0, 65.9) for whites, and 65.6 (95% CI 39.4, 103.2) for African Americans.[4]
Mortality
In Chowan County, CRC mortality rates for 2003-2007 were stable and were similar to the North
Carolina rates (all races, both sexes). The CRC mortality rate (2003-2007) was 22.1 (95% CI 14.0, 33.8)
per 100,000 which was higher than the overall statewide CRC mortality rate of 17.3 (95% CI 17.0, 17.7).
Chowan County did not meet the Healthy People 2010 morality rate goal (13.9 CRC deaths per
Source: U.S. Census Bureau, State and County
Quickfacts: North Carolina
35
100,000).[4][5] The average annual percentage change in death rates declined at -1.4 percent (95% CI -
3.2, 0.4) for 2003-2007. The CRC mortality rates by gender were suppressed for males and females due
to small numbers of deaths. The CRC mortality rate (2003-2007) per 100,000 by race was 21.0 (95% CI
12.0, 35.8) for whites, and the rate for African Americans was suppressed due to small numbers of
deaths.[4]
Female Breast
Incidence
In Chowan County, the breast cancer (female, invasive) age-adjusted incidence rate for 2004-2008 was
109.7 (95% CI 83.0, 143.2) per 100,000, which was lower than the overall statewide breast cancer rate of
123.3 (95% CI 121.9-124.7). On average, there were 12 new cases of invasive female breast cancer
diagnosed in Chowan County and 6,189 new cases across the state for 2004-2008. The female breast
cancer age-adjusted incidence rate was 117.4 (95% CI 84.6, 161.2) for whites, and the rate for African
Americans was suppressed due to small numbers of cases.[4]
Mortality
In Chowan County, female breast cancer mortality rates (2003-2007) per 100,000 were suppressed due
to small numbers of deaths.[4]
Cervix
See Eastern North Carolina rates. Chowan County data for cervical cancer incidence and mortality rates
were suppressed due to small numbers.
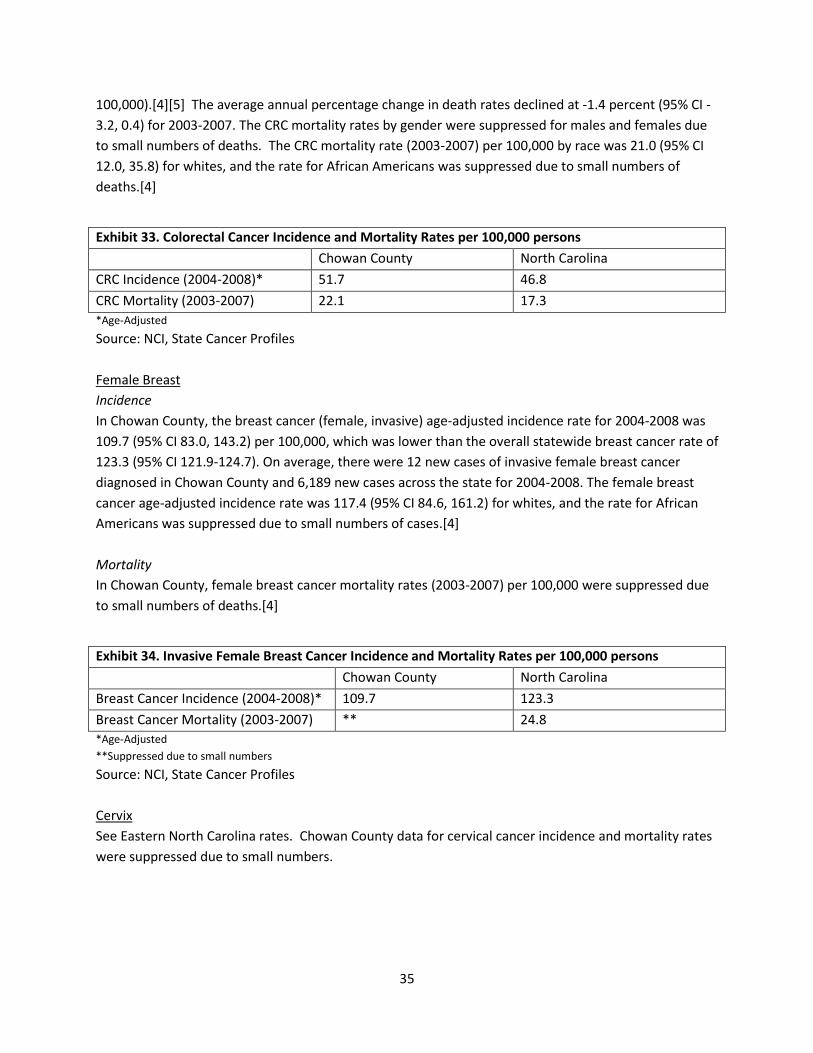
Exhibit 33. Colorectal Cancer Incidence and Mortality Rates per 100,000 persons
Chowan County North Carolina
CRC Incidence (2004-2008)* 51.7 46.8
CRC Mortality (2003-2007) 22.1 17.3
*Age-Adjusted
Source: NCI, State Cancer Profiles
Exhibit 34. Invasive Female Breast Cancer Incidence and Mortality Rates per 100,000 persons
Chowan County North Carolina
Breast Cancer Incidence (2004-2008)* 109.7 123.3
Breast Cancer Mortality (2003-2007) ** 24.8
*Age-Adjusted
**Suppressed due to small numbers
Source: NCI, State Cancer Profiles

36
Risk Factors and Screening
Chowan County residents had a higher prevalence of smoking and mammography coverage (in
Medicare-enrolled women) compared to NC statewide.
Sources: County Health Rankings, North Carolina County Health Rankings; North Carolina Data Health Explorer; NC DHHS, SCHS, BRFSS Survey Results, 2005-2009 Exhibit 36. Adult Respondents, Chowan County, North Carolina Behavioral Risk Factor Surveillance System, 2003-2009
a. 2003-2009, Percent of adults that report smoking ≥100 cigarettes and currently smoking [3]
b. 2008, Percent of adults that report a BMI ≥30 [3]
c. 2003-2009, Percent of the adult population that reports either binge drinking, defined as consuming more than 4 (women) or 5 (men)
alcoholic beverages on a single occasion in the past 30 days, or heavy drinking, defined as drinking more than 1 (women) or 2 (men) drinks per
day on average [3]
d. 2005-2009, Percent, Has a doctor told you that you have diabetes, Yes response. [6][7]
e. 2006-2007, Percent of female Medicare enrollees age 67-69 that had at least one mammogram over a two-year period [3]
Sources: County Health Rankings, North Carolina County Health Rankings; North Carolina Data Health Explorer; NC DHHS, SCHS, BRFSS Survey Results, 2005-2009
Factor
% Smokera % Obeseb % Alcoholc % Diabetesd % Mammograme
Chowan County 28% 30% 10% 9% 78%
North Carolina 22% 29% 12% 9% 67%
0%
10%
20%
30%
40%
50%
60%
70%
80%
90%
% Smoker % Obese % Alcohol % Diabetes % Mammogram
Exhibit 35. Adult Respondents, Chowan County, North Carolina Behavioral Risk Factor Surveillance System, 2003-2009
Chowan County North Carolina

37
White70%
African American
22%
Other8%
Exhibit 37. Craven County by Race, 2010
CRAVEN COUNTY
Social and Economic Indicators
Based on number of persons employed, in 2011 the largest industry in Craven County was public
administration.[1] The median household income (2009) was $41,021 for a family of four, compared to
$43,754 statewide. The percentage of persons living below the poverty level in 2009 was 16%,
compared to 16% statewide.[2] Unemployment (civilian, not in labor force, 2009) in Craven County was
10%, compared to 10.6% statewide. The estimated high school graduation rate (2010) was 77%, based
on the cohort of ninth graders that graduated from high school in four years, compared to 78% in North
Carolina. In 2007, the adult uninsured population (≥ age 18-64) was 22%, compared to 21% statewide.
One-hundred and seven physicians provided primary care in Craven County (2008), which was a
population to primary care physician ratio of 910 to 1.[3]
Demographics
Based on data from the 2010 U.S. Census, Craven
County had a total population of 103,505 with 146
persons per square mile. The county population was
23% children (<18), 62% adults ages 18-64, and 15%
elders. Craven County was 22% African American
(AA) (22% AA statewide) and 70% white (69% white
statewide). Latinos/Hispanics (any race) comprised
6% of the population in Craven County (8%
statewide) (Exhibit 37). The overall county
population was 50% female and 50% male.[2]
Cancer Surveillance
Colon and Rectal Cancers (CRC)
Incidence
In Craven County, the CRC age-adjusted incidence rate through 2004-2008 was 49.1 (95% CI 43.4, 55.4)
per 100,000, which was higher than the overall statewide CRC rate of 46.8 (95% CI 46.1, 47.4). On
average, there were 54 new cases of CRC diagnosed in Craven County, and 4,720 new cases across the
state for 2004-2008. The CRC age-adjusted incidence rates per 100,000 were 61.9 (95% CI 52.4, 72.7) for
males and 38.7 (95% CI 31.9, 46.6) for females. By race, the CRC age-adjusted incidence rates per
100,000 were 50.5 (95% CI 44.0, 57.9) for whites, and 48.4 (95% CI 35.6, 64.2) for African Americans.[4]
Mortality
In Craven County, CRC mortality rates for 2003-2007 were stable and were similar to the North Carolina
rates (all races, both sexes). The CRC mortality rate (2003-2007) was 20.6 (95% CI 16.8, 24.9) per
100,000 which was higher than the overall statewide CRC mortality rate of 17.3 (95% CI 17.0, 17.7).
Craven County did not meet the Healthy People 2010 mortality rate goal (13.9 CRC deaths per
100,000).[4][5] The average annual percentage change in death rates declined at -0.3 percent (95% CI -
Source: U.S. Census Bureau, State and County
Quickfacts: North Carolina

38
1.3-0.6) for 2003-2007. The CRC mortality rates (2003-2007) by gender were 14.9 (95% CI 10.8, 20.2) for
females and 28.0 (95% CI 21.4, 35.9) for males per 100,000. CRC mortality rates (2003-2007) per
100,000 by race were 19.3 (95% CI 15.3, 24.2) for whites, and 26.0 (95% CI 16.7, 38.3) for African
Americans.[4]
Female Breast
Incidence
In Craven County, the breast cancer (female, invasive) age-adjusted incidence rate for 2004-2008 was
125.7 (95% CI 112.9, 139.5) per 100,000, which was higher than the overall statewide breast cancer rate
of 123.3 (95% CI 121.9-124.7). On average, there were 74 new cases of invasive female breast cancer
diagnosed in Craven County and 6,189 new cases across the state for 2004-2008. Female breast cancer
age-adjusted incidence rates were 135.6 (95% CI 120.4, 152.3) for whites, and 88.7 (95% CI 66.7, 115.7)
for African Americans.[4]
Mortality
In Craven County, female breast cancer mortality rates for 2003-2007 were similar to the North Carolina
rates (all races). The female breast cancer mortality rate (2003-2007) was 25.8 (95% CI 20.2, 32.6) per
100,000, which was higher than the overall statewide female breast cancer mortality rate of 24.8.
Craven County did not meet the Healthy People 2010 mortality rate goal (22.3 female breast cancer
deaths per 100,000).[4][5] The average annual percentage change in death rates declined at -0.5
percent (95% CI -1.4, 0.4) for 2003-2007. Female breast cancer mortality rates (2003-2007) per 100,000
by race were 20.0 (95% CI 14.3, 27.2) for whites, and 48.2 (95% CI 32.4, 68.9) for African Americans.[4]
Cervix
See Eastern North Carolina rates. Craven County data for cervical cancer incidence and mortality rates
were suppressed due to small numbers.
Exhibit 38. Colorectal Cancer Incidence and Mortality Rates per 100,000 persons
Craven County North Carolina
CRC Incidence (2004-2008)* 49.1 46.8
CRC Mortality (2003-2007) 20.6 17.3
*Age-Adjusted
Source: NCI, State Cancer Profiles
Exhibit 39. Invasive Female Breast Cancer Incidence and Mortality Rates per 100,000 persons
Craven County North Carolina
Breast Cancer Incidence (2004-2008)* 125.7 123.3
Breast Cancer Mortality (2003-2007) 25.8 24.8
*Age-Adjusted
Source: NCI, State Cancer Profiles

39
Risk Factors and Screening
Craven County residents had a higher prevalence of obesity compared to NC statewide, but report less
smoking and alcohol consumption. Mammography coverage in Medicare-enrolled women is higher than
statewide.
0%
10%
20%
30%
40%
50%
60%
70%
80%
90%
% Smoker % Obese % Alcohol % Diabetes % Mammogram
Exhibit 40. Adult Respondents, Craven County, North Carolina Behavioral Risk Factor Surveillance System, 2003-2009
Craven County North Carolina
Sources: County Health Rankings, North Carolina County Health Rankings; North Carolina Data Health Explorer; NC DHHS, SCHS, BRFSS Survey Results, 2005-2009
Exhibit 41. Adult Respondents, Craven County, North Carolina Behavioral Risk Factor Surveillance System, 2003-2009
a. 2003-2009, Percent of adults that report smoking ≥100 cigarettes and currently smoking [3]
b. 2008, Percent of adults that report a BMI ≥30 [3]
c. 2003-2009, Percent of the adult population that reports either binge drinking, defined as consuming more than 4 (women) or 5 (men)
alcoholic beverages on a single occasion in the past 30 days, or heavy drinking, defined as drinking more than 1 (women) or 2 (men) drinks per
day on average [3]
d. 2005-2009, Percent, Has a doctor told you that you have diabetes, Yes response. [6][7]
e. 2006-2007, Percent of female Medicare enrollees age 67-69 that had at least one mammogram over a two-year period [3]
Sources: County Health Rankings, North Carolina County Health Rankings; North Carolina Data Health Explorer; NC DHHS, SCHS, BRFSS Survey Results, 2005-2009
Factor
% Smokera % Obeseb % Alcoholc % Diabetesd % Mammograme
Craven County 20% 30% 10% 8% 81%
North Carolina 22% 29% 12% 9% 67%
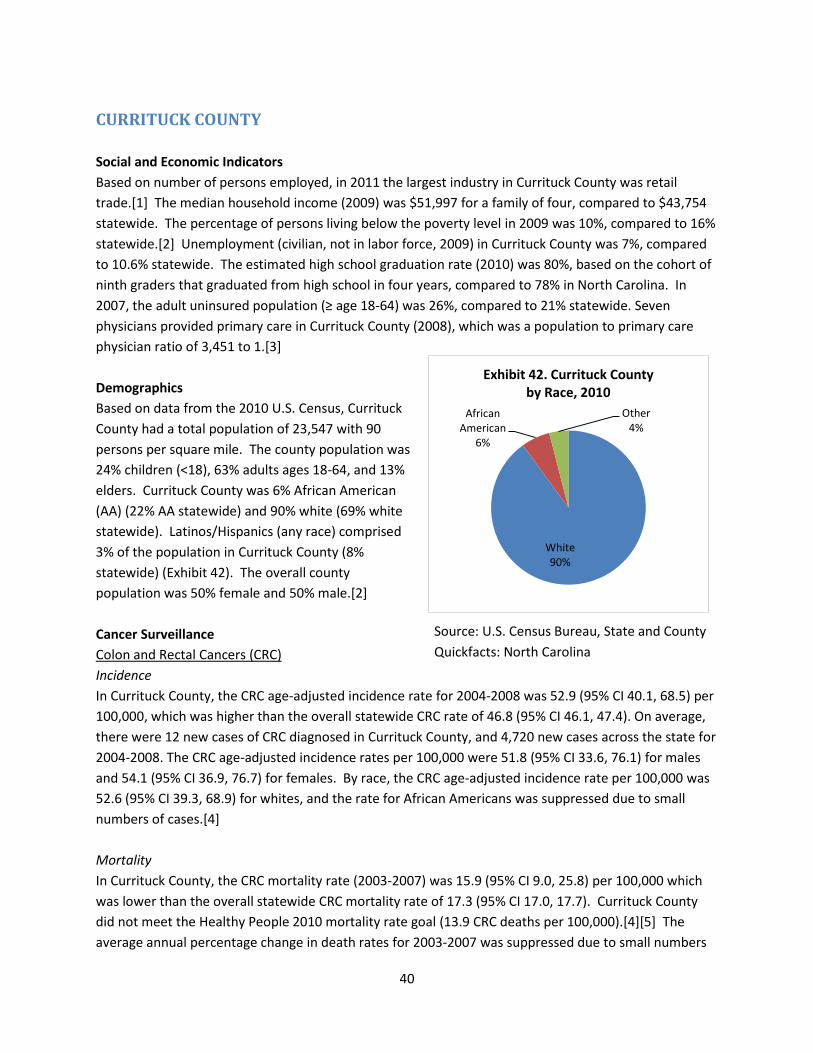
40
White90%
African American
6%
Other4%
Exhibit 42. Currituck County by Race, 2010
CURRITUCK COUNTY
Social and Economic Indicators
Based on number of persons employed, in 2011 the largest industry in Currituck County was retail
trade.[1] The median household income (2009) was $51,997 for a family of four, compared to $43,754
statewide. The percentage of persons living below the poverty level in 2009 was 10%, compared to 16%
statewide.[2] Unemployment (civilian, not in labor force, 2009) in Currituck County was 7%, compared
to 10.6% statewide. The estimated high school graduation rate (2010) was 80%, based on the cohort of
ninth graders that graduated from high school in four years, compared to 78% in North Carolina. In
2007, the adult uninsured population (≥ age 18-64) was 26%, compared to 21% statewide. Seven
physicians provided primary care in Currituck County (2008), which was a population to primary care
physician ratio of 3,451 to 1.[3]
Demographics
Based on data from the 2010 U.S. Census, Currituck
County had a total population of 23,547 with 90
persons per square mile. The county population was
24% children (<18), 63% adults ages 18-64, and 13%
elders. Currituck County was 6% African American
(AA) (22% AA statewide) and 90% white (69% white
statewide). Latinos/Hispanics (any race) comprised
3% of the population in Currituck County (8%
statewide) (Exhibit 42). The overall county
population was 50% female and 50% male.[2]
Cancer Surveillance
Colon and Rectal Cancers (CRC)
Incidence
In Currituck County, the CRC age-adjusted incidence rate for 2004-2008 was 52.9 (95% CI 40.1, 68.5) per
100,000, which was higher than the overall statewide CRC rate of 46.8 (95% CI 46.1, 47.4). On average,
there were 12 new cases of CRC diagnosed in Currituck County, and 4,720 new cases across the state for
2004-2008. The CRC age-adjusted incidence rates per 100,000 were 51.8 (95% CI 33.6, 76.1) for males
and 54.1 (95% CI 36.9, 76.7) for females. By race, the CRC age-adjusted incidence rate per 100,000 was
52.6 (95% CI 39.3, 68.9) for whites, and the rate for African Americans was suppressed due to small
numbers of cases.[4]
Mortality
In Currituck County, the CRC mortality rate (2003-2007) was 15.9 (95% CI 9.0, 25.8) per 100,000 which
was lower than the overall statewide CRC mortality rate of 17.3 (95% CI 17.0, 17.7). Currituck County
did not meet the Healthy People 2010 mortality rate goal (13.9 CRC deaths per 100,000).[4][5] The
average annual percentage change in death rates for 2003-2007 was suppressed due to small numbers
Source: U.S. Census Bureau, State and County
Quickfacts: North Carolina

41
of deaths. The CRC mortality rates (2003-2007) per 100,000 by gender were also suppressed due to
small numbers of deaths. The CRC mortality rate (2003-2007) per 100,000 by race was 17.4 (95% CI 9.9,
28.3) for whites, and the rate for African Americans was suppressed due to small numbers of deaths.[4]
Female Breast
Incidence
In Currituck County, the breast cancer (female, invasive) age-adjusted incidence rate for 2004-2008 was
99.7 (95% CI 76.7, 127.7) per 100,000, which was lower than the overall statewide breast cancer rate of
123.3 (95% CI 121.9-124.7). On average, there were 13 new cases of invasive female breast cancer
diagnosed in Currituck County and 6,189 new cases across the state for 2004-2008. The female breast
cancer age-adjusted incidence rate was 106.1 (95% CI 81.2, 136.6) for whites, and the rate for African
Americans was suppressed due to small numbers of cases.[4]
Mortality
In Currituck County, female breast cancer mortality rates (2003-2007) per 100,000 were suppressed due
to small numbers of deaths.[4]
Cervix
See Eastern North Carolina rates. Currituck County data for cervical cancer incidence and mortality rates
were suppressed due to small numbers.
Exhibit 43. Colorectal Cancer Incidence and Mortality Rates per 100,000 persons
Currituck County North Carolina
CRC Incidence (2004-2008)* 52.9 46.8
CRC Mortality (2003-2007) 15.9 17.3
*Age-Adjusted
**Suppressed due to small numbers
Source: NCI, State Cancer Profiles
Exhibit 44. Invasive Female Breast Cancer Incidence and Mortality Rates per 100,000 persons
Currituck County North Carolina
Breast Cancer Incidence (2004-2008)* 99.7 123.3
Breast Cancer Mortality (2003-2007) ** 24.8
*Age-Adjusted
**Suppressed due to small numbers
Source: NCI, State Cancer Profiles

42
Risk Factors and Screening
Currituck County residents had a higher prevalence of smoking and alcohol consumption compared to
NC statewide, but report less diabetes.
0%
10%
20%
30%
40%
50%
60%
70%
80%
% Smoker % Obese % Alcohol % Diabetes % Mammogram
Exhibit 45. Adult Respondents, Currituck County, North Carolina Behavioral Risk Factor Surveillance System, 2003-2009
Currituck County North Carolina
Sources: County Health Rankings, North Carolina County Health Rankings; North Carolina Data Health Explorer; NC DHHS, SCHS, BRFSS Survey Results, 2005-2009
Exhibit 46. Adult Respondents, Currituck County, North Carolina Behavioral Risk Factor Surveillance System, 2003-2009
a. 2003-2009, Percent of adults that report smoking ≥100 cigarettes and currently smoking [3]
b. 2008, Percent of adults that report a BMI ≥30 [3]
c. 2003-2009, Percent of the adult population that reports either binge drinking, defined as consuming more than 4 (women) or 5 (men)
alcoholic beverages on a single occasion in the past 30 days, or heavy drinking, defined as drinking more than 1 (women) or 2 (men) drinks per
day on average [3]
d. 2005-2009, Percent, Has a doctor told you that you have diabetes, Yes response. [6][7]
e. 2006-2007, Percent of female Medicare enrollees age 67-69 that had at least one mammogram over a two-year period [3]
Sources: County Health Rankings, North Carolina County Health Rankings; North Carolina Data Health Explorer; NC DHHS, SCHS, BRFSS Survey Results, 2005-2009
Factor
% Smokera % Obeseb % Alcoholc % Diabetesd % Mammograme
Currituck County 34% 29% 23% 7% 66%
North Carolina 22% 29% 12% 9% 67%

43
White92%
African American
3%
Other5%
Exhibit 47. Dare County by Race, 2010
DARE COUNTY
Social and Economic Indicators
Based on number of persons employed, in 2011 the largest industry in Dare County was retail trade.[1]
The median household income (2009) was $49,565 for a family of four, compared to $43,754 statewide.
The percentage of persons living below the poverty level in 2009 was 11%, compared to 16%
statewide.[2] Unemployment (civilian, not in labor force, 2009) in Dare County was 10%, compared to
10.6% statewide. The estimated high school graduation rate (2010) was 92%, based on the cohort of
ninth graders that graduated from high school in four years, compared to 78% in North Carolina. In
2007, the adult uninsured population (≥ age 18-64) was 27%, compared to 21% statewide. Thirty-two
physicians provided primary care in Dare County (2008), which was a population to primary care
physician ratio of 1,064 to 1.[3]
Demographics
Based on data from the 2010 U.S. Census, Dare
County had a total population of 33,920 with 89
persons per square mile. The county population was
20% children (<18), 65% adults ages 18-64, and 15%
elders. Dare County was 3% African American (AA)
(22% AA statewide) and 92% white (69% white
statewide). Latinos/Hispanics (any race) comprised
7% of the population in Dare County (8% statewide)
(Exhibit 47). The overall county population was 50%
female and 50% male.[2]
Cancer Surveillance
Colon and Rectal Cancers (CRC)
Incidence
In Dare County, the CRC age-adjusted incidence rate for 2004-2008 was 38.9 (95% CI 30.7, 48.7) per
100,000, which was lower than the overall statewide CRC rate of 46.8 (95% CI 46.1, 47.4). On average,
there were 17 new cases of CRC diagnosed in Dare County, and 4,720 new cases across the state for
2004-2008. The CRC age-adjusted incidence rates per 100,000 were 41.3 (95% CI 29.6, 56.4) for males
and 36.4 (95% CI 25.6, 50.5) for females. By race, the CRC age-adjusted incidence rate per 100,000 was
39.0 (95% CI 30.7, 49.0) for whites, and the rate for African Americans was suppressed due to small
numbers of cases.[4]
Mortality
In Dare County, CRC mortality rates for 2003-2007 declined and were similar to the North Carolina rates
(all races, both sexes). The CRC mortality rate (2003-2007) was 12.3 (95% CI 7.8, 18.7) per 100,000
which was lower than the overall statewide CRC mortality rate of 17.3 (95% CI 17.0, 17.7). Dare County
met the Healthy People 2010 mortality rate goal (13.9 CRC deaths per 100,000).[4][5] The average
Source: U.S. Census Bureau, State and County
Quickfacts: North Carolina

44
annual percentage change in death rates declined at -2.8 percent (95% CI -4.4, -1.2) for 2003-2007. The
CRC mortality rates by gender were suppressed due to small numbers of deaths. The CRC mortality rate
(2003-2007) per 100,000 by race was 12.1 (95% CI 7.6, 18.5) for whites, and the rate for African
Americans was suppressed due to small numbers of deaths.[4]
Female Breast
Incidence
In Dare County, the breast cancer (female, invasive) age-adjusted incidence rate for 2004-2008 was
133.9 (95% CI 112.5, 158.4) per 100,000, which was higher than the overall statewide breast cancer rate
of 123.3 (95% CI 121.9-124.7). On average, there were 29 new cases of invasive female breast cancer
diagnosed in Dare County and 6,189 new cases across the state for 2004-2008. The female breast cancer
age-adjusted incidence rate was 133.1 (95% CI 111.5, 158.0) for whites, and the rate for African
Americans was suppressed due to small numbers of cases.[4]
Mortality
In Dare County, the female breast cancer mortality rate (2003-2007) was 28.3 (95% CI 19.0, 41.1) per
100,000, which was higher than the overall statewide female breast cancer mortality rate of 24.8. Dare
County did not meet the Healthy People 2010 mortality rate goal (22.3 female breast cancer deaths per
100,000).[4][5] The average annual percentage change in death rates for 2003-2007 was suppressed
due to small numbers of deaths. The female breast cancer mortality rate (2003-2007) per 100,000 by
race was 28.1 (95% CI 18.7, 41.0) for whites, and the rate for African Americans was suppressed due to
small numbers of deaths.[4]
Cervix See Eastern North Carolina rates. Dare County data for cervical cancer incidence and mortality rates were suppressed due to small numbers.
Exhibit 48. Colorectal Cancer Incidence and Mortality Rates per 100,000 persons
Dare County North Carolina
CRC Incidence (2004-2008)* 38.9 46.8
CRC Mortality (2003-2007) 12.3 17.3 *Age-Adjusted
Source: NCI, State Cancer Profiles
Exhibit 49. Invasive Female Breast Cancer Incidence and Mortality Rates per 100,000 persons
Dare County North Carolina
Breast Cancer Incidence (2004-2008)* 133.9 123.3
Breast Cancer Mortality (2003-2007) 28.3 24.8 *Age-Adjusted
Source: NCI, State Cancer Profiles

45
Risk Factors and Screening
Dare County residents have a higher prevalence of smoking and alcohol consumption compared to NC
statewide, but lower diabetes.
0%
10%
20%
30%
40%
50%
60%
70%
80%
% Smoker % Obese % Alcohol % Diabetes % Mammogram
Exhibit 50. Adult Respondents, Dare County, North Carolina Behavioral Risk Factor Surveillance System, 2003-2009
Dare County North Carolina
Sources: County Health Rankings, North Carolina County Health Rankings; North Carolina Data Health Explorer; NC DHHS, SCHS, BRFSS Survey Results, 2005-2009
Exhibit 51. Adult Respondents, Dare County, North Carolina Behavioral Risk Factor Surveillance System, 2003-2009
a. 2003-2009, Percent of adults that report smoking ≥100 cigarettes and currently smoking [3]
b. 2008, Percent of adults that report a BMI ≥30 [3]
c. 2003-2009, Percent of the adult population that reports either binge drinking, defined as consuming more than 4 (women) or 5 (men)
alcoholic beverages on a single occasion in the past 30 days, or heavy drinking, defined as drinking more than 1 (women) or 2 (men) drinks per
day on average [3]
d. 2005-2009, Percent, Has a doctor told you that you have diabetes, Yes response. [6][7]
e. 2006-2007, Percent of female Medicare enrollees age 67-69 that had at least one mammogram over a two-year period [3]
Sources: County Health Rankings, North Carolina County Health Rankings; North Carolina Data Health Explorer; NC DHHS, SCHS, BRFSS Survey Results, 2005-2009
Factor
% Smokera % Obeseb % Alcoholc % Diabetesd % Mammograme
Dare County 34% 25% 28% 5% 65%
North Carolina 22% 29% 12% 9% 67%

46
White57%
African American
25%
Other18%
Exhibit 52. Duplin County by Race, 2010
DUPLIN COUNTY
Social and Economic Indicators
Based on number of persons employed, in 2011 the largest industry in Duplin County was
manufacturing.[1] The median household income (2009) was $31,026 for a family of four, compared to
$43,754 statewide. The percentage of persons living below the poverty level in 2009 was 24%,
compared to 16% statewide.[2] Unemployment (civilian, not in labor force, 2009) in Duplin County was
9%, compared to 10.6% statewide. The estimated high school graduation rate (2010) was 72%, based
on the cohort of ninth graders that graduated from high school in four years, compared to 78% in North
Carolina. In 2007 the adult uninsured population (≥ age 18-64) was 27%, compared to 21% statewide.
Twenty-two physicians provided primary care in Duplin County (2008), which was a population to
primary care physician ratio of 2,410 to 1.[3]
Demographics
Based on data from the 2010 U.S. Census, Duplin
County had a total population of 58,505 with 72
persons per square mile. The county population
was 25% children (<18), 61% adults ages 18-64, and
14% elders. Duplin County was 25% African
American (AA) (22% AA statewide) and 57% white
(69% white statewide). Latinos/Hispanics (any
race) comprised 21% of the population in Duplin
County (8% statewide) (Exhibit 52). The overall
county population was 51% female and 49%
male.[2]
Cancer Surveillance
Colon and Rectal Cancers (CRC)
Incidence
In Duplin County, the CRC age-adjusted incidence rate for 2004-2008 was 35.1 (95% CI 28.4, 42.8) per
100,000, which was lower than the overall statewide CRC rate of 46.8 (95% CI 46.1, 47.4). On average,
there were 19 new cases of CRC diagnosed in Duplin County, and 4,720 new cases across the state for
2004-2008. The CRC age-adjusted incidence rates per 100,000 were 44.5 (95% CI 33.3, 58.3) for males
and 26.5 (95% CI 19.0, 36.0) for females. By race, the CRC age-adjusted incidence rates per 100,000
were 35.3 (95% CI 27.4, 44.8) for whites, and 33.6 (95% CI 22.1, 49.3) for African Americans.[4]
Mortality
In Duplin County, CRC mortality rates for 2003-2007 declined and were similar to the North Carolina
rates (all races, both sexes). The CRC mortality rate (2003-2007) was 13.9 (95% CI 9.8, 19.2) per 100,000
which was lower than the overall statewide CRC mortality rate of 17.3 (95% CI 17.0, 17.7). Duplin
County met the Healthy People 2010 mortality rate goal (13.9 CRC deaths per 100,000).[4][5] The
Source: U.S. Census Bureau, State and County
Quickfacts: North Carolina

47
average annual percentage change in death rates declined at -7.2 percent (95% CI -13.0, -1.0) for 2003-
2007. The CRC mortality rate (2003-2007) by gender was suppressed for females due to small numbers
of deaths, and the rate for males was 19.5 (95% CI 12.1, 29.6) per 100,000. The CRC mortality rate
(2003-2007) per 100,000 by race was 12.2 (95% CI 7.7, 18.4) for whites, and the rate for African
Americans was suppressed due to small numbers of deaths.[4]
Female Breast
Incidence
In Duplin County, the breast cancer (female, invasive) age-adjusted incidence rate for 2004-2008 was
95.0 (95% CI 79.8, 112.4) per 100,000, which was lower than the overall statewide breast cancer rate of
123.3 (95% CI 121.9, 124.7). On average, there were 28 new cases of invasive female breast cancer
diagnosed in Duplin County and 6,189 new cases across the state for 2004-2008. Female breast cancer
age-adjusted incidence rates were 93.1 (95% CI 75.2, 114.1) for whites, and 100.7 (95% CI 73.1, 135.7)
for African Americans.[4]
Mortality
In Duplin County, female breast cancer mortality rates for 2003-2007 increased and were similar to the
North Carolina rates (all races). The female breast cancer mortality rate (2003-2007) was 29.4 (95% CI
21.4, 39.6) per 100,000, which was higher than the overall statewide female breast cancer mortality rate
of 24.8. Duplin County did not meet the Healthy People 2010 mortality rate goal (22.3 female breast
cancer deaths per 100,000).[4][5] The average annual percentage change in death rates increased at 0.3
percent (95% CI -1.4, 0.4) for 2003-2007. Female breast cancer mortality rates (2003-2007) per 100,000
by race were 27.3 (95% CI 18.2, 39.5) for whites, and 34.4 (95% CI 19.4, 57.0) for African Americans.[4]
Cervix See Eastern North Carolina rates. Duplin County data for cervical cancer incidence and mortality rates were suppressed due to small numbers.
Exhibit 53. Colorectal Cancer Incidence and Mortality Rates per 100,000 persons
Duplin County North Carolina
CRC Incidence (2004-2008)* 35.1 46.8
CRC Mortality (2003-2007) 13.9 17.3
*Age-Adjusted
Source: NCI, State Cancer Profiles
Exhibit 54. Invasive Female Breast Cancer Incidence and Mortality Rates per 100,000 persons
Duplin County North Carolina
Breast Cancer Incidence (2004-2008)* 95.0 123.3
Breast Cancer Mortality (2003-2007) 29.4 24.8
*Age-Adjusted
Source: NCI, State Cancer Profiles

48
Risk Factors and Screening Duplin County residents had a higher prevalence of obesity and diabetes compared to NC statewide, but
report less smoking.
0%
10%
20%
30%
40%
50%
60%
70%
80%
% Smoker % Obese % Alcohol % Diabetes % Mammogram
Exhibit 55. Adult Respondents, Duplin County, North Carolina Behavioral Risk Factor Surveillance System, 2003-2009
Duplin County North Carolina
Sources: County Health Rankings, North Carolina County Health Rankings; North Carolina Data Health Explorer; NC DHHS, SCHS, BRFSS Survey Results, 2005-2009
Exhibit 56. Adult Respondents, Duplin County, North Carolina Behavioral Risk Factor Surveillance System, 2003-2009
a. 2003-2009, Percent of adults that report smoking ≥100 cigarettes and currently smoking [3]
b. 2008, Percent of adults that report a BMI ≥30 [3]
c. 2003-2009, Percent of the adult population that reports either binge drinking, defined as consuming more than 4 (women) or 5 (men)
alcoholic beverages on a single occasion in the past 30 days, or heavy drinking, defined as drinking more than 1 (women) or 2 (men) drinks per
day on average [3]
d. 2005-2009, Percent, Has a doctor told you that you have diabetes, Yes response. [6][7]
e. 2006-2007, Percent of female Medicare enrollees age 67-69 that had at least one mammogram over a two-year period [3]
Sources: County Health Rankings, North Carolina County Health Rankings; North Carolina Data Health Explorer; NC DHHS, SCHS, BRFSS Survey Results, 2005-2009
Factor
% Smokera % Obeseb % Alcoholc % Diabetesd % Mammograme
Duplin County 19% 32% 8% 14% 62%
North Carolina 22% 29% 12% 9% 67%

49
White39%African
American57%
Other4%
Exhibit 57. Edgecombe County by Race, 2010
EDGECOMBE COUNTY
Social and Economic Indicators
Based on number of persons employed, in 2011 the largest industry in Edgecombe County was
manufacturing.[1] The median household income (2009) was $32,172 for a family of four, compared to
$43,754 statewide. The percentage of persons living below the poverty level in 2009 was 26%,
compared to 16% statewide.[2] Unemployment (civilian, not in labor force, 2009) in Edgecombe County
was 16%, compared to 10.6% statewide. The estimated high school graduation rate (2010) was 78%,
based on the cohort of ninth graders that graduated from high school in four years, compared to 78% in
North Carolina. In 2007, the adult uninsured population (≥ age 18-64) was 14%, compared to 21%
statewide. Twenty-one physicians provided primary care in Edgecombe County (2008), which was a
population to primary care physician ratio of 2,495 to 1.[3]
Demographics
Based on data from the 2010 U.S. Census,
Edgecombe County had a total population of
56,552 with 112 persons per square mile. The
county population was 25% children (<18), 61%
adults ages 18-64, and 14% elders. Edgecombe
County was 57% African American (AA) (22% AA
statewide) and 39% white (69% white statewide).
Latinos/Hispanics (any race) comprised 4% of the
population in Edgecombe County (8% statewide)
(Exhibit 57). The overall county population was
54% female and 46% male.[2]
Cancer Surveillance
Colon and Rectal Cancers (CRC)
Incidence
In Edgecombe County, the CRC age-adjusted incidence rate for 2004-2008 was 61.5 (95% CI 52.6, 71.6)
per 100,000, which was higher than the overall statewide CRC rate of 46.8 (95% CI 46.1, 47.4). On
average, there were 35 new cases of CRC diagnosed in Edgecombe County, and 4,720 new cases across
the state for 2004-2008. The CRC age-adjusted incidence rates per 100,000 were 71.2 (95% CI 55.4, 89.8)
for males and 56.6 (95% CI 45.6, 69.5) for females. By race, the CRC age-adjusted incidence rates per
100,000 were 49.8 (95% CI 38.6, 63.4) for whites, and 73.3 (95% CI 59.5, 89.1) for African Americans.[4]
Mortality
In Edgecombe County, CRC mortality rates for 2003-2007 were stable and were similar to the North
Carolina rates (all races, both sexes). The CRC mortality rate (2003-2007) was 22.1 (95% CI 16.9, 28.5)
per 100,000 which was higher than the overall statewide CRC mortality rate of 17.3 (95% CI 17.0, 17.7).
Edgecombe County did not meet the Healthy People 2010 mortality rate goal (13.9 CRC deaths per
Source: U.S. Census Bureau, State and County
Quickfacts: North Carolina

50
100,000).[4][5] The average annual percentage change in death rates declined at -0.3 percent (95% CI -
1.3, 0.8) for 2003-2007. The CRC mortality rates (2003-2007) by gender were 17.0 (95% CI 11.3, 24.8) for
females and 30.6 (95% CI 20.5, 43.6) for males per 100,000. CRC mortality rates (2003-2007) per
100,000 by race were 22.3 (95% CI 15.0, 32.0) for whites, and 22.0 (95% CI 14.8, 31.4) for African
Americans.[4]
Female Breast
Incidence
In Edgecombe County, the breast cancer (female, invasive) age-adjusted incidence rate for 2004-2008
was 144.0 (95% CI 125.8, 164.2) per 100,000, which was higher than the overall statewide breast cancer
rate of 123.3 (95% CI 121.9-124.7). On average, there were 46 new cases of invasive female breast
cancer diagnosed in Edgecombe County and 6,189 new cases across the state for 2004-2008. Female
breast cancer age-adjusted incidence rates were 154.5 (95% CI 126.5, 187.2) for whites, and 136.8 (95%
CI 112.8, 164.4) for African Americans.[4]
Mortality
In Edgecombe County, female breast cancer mortality rates for 2003-2007 increased and were higher
than the North Carolina rates (all races). The female breast cancer mortality rate (2003-2007) was 35.6
(95% CI 27.0, 46.1) per 100,000, which was higher than the overall statewide female breast cancer
mortality rate of 24.8. Edgecombe County did not meet the Healthy People 2010 mortality rate goal
(22.3 female breast cancer deaths per 100,000).[4][5] The average annual percentage change in death
rates increased at 1.0 percent (95% CI -0.2, 2.2) for 2003-2007. Female breast cancer mortality rates
(2003-2007) per 100,000 by race were 34.7 (95% CI 22.6, 51.7) for whites, and 35.7 (95% CI 24.3, 50.7)
for African Americans.[4]
Exhibit 58. Colorectal Cancer Incidence and Mortality Rates per 100,000 persons
Edgecombe County North Carolina
CRC Incidence (2004-2008)* 61.5 46.8
CRC Mortality (2003-2007) 22.1 17.3
*Age-Adjusted
Source: NCI, State Cancer Profiles
Exhibit 59. Invasive Female Breast Cancer Incidence and Mortality Rates per 100,000 persons
Edgecombe County North Carolina
Breast Cancer Incidence (2004-2008)* 144.0 123.3
Breast Cancer Mortality (2003-2007) 35.6 24.8
*Age-Adjusted
Source: NCI, State Cancer Profiles

51
Cervix See Eastern North Carolina rates. Edgecombe County data for cervical cancer incidence and mortality rates were suppressed due to small numbers. Risk Factors and Screening Edgecombe County residents have a higher prevalence of smoking, obesity and diabetes compared to
NC statewide, but report less alcohol consumption. Mammography in Medicare-enrolled females is
higher than statewide.
0%
10%
20%
30%
40%
50%
60%
70%
80%
% Smoker % Obese % Alcohol % Diabetes % Mammogram
Exhibit 60. Adult Respondents, Edgecombe County, North Carolina Behavioral Risk Factor Surveillance System, 2003-2009
Edgecombe County North Carolina
Sources: County Health Rankings, North Carolina County Health Rankings; North Carolina Data Health Explorer; NC DHHS, SCHS, BRFSS Survey Results, 2005-2009
Exhibit 61. Adult Respondents, Edgecombe County, North Carolina Behavioral Risk Factor Surveillance System, 2005-2009
a. 2003-2009, Percent of adults that report smoking ≥100 cigarettes and currently smoking [3]
b. 2008, Percent of adults that report a BMI ≥30 [3]
c. 2003-2009, Percent of the adult population that reports either binge drinking, defined as consuming more than 4 (women) or 5 (men)
alcoholic beverages on a single occasion in the past 30 days, or heavy drinking, defined as drinking more than 1 (women) or 2 (men) drinks per
day on average [3]
d. 2005-2009, Percent, Has a doctor told you that you have diabetes, Yes response. [6][7]
e. 2006-2007, Percent of female Medicare enrollees age 67-69 that had at least one mammogram over a two-year period [3]
Sources: County Health Rankings, North Carolina County Health Rankings; North Carolina Data Health Explorer; NC DHHS, SCHS, BRFSS Survey Results, 2005-2009
Factor
% Smokera % Obeseb % Alcoholc % Diabetesd % Mammograme
Edgecombe County 28% 37% 9% 13% 71%
North Carolina 22% 29% 12% 9% 67%

52
White64%
African American
33%
Other3%
Exhibit 62. Gates County by Race, 2010
GATES COUNTY
Social and Economic Indicators
Based on number of persons employed, in 2011 the largest industry in Gates County was educational
services.[1] The median household income (2009) was $42,742 for a family of four, compared to
$43,754 statewide. The percentage of persons living below the poverty level in 2009 was 18%,
compared to 16% statewide.[2] Unemployment (civilian, not in labor force, 2009) in Gates County was
7%, compared to 10.6% statewide. The estimated high school graduation rate (2010) was 80%, based
on the cohort of ninth graders that graduated from high school in four years, compared to 78% in North
Carolina. In 2007, the adult uninsured population (≥ age 18-64) was 25%, compared to 21% statewide.
One physician provided primary care in Gates County (2008), which was a population to primary care
physician ratio of 11,746 to 1.[3]
Demographics
Based on data from the 2010 U.S. Census, Gates
County had a total population of 12,197 with 36
persons per square mile. The county population
was 24% children (<18), 61% adults ages 18-64, and
15% elders. Gates County was 33% African
American (AA) (22% AA statewide) and 64% white
(69% white statewide). Latinos/Hispanics (any race)
comprised 1% of the population in Gates County
(8% statewide) (Exhibit 62). The overall county
population was 51% female and 49% male.[2]
Cancer Surveillance
Colon and Rectal Cancers (CRC)
Incidence
In Gates County, the CRC age-adjusted incidence rate for 2004-2008 was 60.4 (95% CI 42.8, 83.1) per
100,000, which was higher than the overall statewide CRC rate of 46.8 (95% CI 46.1, 47.4). On average,
there were 8 new cases of CRC diagnosed in Gates County, and 4,720 new cases across the state for
2004-2008. The CRC age-adjusted incidence rates per 100,000 were 55.3 (95% CI 32.4, 89.1) for males
and 64.5 (95% CI 39.8, 99.5) for females. By race, the CRC age-adjusted incidence rate per 100,000 was
61.9 (95% CI 39.9, 92.4) for whites, and the rate for African Americans was suppressed due to small
numbers of cases.[4]
Source: U.S. Census Bureau, State and County
Quickfacts: North Carolina

53
Mortality
In Gates County, CRC mortality rates (2003-2007) per 100,000 were suppressed due to small numbers of
deaths.[4]
Female Breast
Incidence
In Gates County, the breast cancer (female, invasive) age-adjusted incidence rate for 2004-2008 was
173.4 (95% CI 132.3, 224.0) per 100,000, which was higher than the overall statewide breast cancer rate
of 123.3 (95% CI 121.9-124.7). On average, there were 12 new cases of invasive female breast cancer
diagnosed in Gates County and 6,189 new cases across the state for 2004-2008. Female breast cancer
age-adjusted incidence rates were 186.8 (95% CI 133.0, 256.7) for whites, and 157.5 (95% CI 97.3, 244.1)
for African Americans.[4]
Mortality
In Gates County, female breast cancer mortality rates (2003-2007) per 100,000 were suppressed due to
small numbers of deaths.[4]
Cervix
See Eastern North Carolina rates. Gates County data for cervical cancer incidence and mortality rates
were suppressed due to small numbers.
Exhibit 63. Colorectal Cancer Incidence and Mortality Rates per 100,000 persons
Gates County North Carolina
CRC Incidence (2004-2008)* 60.4 46.8
CRC Mortality (2003-2007) ** 17.3
*Age-Adjusted
**Suppressed due to small numbers
Source: NCI, State Cancer Profiles
Exhibit 64. Invasive Female Breast Cancer Incidence and Mortality Rates per 100,000 persons
Gates County North Carolina
Breast Cancer Incidence (2004-2008)* 173.4 123.3
Breast Cancer Mortality (2003-2007) ** 24.8
*Age-Adjusted
**Suppressed due to small numbers
Source: NCI, State Cancer Profiles

54
Risk Factors and Screening
Gates County residents have a higher prevalence of obesity and diabetes compared to NC statewide, but
report less smoking and alcohol consumption.
0%
10%
20%
30%
40%
50%
60%
70%
80%
% Smoker % Obese % Alcohol % Diabetes % Mammogram
Exhibit 65. Adult Respondents, Gates County, North Carolina Behavioral Risk Factor Surveillance System, 2003-2009
Gates County North Carolina
Sources: County Health Rankings, North Carolina County Health Rankings; North Carolina Data Health Explorer; NC DHHS, SCHS, BRFSS Survey Results, 2005-2009 Exhibit 66. Adult Respondents, Gates County, North Carolina Behavioral Risk Factor Surveillance System, 2005-2009
a. 2003-2009, Percent of adults that report smoking ≥100 cigarettes and currently smoking [3]
b. 2008, Percent of adults that report a BMI ≥30 [3]
c. 2003-2009, Percent of the adult population that reports either binge drinking, defined as consuming more than 4 (women) or 5 (men)
alcoholic beverages on a single occasion in the past 30 days, or heavy drinking, defined as drinking more than 1 (women) or 2 (men) drinks per
day on average [3]
d. 2005-2009, Percent, Has a doctor told you that you have diabetes, Yes response. [6][7]
e. 2006-2007, Percent of female Medicare enrollees age 67-69 that had at least one mammogram over a two-year period [3]
Sources: County Health Rankings, North Carolina County Health Rankings; North Carolina Data Health Explorer; NC DHHS, SCHS, BRFSS Survey Results, 2005-2009
Factor
% Smokera % Obeseb % Alcoholc % Diabetesd % Mammograme
Gates County 15% 34% 10% 18% 64%
North Carolina 22% 29% 12% 9% 67%

55
White51%
African American
37%
Other12%
Exhibit 67. Greene County by Race, 2010
GREENE COUNTY
Social and Economic Indicators
Based on number of persons employed, in 2011 the largest industry in Greene County was healthcare
and social assistance.[1] The median household income (2009) was $38,733 for a family of four,
compared to $43,754 statewide. The percentage of persons living below the poverty level in 2009 was
23%, compared to 16% statewide.[2] Unemployment (civilian, not in labor force, 2009) in Greene
County was 11%, compared to 10.6% statewide. The estimated high school graduation rate (2010) was
63%, based on the cohort of ninth graders that graduated from high school in four years, compared to
78% in North Carolina. In 2007, the adult uninsured population (≥ age 18-64) was 30%, compared to
21% statewide. Five physicians provided primary care in Greene County (2008), which was a population
to primary care physician ratio of 4,131 to 1.[3]
Demographics
Based on data from the 2010 U.S. Census, Greene
County had a total population of 21,362 with 80
persons per square mile. The county population was
23% children (<18), 64% adults ages 18-64, and 13%
elders. Greene County was 37% African American
(AA) (22% AA statewide) and 51% white (69% white
statewide). Latinos/Hispanics (any race) comprised
14% of the population in Greene County (8%
statewide) (Exhibit 67). The overall county
population was 46% female and 54% male.[2]
Cancer Surveillance
Colon and Rectal Cancers (CRC)
Incidence
In Greene County, the CRC age-adjusted incidence rate through 2004-2008 was 46.6 (95% CI 34.3, 62.0)
per 100,000, which was lower than the overall statewide CRC rate of 46.8 (95% CI 46.1, 47.4). On
average, there were 10 new cases of CRC diagnosed in Greene County, and 4,720 new cases across the
state for 2004-2008. The CRC age-adjusted incidence rates per 100,000 were 51.9 (95% CI 30.7, 81.4) for
males and 44.0 (95% CI 28.6, 65.3) for females. By race, the CRC age-adjusted incidence rates per
100,000 were 46.5 (95% CI 31.3, 66.7) for whites, and 46.7 (95% CI 27.4, 74.2) for African Americans.[4]
Mortality
In Greene County, the CRC mortality rate (2003-2007) was 28.3 (95% CI 18.6, 41.2) per 100,000 which
was higher than the overall statewide CRC mortality rate of 17.3 (95% CI 17.0, 17.7). Greene County did
not meet the Healthy People 2010 mortality rate goal (13.9 CRC deaths per 100,000).[4][5] The average
annual percentage change in death rates for 2003-2007 was suppressed due to small numbers of
deaths. The CRC mortality rate (2003-2007) by gender was 28.9 (95% CI 16.9-46.6) for females and the
Source: U.S. Census Bureau, State and County
Quickfacts: North Carolina

56
rate for males was suppressed due to the small number of deaths. The CRC mortality rate (2003-2007)
per 100,000 by race was 28.3 (95% CI 16.5, 45.5) for whites, and the rate for African Americans was
suppressed due to small numbers of deaths.[4]
Female Breast
Incidence
In Greene County, the breast cancer (female, invasive) age-adjusted incidence rate for 2004-2008 was
98.9 (95% CI 74.0, 129.9) per 100,000, which was lower than the overall statewide breast cancer rate of
123.3 (95% CI 121.9-124.7). On average, there were 11 new cases of invasive female breast cancer
diagnosed in Greene County and 6,189 new cases across the state for 2004-2008. Female breast cancer
age-adjusted incidence rates were 95.6 (95% CI 65.1, 135.9) for whites, and 109.2 (95% CI 67.3, 167.6)
for African Americans.[4]
Mortality
In Greene County, female breast cancer mortality rates (2003-2007) per 100,000 were suppressed due
to small numbers of deaths.[4]
Cervix See Eastern North Carolina rates. Greene County data for cervical cancer incidence and mortality rates were suppressed due to small numbers.
Exhibit 68. Colorectal Cancer Incidence and Mortality Rates per 100,000 persons
Greene County North Carolina
CRC Incidence (2004-2008)* 46.6 46.8
CRC Mortality (2003-2007) 28.3 17.3
*Age-Adjusted
Source: NCI, State Cancer Profiles
Exhibit 69. Invasive Female Breast Cancer Incidence and Mortality Rates per 100,000 persons
Greene County North Carolina
Breast Cancer Incidence (2004-2008)* 98.9 123.3
Breast Cancer Mortality (2003-2007) ** 24.8 *Age-Adjusted **Suppressed due to small numbers
Source: NCI, State Cancer Profiles

57
Risk Factors and Screening
Green County residents have a higher prevalence of obesity and diabetes compared to NC statewide,
but report less smoking and alcohol consumption.
0%
10%
20%
30%
40%
50%
60%
70%
80%
% Smoker % Obese % Alcohol % Diabetes %Mammogram
Exhibit 70. Adult Respondents, Greene County, North Carolina Behavioral Risk Factor Surveillance System, 2003-2009
Greene County North Carolina
Sources: County Health Rankings, North Carolina County Health Rankings; North Carolina Data Health Explorer; NC DHHS, SCHS, BRFSS Survey Results, 2005-2009
Exhibit 71. Adult Respondents, Greene County, North Carolina Behavioral Risk Factor Surveillance System, 2003-2009
a. 2003-2009, Percent of adults that report smoking ≥100 cigarettes and currently smoking [3]
b. 2008, Percent of adults that report a BMI ≥30 [3]
c. 2003-2009, Percent of the adult population that reports either binge drinking, defined as consuming more than 4 (women) or 5 (men)
alcoholic beverages on a single occasion in the past 30 days, or heavy drinking, defined as drinking more than 1 (women) or 2 (men) drinks per
day on average [3]
d. 2005-2009, Percent, Has a doctor told you that you have diabetes, Yes response. [6][7]
e. 2006-2007, Percent of female Medicare enrollees age 67-69 that had at least one mammogram over a two-year period [3]
Sources: County Health Rankings, North Carolina County Health Rankings; North Carolina Data Health Explorer; NC DHHS, SCHS, BRFSS Survey Results, 2005-2009
Factor
% Smokera % Obeseb % Alcoholc % Diabetesd % Mammograme
Greene County 11% 32% 4% 28% 52%
North Carolina 22% 29% 12% 9% 67%

58
White40%African
American53%
Other7%
Exhibit 72. Halifax County by Race, 2010
HALIFAX COUNTY
Social and Economic Indicators
Based on number of persons employed, in 2011 the largest industry in Halifax County was retail
trade.[1] The median household income (2009) was $29,966 for a family of four, compared to $43,754
statewide. The percentage of persons living below the poverty level in 2009 was 27%, compared to 16%
statewide.[2] Unemployment (civilian, not in labor force, 2009) in Halifax County was 13%, compared to
10.6% statewide. The estimated high school graduation rate (2010) was 75%, based on the cohort of
ninth graders that graduated from high school in four years, compared to 78% in North Carolina. In
2007, the adult uninsured population (≥ age 18-64) was 14%, compared to 21% statewide. Forty-six
physicians provided primary care in Halifax County (2008), which was a population to primary care
physician ratio of 1,198 to 1.[3]
Demographics
Based on data from the 2010 U.S. Census, Halifax
County had a total population of 54,691 with 76
persons per square mile. The county population
was 23% children (<18), 61% adults ages 18-64, and
16% elders. Halifax County was 53% African
American (AA) (22% AA statewide) and 40% white
(69% white statewide). Latinos/Hispanics (any race)
comprised 2% of the population in Halifax County
(8% statewide) (Exhibit 72). The overall county
population was 52% female and 48% male.[2]
Cancer Surveillance
Colon and Rectal Cancers (CRC)
Incidence
In Halifax County, the CRC age-adjusted incidence rate for 2004-2008 was 51.8 (95% CI 44.4, 60.3) per
100,000, which was higher than the overall statewide CRC rate of 46.8 (95% CI 46.1, 47.4). On average,
there were 35 new cases of CRC diagnosed in Halifax County, and 4,720 new cases across the state for
2004-2008. The CRC age-adjusted incidence rates per 100,000 were 64.9 (95% CI 52.1, 79.9) for males
and 42.9 (95% CI 34.0, 53.6) for females. By race, the CRC age-adjusted incidence rates per 100,000
were 55.6 (95% CI 44.9, 68.4) for whites, and 49.6 (95% CI 39.0, 62.2) for African Americans.[4]
Mortality
In Halifax County, CRC mortality rates for 2003-2007 were stable and were similar to the North Carolina
rates (all races, both sexes). The CRC mortality rate (2003-2007) was 21.1 (95% CI 16.4, 26.7) per
100,000 which was higher than the overall statewide CRC mortality rate of 17.3 (95% CI 17.0, 17.7).
Halifax County did not meet the Healthy People 2010 mortality rate goal (13.9 CRC deaths per
100,000).[4][5] The average annual percentage change in death rates declined at -0.5 percent (95% CI -
Source: U.S. Census Bureau, State and County
Quickfacts: North Carolina

59
1.4, 0.5) for 2003-2007. The CRC mortality rates (2003-2007) by gender were 18.0 (95% CI 12.6, 25.3) for
females and 25.5 (95% CI 17.4, 35.9) for males per 100,000. CRC mortality rates (2003-2007) per
100,000 by race were 16.9 (95% CI 11.3, 24.7) for whites, and 25.4 (95% CI 17.9, 35.0) for African
Americans.[4]
Female Breast
Incidence
In Halifax County, the breast cancer (female, invasive) age-adjusted incidence rate for 2004-2008 was
137.5 (95% CI 120.7, 156.2) per 100,000, which was higher than the overall statewide breast cancer rate
of 123.3 (95% CI 121.9-124.7). On average, there were 50 new cases of invasive female breast cancer
diagnosed in Halifax County and 6,189 new cases across the state for 2004-2008. Female breast cancer
age-adjusted incidence rates were 152.2 (95% CI 126.7, 182.0) for whites, and 123.9 (95% CI 101.3,
150.0) for African Americans.[4]
Mortality
In Halifax County, female breast cancer mortality rates for 2003-2007 increased and were higher than
the North Carolina rates (all races). The female breast cancer mortality rate (2003-2007) was 34.7 (95%
CI 26.5, 44.7) per 100,000, which was higher than the overall statewide female breast cancer mortality
rate of 24.8. Halifax County did not meet the Healthy People 2010 mortality rate goal (22.3 female
breast cancer deaths per 100,000).[4][5] The average annual percentage change in death rates increased
at 0.4 percent (95% CI -0.8, 1.5) for 2003-2007. Female breast cancer mortality rates (2003-2007) per
100,000 by race were 34.2 (95% CI 22.2, 50.9) for whites, and 37.3 (95% CI 25.6, 52.6) for African
Americans.[4]
Cervix
See Eastern North Carolina rates. Halifax County data for cervical cancer incidence and mortality rates
were suppressed due to small numbers.
Exhibit 73. Colorectal Cancer Incidence and Mortality Rates per 100,000 persons
Halifax County North Carolina
CRC Incidence (2004-2008)* 51.8 46.8
CRC Mortality (2003-2007) 21.1 17.3
*Age-Adjusted
Source: NCI, State Cancer Profiles
Exhibit 74. Invasive Female Breast Cancer Incidence and Mortality Rates per 100,000 persons
Halifax County North Carolina
Breast Cancer Incidence (2004-2008)* 137.5 123.3
Breast Cancer Mortality (2003-2007) 34.7 24.8
*Age-Adjusted
Source: NCI, State Cancer Profiles

60
Risk Factors and Screening
Halifax County residents had a higher prevalence of obesity and diabetes compared to NC statewide, but
report less alcohol consumption.
0%
10%
20%
30%
40%
50%
60%
70%
80%
% Smoker % Obese % Alcohol % Diabetes % Mammogram
Exhibit 75. Adult Respondents, Halifax County, North Carolina Behavioral Risk Factor Surveillance System, 2003-2009
Halifax County North Carolina
Sources: County Health Rankings, North Carolina County Health Rankings; North Carolina Data Health Explorer; NC DHHS, SCHS, BRFSS Survey Results, 2005-2009 Exhibit 76. Adult Respondents, Halifax County, North Carolina Behavioral Risk Factor Surveillance System, 2005-2009
a. 2003-2009, Percent of adults that report smoking ≥100 cigarettes and currently smoking [3]
b. 2008, Percent of adults that report a BMI ≥30 [3]
c. 2003-2009, Percent of the adult population that reports either binge drinking, defined as consuming more than 4 (women) or 5 (men)
alcoholic beverages on a single occasion in the past 30 days, or heavy drinking, defined as drinking more than 1 (women) or 2 (men) drinks per
day on average [3]
d. 2005-2009, Percent, Has a doctor told you that you have diabetes, Yes response. [6][7]
e. 2006-2007, Percent of female Medicare enrollees age 67-69 that had at least one mammogram over a two-year period [3]
Sources: County Health Rankings, North Carolina County Health Rankings; North Carolina Data Health Explorer; NC DHHS, SCHS, BRFSS Survey Results, 2005-2009
Factor
% Smokera % Obeseb % Alcoholc % Diabetesd % Mammograme
Halifax County 22% 37% 8% 15% 65%
North Carolina 22% 29% 12% 9% 67%

61
White36%
African American
61%
Other3%
Exhibit 77. Hertford County by Race, 2010
HERTFORD COUNTY
Social and Economic Indicators
Based on number of persons employed, in 2011 the largest industry in Hertford County was
manufacturing.[1] The median household income (2009) was $31,879 for a family of four, compared to
$43,754 statewide. The percentage of persons living below the poverty level in 2009 was 25%,
compared to 16% statewide.[2] Unemployment (civilian, not in labor force, 2009) in Hertford County
was 9%, compared to 10.6% statewide. The estimated high school graduation rate (2010) was 68%,
based on the cohort of ninth graders that graduated from high school in four years, compared to 78% in
North Carolina. In 2007, the adult uninsured population (≥ age 18-64) was 16%, compared to 21%
statewide. Twenty-eight physicians provided primary care in Hertford County (2008), which was a
population to primary care physician ratio of 834 to 1.[3]
Demographics
Based on data from the 2010 U.S. Census, Hertford
County had a total population of 24,669 with 70
persons per square mile. The county population was
21% children (<18), 63% adults ages 18-64, and 16%
elders. Hertford County was 61% African American
(AA) (22% AA statewide) and 36% white (69% white
statewide). Latinos/Hispanics (any race) comprised 3%
of the population in Hertford County (8% statewide)
(Exhibit 77). The overall county population was 51%
female and 49% male.[2]
Cancer Surveillance
Colon and Rectal Cancers (CRC)
Incidence
In Hertford County, the CRC age-adjusted incidence rate for 2004-2008 was 64.4 (95% CI 51.8, 79.4) per
100,000, which was higher than the overall statewide CRC rate of 46.8 (95% CI 46.1, 47.4). On average,
there were 18 new cases of CRC diagnosed in Hertford County, and 4,720 new cases across the state for
2004-2008. The CRC age-adjusted incidence rates per 100,000 were 64.6 (95% CI 44.5, 90.5) for males
and 67.7 (95% CI 50.9, 88.8) for females. By race, the CRC age-adjusted incidence rates per 100,000
were 70.4 (95% CI 51.2, 95.7) for whites, and 61.5 (95% CI 44.8, 82.4) for African Americans.[4]
Mortality
In Hertford County, CRC mortality rates for 2003-2007 increased and were higher than the North
Carolina rates (all races, both sexes). The CRC mortality rate (2003-2007) was 29.9 (95% CI 21.4, 40.9)
per 100,000 which was higher than the overall statewide CRC mortality rate of 17.3 (95% CI 17.0, 17.7).
Hertford County did not meet the Healthy People 2010 mortality rate goal (13.9 CRC deaths per
100,000).[4][5] The average annual percentage change in death rates increased at 0.1 percent (95% CI -
Source: U.S. Census Bureau, State and County
Quickfacts: North Carolina

62
1.0, 1.2) for 2003-2007. The CRC mortality rates (2003-2007) by gender were 26.9 (95% CI 17.0, 41.2) for
females and 35.4 (95% CI 20.7, 56.4) for males per 100,000. The CRC mortality rate (2003-2007) per
100,000 by race was suppressed for whites due to small numbers of deaths, and the rate for African
Americans was 36.8 (95% CI 24.0, 54.0).[4]
Female Breast
Incidence
In Hertford County, the breast cancer (female, invasive) age-adjusted incidence rate for 2004-2008 was
113.3 (95% CI 90.1, 141.0) per 100,000, which was lower than the overall statewide breast cancer rate of
123.3 (95% CI 121.9-124.7). On average, there were 17 new cases of invasive female breast cancer
diagnosed in Hertford County and 6,189 new cases across the state for 2004-2008. Female breast cancer
age-adjusted incidence rates were 134.4 (95% CI 94.4, 187.5) for whites, and 100.9 (95% CI 72.8, 136.5)
for African Americans.[4]
Mortality
In Hertford County, female breast cancer mortality rates for 2003-2007 increased and were similar to
the North Carolina rates (all races). The female breast cancer mortality rate (2003-2007) was 38.7 (95%
CI 25.9, 56.1) per 100,000, which was higher than the overall statewide female breast cancer mortality
rate of 24.8. Hertford County did not meet the Healthy People 2010 mortality rate goal (22.3 female
breast cancer deaths per 100,000).[4][5] The average annual percentage change in death rates increased
at 0.6 percent (95% CI -1.3, 2.5) for 2003-2007. The female breast cancer mortality rate (2003-2007) per
100,000 by race was suppressed for whites due to small numbers of deaths, and the rate for African
Americans was 43.8 (95% CI 25.9, 69.7).[4]
Exhibit 78. Colorectal Cancer Incidence and Mortality Rates per 100,000 persons
Hertford County North Carolina
CRC Incidence (2004-2008)* 64.4 46.8
CRC Mortality (2003-2007) 29.9 17.3
*Age-Adjusted
Source: NCI, State Cancer Profiles
Exhibit 79. Invasive Female Breast Cancer Incidence and Mortality Rates per 100,000 persons
Hertford County North Carolina
Breast Cancer Incidence (2004-2008)* 113.3 123.3
Breast Cancer Mortality (2003-2007) 38.7 24.8
*Age-Adjusted
Source: NCI, State Cancer Profiles

63
Cervix See Eastern North Carolina rates. Hertford County data for cervical cancer incidence and mortality rates were suppressed due to small numbers. Risk Factors and Screening
Hertford County residents had a higher prevalence of smoking, obesity, and diabetes compared to NC
statewide. Mammography in medicare-enrolled women was higher than statewide.
0%
10%
20%
30%
40%
50%
60%
70%
80%
% Smoker % Obese % Alcohol % Diabetes % Mammogram
Exhibit 80. Adult Respondents, Hertford County, North Carolina Behavioral Risk Factor Surveillance System, 2003-2009
Hertford County North Carolina
Sources: County Health Rankings, North Carolina County Health Rankings; North Carolina Data Health Explorer; NC DHHS, SCHS, BRFSS Survey Results, 2005-2009 Exhibit 81. Adult Respondents, Hertford County, North Carolina Behavioral Risk Factor Surveillance System, 2003-2009
a. 2003-2009, Percent of adults that report smoking ≥100 cigarettes and currently smoking [3]
b. 2008, Percent of adults that report a BMI ≥30 [3]
c. 2003-2009, Percent of the adult population that reports either binge drinking, defined as consuming more than 4 (women) or 5 (men)
alcoholic beverages on a single occasion in the past 30 days, or heavy drinking, defined as drinking more than 1 (women) or 2 (men) drinks per
day on average [3]
d. 2005-2009, Percent, Has a doctor told you that you have diabetes, Yes response. [6][7]
e. 2006-2007, Percent of female Medicare enrollees age 67-69 that had at least one mammogram over a two-year period [3]
Sources: County Health Rankings, North Carolina County Health Rankings; North Carolina Data Health Explorer; NC DHHS, SCHS, BRFSS Survey Results, 2005-2009
Factor
% Smokera % Obeseb % Alcoholc % Diabetesd % Mammograme
Hertford County 24% 34% 7% 16% 69%
North Carolina 22% 29% 12% 9% 67%

64
White64%
African American
32%
Other4%
Exhibit 82. Hyde County by Race, 2010
HYDE COUNTY
Social and Economic Indicators
Based on number of persons employed, in 2011 the largest industry in Hyde County was public
administration.[1] The median household income (2009) was $33,097 for a family of four, compared to
$43,754 statewide. The percentage of persons living below the poverty level in 2009 was 24%,
compared to 16% statewide.[2] Unemployment (civilian, not in labor force, 2009) in Hyde County was
8%, compared to 10.6% statewide. The estimated high school graduation rate (2010) was 66%, based
on the cohort of ninth graders that graduated from high school in four years, compared to 78% in North
Carolina. In 2007, the adult uninsured population (≥ age 18-64) was 20%, compared to 21% statewide.
There are 0 physicians in primary care in Hyde County (2008), which was a population to primary care
physician ratio of 5,260 to 0.*[3] *Data unreliable
Demographics
Based on data from the 2010 U.S. Census, Hyde
County had a total population of 5,810 with 10
persons per square mile. The county population
was 19% children (<18), 66% adults ages 18-64, and
15% elders. Hyde County was 32% African
American (AA) (22% AA statewide) and 64% white
(69% white statewide). Latinos/Hispanics (any race)
comprised 7% of the population in Hyde County (8%
statewide) (Exhibit 82). The overall county
population was 45% female and 55% male.[2]
Cancer Surveillance
Colon and Rectal Cancers (CRC)
Incidence
In Hyde County, the CRC age-adjusted incidence rate for 2004-2008 was 56.3 (95% CI 34.3, 88.7) per
100,000, which was higher than the overall statewide CRC rate of 46.8 (95% CI 46.1, 47.4). On average,
there were 4 new cases of CRC diagnosed in Hyde County, and 4,720 new cases across the state for
2004-2008. The CRC age-adjusted incidence rates per 100,000 for males and females were suppressed
due to small numbers of cases. By race, the CRC age-adjusted incidence rate per 100,000 was 69.8 (95%
CI 40.5, 115.0) for whites, and the rate for African Americans was suppressed due to small numbers of
cases.[4]
Source: U.S. Census Bureau, State and County
Quickfacts: North Carolina

65
Mortality
In Hyde County, CRC mortality rates (2003-2007) per 100,000 were suppressed due to small numbers of
deaths.[4]
Female Breast
Incidence
In Hyde County, the breast cancer (female, invasive) age-adjusted incidence rate for 2004-2008 was
141.8 (95% CI 86.5, 221.4) per 100,000, which was higher than the overall statewide breast cancer rate
of 123.3 (95% CI 121.9-124.7). On average, there were 4 new cases of invasive female breast cancer
diagnosed in Hyde County and 6,189 new cases across the state for 2004-2008. Incidence rates by race
were suppressed due to small numbers of cases.[4]
Mortality
In Hyde County, female breast cancer mortality rates (2003-2007) per 100,000 were suppressed due to
small numbers of deaths.[4]
Cervix
See Eastern North Carolina rates. Hyde County data for cervical cancer incidence and mortality rates
were suppressed due to small numbers.
Exhibit 83. Colorectal Cancer Incidence and Mortality Rates per 100,000 persons
Hyde County North Carolina
Colorectal Incidence (2004-2008)* 56.3 46.8
Colorectal Mortality (2003-2007) ** 17.3
*Age-Adjusted
**Suppressed due to small numbers
Source: NCI, State Cancer Profiles
Exhibit 84. Invasive Female Breast Cancer Incidence and Mortality Rates per 100,000 persons
Hyde County North Carolina
Breast Cancer Incidence (2004-2008)* 141.8 123.3
Breast Cancer Mortality (2003-2007) ** 24.8
*Age-Adjusted
**Suppressed due to small numbers
Source: NCI, State Cancer Profiles

66
Risk Factors and Screening Hyde County residents had a higher prevalence of obesity and diabetes compared to NC statewide.
Mammography in Medicare-enrolled women was lower than the statewide prevalence.
0%
10%
20%
30%
40%
50%
60%
70%
80%
% Obese % Diabetes % Mammogram
Exhibit 85. Adult Respondents, Hyde County, North Carolina Behavioral Risk Factor Surveillance System, 2003-2009
Hyde County North Carolina
*Data were not available for smoker and alcohol behavioral factors at the county level.
Sources: County Health Rankings, North Carolina County Health Rankings;
North Carolina Data Health Explorer; NC DHHS, SCHS, BRFSS Survey Results, 2005-2009
Exhibit 86. Adult Respondents, Hyde County, North Carolina
Behavioral Risk Factor Surveillance System, 2003-2009
a. 2003-2009, Percent of adults that report smoking ≥100 cigarettes and currently smoking [3]
b. 2008, Percent of adults that report a BMI ≥30 [3]
c. 2003-2009, Percent of the adult population that reports either binge drinking, defined as consuming more than 4 (women) or 5 (men)
alcoholic beverages on a single occasion in the past 30 days, or heavy drinking, defined as drinking more than 1 (women) or 2 (men) drinks per
day on average [3]
d. 2005-2009, Percent, Has a doctor told you that you have diabetes, Yes response. [6][7]
e. 2006-2007, Percent of female Medicare enrollees age 67-69 that had at least one mammogram over a two-year period [3]
*Data unavailable
Sources: County Health Rankings, North Carolina County Health Rankings; North Carolina Data Health Explorer; NC DHHS, SCHS, BRFSS Survey Results, 2005-2009
Factor
% Smokera % Obeseb % Alcoholc % Diabetesd % Mammograme
Hyde County * 31% * 20% 57%
North Carolina 22% 29% 12% 9% 67%
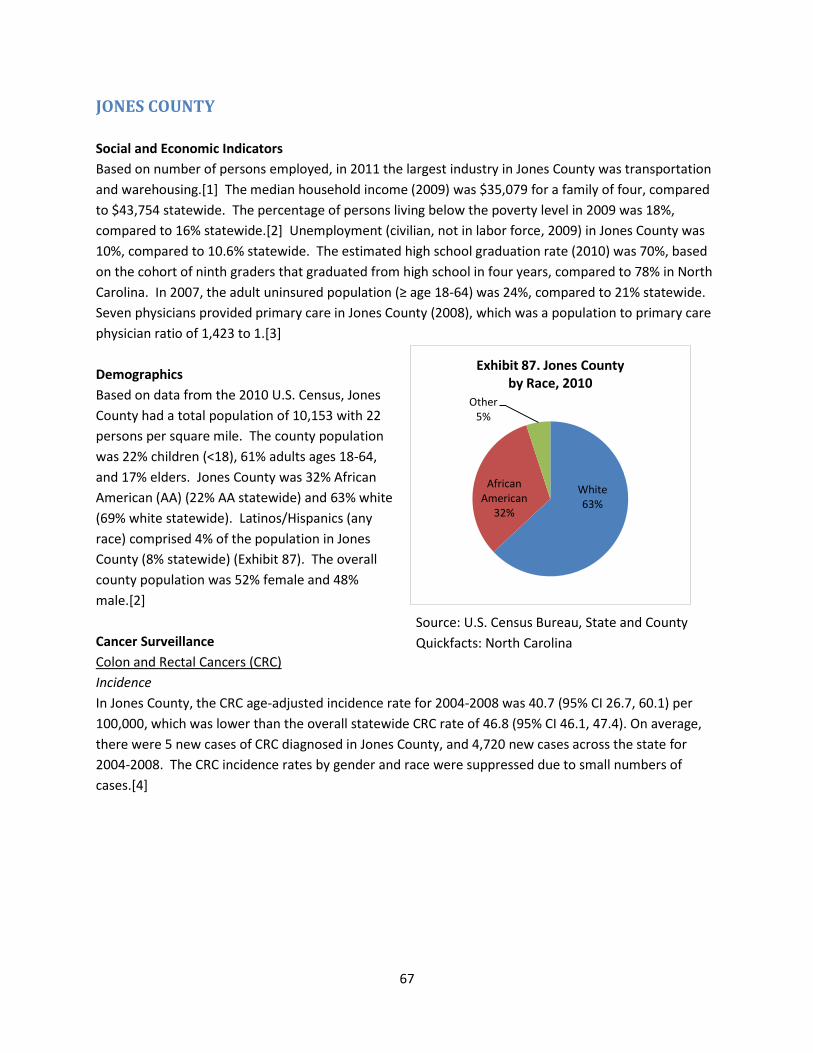
67
White63%
African American
32%
Other5%
Exhibit 87. Jones County by Race, 2010
JONES COUNTY
Social and Economic Indicators
Based on number of persons employed, in 2011 the largest industry in Jones County was transportation
and warehousing.[1] The median household income (2009) was $35,079 for a family of four, compared
to $43,754 statewide. The percentage of persons living below the poverty level in 2009 was 18%,
compared to 16% statewide.[2] Unemployment (civilian, not in labor force, 2009) in Jones County was
10%, compared to 10.6% statewide. The estimated high school graduation rate (2010) was 70%, based
on the cohort of ninth graders that graduated from high school in four years, compared to 78% in North
Carolina. In 2007, the adult uninsured population (≥ age 18-64) was 24%, compared to 21% statewide.
Seven physicians provided primary care in Jones County (2008), which was a population to primary care
physician ratio of 1,423 to 1.[3]
Demographics
Based on data from the 2010 U.S. Census, Jones
County had a total population of 10,153 with 22
persons per square mile. The county population
was 22% children (<18), 61% adults ages 18-64,
and 17% elders. Jones County was 32% African
American (AA) (22% AA statewide) and 63% white
(69% white statewide). Latinos/Hispanics (any
race) comprised 4% of the population in Jones
County (8% statewide) (Exhibit 87). The overall
county population was 52% female and 48%
male.[2]
Cancer Surveillance
Colon and Rectal Cancers (CRC)
Incidence
In Jones County, the CRC age-adjusted incidence rate for 2004-2008 was 40.7 (95% CI 26.7, 60.1) per
100,000, which was lower than the overall statewide CRC rate of 46.8 (95% CI 46.1, 47.4). On average,
there were 5 new cases of CRC diagnosed in Jones County, and 4,720 new cases across the state for
2004-2008. The CRC incidence rates by gender and race were suppressed due to small numbers of
cases.[4]
Source: U.S. Census Bureau, State and County
Quickfacts: North Carolina

68
Mortality
In Jones County, CRC mortality rates (2003-2007) per 100,000 were suppressed due to small numbers of
deaths.[4]
Female Breast
Incidence
In Jones County, the breast cancer (female, invasive) age-adjusted incidence rate for 2004-2008 was
94.7 (95% CI 64.1, 136.2) per 100,000, which was lower than the overall statewide breast cancer rate of
123.3 (95% CI 121.9-124.7). On average, there were 6 new cases of invasive female breast cancer
diagnosed in Jones County and 6,189 new cases across the state for 2004-2008. The female breast
cancer age-adjusted incidence rate was 95.4 (95% CI 57.6, 150.7) for whites, and the rate for African
Americans was suppressed due to small numbers of cases.[4]
Mortality
In Jones County, female breast cancer mortality rates (2003-2007) per 100,000 were suppressed due to
small numbers of deaths.[4]
Cervix
See Eastern North Carolina rates. Jones County data for cervical cancer incidence and mortality rates
were suppressed due to small numbers.
Exhibit 88. Colorectal Cancer Incidence and Mortality Rates per 100,000 persons
Jones County North Carolina
CRC Incidence (2004-2008)* 40.7 46.8
CRC Mortality (2003-2007) ** 17.3
*Age-Adjusted
**Suppressed due to small numbers
Source: NCI, State Cancer Profiles
Exhibit 89. Invasive Female Breast Cancer Incidence and Mortality Rates per 100,000 persons
Jones County North Carolina
Breast Cancer Incidence (2004-2008)* 94.7 123.3
Breast Cancer Mortality (2003-2007) ** 24.8
*Age-Adjusted
**Suppressed due to small numbers
Source: NCI, State Cancer Profiles

69
Risk Factors and Screening
Jones County residents had a higher prevalence of obesity and diabetes compared to NC statewide.
Mammography in medicare-enrolled women was slightly higher than statewide prevalence.
0%
10%
20%
30%
40%
50%
60%
70%
80%
% Obese % Alcohol % Diabetes % Mammogram
Exhibit 90. Adult Respondents, Jones County, North Carolina Behavioral Risk Factor Surveillance System, 2003-2009
Jones County North Carolina
*Data were not available for smoker behavioral factor at the county level.
Sources: County Health Rankings, North Carolina County Health Rankings;
North Carolina Data Health Explorer; NC DHHS, SCHS, BRFSS Survey Results, 2005-2009
Exhibit 91. Adult Respondents, Jones County, North Carolina
Behavioral Risk Factor Surveillance System, 2003-2009
a. 2003-2009, Percent of adults that report smoking ≥100 cigarettes and currently smoking [3]
b. 2008, Percent of adults that report a BMI ≥30 [3]
c. 2003-2009, Percent of the adult population that reports either binge drinking, defined as consuming more than 4 (women) or 5 (men)
alcoholic beverages on a single occasion in the past 30 days, or heavy drinking, defined as drinking more than 1 (women) or 2 (men) drinks per
day on average [3]
d. 2005-2009, Percent, Has a doctor told you that you have diabetes, Yes response. [6][7]
e. 2006-2007, Percent of female Medicare enrollees age 67-69 that had at least one mammogram over a two-year period [3]
*Data unavailable
Sources: County Health Rankings, North Carolina County Health Rankings;
North Carolina Data Health Explorer; NC DHHS, SCHS, BRFSS Survey Results, 2005-2009
Factor
% Smokera % Obeseb % Alcoholc % Diabetesd % Mammograme
Jones County * 32% 6% 15% 68%
North Carolina 22% 29% 12% 9% 67%

70
White53%
African American
41%
Other6%
Exhibit 92. Lenoir County by Race, 2010
LENOIR COUNTY
Social and Economic Indicators
Based on number of persons employed, in 2011 the largest industry in Lenoir County was
manufacturing.[1] The median household income (2009) was $34,213 for a family of four, compared to
$43,754 statewide. The percentage of persons living below the poverty level in 2009 was 21%,
compared to 16% statewide.[2] Unemployment (civilian, not in labor force, 2009) in Lenoir County was
11%, compared to 10.6% statewide. The estimated high school graduation rate (2010) was 74%, based
on the cohort of ninth graders that graduated from high school in four years, compared to 78% in North
Carolina. In 2007, the adult uninsured population (≥ age 18-64) was 17%, compared to 21% statewide.
Forty-eight physicians provided primary care in Lenoir County (2008), which was a population to primary
care physician ratio of 1,181 to 1.[3]
Demographics
Based on data from the 2010 U.S. Census, Lenoir
County had a total population of 59,495 with 149
persons per square mile. The county population
was 24% children (<18), 60% adults ages 18-64,
and 16% elders. Lenoir County was 41% African
American (AA) (22% AA statewide) and 53% white
(69% white statewide). Latinos/Hispanics (any
race) comprised 7% of the population in Lenoir
County (8% statewide) (Exhibit 92). The overall
county population was 53% female and 47%
male.[2]
Cancer Surveillance
Colon and Rectal Cancers (CRC)
Incidence
In Lenoir County, the CRC age-adjusted incidence rate for 2004-2008 was 66.3 (95% CI 58.0, 75.5) per
100,000, which was higher than the overall statewide CRC rate of 46.8 (95% CI 46.1, 47.4). On average,
there were 47 new cases of CRC diagnosed in Lenoir County, and 4,720 new cases across the state for
2004-2008. The CRC age-adjusted incidence rates per 100,000 were 81.4 (95% CI 66.4, 98.8) for males
and 58.8 (95% CI 48.7, 70.5) for females. By race, the CRC age-adjusted incidence rates per 100,000
were 59.7 (95% CI 50.8, 70.8) for whites, and 76.3 (95% CI 61.5, 93.7) for African Americans.[4]
Mortality
In Lenoir County, CRC mortality rates for 2003-2007 were stable and were similar to the North Carolina
rates (all races, both sexes). The CRC mortality rate (2003-2007) was 21.4 (95% CI 16.8, 26.9) per
100,000 which was higher than the overall statewide CRC mortality rate of 17.3 (95% CI 17.0, 17.7).
Lenoir County did not meet the Healthy People 2010 mortality rate goal (13.9 CRC deaths per
Source: U.S. Census Bureau, State and County
Quickfacts: North Carolina

71
100,000).[4][5] The average annual percentage change in death rates declined at -0.4 percent (95% CI -
1.4, 0.6) through 2003-2007. The CRC mortality rates (2003-2007) by gender were 19.1 (95% CI 13.8,
26.2) for females and 23.1 (95% CI 15.7, 32.7) for males per 100,000. CRC mortality rates (2003-2007)
per 100,000 by race were 21.3 (95% CI 15.6, 28.5) for whites, and 22.5 (95% CI 14.8, 32.8) for African
Americans.[4]
Female Breast
Incidence
In Lenoir County, the breast cancer (female, invasive) age-adjusted incidence rate for 2004-2008 was
148.1 (95% CI 131.3, 166.7) per 100,000, which was higher than the overall statewide breast cancer rate
of 123.3 (95% CI 121.9-124.7). On average, there were 58 new cases of invasive female breast cancer
diagnosed in Lenoir County and 6,189 new cases across the state for 2004-2008. Female breast cancer
age-adjusted incidence rates were 151.8 (95% CI 130.0, 176.6) for whites, and 142.5 (95% CI 116.4,
173.0) for African Americans.[4]
Mortality
In Lenoir County, female breast cancer mortality rates for 2003-2007 increased and were similar to the
North Carolina rates (all races). The female breast cancer mortality rate (2003-2007) was 30.5 (95% CI
23.2, 39.5) per 100,000, which was higher than the overall statewide female breast cancer mortality rate
of 24.8. Lenoir County did not meet the Healthy People 2010 mortality rate goal (22.3 female breast
cancer deaths per 100,000).[4][5] The average annual percentage change in death rates declined at -0.4
percent (95% CI -1.4, 0.6) for 2003-2007. Female breast cancer mortality rates (2003-2007) per 100,000
by race were 23.5 (95% CI 15.7, 34.4) for whites, and 41.1 (95% CI 27.8, 58.7) for African Americans.[4]
Exhibit 93. Colorectal Cancer Incidence and Mortality Rates per 100,000 persons
Lenoir County North Carolina
CRC Incidence (2004-2008)* 66.3 46.8
CRC Mortality (2003-2007) 21.4 17.3
*Age-Adjusted
Source: NCI, State Cancer Profiles
Exhibit 94. Invasive Female Breast Cancer Incidence and Mortality Rates per 100,000 persons
Lenoir County North Carolina
Breast Cancer Incidence (2004-2008)* 148.1 123.3
Breast Cancer Mortality (2003-2007) 30.5 24.8
*Age-Adjusted
Source: NCI, State Cancer Profiles

72
Cervix
See Eastern North Carolina rates. Lenoir County data for cervical cancer incidence and mortality rates
were suppressed due to small numbers.
Risk Factors and Screening
Lenoir County residents had a higher prevalence of smoking, obesity and diabetes compared to NC
statewide, but report less mammography in medicare-enrolled women.
0%
10%
20%
30%
40%
50%
60%
70%
80%
% Smoker % Obese % Alcohol % Diabetes % Mammogram
Exhibit 95. Adult Respondents, Lenoir County, North Carolina Behavioral Risk Factor Surveillance System, 2003-2009
Lenoir County North Carolina
Sources: County Health Rankings, North Carolina County Health Rankings;
North Carolina Data Health Explorer; NC DHHS, SCHS, BRFSS Survey Results, 2005-2009
Exhibit 96. Adult Respondents, Lenoir County, North Carolina
Behavioral Risk Factor Surveillance System, 2003-2009
a. 2003-2009, Percent of adults that report smoking ≥100 cigarettes and currently smoking [3]
b. 2008, Percent of adults that report a BMI ≥30 [3]
c. 2003-2009, Percent of the adult population that reports either binge drinking, defined as consuming more than 4 (women) or 5 (men)
alcoholic beverages on a single occasion in the past 30 days, or heavy drinking, defined as drinking more than 1 (women) or 2 (men) drinks per
day on average [3]
d. 2005-2009, Percent, Has a doctor told you that you have diabetes, Yes response. [6][7]
e. 2006-2007, Percent of female Medicare enrollees age 67-69 that had at least one mammogram over a two-year period [3]
Sources: County Health Rankings, North Carolina County Health Rankings; North Carolina Data Health Explorer; NC DHHS, SCHS, BRFSS Survey Results, 2005-2009
Factor
% Smokera % Obeseb % Alcoholc % Diabetesd % Mammograme
Lenoir County 24% 33% 7% 14% 62%
North Carolina 22% 29% 12% 9% 67%
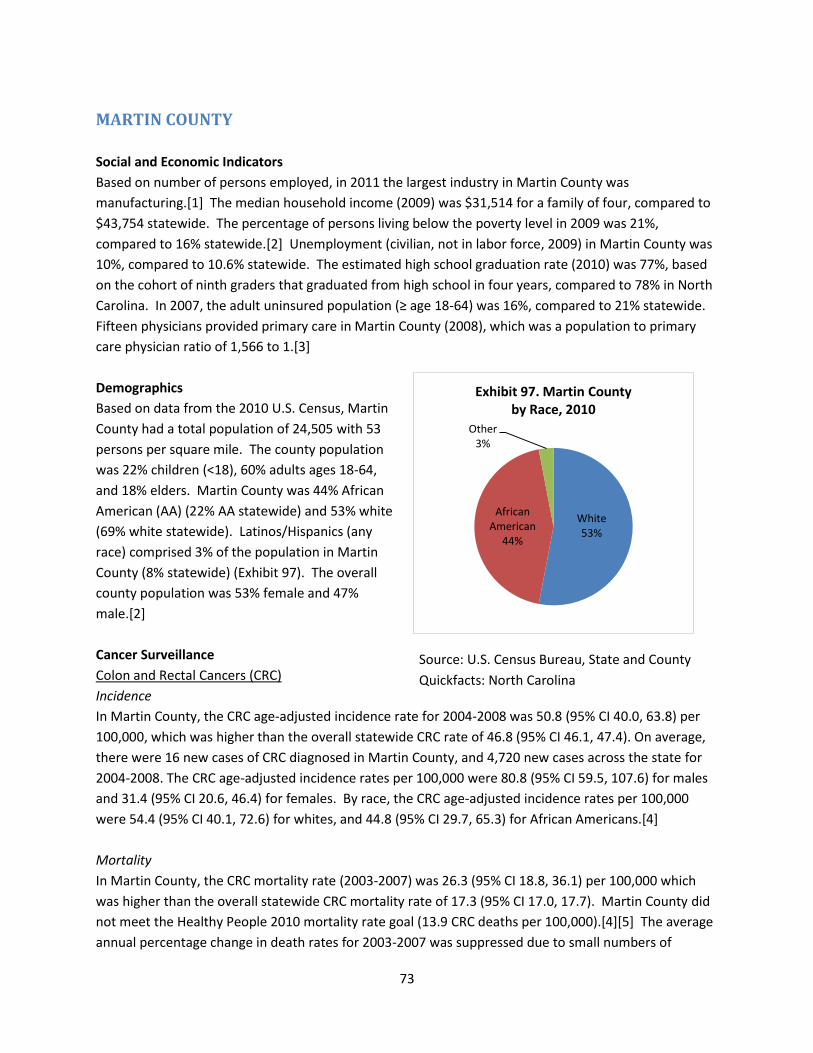
73
White53%
African American
44%
Other3%
Exhibit 97. Martin County by Race, 2010
MARTIN COUNTY
Social and Economic Indicators
Based on number of persons employed, in 2011 the largest industry in Martin County was
manufacturing.[1] The median household income (2009) was $31,514 for a family of four, compared to
$43,754 statewide. The percentage of persons living below the poverty level in 2009 was 21%,
compared to 16% statewide.[2] Unemployment (civilian, not in labor force, 2009) in Martin County was
10%, compared to 10.6% statewide. The estimated high school graduation rate (2010) was 77%, based
on the cohort of ninth graders that graduated from high school in four years, compared to 78% in North
Carolina. In 2007, the adult uninsured population (≥ age 18-64) was 16%, compared to 21% statewide.
Fifteen physicians provided primary care in Martin County (2008), which was a population to primary
care physician ratio of 1,566 to 1.[3]
Demographics
Based on data from the 2010 U.S. Census, Martin
County had a total population of 24,505 with 53
persons per square mile. The county population
was 22% children (<18), 60% adults ages 18-64,
and 18% elders. Martin County was 44% African
American (AA) (22% AA statewide) and 53% white
(69% white statewide). Latinos/Hispanics (any
race) comprised 3% of the population in Martin
County (8% statewide) (Exhibit 97). The overall
county population was 53% female and 47%
male.[2]
Cancer Surveillance
Colon and Rectal Cancers (CRC)
Incidence
In Martin County, the CRC age-adjusted incidence rate for 2004-2008 was 50.8 (95% CI 40.0, 63.8) per
100,000, which was higher than the overall statewide CRC rate of 46.8 (95% CI 46.1, 47.4). On average,
there were 16 new cases of CRC diagnosed in Martin County, and 4,720 new cases across the state for
2004-2008. The CRC age-adjusted incidence rates per 100,000 were 80.8 (95% CI 59.5, 107.6) for males
and 31.4 (95% CI 20.6, 46.4) for females. By race, the CRC age-adjusted incidence rates per 100,000
were 54.4 (95% CI 40.1, 72.6) for whites, and 44.8 (95% CI 29.7, 65.3) for African Americans.[4]
Mortality
In Martin County, the CRC mortality rate (2003-2007) was 26.3 (95% CI 18.8, 36.1) per 100,000 which
was higher than the overall statewide CRC mortality rate of 17.3 (95% CI 17.0, 17.7). Martin County did
not meet the Healthy People 2010 mortality rate goal (13.9 CRC deaths per 100,000).[4][5] The average
annual percentage change in death rates for 2003-2007 was suppressed due to small numbers of
Source: U.S. Census Bureau, State and County
Quickfacts: North Carolina

74
deaths. The CRC mortality rates (2003-2007) by gender were 19.7 (95% CI 11.7, 31.7) for females and
35.1 (95% CI 21.4, 54.2) for males per 100,000. CRC mortality rates (2003-2007) per 100,000 by race
were 19.6 (95% CI 11.5, 31.7) for whites, and 34.5 (95% CI 21.3, 53.2) for African Americans.[4]
Female Breast
Incidence
In Martin County, the breast cancer (female, invasive) age-adjusted incidence rate for 2004-2008 was
114.4 (95% CI 91.8, 141.1) per 100,000, which was lower than the overall statewide breast cancer rate of
123.3 (95% CI 121.9-124.7). On average, there were 19 new cases of invasive female breast cancer
diagnosed in Martin County and 6,189 new cases across the state for 2004-2008. Female breast cancer
age-adjusted incidence rates were 125.9 (95% CI 95.5, 164.0) for whites, and 97.5 (95% CI 66.2, 138.8)
for African Americans.[4]
Mortality
In Martin County, the female breast cancer mortality rate (2003-2007) was 29.7 (95% CI 18.7, 45.1) per
100,000, which was higher than the overall statewide female breast cancer mortality rate of 24.8.
Martin County did not meet the Healthy People 2010 mortality rate goal (22.3 female breast cancer
deaths per 100,000).[4][5] The average annual percentage change in death rates for 2003-2007 was
suppressed due to small numbers of deaths. The female breast cancer mortality rate (2003-2007) per
100,000 by race was suppressed for whites due to small numbers of deaths, and the rate for African
Americans was 50.7 (95% CI 29.1, 82.4).[4]
Cervix See Eastern North Carolina rates. Martin County data for cervical cancer incidence and mortality rates were suppressed due to small numbers.
Exhibit 98. Colorectal Cancer Incidence and Mortality Rates per 100,000 persons
Martin County North Carolina
CRC Incidence (2004-2008)* 50.8 46.8
CRC Mortality (2003-2007) 26.3 17.3
*Age-Adjusted
Source: NCI, State Cancer Profiles
Exhibit 99. Invasive Female Breast Cancer Incidence and Mortality Rates per 100,000 persons
Martin County North Carolina
Breast Cancer Incidence (2004-2008)* 114.4 123.3
Breast Cancer Mortality (2003-2007) 29.7 24.8 *Age-Adjusted
Source: NCI, State Cancer Profiles

75
Risk Factors and Screening
Martin County residents had a higher prevalence of obesity and diabetes compared to NC statewide, but
report less smoking.
0%
10%
20%
30%
40%
50%
60%
70%
80%
% Smoker % Obese % Alcohol % Diabetes % Mammogram
Exhibit 100. Adult Respondents, Martin County, North Carolina Behavioral Risk Factor Surveillance System, 2003-2009
Martin County North Carolina
Sources: County Health Rankings, North Carolina County Health Rankings;
North Carolina Data Health Explorer; NC DHHS, SCHS, BRFSS Survey Results, 2005-2009
Exhibit 101. Adult Respondents, Martin County, North Carolina
Behavioral Risk Factor Surveillance System, 2003-2009
a. 2003-2009, Percent of adults that report smoking ≥100 cigarettes and currently smoking [3]
b. 2008, Percent of adults that report a BMI ≥30 [3]
c. 2003-2009, Percent of the adult population that reports either binge drinking, defined as consuming more than 4 (women) or 5 (men)
alcoholic beverages on a single occasion in the past 30 days, or heavy drinking, defined as drinking more than 1 (women) or 2 (men) drinks per
day on average [3]
d. 2005-2009, Percent, Has a doctor told you that you have diabetes, Yes response. [6][7]
e. 2006-2007, Percent of female Medicare enrollees age 67-69 that had at least one mammogram over a two-year period [3]
Sources: County Health Rankings, North Carolina County Health Rankings;
North Carolina Data Health Explorer; NC DHHS, SCHS, BRFSS Survey Results, 2005-2009
Factor
% Smokera % Obeseb % Alcoholc % Diabetesd % Mammograme
Martin County 16% 33% 6% 16% 66%
North Carolina 22% 29% 12% 9% 67%

76
White56%
African American
37%
Other7%
Exhibit 102. Nash County by Race, 2010
NASH COUNTY
Social and Economic Indicators
Based on number of persons employed, in 2011 the largest industry in Nash County was
manufacturing.[1] The median household income (2009) was $39,770 for a family of four, compared to
$43,754 statewide. The percentage of persons living below the poverty level in 2009 was 16%,
compared to 16% statewide.[2] Unemployment (civilian, not in labor force, 2009) in Nash County was
13%, compared to 10.6% statewide. The estimated high school graduation rate (2010) was 72%, based
on the cohort of ninth graders that graduated from high school in four years, compared to 78% in North
Carolina. In 2007, the adult uninsured population (≥ age 18-64) was 19%, compared to 21% statewide.
Ninety-three physicians provided primary care in Nash County (2008), which was a population to
primary care physician ratio of 1,566 to 1.[3]
Demographics
Based on data from the 2010 U.S. Census, Nash
County had a total population of 95,840 with 177
persons per square mile. The county population
was 24% children (<18), 62% adults ages 18-64, and
14% elders. Nash County was 37% African
American (AA) (22% AA statewide) and 56% white
(69% white statewide). Latinos/Hispanics (any
race) comprised 6% of the population in Nash
County (8% statewide) (Exhibit 102). The overall
county population was 52% female and 48%
male.[2]
Cancer Surveillance
Colon and Rectal Cancers (CRC)
Incidence
In Nash County, the CRC age-adjusted incidence rate for 2004-2008 was 55.1 (95% CI 48.9, 62.0) per
100,000, which was higher than the overall statewide CRC rate of 46.8 (95% CI 46.1, 47.4). On average,
there were 58 new cases of CRC diagnosed in Nash County, and 4,720 new cases across the state for
2004-2008. The CRC age-adjusted incidence rates per 100,000 were 72.6 (95% CI 61.7, 84.9) for males
and 41.6 (95% CI 34.5, 49.7) for females. By race, the CRC age-adjusted incidence rates per 100,000
were 55.0 (95% CI 47.7, 63.1) for whites, and 54.9 (95% CI 43.4, 68.5) for African Americans.[4]
Mortality
In Nash County, CRC mortality rates for 2003-2007 were stable and were similar to the North Carolina
rates (all races, both sexes). The CRC mortality rate (2003-2007) was 20.4 (95% CI 16.6, 24.8) per
100,000 which was higher than the overall statewide CRC mortality rate of 17.3 (95% CI 17.0, 17.7).
Nash County did not meet the Healthy People 2010 mortality rate goal (13.9 CRC deaths per
Source: U.S. Census Bureau, State and County
Quickfacts: North Carolina

77
100,000).[4][5] The average annual percentage change in death rates declined at -0.2 percent (95% CI -
1.2, 0.8) for 2003-2007. The CRC mortality rates (2003-2007) by gender were 16.5 (95% CI 12.2, 22.1) for
females and 25.5 (95% CI 19.0, 33.5) for males per 100,000. CRC mortality rates (2003-2007) per
100,000 by race were 18.4 (95% CI 14.3, 23.4) for whites, and 25.6 (95% CI 17.7, 35.8) for African
Americans.[4]
Female Breast
Incidence
In Nash County, the breast cancer (female, invasive) age-adjusted incidence rate for 2004-2008 was
132.7 (95% CI 119.5, 147.1) per 100,000, which was higher than the overall statewide breast cancer rate
of 123.3 (95% CI 121.9-124.7). On average, there were 75 new cases of invasive female breast cancer
diagnosed in Nash County and 6,189 new cases across the state for 2004-2008. Female breast cancer
age-adjusted incidence rates were 133.6 (95% CI 117.4, 151.6) for whites, and 130.5 (95% CI 107.6,
156.8) for African Americans.[4]
Mortality
In Nash County, female breast cancer mortality rates for 2003-2007 declined and were similar to the
North Carolina rates (all races). The female breast cancer mortality rate (2003-2007) was 27.9 (95% CI
22.0, 34.9) per 100,000, which was higher than the overall statewide female breast cancer mortality rate
of 24.8. Nash County did not meet the Healthy People 2010 mortality rate goal (22.3 female breast
cancer deaths per 100,000).[4][5] The average annual percentage change in death rates declined at -2.0
percent (95% CI -3.9, -0.1) for 2003-2007. Female breast cancer mortality rates (2003-2007) per 100,000
by race were 23.9 (95% CI 17.4, 32.2) for whites, and 36.1 (95% CI 24.3, 51.6) for African Americans.[4]
Exhibit 103. Colorectal Cancer Incidence and Mortality Rates per 100,000 persons
Nash County North Carolina
CRC Incidence (2004-2008)* 55.1 46.8
CRC Mortality (2003-2007) 20.4 17.3
*Age-Adjusted
Source: NCI, State Cancer Profiles
Exhibit 104. Invasive Female Breast Cancer Incidence and Mortality Rates per 100,000 persons
Nash County North Carolina
Breast Cancer Incidence (2004-2008)* 132.7 123.3
Breast Cancer Mortality (2003-2007) 27.9 24.8
*Age-Adjusted
Source: NCI, State Cancer Profiles

78
Cervix See Eastern North Carolina rates. Nash County data for cervical cancer incidence and mortality rates were suppressed due to small numbers. Risk Factors and Screening
Nash County residents had a higher prevalence of smoking, obesity and diabetes compared to NC
statewide, but reported greater mammography in the Medicare-enrolled females than statewide.
0%
10%
20%
30%
40%
50%
60%
70%
80%
% Smoker % Obese % Alcohol % Diabetes % Mammogram
Exhibit 105. Adult Respondents, Nash County, North Carolina Behavioral Risk Factor Surveillance System, 2003-2009
Nash County North Carolina
Sources: County Health Rankings, North Carolina County Health Rankings; North Carolina Data Health Explorer; NC DHHS, SCHS, BRFSS Survey Results, 2005-2009 Exhibit 106. Adult Respondents, Nash County, North Carolina Behavioral Risk Factor Surveillance System, 2003-2009
a. 2003-2009, Percent of adults that report smoking ≥100 cigarettes and currently smoking [3]
b. 2008, Percent of adults that report a BMI ≥30 [3]
c. 2003-2009, Percent of the adult population that reports either binge drinking, defined as consuming more than 4 (women) or 5 (men)
alcoholic beverages on a single occasion in the past 30 days, or heavy drinking, defined as drinking more than 1 (women) or 2 (men) drinks per
day on average [3]
d. 2005-2009, Percent, Has a doctor told you that you have diabetes, Yes response. [6][7]
e. 2006-2007, Percent of female Medicare enrollees age 67-69 that had at least one mammogram over a two-year period [3]
Sources: County Health Rankings, North Carolina County Health Rankings; North Carolina Data Health Explorer; NC DHHS, SCHS, BRFSS Survey Results, 2005-2009
Factor
% Smokera % Obeseb % Alcoholc % Diabetesd % Mammograme
Nash County 23% 32% 14% 11% 72%
North Carolina 22% 29% 12% 9% 67%

79
White39%African
American58%
Other3%
Exhibit 107. Northampton County by Race, 2010
NORTHAMPTON COUNTY
Social and Economic Indicators
Based on number of persons employed, in 2011 the largest industry in Northampton County was retail
trade.[1] The median household income (2009) was $31,355 for a family of four, compared to $43,754
statewide. The percentage of persons living below the poverty level in 2009 was 25%, compared to 16%
statewide.[2] Unemployment (civilian, not in labor force, 2009) in Northampton County was 11%,
compared to 10.6% statewide. The estimated high school graduation rate was 83%, based on the cohort
of ninth graders that graduated from high school in four years, compared to 78% in North Carolina. In
2007, the adult uninsured population (≥ age 18-64) was 15%, compared to 21% statewide. Four
physicians provided primary care in Northampton County (2008), which was a population to primary
care physician ratio of 5,155 to 1.[3]
Demographics
Based on data from the 2010 U.S. Census,
Northampton County had a total population of
22,099 with 41 persons per square mile. The
county population was 21% children (<18), 59%
adults ages 18-64, and 20% elders. Northampton
County was 58% African American (AA) (22% AA
statewide) and 39% white (69% white statewide).
Latinos/Hispanics (any race) comprised 1% of the
population in Northampton County (8%
statewide) (Exhibit 107). The overall county
population was 52% female and 48% male.[2]
Cancer Surveillance
Colon and Rectal Cancers (CRC)
Incidence
In Northampton County, the CRC age-adjusted incidence rate for 2004-2008 was 43.9 (95% CI 33.7, 56.5)
per 100,000, which was lower than the overall statewide CRC rate of 46.8 (95% CI 46.1, 47.4). On
average, there were 13 new cases of CRC diagnosed in Northampton County, and 4,720 new cases
across the state for 2004-2008. The CRC age-adjusted incidence rates per 100,000 were 58.6 (95% CI
40.5, 82.4) for males and 32.0 (95% CI 21.2, 47.5) for females. By race, the CRC age-adjusted incidence
rates per 100,000 were 36.3 (95% CI 23.6, 55.3) for whites, and 48.7 (95% CI 34.1, 67.9) for African
Americans.[4]
Mortality
In Northampton County, CRC mortality rates for 2003-2007 were stable and were similar to the North
Carolina rates (all races, both sexes). The CRC mortality rate (2003-2007) was 18.9 (95% CI 12.6, 27.5)
per 100,000 which was higher than the overall statewide CRC mortality rate of 17.3 (95% CI 17.0, 17.7).
Source: U.S. Census Bureau, State and County
Quickfacts: North Carolina

80
Northampton County did not meet the Healthy People 2010 mortality rate goal (13.9 CRC deaths per
100,000).[4][5] The average annual percentage change in death rates declined at -1.2 percent (95% CI -
2.5, 0.2) for 2003-2007. The CRC mortality rates (2003-2007) by gender were suppressed due to small
numbers of deaths. The CRC mortality rate (2003-2007) per 100,000 by race was suppressed for whites
due to small numbers of deaths, and the rate for African Americans was 22.3 (95% CI 13.0, 36.2).[4]
Female Breast
Incidence
In Northampton County, the breast cancer (female, invasive) age-adjusted incidence rate for 2004-2008
was 122.2 (95% CI 97.4, 152.0) per 100,000, which was lower than the overall statewide breast cancer
rate of 123.3 (95% CI 121.9-124.7). On average, there were 19 new cases of invasive female breast
cancer diagnosed in Northampton County and 6,189 new cases across the state for 2004-2008. Female
breast cancer age-adjusted incidence rates were 134.0 (95% CI 93.7, 187.9) for whites, and 113.6 (95%
CI 82.9, 152.9) for African Americans.[4]
Mortality
In Northampton County, female breast cancer mortality rates for 2003-2007 increased and were similar
to the North Carolina rates (all races). The female breast cancer mortality rate (2003-2007) was 35.1
(95% CI 22.8, 52.4) per 100,000, which was higher than the overall statewide female breast cancer
mortality rate of 24.8. Northampton County did not meet the Healthy People 2010 mortality rate goal
(22.3 female breast cancer deaths per 100,000).[4][5] The average annual percentage change in death
rates increased at 0.3 percent (95% CI -1.5, 2.1) for 2003-2007. The female breast cancer mortality rate
(2003-2007) per 100,000 by race was suppressed for whites due to small numbers of deaths, and the
rate for African Americans was 39.5 (95% CI 23.1, 64.2).[4]
Exhibit 108. Colorectal Cancer Incidence and Mortality Rates per 100,000 persons
Northampton County North Carolina
CRC Incidence (2004-2008)* 43.9 46.8
CRC Mortality (2003-2007) 18.9 17.3
*Age-Adjusted
Source: NCI, State Cancer Profiles
Exhibit 109. Invasive Female Breast Cancer Incidence and Mortality Rates per 100,000 persons
Northampton County North Carolina
Breast Cancer Incidence (2004-2008)* 122.2 123.3
Breast Cancer Mortality (2003-2007) 35.1 24.8
*Age-Adjusted
Source: NCI, State Cancer Profiles

81
Cervix See Eastern North Carolina rates. Northampton County data for cervical cancer incidence and mortality rates were suppressed due to small numbers. Risk Factors and Screening
Northhampton County residents had a higher prevalence of obesity and diabetes compared to NC
statewide.
0%
10%
20%
30%
40%
50%
60%
70%
80%
% Smoker % Obese % Alcohol % Diabetes % Mammogram
Exhibit 110. Adult Respondents, Northampton County, North Carolina Behavioral Risk Factor Surveillance System, 2003-2009
Northampton County North Carolina
Sources: County Health Rankings, North Carolina County Health Rankings;
North Carolina Data Health Explorer; NC DHHS, SCHS, BRFSS Survey Results, 2005-2009
Exhibit 111. Adult Respondents, Northampton County, North Carolina
Behavioral Risk Factor Surveillance System, 2005-2009
a. 2003-2009, Percent of adults that report smoking ≥100 cigarettes and currently smoking [3]
b. 2008, Percent of adults that report a BMI ≥30 [3]
c. 2003-2009, Percent of the adult population that reports either binge drinking, defined as consuming more than 4 (women) or 5 (men)
alcoholic beverages on a single occasion in the past 30 days, or heavy drinking, defined as drinking more than 1 (women) or 2 (men) drinks per
day on average [3]
d. 2005-2009, Percent, Has a doctor told you that you have diabetes, Yes response. [6][7]
e. 2006-2007, Percent of female Medicare enrollees age 67-69 that had at least one mammogram over a two-year period [3]
Sources: County Health Rankings, North Carolina County Health Rankings; North Carolina Data Health Explorer; NC DHHS, SCHS, BRFSS Survey Results, 2005-2009
Factor
% Smokera % Obeseb % Alcoholc % Diabetesd % Mammograme
Northampton County 22% 36% 9% 15% 69%
North Carolina 22% 29% 12% 9% 67%

82
White74%
African American
16%
Other10%
Exhibit 112. Onslow County by Race, 2010
ONSLOW COUNTY
Social and Economic Indicators
Based on number of persons employed, in 2011 the largest industry in Onslow County was retail
trade.[1] Camp Lejeune, a Marine military base, is located within Onslow County. The median
household income (2009) was $41,161 for a family of four, compared to $43,754 statewide. The
percentage of persons living below the poverty level in 2009 was 15%, compared to 16% statewide.[2]
Unemployment (civilian, not in labor force, 2009) in Onslow County was 8%, compared to 10.6%
statewide. The estimated high school graduation rate (2010) was 85%, based on the cohort of ninth
graders that graduated from high school in four years, compared to 78% in North Carolina. In 2007, the
adult uninsured population (≥ age 18-64) was 25%, compared to 21% statewide. One-Hundred and eight
physicians provided primary care in Onslow County (2008), which was a population to primary care
physician ratio of 1,567 to 1.[3]
Demographics
Based on data from the 2010 U.S. Census,
Onslow County had a total population of
177,772 with 233 persons per square mile. The
county population was 25% children (<18), 67%
adults ages 18-64, and 8% elders. Onslow
County was 16% African American (AA) (22% AA
statewide) and 74% white (69% white
statewide). Latinos/Hispanics (any race)
comprised 10% of the population in Onslow
County (8% statewide) (Exhibit 112). The overall
county population was 46% female and 54%
male.[2]
Cancer Surveillance
Colon and Rectal Cancers (CRC)
Incidence
In Onslow County, the CRC age-adjusted incidence rate for 2004-2008 was 47.0 (95% CI 40.9, 53.7) per
100,000, which was higher than the overall statewide CRC rate of 46.8 (95% CI 46.1, 47.4). On average,
there were 46 new cases of CRC diagnosed in Onslow County, and 4,720 new cases across the state for
2004-2008. The CRC age-adjusted incidence rates per 100,000 were 60.4 (95% CI 50.0, 72.1) for males
and 35.0 (95% CI 28.2, 42.9) for females. By race, the CRC age-adjusted incidence rates per 100,000
were 49.9 (95% CI 42.9, 57.7) for whites, and 35.8 (95% CI 24.0, 51.0) for African Americans.[4]
Mortality
In Onslow County, CRC mortality rates for 2003-2007 declined and were similar to the North Carolina
rates (all races, both sexes). The CRC mortality rate (2003-2007) was 15.7 (95% CI 12.2, 19.8) per
Source: U.S. Census Bureau, State and County
Quickfacts: North Carolina

83
100,000 which was lower than the overall statewide CRC mortality rate of 17.3 (95% CI 17.0, 17.7).
Onslow County did not meet the Healthy People 2010 mortality rate goal (13.9 CRC deaths per
100,000).[4][5] The average annual percentage change in death rates declined at -1.5 percent (95% CI -
2.9, -0.2) for 2003-2007. The CRC mortality rates (2003-2007) by gender were 12.8 (95% CI 8.8, 17.9) for
females and 18.7 (95% CI 13.0, 25.9) for males per 100,000. The CRC mortality rate (2003-2007) per
100,000 by race was 15.7 (95% CI 11.8, 20.3) for whites, and the rate for African Americans was
suppressed due to small numbers of deaths.[4]
Female Breast
Incidence
In Onslow County, the breast cancer (female, invasive) age-adjusted incidence rate for 2004-2008 was
128.8 (95% CI 116.0, 142.7) per 100,000, which was higher than the overall statewide breast cancer rate
of 123.3 (95% CI 121.9-124.7). On average, there were 75 new cases of invasive female breast cancer
diagnosed in Onslow County and 6,189 new cases across the state for 2004-2008. Female breast cancer
age-adjusted incidence rates were 127.9 (95% CI 113.4, 143.7) for whites, and 138.6 (95% CI 107.7,
175.2) for African Americans.[4]
Mortality
In Onslow County, female breast cancer mortality rates for 2003-2007 increased and were similar to the
North Carolina rates (all races). The female breast cancer mortality rate (2003-2007) was 24.3 (95% CI
18.9, 30.8) per 100,000, which was lower than the overall statewide female breast cancer mortality rate
of 24.8. Onslow County did not meet the Healthy People 2010 mortality rate goal (22.3 female breast
cancer deaths per 100,000).[4][5] The average annual percentage change in death rates declined at -1.0
percent (95% CI -2.4, 0.5) for 2003-2007. Female breast cancer mortality rates (2003-2007) per 100,000
by race were 21.6 (95% CI 15.8, 28.8) for whites, and 35.4 (95% CI 21.3, 55.1) for African Americans.[4]
Exhibit 113. Colorectal Cancer Incidence and Mortality Rates per 100,000 persons
Onslow County North Carolina
CRC Incidence (2004-2008)* 47.0 46.8
CRC Mortality (2003-2007) 15.7 17.3
*Age-Adjusted
Source: NCI, State Cancer Profiles
Exhibit 114. Invasive Female Breast Cancer Incidence and Mortality Rates per 100,000 persons
Onslow County North Carolina
Breast Cancer Incidence (2004-2008)* 128.8 123.3
Breast Cancer Mortality (2003-2007) 24.3 24.8 *Age-Adjusted
Source: NCI, State Cancer Profiles

84
Cervix See Eastern North Carolina rates. Onslow County data for cervical cancer incidence and mortality rates were suppressed due to small numbers. Risk Factors and Screening
Onslow County residents had a higher prevalence of smoking, obesity and alcohol consumption
compared to NC statewide.
0%
10%
20%
30%
40%
50%
60%
70%
80%
% Smoker % Obese % Alcohol % Diabetes % Mammogram
Exhibit 115. Adult Respondents, Onslow County, North Carolina Behavioral Risk Factor Surveillance System, 2003-2009
Onslow County North Carolina
Sources: County Health Rankings, North Carolina County Health Rankings; North Carolina Data Health Explorer; NC DHHS, SCHS, BRFSS Survey Results, 2005-2009
Exhibit 116. Adult Respondents, Onslow County, North Carolina Behavioral Risk Factor Surveillance System, 2003-2009
a. 2003-2009, Percent of adults that report smoking ≥100 cigarettes and currently smoking [3]
b. 2008, Percent of adults that report a BMI ≥30 [3]
c. 2003-2009, Percent of the adult population that reports either binge drinking, defined as consuming more than 4 (women) or 5 (men)
alcoholic beverages on a single occasion in the past 30 days, or heavy drinking, defined as drinking more than 1 (women) or 2 (men) drinks per
day on average [3]
d. 2005-2009, Percent, Has a doctor told you that you have diabetes, Yes response. [6][7]
e. 2006-2007, Percent of female Medicare enrollees age 67-69 that had at least one mammogram over a two-year period [3]
Sources: County Health Rankings, North Carolina County Health Rankings; North Carolina Data Health Explorer; NC DHHS, SCHS, BRFSS Survey Results, 2005-2009
Factor
% Smokera % Obeseb % Alcoholc % Diabetesd % Mammograme
Onslow County 25% 31% 16% 8% 69%
North Carolina 22% 29% 12% 9% 67%

85
White76%
African American
20%
Other4%
Exhibit 117. Pamlico County by Race, 2010
PAMLICO COUNTY
Social and Economic Indicators
Based on number of persons employed, in 2011 the largest industry in Pamlico County was retail
trade.[1] The median household income (2009) was $39,918 for a family of four, compared to $43,754
statewide. The percentage of persons living below the poverty level in 2009 was 19%, compared to 16%
statewide.[2] Unemployment (civilian, not in labor force, 2009) in Pamlico County was 9%, compared to
10.6% statewide. The estimated high school graduation rate (2010) was 85%, based on the cohort of
ninth graders that graduated from high school in four years, compared to 78% in North Carolina. In
2007, the adult uninsured population (≥ age 18-64) was 25%, compared to 21% statewide. Eight
physicians provided primary care in Pamlico County (2008), which was a population to primary care
physician ratio of 1,555 to 1.[3]
Demographics
Based on data from the 2010 U.S. Census, Pamlico
County had a total population of 13,144 with 39
persons per square mile. The county population
was 18% children (<18), 60% adults ages 18-64,
and 22% elders. Pamlico County was 20% African
American (AA) (22% AA statewide) and 76% white
(69% white statewide). Latinos/Hispanics (any
race) comprised 3% of the population in Pamlico
County (8% statewide) (Exhibit 117). The overall
county population was 49% female and 51%
male.[2]
Cancer Surveillance
Colon and Rectal Cancers (CRC)
Incidence
In Pamlico County, the CRC age-adjusted incidence rate for 2004-2008 was 32.9 (95% CI 22.3, 47.9) per
100,000, which was lower than the overall statewide CRC rate of 46.8 (95% CI 46.1, 47.4). On average,
there were 7 new cases of CRC diagnosed in Pamlico County, and 4,720 new cases across the state for
2004-2008. The CRC age-adjusted incidence rate per 100,000 was 50.5 (95% CI 31.9, 78.1) for males and
the rate for females was suppressed due to small numbers of cases. By race, the CRC age-adjusted
incidence rate per 100,000 was 34.0 (95% CI 21.7, 52.2) for whites, and the rate for African Americans
was suppressed due to small numbers of cases.[4]
Source: U.S. Census Bureau, State and County
Quickfacts: North Carolina

86
Mortality
In Pamlico County, CRC mortality rates (2003-2007) per 100,000 were suppressed due to small numbers
of deaths.[4]
Female Breast
Incidence
In Pamlico County, the breast cancer (female, invasive) age-adjusted incidence rate for 2004-2008 was
113.0 (95% CI 83.7, 151.1) per 100,000, which was lower than the overall statewide breast cancer rate of
123.3 (95% CI 121.9-124.7). On average, there were 11 new cases of invasive female breast cancer
diagnosed in Pamlico County and 6,189 new cases across the state for 2004-2008. Female breast cancer
age-adjusted incidence rates were 86.5 (95% CI 59.5, 124.8) for whites, and 207.8 (95% CI 122.7, 337.6)
for African Americans.[4]
Mortality
In Pamlico County, the female breast cancer mortality rate in (2003-2007) was 35.0 (95% CI 19.2, 60.2)
per 100,000, which was higher than the overall statewide female breast cancer mortality rate of 24.8.
Pamlico County did not meet the Healthy People 2010 mortality rate goal (22.3 female breast cancer
deaths per 100,000).[3][4] The average annual percentage change in death rates, as well as the female
breast cancer mortality rates (2003-2007) per 100,000 by race, were suppressed due to small numbers
of deaths.
Cervix
See Eastern North Carolina rates. Pamlico County data for cervical cancer incidence and mortality rates
were suppressed due to small numbers.
Exhibit 118. Colorectal Cancer Incidence and Mortality Rates per 100,000 persons
Pamlico County North Carolina
CRC Incidence (2004-2008)* 32.9 46.8
CRC Mortality (2003-2007) ** 17.3
*Age-Adjusted
**Suppressed due to small numbers
Source: NCI, State Cancer Profiles
Exhibit 119. Invasive Female Breast Cancer Incidence and Mortality Rates per 100,000 persons
Pamlico County North Carolina
Breast Cancer Incidence (2004-2008)* 113.0 123.3
Breast Cancer Mortality (2003-2007) 35.0 24.8
*Age-Adjusted
Source: NCI, State Cancer Profiles
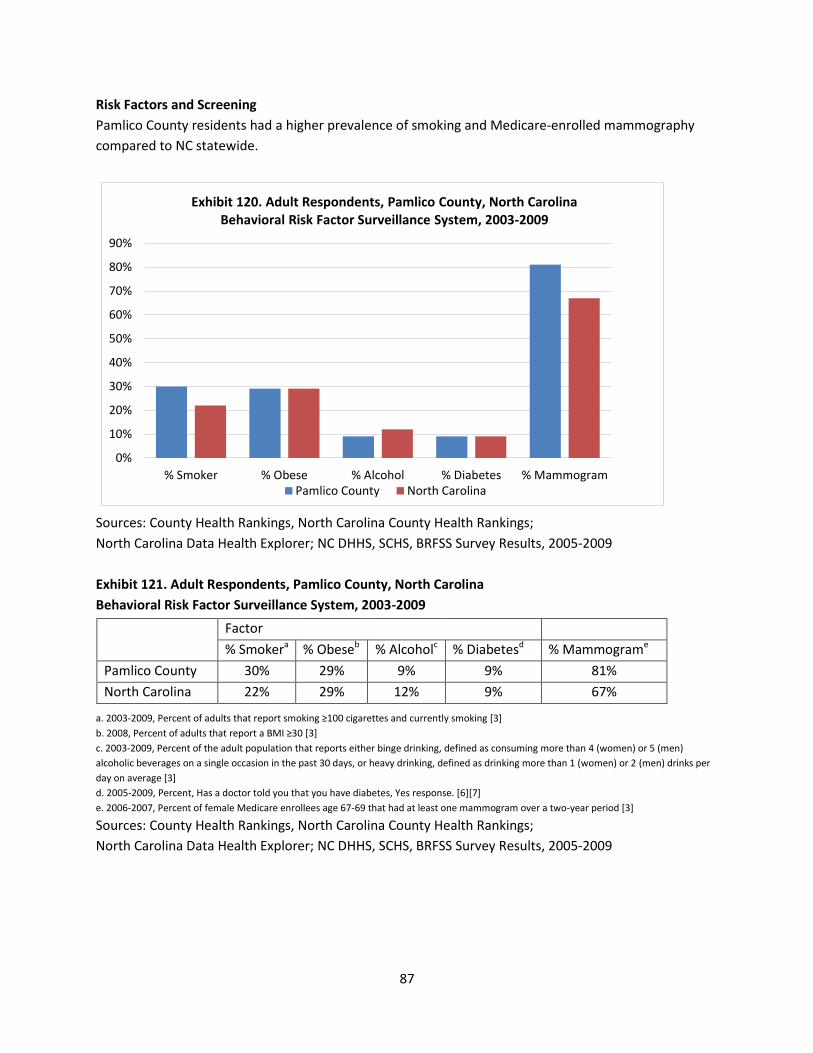
87
Risk Factors and Screening
Pamlico County residents had a higher prevalence of smoking and Medicare-enrolled mammography
compared to NC statewide.
0%
10%
20%
30%
40%
50%
60%
70%
80%
90%
% Smoker % Obese % Alcohol % Diabetes % Mammogram
Exhibit 120. Adult Respondents, Pamlico County, North Carolina Behavioral Risk Factor Surveillance System, 2003-2009
Pamlico County North Carolina
Sources: County Health Rankings, North Carolina County Health Rankings;
North Carolina Data Health Explorer; NC DHHS, SCHS, BRFSS Survey Results, 2005-2009
Exhibit 121. Adult Respondents, Pamlico County, North Carolina
Behavioral Risk Factor Surveillance System, 2003-2009
a. 2003-2009, Percent of adults that report smoking ≥100 cigarettes and currently smoking [3]
b. 2008, Percent of adults that report a BMI ≥30 [3]
c. 2003-2009, Percent of the adult population that reports either binge drinking, defined as consuming more than 4 (women) or 5 (men)
alcoholic beverages on a single occasion in the past 30 days, or heavy drinking, defined as drinking more than 1 (women) or 2 (men) drinks per
day on average [3]
d. 2005-2009, Percent, Has a doctor told you that you have diabetes, Yes response. [6][7]
e. 2006-2007, Percent of female Medicare enrollees age 67-69 that had at least one mammogram over a two-year period [3]
Sources: County Health Rankings, North Carolina County Health Rankings;
North Carolina Data Health Explorer; NC DHHS, SCHS, BRFSS Survey Results, 2005-2009
Factor
% Smokera % Obeseb % Alcoholc % Diabetesd % Mammograme
Pamlico County 30% 29% 9% 9% 81%
North Carolina 22% 29% 12% 9% 67%

88
White57%
African American
38%
Other5%
Exhibit 122. Pasquotank County by Race, 2010
PASQUOTANK COUNTY
Social and Economic Indicators
Based on number of persons employed, in 2011 the largest industry in Pasquotank County was retail
trade.[1] The median household income (2009) was $39,370 for a family of four, compared to $43,754
statewide. The percentage of persons living below the poverty level in 2009 was 18%, compared to 16%
statewide.[2] Unemployment (civilian, not in labor force, 2009) in Pasquotank County was 10%,
compared to 10.6% statewide. The estimated high school graduation rate (2010) was 76%, based on the
cohort of ninth graders that graduated from high school in four years, compared to 78% in North
Carolina. In 2007, the adult uninsured population (≥ age 18-64) was 21%, compared to 21% statewide.
Forty physicians provided primary care in Pasquotank County (2008), which was a population to primary
care physician ratio of 1,036 to 1.[3]
Demographics
Based on data from the 2010 U.S. Census,
Pasquotank County had a total population of
40,661 with 179 persons per square mile. The
county population was 23% children (<18), 63%
adults ages 18-64, and 14% elders. Pasquotank
County was 38% African American (AA) (22% AA
statewide) and 57% white (69% white statewide).
Latinos/Hispanics (any race) comprised 4% of the
population in Pasquotank County (8% statewide)
(Exhibit 122). The overall county population was
51% female and 49% male.[2]
Cancer Surveillance
Colon and Rectal Cancers (CRC)
Incidence
In Pasquotank County, the CRC age-adjusted incidence rate for 2004-2008 was 49.3 (95% CI 40.1, 59.9)
per 100,000, which was higher than the overall statewide CRC rate of 46.8 (95% CI 46.1, 47.4). On
average, there were 20 new cases of CRC diagnosed in Pasquotank County, and 4,720 new cases across
the state for 2004-2008. The CRC age-adjusted incidence rates per 100,000 were 55.3 (95% CI 40.7, 73.4)
for males and 42.8 (95% CI 31.8, 56.4) for females. By race, the CRC age-adjusted incidence rates per
100,000 were 44.4 (95% CI 33.9, 57.3) for whites, and 61.6 (95% CI 44.1, 83.5) for African Americans.[4]
Mortality
In Pasquotank County, CRC mortality rates for 2003-2007 declined and were similar to the North
Carolina rates (all races, both sexes). The CRC mortality rate (2003-2007) was 17.7 (95% CI 12.3, 24.5)
per 100,000 which was higher than the overall statewide CRC mortality rate of 17.3 (95% CI 17.0, 17.7).
Pasquotank County did not meet the Healthy People 2010 mortality rate goal (13.9 CRC deaths per
Source: U.S. Census Bureau, State and County
Quickfacts: North Carolina

89
100,000).[4][5] The average annual percentage change in death rates declined at -1.5 percent (95% CI -
2.9, 0.0) for 2003-2007. The CRC mortality rate (2003-2007) by gender was 17.9 (95% CI 11.1, 27.6) for
females and the rate for males was suppressed due to small numbers of deaths. The CRC mortality rate
(2003-2007) per 100,000 by race was 19.0 (95% CI 12.4, 28.2) for whites, and the rate for African
Americans was suppressed due to small numbers of deaths.[4]
Female Breast
Incidence
In Pasquotank County, the breast cancer (female, invasive) age-adjusted incidence rate for 2004-2008
was 123.3 (95% CI 103.6, 145.8) per 100,000, which was the same as the overall statewide breast cancer
rate of 123.3 (95% CI 121.9-124.7). On average, there were 29 new cases of invasive female breast
cancer diagnosed in Pasquotank County and 6,189 new cases across the state for 2004-2008. Female
breast cancer age-adjusted incidence rates were 110.5 (95% CI 87.4, 138.2) for whites, and 146.7 (95%
CI 111.1, 190.0) for African Americans.[4]
Mortality
In Pasquotank County, female breast cancer mortality rates for 2003-2007 increased and were similar to
the North Carolina rates (all races). The female breast cancer mortality rate (2003-2007) was 32.1 (95%
CI 22.5, 44.7) per 100,000, which was higher than the overall statewide female breast cancer mortality
rate of 24.8. Pasquotank County did not meet the Healthy People 2010 mortality rate goal (22.3 female
breast cancer deaths per 100,000).[4][5] The average annual percentage change in death rates declined
at -0.3 percent (95% CI -1.4, 0.9) for 2003-2007. The female breast cancer mortality rate (2003-2007)
per 100,000 by race was 30.3 (95% CI 19.0, 46.2) for whites, and the rate for African Americans was
suppressed due to small numbers of deaths.[4]
Exhibit 123. Colorectal Cancer Incidence and Mortality Rates per 100,000 persons
Pasquotank County North Carolina
CRC Incidence (2004-2008)* 49.3 46.8
CRC Mortality (2003-2007) 17.7 17.3
*Age-Adjusted
Source: NCI, State Cancer Profiles
Exhibit 124. Invasive Female Breast Cancer Incidence and Mortality Rates per 100,000 persons
Pasquotank County North Carolina
Breast Cancer Incidence (2004-2008)* 123.3 123.3
Breast Cancer Mortality (2003-2007) 32.1 24.8
*Age-Adjusted
Source: NCI, State Cancer Profiles

90
Cervix
See Eastern North Carolina rates. Pasquotank County data for cervical cancer incidence and mortality
rates were suppressed due to small numbers.
Risk Factors and Screening
Pasquotank County residents had a higher prevalence of smoking, obesity, and alcohol consumption
compared to NC statewide. Mammography in Medicare-enrolled women is higher than statewide.
0%
10%
20%
30%
40%
50%
60%
70%
80%
% Smoker % Obese % Alcohol % Diabetes % Mammogram
Exhibit 125. Adult Respondents, Pasquotank County, North Carolina Behavioral Risk Factor Surveillance System, 2003-2009
Pasquotank County North Carolina
Sources: County Health Rankings, North Carolina County Health Rankings;
North Carolina Data Health Explorer; NC DHHS, SCHS, BRFSS Survey Results, 2005-2009
Exhibit 126. Adult Respondents, Pasquotank County, North Carolina
Behavioral Risk Factor Surveillance System, 2003-2009
a. 2003-2009, Percent of adults that report smoking ≥100 cigarettes and currently smoking [3]
b. 2008, Percent of adults that report a BMI ≥30 [3]
c. 2003-2009, Percent of the adult population that reports either binge drinking, defined as consuming more than 4 (women) or 5 (men)
alcoholic beverages on a single occasion in the past 30 days, or heavy drinking, defined as drinking more than 1 (women) or 2 (men) drinks per
day on average [3]
d. 2005-2009, Percent, Has a doctor told you that you have diabetes, Yes response. [6][7]
e. 2006-2007, Percent of female Medicare enrollees age 67-69 that had at least one mammogram over a two-year period [3]
Sources: County Health Rankings, North Carolina County Health Rankings; North Carolina Data Health Explorer; NC DHHS, SCHS, BRFSS Survey Results, 2005-2009
Factor
% Smokera % Obeseb % Alcoholc % Diabetesd % Mammograme
Pasquotank County 30% 32% 16% 8% 72%
North Carolina 22% 29% 12% 9% 67%

91
White72%
African American
25%
Other3%
Exhibit 127. Perquimans County by Race, 2010
PERQUIMANS COUNTY
Social and Economic Indicators
Based on number of persons employed, in 2011 the largest industry in Perquimans County was
educational services.[1] The median household income (2009) was $37,284 for a family of four,
compared to $43,754 statewide. The percentage of persons living below the poverty level in 2009 was
17%, compared to 16% statewide.[2] Unemployment (civilian, not in labor force, 2009) in Perquimans
County was 10%, compared to 10.6% statewide. The estimated high school graduation rate (2010) was
83%, based on the cohort of ninth graders that graduated from high school in four years, compared to
78% in North Carolina. In 2007, the adult uninsured population (≥ age 18-64) was 23%, compared to
21% statewide. Four physicians provided primary care in Perquimans County (2008), which was a
population to primary care physician ratio of 3,193 to 1.[3]
Demographics
Based on data from the 2010 U.S. Census,
Perquimans County had a total population of
13,453 with 54 persons per square mile. The
county population was 21% children (<18), 57%
adults ages 18-64, and 22% elders. Perquimans
County was 25% African American (AA) (22% AA
statewide) and 72% white (69% white statewide).
Latinos/Hispanics (any race) comprised 2% of the
population in Perquimans County (8% statewide)
(Exhibit 127). The overall county population was
52% female and 48% male.[2]
Cancer Surveillance
Colon and Rectal Cancers (CRC)
Incidence
In Perquimans County, the CRC age-adjusted incidence rate for 2004-2008 was 52.7 (95% CI 39.1, 70.5)
per 100,000, which was higher than the overall statewide CRC rate of 46.8 (95% CI 46.1, 47.4). On
average, there were 10 new cases of CRC diagnosed in Perquimans County, and 4,720 new cases across
the state for 2004-2008. The CRC age-adjusted incidence rates per 100,000 were 82.3 (95% CI 56.8,
117.1) for males and 29.8 (95% CI 16.9, 51.1) for females. By race, the CRC age-adjusted incidence rate
per 100,000 was 53.6 (95% CI 38.0, 75.0) for whites, and the rate for African Americans was suppressed
due to small numbers of cases.[4]
Mortality
In Perquimans County, the CRC mortality rate (2003-2007) was 23.1 (95% CI 13.3, 37.7) per 100,000
which was higher than the overall statewide CRC mortality rate of 17.3 (95% CI 17.0, 17.7). Perquimans
County did not meet the Healthy People 2010 mortality rate goal (13.9 CRC deaths per 100,000).[4][5]
Source: U.S. Census Bureau, State and County
Quickfacts: North Carolina

92
The average annual percentage change in death rates was suppressed due to small numbers of deaths
for 2003-2007. The CRC mortality rates by gender and race were suppressed due to small numbers of
deaths.[4]
Female Breast
Incidence
In Perquimans County, the breast cancer (female, invasive) age-adjusted incidence rate for 2004-2008
was 113.9 (95% CI 83.5, 152.8) per 100,000, which was lower than the overall statewide breast cancer
rate of 123.3 (95% CI 121.9-124.7). On average, there were 11 new cases of invasive female breast
cancer diagnosed in Perquimans County and 6,189 new cases across the state for 2004-2008. The female
breast cancer age-adjusted incidence rate was 126.8 (95% CI 88.6, 177.4) for whites, and the rate for
African Americans was suppressed due to small numbers of cases.[4]
Mortality
In Perquimans County, female breast cancer mortality rates (2003-2007) per 100,000 were suppressed
due to small numbers of deaths.[4]
Cervix
See Eastern North Carolina rates. Perquimans County data for cervical cancer incidence and mortality
rates were suppressed due to small numbers.
Exhibit 128. Colorectal Cancer Incidence and Mortality Rates per 100,000 persons
Perquimans County North Carolina
CRC Incidence (2004-2008)* 52.7 46.8
CRC Mortality (2003-2007) 23.1 17.3
*Age-Adjusted
Source: NCI, State Cancer Profiles
Exhibit 129. Invasive Female Breast Cancer Incidence and Mortality Rates per 100,000 persons
Perquimans County North Carolina
Breast Cancer Incidence (2004-2008)* 113.9 123.3
Breast Cancer Mortality (2003-2007) ** 24.8
*Age-Adjusted
**Suppressed due to small numbers
Source: NCI, State Cancer Profiles

93
Risk Factors and Screening
Perquimans County residents had a higher prevalence of smoking and obesity compared to NC
statewide. Mammography is higher in Medicare-enrolled women than statewide.
0%
10%
20%
30%
40%
50%
60%
70%
80%
90%
% Smoker % Obese % Alcohol % Diabetes % Mammogram
Exhibit 130. Adult Respondents, Perquimans County, North Carolina Behavioral Risk Factor Surveillance System, 2003-2009
Perquimans County North Carolina
Sources: County Health Rankings, North Carolina County Health Rankings;
North Carolina Data Health Explorer; NC DHHS, SCHS, BRFSS Survey Results, 2005-2009
Exhibit 131. Adult Respondents, Perquimans County, North Carolina
Behavioral Risk Factor Surveillance System, 2003-2009
a. 2003-2009, Percent of adults that report smoking ≥100 cigarettes and currently smoking [3]
b. 2008, Percent of adults that report a BMI ≥30 [3]
c. 2003-2009, Percent of the adult population that reports either binge drinking, defined as consuming more than 4 (women) or 5 (men)
alcoholic beverages on a single occasion in the past 30 days, or heavy drinking, defined as drinking more than 1 (women) or 2 (men) drinks per
day on average [3]
d. 2005-2009, Percent, Has a doctor told you that you have diabetes, Yes response. [6][7]
e. 2006-2007, Percent of female Medicare enrollees age 67-69 that had at least one mammogram over a two-year period [3]
Sources: County Health Rankings, North Carolina County Health Rankings;
North Carolina Data Health Explorer; NC DHHS, SCHS, BRFSS Survey Results, 2005-2009
Factor
% Smokera % Obeseb % Alcoholc % Diabetesd % Mammograme
Perquimans County 25% 32% 13% 5% 81%
North Carolina 22% 29% 12% 9% 67%

94
White59%
African American
34%
Other7%
Exhibit 132. Pitt County by Race, 2010
PITT COUNTY
Social and Economic Indicators
Based on number of persons employed, in 2011 the largest industry in Pitt County was health care and
social assistance.[1]The median household income (2009) was $36,339 for a family of four, compared to
$43,754 statewide. The percentage of persons living below the poverty level in 2009 was 26%,
compared to 16% statewide.[2] Unemployment (civilian, not in labor force, 2009) in Pitt County was
10%, compared to 10.6% statewide. The estimated high school graduation rate (2010) was 66%, based
on the cohort of ninth graders that graduated from high school in four years, compared to 78% in North
Carolina. In 2007, the adult uninsured population (≥ age 18-64) was 22%, compared to 21% statewide.
There were 364 physicians in primary care in Pitt County (2008), which was a population to primary care
physician ratio of 428 to 1.[3] The ECU Brody School of Medicine and affiliated teaching hospital, Vidant
County Medical Center are located in Pitt County.
Demographics:
Based on data from the 2010 U.S. Census, Pitt
County had a total population of 168,148 with 258
persons per square mile. The county population
was 23% children (<18), 67% adults ages 18-64,
and 10% elders. Pitt County was 34% African
American (AA) (22% AA statewide) and 59% white
(69% white statewide). Latinos/Hispanics (any
race) comprised 6% of the population in Pitt
County (8% statewide) (Exhibit 132). The overall
county population was 53% female and 47%
male.[2]
Cancer Surveillance
Colon and Rectal Cancers (CRC)
Incidence
In Pitt County, the CRC age-adjusted incidence rate for 2004-2008 was 49.0 (95% CI 43.6, 54.7) per
100,000, which was higher than the overall statewide CRC rate of 46.8 (95% CI 46.1, 47.4). On average,
there were 62 new cases of CRC diagnosed in Pitt County, and 4,720 new cases across the state for
2004-2008. The CRC age-adjusted incidence rates per 100,000 were 57.7 (95% CI 48.6, 68.0) for males
and 44.0 (95% CI 37.3, 51.4) for females. By race, the CRC age-adjusted incidence rates per 100,000
were 44.2 (95% CI 38.1, 51.0) for whites, and 58.8 (95% CI 48.4, 70.6) for African Americans.[4]
Mortality
In Pitt County, CRC mortality rates for 2003-2007 declined and were similar to the North Carolina rates
(all races, both sexes). The CRC mortality rate (2003-2007) was 18.3 (95% CI 15.0, 22.1) per 100,000
which was higher than the overall statewide CRC mortality rate of 17.3 (95% CI 17.0, 17.7). Pitt County
Source: U.S. Census Bureau, State and County
Quickfacts: North Carolina

95
did not meet the Healthy People 2010 mortality rate goal (13.9 CRC deaths per 100,000).[4][5] The
average annual percentage change in death rates declined at -7.2 percent (95% CI -12.5, -1.6) for 2003-
2007. The CRC mortality rates (2003-2007) by gender were 14.7 (95% CI 11.0, 19.3) for females and 25.0
(95% CI 18.7, 32.7) for males per 100,000. CRC mortality rates (2003-2007) per 100,000 by race were
14.6 (95% CI 11.1, 18.8) for whites, and 26.6 (95% CI 19.6, 35.2) for African Americans.[4]
Female Breast
Incidence
In Pitt County, the breast cancer (female, invasive) age-adjusted incidence rate for 2004-2008 was 145.2
(95% CI 133.0, 158.3) per 100,000, which was higher than the overall statewide breast cancer rate of
123.3 (95% CI 121.9-124.7). On average, there were 104 new cases of invasive female breast cancer
diagnosed in Pitt County and 6,189 new cases across the state for 2004-2008. Female breast cancer age-
adjusted incidence rates were 143.9 (95% CI 128.9, 160.2) for whites, and 144.8 (95% CI 124.0, 168.0)
for African Americans.[4]
Mortality
In Pitt County, female breast cancer mortality rates for 2003-2007 declined and were similar to the
North Carolina rates (all races). The female breast cancer mortality rate (2003-2007) was 26.3 (95% CI
21.2, 32.3) per 100,000, which was higher than the overall statewide female breast cancer mortality rate
of 24.8. Pitt County did not meet the Healthy People 2010 mortality rate goal (22.3 female breast
cancer deaths per 100,000).[4][5] The average annual percentage change in death rates declined at -1.1
percent (95% CI -2.1, 0.0) for 2003-2007. Female breast cancer mortality rates (2003-2007) per 100,000
by race were 20.4 (95% CI 14.9, 27.1) for whites, and 38.3 (95% CI 27.8, 51.3) for African Americans.[4]
Cervix
See Eastern North Carolina rates. Pitt County data for cervical cancer incidence and mortality rates were
suppressed due to small numbers.
Exhibit 133. Colorectal Cancer Incidence and Mortality Rates per 100,000 persons
Pitt County North Carolina
CRC Incidence (2004-2008)* 49.0 46.8
CRC Mortality (2003-2007) 18.3 17.3
*Age-Adjusted
Source: NCI, State Cancer Profiles
Exhibit 134. Invasive Female Breast Cancer Incidence and Mortality Rates per 100,000 persons
Pitt County North Carolina
Breast Cancer Incidence (2004-2008)* 145.2 123.3
Breast Cancer Mortality (2003-2007) 26.3 24.8
*Age-Adjusted
Source: NCI, State Cancer Profiles

96
Risk Factors and Screening
Pitt County residents had a higher prevalence of obesity compared to NC statewide, but reported less
smoking.
0%
10%
20%
30%
40%
50%
60%
70%
80%
% Smoker % Obese % Alcohol % Diabetes % Mammogram
Exhibit 135. Adult Respondents, Pitt County, North Carolina Behavioral Risk Factor Surveillance System, 2003-2009
Pitt County North Carolina
Sources: County Health Rankings, North Carolina County Health Rankings;
North Carolina Data Health Explorer; NC DHHS, SCHS, BRFSS Survey Results, 2005-2009
Exhibit 136. Adult Respondents, Pitt County, North Carolina
Behavioral Risk Factor Surveillance System, 2003-2009
a. 2003-2009, Percent of adults that report smoking ≥100 cigarettes and currently smoking [3]
b. 2008, Percent of adults that report a BMI ≥30 [3]
c. 2003-2009, Percent of the adult population that reports either binge drinking, defined as consuming more than 4 (women) or 5 (men)
alcoholic beverages on a single occasion in the past 30 days, or heavy drinking, defined as drinking more than 1 (women) or 2 (men) drinks per
day on average [3]
d. 2005-2009, Percent, Has a doctor told you that you have diabetes, Yes response. [6][7]
e. 2006-2007, Percent of female Medicare enrollees age 67-69 that had at least one mammogram over a two-year period [3]
Sources: County Health Rankings, North Carolina County Health Rankings;
North Carolina Data Health Explorer; NC DHHS, SCHS, BRFSS Survey Results, 2005-2009
Factor
% Smokera % Obeseb % Alcoholc % Diabetesd % Mammograme
Pitt County 20% 33% 11% 9% 66%
North Carolina 22% 29% 12% 9% 67%

97
White55%
African American
38%
Other7%
Exhibit 137. Tyrrell County by Race, 2010
TYRRELL COUNTY
Social and Economic Indicators
Based on number of persons employed, in 2011 the largest industry in Tyrrell County was public
administration.[1] The median household income (2009) was $30,058 for a family of four, compared to
$43,754 statewide. The percentage of persons living below the poverty level in 2009 was 29%,
compared to 16% statewide.[2] Unemployment (civilian, not in labor force, 2009) in Tyrrell County was
10%, compared to 10.6% statewide. The estimated high school graduation rate (2010) was 59%, based
on the cohort of ninth graders that graduated from high school in four years, compared to 78% in North
Carolina. In 2007, the adult uninsured population (≥ age 18-64) was 29%, compared to 21% statewide.
There are 0 physicians in primary care in Tyrrell County (2008), which was a population to primary care
physician ratio of 4,104 to 1.*[3] *Data unreliable.
Demographics:
Based on data from the 2010 U.S. Census, Tyrrell
County had a total population of 4,407 with 11
persons per square mile. The county population
was 18% children (<18), 65% adults ages 18-64,
and 17% elders. Tyrrell County was 38% African
American (AA) (22% AA statewide) and 55%
white (69% white statewide). Latinos/Hispanics
(any race) comprised 5% of the population in
Tyrrell County (8% statewide) (Exhibit 137). The
overall county population was 45% female and
55% male.[2]
Cancer Surveillance
Colon and Rectal Cancers (CRC)
Incidence
In Tyrrell County, the CRC age-adjusted incidence rate for 2004-2008 was suppressed due to small
numbers of cases. On average, there were 3 or fewer new cases of CRC diagnosed in Tyrrell County, and
4,720 new cases across the state for 2004-2008. The CRC incidence rates by gender and race were
suppressed due to small numbers of cases.[4]
Mortality
In Tyrrell County, CRC mortality rates (2003-2007) per 100,000 were suppressed due to small numbers
of deaths.[4]
Female Breast
Incidence
In Tyrrell County, the breast cancer (female, invasive) age-adjusted incidence rate for 2004-2008 was
139.8 (95% CI 77.8, 234.3) per 100,000, which was higher than the overall statewide breast cancer rate
Source: U.S. Census Bureau, State and County
Quickfacts: North Carolina

98
of 123.3 (95% CI 121.9-124.7). On average, there were 3 new cases of invasive female breast cancer
diagnosed in Tyrrell County and 6,189 new cases across the state for 2004-2008. Incidence rates by race
were suppressed due to small numbers of cases.[4]
Mortality
In Tyrrell County, female breast cancer mortality rates (2003-2007) per 100,000 were suppressed due to
small numbers of deaths.[4]
Cervix
See Eastern North Carolina rates. Tyrrell County data for cervical cancer incidence and mortality rates
were suppressed due to small numbers.
Exhibit 138. Invasive Female Breast Cancer Incidence and Mortality Rates per 100,000 persons
Tyrrell County North Carolina
Breast Cancer Incidence (2004-2008)* 139.8 123.3
Breast Cancer Mortality (2003-2007) ** 24.8
*Age-Adjusted
**Suppressed due to small numbers
Source: NCI, State Cancer Profiles

99
Risk Factors and Screening
Tyrrell County residents had a higher prevalence of obesity compared to NC statewide. Data on other
behavioral factors were not available through BRFSS.
0%
5%
10%
15%
20%
25%
30%
35%
% Obese % Alcohol
Exhibit 139. Adult Respondents, Tyrrell County, North Carolina Behavioral Risk Factor Surveillance System, 2003-2009
Tyrrell County North Carolina
*Data were not available for smoker, diabetes, or mammogram behavioral factors at the county level.
Sources: County Health Rankings, North Carolina County Health Rankings;
North Carolina Data Health Explorer; NC DHHS, SCHS, BRFSS Survey Results, 2005-2009
Exhibit 140. Adult Respondents, Tyrrell County, North Carolina
Behavioral Risk Factor Surveillance System, 2003-2009
a. 2003-2009, Percent of adults that report smoking ≥100 cigarettes and currently smoking [3]
b. 2008, Percent of adults that report a BMI ≥30 [3]
c. 2003-2009, Percent of the adult population that reports either binge drinking, defined as consuming more than 4 (women) or 5 (men)
alcoholic beverages on a single occasion in the past 30 days, or heavy drinking, defined as drinking more than 1 (women) or 2 (men) drinks per
day on average [3]
d. 2005-2009, Percent, Has a doctor told you that you have diabetes, Yes response. [6][7]
e. 2006-2007, Percent of female Medicare enrollees age 67-69 that had at least one mammogram over a two-year period [3]
*Data unavailable
Sources: County Health Rankings, North Carolina County Health Rankings; North Carolina Data Health Explorer; NC DHHS, SCHS, BRFSS Survey Results, 2005-2009
Factor
% Smokera % Obeseb % Alcoholc % Diabetesd % Mammograme
Tyrrell County * 32% 7% * *
North Carolina 22% 29% 12% 9% 67%

100
White46%African
American50%
Other4%
Exhibit 141. Washington County by Race, 2010
WASHINGTON COUNTY
Social and Economic Indicators
Based on number of persons employed, in 2011 the largest industry in Washington County was health
care and social assistance.[1]The median household income (2009) was $33,190 for a family of four,
compared to $43,754 statewide. The percentage of persons living below the poverty level in 2009 was
23%, compared to 16% statewide.[2] Unemployment (civilian, not in labor force, 2009) in Washington
County was 11%, compared to 10.6% statewide. The estimated high school graduation rate (2010) was
81%, based on the cohort of ninth graders that graduated from high school in four years, compared to
78% in North Carolina. In 2007, the adult uninsured population (≥ age 18-64) was 16%, compared to
21% statewide. Five physicians provided primary care in Washington County (2008), which was a
population to primary care physician ratio of 2,592 to 1.[3]
Demographics
Based on data from the 2010 U.S. Census,
Washington County had a total population of
13,228 with 38 persons per square mile. The
county population was 23% children (<18), 59%
adults ages 18-64, and 18% elders. Washington
County was 50% African American (AA) (22% AA
statewide) and 46% white (69% white statewide).
Latinos/Hispanics (any race) comprised 4% of the
population in Washington County (8% statewide)
(Exhibit 141). The overall county population was
53% female and 47% male.[2]
Cancer Surveillance
Colon and Rectal Cancers (CRC)
Incidence
In Washington County, the CRC age-adjusted incidence rate for 2004-2008 was 50.6 (95% CI 35.9, 69.5)
per 100,000, which was higher than the overall statewide CRC rate of 46.8 (95% CI 46.1, 47.4). On
average, there were 8 new cases of CRC diagnosed in Washington County, and 4,720 new cases across
the state for 2004-2008. The CRC age-adjusted incidence rates per 100,000 were 65.4 (95% CI 40.5,
100.2) for males and 40.3 (95% CI 23.9, 64.8) for females. By race, the CRC age-adjusted incidence rates
per 100,000 were 47.1 (95% CI 29.4, 73.3) for whites, and 52.1 (95% CI 30.3, 83.6) for African
Americans.[4]
Mortality
In Washington County, CRC mortality rates for 2003-2007 were stable and were similar to the North
Carolina rates (all races, both sexes). The CRC mortality rate (2003-2007) was 24.0 (95% CI 14.7, 37.4)
per 100,000 which was higher than the overall statewide CRC mortality rate of 17.3 (95% CI 17.0, 17.7).
Source: U.S. Census Bureau, State and County
Quickfacts: North Carolina

101
Washington County did not meet the Healthy People 2010 mortality rate goal (13.9 CRC deaths per
100,000).[4][5] The average annual percentage change in death rates declined at -0.8 percent (95% CI -
2.7, 1.1) for 2003-2007. The CRC mortality rates by gender and race were suppressed due to small
numbers of deaths.[4]
Female Breast
Incidence
In Washington County, the breast cancer (female, invasive) age-adjusted incidence rate for 2004-2008
was 136.9 (95% CI 104.2, 177.4) per 100,000, which was higher than the overall statewide breast cancer
rate of 123.3 (95% CI 121.9-124.7). On average, there were 12 new cases of invasive female breast
cancer diagnosed in Washington County and 6,189 new cases across the state for 2004-2008. Female
breast cancer age-adjusted incidence rates were 146.7 (95% CI 103.6, 205.8) for whites, and 110.5 (95%
CI 67.8, 170.4) for African Americans.[4]
Mortality
In Washington County, female breast cancer mortality rates (2003-2007) per 100,000 were suppressed
due to small numbers of deaths.[4]
Cervix
See Eastern North Carolina rates. Washington County data for cervical cancer incidence and mortality
rates were suppressed due to small numbers.
Exhibit 142. Colorectal Cancer Incidence and Mortality Rates per 100,000 persons
Washington County North Carolina
CRC Incidence (2004-2008)* 50.6 46.8
CRC Mortality (2003-2007) 24.0 17.3
*Age-Adjusted
Source: NCI, State Cancer Profiles
Exhibit 143. Invasive Female Breast Cancer Incidence and Mortality Rates per 100,000 persons
Washington County North Carolina
Breast Cancer Incidence (2004-2008)* 136.9 123.3
Breast Cancer Mortality (2003-2007) ** 24.8
*Age-Adjusted
**Suppressed due to small numbers
Source: NCI, State Cancer Profiles

102
Risk Factors and Screening
Washington County residents had a higher prevalence of obesity compared to NC statewide, but
reported less mammography among medicare-enrolled women.
0%
10%
20%
30%
40%
50%
60%
70%
80%
% Smoker % Obese % Alcohol % Diabetes % Mammogram
Exhibit 144. Adult Respondents, Washington County, North Carolina Behavioral Risk Factor Surveillance System, 2003-2009
Washington County North Carolina
Sources: County Health Rankings, North Carolina County Health Rankings;
North Carolina Data Health Explorer; NC DHHS, SCHS, BRFSS Survey Results, 2005-2009
Exhibit 145. Adult Respondents, Washington County, North Carolina
Behavioral Risk Factor Surveillance System, 2003-2009
a. 2003-2009, Percent of adults that report smoking ≥100 cigarettes and currently smoking [3]
b. 2008, Percent of adults that report a BMI ≥30 [3]
c. 2003-2009, Percent of the adult population that reports either binge drinking, defined as consuming more than 4 (women) or 5 (men)
alcoholic beverages on a single occasion in the past 30 days, or heavy drinking, defined as drinking more than 1 (women) or 2 (men) drinks per
day on average [3]
d. 2005-2009, Percent, Has a doctor told you that you have diabetes, Yes response. [6][7]
e. 2006-2007, Percent of female Medicare enrollees age 67-69 that had at least one mammogram over a two-year period [3]
Sources: County Health Rankings, North Carolina County Health Rankings;
North Carolina Data Health Explorer; NC DHHS, SCHS, BRFSS Survey Results, 2005-2009
Factor
% Smokera % Obeseb % Alcoholc % Diabetesd % Mammograme
Washington County 21% 33% 9% 9% 62%
North Carolina 22% 29% 12% 9% 67%

103
White59%
African American
31%
Other10%
Exhibit 146. Wayne County by Race, 2010
WAYNE COUNTY
Social and Economic Indicators
Based on number of persons employed, in 2011 the largest industry in Wayne County was health care
and social assistance.[1]The median household income (2009) was $40,291 for a family of four,
compared to $43,754 statewide. The percentage of persons living below the poverty level in 2009 was
20%, compared to 16% statewide.[2] Unemployment (civilian, not in labor force, 2009) in Wayne County
was 9%, compared to 10.6% statewide. The estimated high school graduation rate (2010) was 76%,
based on the cohort of ninth graders that graduated from high school in four years, compared to 78% in
North Carolina. In 2007, the adult uninsured population (≥ age 18-64) was 20%, compared to 21%
statewide. Ninety-nine physicians provided primary care in Wayne County (2008), which was a
population to primary care physician ratio of 1,146 to 1.[3]
Demographics
Based on data from the 2010 U.S. Census, Wayne
County had a total population of 122,623 with 222
persons per square mile. The county population
was 25% children (<18), 62% adults ages 18-64,
and 13% elders. Wayne County was 31% African
American (AA) (22% AA statewide) and 59% white
(69% white statewide). Latinos/Hispanics (any
race) comprised 10% of the population in Wayne
County (8% statewide) (Exhibit 146). The overall
county population was 51% female and 49%
male.[2]
Cancer Surveillance
Colon and Rectal Cancers (CRC)
Incidence
In Wayne County, the CRC age-adjusted incidence rate for 2004-2008 was 53.8 (95% CI 47.9, 60.2) per
100,000, which was higher than the overall statewide CRC rate of 46.8 (95% CI 46.1, 47.4). On average,
there were 62 new cases of CRC diagnosed in Wayne County, and 4,720 new cases across the state for
2004-2008. The CRC age-adjusted incidence rates per 100,000 were 67.2 (95% CI 57.1, 78.6) for males
and 42.7 (95% CI 35.7, 50.5) for females. By race, the CRC age-adjusted incidence rates per 100,000
were 52.0 (95% CI 45.1, 59.7) for whites, and 59.0 (95% CI 47.9, 71.9) for African Americans.[4]
Mortality
In Wayne County, CRC mortality rates for 2003-2007 declined and were similar to the North Carolina
rates (all races, both sexes). The CRC mortality rate (2003-2007) was 20.1 (95% CI 16.5, 24.3) per
100,000 which was higher than the overall statewide CRC mortality rate of 17.3 (95% CI 17.0, 17.7).
Wayne County did not meet the Healthy People 2010 mortality rate goal (13.9 CRC deaths per
Source: U.S. Census Bureau, State and County
Quickfacts: North Carolina

104
100,000).[4][5] The average annual percentage change in death rates declined at -1.0 percent (95% CI -
1.9, -0.2) for 2003-2007. The CRC mortality rates (2003-2007) by gender were 15.4 (95% CI 8.6, 18.9) for
females and 26.3 (95% CI 19.8, 34.1) for males per 100,000. CRC mortality rates (2003-2007) per
100,000 by race were 19.5 (95% CI 15.3, 24.6) for whites, and 21.9 (95% CI 15.2, 30.4) for African
Americans.[4]
Female Breast
Incidence
In Wayne County, the breast cancer (female, invasive) age-adjusted incidence rate for 2004-2008 was
135.1 (95% CI 122.6, 148.5) per 100,000, which was higher than the overall statewide breast cancer rate
of 123.3 (95% CI 121.9-124.7). On average, there were 87 new cases of invasive female breast cancer
diagnosed in Wayne County and 6,189 new cases across the state for 2004-2008. Female breast cancer
age-adjusted incidence rates were 136.1 (95% CI 120.7, 153.0) for whites, and 133.2 (95% CI 111.6,
157.8) for African Americans.[4]
Mortality
In Wayne County, female breast cancer mortality rates for 2003-2007 increased and were higher than
the North Carolina rates (all races). The female breast cancer mortality rate (2003-2007) was 31.7 (95%
CI 25.8, 38.6) per 100,000, which was higher than the overall statewide female breast cancer mortality
rate of 24.8. Wayne County did not meet the Healthy People 2010 mortality rate goal (22.3 female
breast cancer deaths per 100,000).[4][5] The average annual percentage change in death rates was
stable with no percentage change in the county rate over the five year interval (95% CI -1.2, 1.2) for
2003-2007. Female breast cancer mortality rates (2003-2007) per 100,000 by race were 26.9 (95% CI
20.4, 34.9) for whites, and 42.8 (95% CI 30.9, 57.8) for African Americans.[4]
Exhibit 147. Colorectal Cancer Incidence and Mortality Rates per 100,000 persons
Wayne County North Carolina
CRC Incidence (2004-2008)* 53.8 46.8
CRC Mortality (2003-2007) 20.1 17.3
*Age-Adjusted
Source: NCI, State Cancer Profiles
Exhibit 148. Invasive Female Breast Cancer Incidence and Mortality Rates per 100,000 persons
Wayne County North Carolina
Breast Cancer Incidence (2004-2008)* 135.1 123.3
Breast Cancer Mortality (2003-2007) 31.7 24.8
*Age-Adjusted
Source: NCI, State Cancer Profiles

105
Cervix
See Eastern North Carolina rates. Wayne County data for cervical cancer incidence and mortality rates
were suppressed due to small numbers.
Risk Factors and Screening
Wayne County residents had a higher prevalence of obesity and diabetes compared to NC statewide,
but reported less mammography in Medicare-enrolled women.
0%
10%
20%
30%
40%
50%
60%
70%
80%
% Smoker % Obese % Alcohol % Diabetes % Mammogram
Exhibit 149. Adult Respondents, Wayne County, North Carolina Behavioral Risk Factor Surveillance System, 2003-2009
Wayne County North Carolina
Sources: County Health Rankings, North Carolina County Health Rankings; North Carolina Data Health Explorer; NC DHHS, SCHS, BRFSS Survey Results, 2005-2009 Exhibit 150. Adult Respondents, Wayne County, North Carolina Behavioral Risk Factor Surveillance System, 2003-2009
a. 2003-2009, Percent of adults that report smoking ≥100 cigarettes and currently smoking [3]
b. 2008, Percent of adults that report a BMI ≥30 [3]
c. 2003-2009, Percent of the adult population that reports either binge drinking, defined as consuming more than 4 (women) or 5 (men)
alcoholic beverages on a single occasion in the past 30 days, or heavy drinking, defined as drinking more than 1 (women) or 2 (men) drinks per
day on average [3]
d. 2005-2009, Percent, Has a doctor told you that you have diabetes, Yes response. [6][7]
e. 2006-2007, Percent of female Medicare enrollees age 67-69 that had at least one mammogram over a two-year period [3]
Sources: County Health Rankings, North Carolina County Health Rankings; North Carolina Data Health Explorer; NC DHHS, SCHS, BRFSS Survey Results, 2005-2009
Factor
% Smokera % Obeseb % Alcoholc % Diabetesd % Mammograme
Wayne County 23% 32% 10% 11% 64%
North Carolina 22% 29% 12% 9% 67%

106
White52%
African American
39%
Other9%
Exhibit 151. Wilson County by Race, 2010
WILSON COUNTY
Social and Economic Indicators
Based on number of persons employed, in 2011 the largest industry in Wilson County was
manufacturing.[1] The median household income (2009) was $39,511 for a family of four, compared to
$43,754 statewide. The percentage of persons living below the poverty level in 2009 was 20%,
compared to 16% statewide.[2] Unemployment (civilian, not in labor force, 2009) in Wilson County was
12%, compared to 10.6% statewide. The estimated high school graduation rate (2010) was 67%, based
on the cohort of ninth graders that graduated from high school in four years, compared to78% in North
Carolina. In 2007, the adult uninsured population (≥ age 18-64) was 20%, compared to 21% statewide.
Forty-nine physicians provided primary care in Wilson County (2008), which was a population to primary
care physician ratio of 1,586 to 1.[3]
Demographics
Based on data from the 2010 U.S. Census, Wilson
County had a total population of 81,234 with 220.6
persons per square mile. The county population
was 25% children (<18), 61% adults ages 18-64, and
14% elders. Wilson County was 39% African
American (AA) (22% AA statewide) and 52% white
(69% white statewide). Latinos/Hispanics (any
race) comprised 10% of the population in Wilson
County (8% statewide) (Exhibit 151). The overall
county population was 52% female and 48%
male.[2]
Cancer Surveillance
Colon and Rectal Cancers (CRC)
Incidence
In Wilson County, the CRC age-adjusted incidence rate for 2004-2008 was 55.9 (95% CI 48.9, 63.6) per
100,000, which was higher than the overall statewide CRC rate of 46.8 (95% CI 46.1, 47.4). On average,
there were 47 new cases of CRC diagnosed in Wilson County, and 4,720 new cases across the state for
2004-2008. The CRC age-adjusted incidence rates per 100,000 were 75.1 (95% CI 62.5, 89.5) for males
and 42.1 (95% CI 34.3, 51.3) for females. By race, the CRC age-adjusted incidence rates per 100,000
were 53.5 (95% CI 45.2, 62.9) for whites, and 62.6 (95% CI 49.7, 77.9) for African Americans.[4]
Mortality
In Wilson County, CRC mortality rates for 2003-2007 were stable and were similar to the North Carolina
rates (all races, both sexes). The CRC mortality rate (2003-2007) was 18.1 (95% CI 14.2, 22.7) per
100,000 which was higher than the overall statewide CRC mortality rate of 17.3 (95% CI 17.0, 17.7).
Wilson County did not meet the Healthy People 2010 mortality rate goal (13.9 CRC deaths per
Source: U.S. Census Bureau, State and County
Quickfacts: North Carolina

107
100,000).[4][5] The average annual percentage change in death rates declined at -0.6 percent (95% CI -
1.6, 0.4) for 2003-2007. The CRC mortality rates (2003-2007) by gender were 14.3 (95% CI 10.0, 19.9) for
females and 22.5 (95% CI 15.9, 31.0) for males per 100,000. CRC mortality rates (2003-2007) per
100,000 by race were 15.0 (95% CI 10.8, 20.4) for whites, and 25.4 (95% CI 17.3, 35.8) for African
Americans.[4]
Female Breast
Incidence
In Wilson County, the breast cancer (female, invasive) age-adjusted incidence rate for 2004-2008 was
137.4 (95% CI 122.6, 153.5) per 100,000, which was higher than the overall statewide breast cancer rate
of 123.3 (95% CI 121.9-124.7). On average, there were 64 new cases of invasive female breast cancer
diagnosed in Wilson County and 6,189 new cases across the state for 2004-2008. Female breast cancer
age-adjusted incidence rates were 145.9 (95% CI 126.6, 167.5) for whites, and 124.9 (95% CI 101.9,
151.5) for African Americans.[4]
Mortality
In Wilson County, female breast cancer mortality rates for 2003-2007 increased and were higher than
the North Carolina rates (all races). The female breast cancer mortality rate (2003-2007) was 33.2 (95%
CI 26.2, 41.6) per 100,000, which was higher than the overall statewide female breast cancer mortality
rate of 24.8. Wilson County did not meet the Healthy People 2010 mortality rate goal (22.3 female
breast cancer deaths per 100,000).[4][5] The average annual percentage change in death rates increased
at 0.2 percent (95% CI -0.8, 1.3) for 2003-2007. Female breast cancer mortality rates (2003-2007) per
100,000 by race were 23.7 (95% CI 16.4, 33.3) for whites, and 51.1 (95% CI 36.8, 69.2) for African
Americans.[4]
Cervix
See Eastern North Carolina rates. Wilson County data for cervical cancer incidence and mortality rates
were suppressed due to small numbers.
Exhibit 152. Colorectal Cancer Incidence and Mortality Rates per 100,000 persons
Wilson County North Carolina
CRC Incidence (2004-2008)* 55.9 46.8
CRC Mortality (2003-2007) 18.1 17.3
*Age-Adjusted
Source: NCI, State Cancer Profiles
Exhibit 153. Invasive Female Breast Cancer Incidence and Mortality Rates per 100,000 persons
Wilson County North Carolina
Breast Cancer Incidence (2004-2008)* 137.4 123.3
Breast Cancer Mortality (2003-2007) 33.2 24.8
*Age-Adjusted
Source: NCI, State Cancer Profiles

108
Risk Factors and Screening
Wilson County residents had a higher prevalence of obesity and diabetes compared to NC statewide, but
reported less mammography in Medicare-enrolled women.
0%
10%
20%
30%
40%
50%
60%
70%
80%
% Smoker % Obese % Alcohol % Diabetes % Mammogram
Exhibit 154. Adult Respondents, Wilson County, North Carolina Behavioral Risk Factor Surveillance System, 2003-2009
Wilson County North Carolina
Sources: County Health Rankings, North Carolina County Health Rankings;
North Carolina Data Health Explorer; NC DHHS, SCHS, BRFSS Survey Results, 2005-2009
Exhibit 155. Adult Respondents, Wilson County, North Carolina
Behavioral Risk Factor Surveillance System, 2003-2009
a. 2003-2009, Percent of adults that report smoking ≥100 cigarettes and currently smoking [3]
b. 2008, Percent of adults that report a BMI ≥30 [3]
c. 2003-2009, Percent of the adult population that reports either binge drinking, defined as consuming more than 4 (women) or 5 (men)
alcoholic beverages on a single occasion in the past 30 days, or heavy drinking, defined as drinking more than 1 (women) or 2 (men) drinks per
day on average [3]
d. 2005-2009, Percent, Has a doctor told you that you have diabetes, Yes response. [6][7]
e. 2006-2007, Percent of female Medicare enrollees age 67-69 that had at least one mammogram over a two-year period [3]
Sources: County Health Rankings, North Carolina County Health Rankings;
North Carolina Data Health Explorer; NC DHHS, SCHS, BRFSS Survey Results, 2005-2009
Factor
% Smokera % Obeseb % Alcoholc % Diabetesd % Mammograme
Wilson County 19% 32% 11% 12% 64%
North Carolina 22% 29% 12% 9% 67%
109
County-Level Profile References 1. North Carolina Department of Commerce. (2011, Dec 6). AccessNC/EDIS. NC counties with
employment and wages by industry and by occupation. Personal communication, Tammy Lester.
2. U.S. Census Bureau. (2011, Nov 23). State and County Quickfacts: North Carolina. Retrieved from
http://quickfacts.census.gov/qfd/states/37/37013.html.
3. County Health Rankings (2009). (2011, Dec 7). North Carolina County Health Rankings. Retrieved
from http://www.countyhealthrankings.org.
*Data on access to primary care are considered unreliable for the following reasons. Although the relationship between primary
care providers and improved health outcomes is supported in the literature, this measure has a number of limitations. First, primary
care providers are classified by county, but providers living on the edge of counties or who practice in multiple locations may see
patient populations that reside in surrounding counties. Therefore, this measure may either over- or underestimate patient access
to primary care in some situations since patient-provider interaction is not restricted by county boundaries.
4. National Cancer Institute (NCI). (2011, Nov 23). State Cancer Profiles: North Carolina counties. Death
rates and Incidence Rates. Retrieved from http://statecancerprofiles.cancer.gov.
5. Centers for Disease Control and Prevention. (2011, Nov 9). Healthy People 2010. Retrieved from
http://www.healthypeople.gov/2010/document/html/volume1/03cancer.htm.
6. North Carolina Health Data Explorer. (2011, Nov 9). Center for Health Systems Research and
Development, East Carolina University, Greenville, NC. Retrieved from http://www.ecu.edu/chsrd/.
7. NC DHHS, State Center for Health Statistics. (2011, Dec 16). Behavioral Risk Factor Surveillance
System, Survey Results, 2005-2009. Retrieved from
http://www.schs.state.nc.us/SCHS/brfss/results.html.

110
Access to
Care

111
Mammography
Methods Number and distribution of mammography facilities was used a surrogate measure of access to breast
cancer screening. Mammography facility data were collected between November and December 2011.
Licensed mammography facilities in the region were identified by utilizing the search function for the
Mammography Facility Database on the U.S. Food and Drug Administration (FDA) website. [1] The
Mammography Facility Database is updated weekly based on information received from the four FDA-
approved accreditation bodies: the American College of Radiology (ACR), and the States of Arkansas,
Iowa, and Texas. The data base includes mammography facilities meeting baseline quality standards for
equipment, personnel and practices under the Mammography Quality Standards Act of 1992 (MQSA).
Mammography facilities that were located in the 29-county region of Eastern North Carolina were
included in a Microsoft Excel spreadsheet. Some FDA-approved facilities may not be listed at the time
the data were obtained. Addresses of each facility were input into an online longitude and latitude
locator. [2] Longitude and latitude coordinates were added to the Microsoft Excel spreadsheet. Staff
from the Department of Geography at East Carolina University geocoded the points and these locations
were added to the North Carolina map in order to create a visual depiction of mammography access in
Eastern North Carolina. See Exhibit 156 for the Northeastern Region FDA-Approved Mammography
Facilities map.
Results Thirty-eight licensed mammography facilities operate in Eastern North Carolina; 21 of the 29 ENC
counties have at least 1 facility, 8 ENC counties have no mammography facilities.[1]

112
Exhibit 156. FDA-Approved Mammography Facilities
Source: DHHS, U.S. Food and Drug Administration. Mammography Facilities Database, Nov 2011

113
Colposcopy Service
Methods Number and distribution of providers (serving BCCCP eligible or uninsured patients) for colposcopy was
used as a surrogate for measuring cervical cancer prevention and care. There is no database of facilities
that provide colposcopies in North Carolina. Colposcopy provider data was collected between
November and December 2011. Locations were identified by contacting North Carolina Breast Cervical
Cancer Control Program (BCCCP) providers directly through email or telephone call. About half of the
Eastern North Carolina BCCCP providers were located using the search function of the NC BCCCP
website and contacted by telephone.[3] Other BCCCP providers were contacted through an email sent
by the state BCCCP coordinators in charge of the region that included the county. BCCCP providers were
asked if they provide on-site colposcopy services and if they refer out to other providers, which provider
specifically. If not indicated by the BCCCP provider, referral facilities were called by ECU staff and asked
if they accept BCCCP as a form of payment for colposcopies (i.e. Is the facility a BCCCP vendor?).
Addresses of each facility were input into an online longitude and latitude locator.[2] Longitude and
latitude coordinates were added to the Microsoft Excel spreadsheet. Staff from the Department of
Geography at East Carolina University geocoded the points and these locations were added to the North
Carolina map in order to create a visual depiction of colposcopy access in Eastern North Carolina. See
Exhibit 157 for the Northeastern Region Colposcopy Referral Sites map. Exclusion criteria for the
colposcopy map were colposcopy locations existing outside the eastern region (2 locations excluded)
and/or incomplete location contact information (2 locations excluded).
Results There are 22 colposcopy providers that participate in the BCCCP program in Eastern North Carolina.
Fourteen colposcopy providers in the region do not participate in the BCCCP program.[3] Colposcopy
locations that did not respond to telephone calls about BCCCP acceptance as a payment option were
marked as “unknown BCCCP status.” BCCCP participation was unknown at five colposcopy provider sites
in Eastern North Carolina. Two counties that did not report were Hyde and Jones. Onslow does not
participate in the BCCCP program [3], although Onslow County Health Department reported colposcopy
providers.
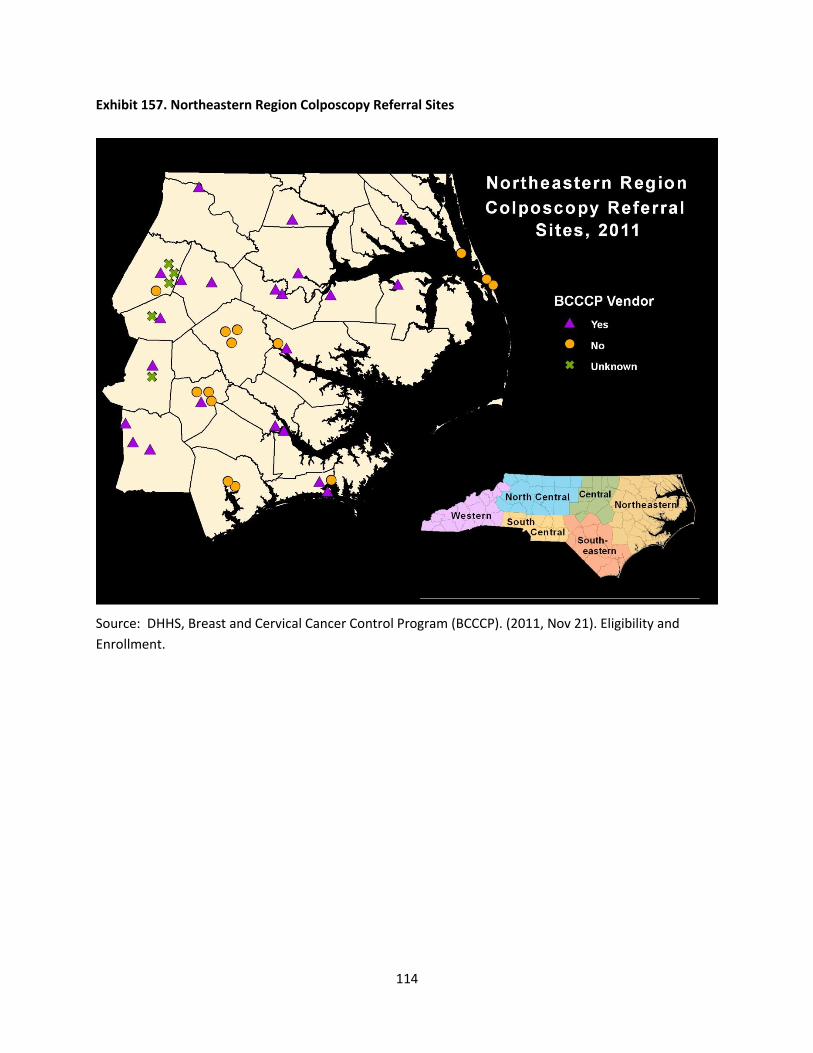
114
Exhibit 157. Northeastern Region Colposcopy Referral Sites
Source: DHHS, Breast and Cervical Cancer Control Program (BCCCP). (2011, Nov 21). Eligibility and
Enrollment.

115
Colonoscopy
Methods Number and distribution of providers of endoscopy services were included as surrogates for access to
colorectal cancer screening, early detection, and diagnosis. Endoscopy center data were collected from
the Division of Health Service Regulation website in late January 2012 (database last updated January
2012) [4]; hospitals that provide ambulatory surgery (endoscopy allowed) and/or endoscopy (only
endoscopy can be performed in this surgical bed) were collected from the Division of Health Service
Regulation website in early February 2012 (database last updated February 2012) [5]; and office based
colonoscopy providers were collected through the BlueCross BlueShield of North Carolina website, “Find
a doctor or facility” function with the search “Office Based Colonoscopy Providers” [6] Fifteen of the free
standing endoscopy facilities were identified through the Department of Health and Human Services,
Division of Health Service Regulation database, “Ambulatory Surgical Facilities, Licensed by the State of
North Carolina.” Facilities with at least one endoscopy bed located in an ENC county were included.[4]
Sixteen hospitals had both endoscopy beds (dedicated) and ambulatory surgery beds (endoscopy
allowed) and 4 hospitals had ambulatory surgery beds (endoscopy allowed) but no dedicated endoscopy
beds.[5] Four office-based endoscopy facilities were identified through the BlueCross BlueShield of
North Carolina website, “Find a doctor or facility” function with the search “Office Based Colonoscopy
Provider.”[6] Locations within the 29-county area were included. Addresses of each facility were
entered into an online longitude and latitude locator.[2] Longitude and latitude coordinates were added
to the Microsoft Excel spreadsheet. Staff from the Department of Geography at East Carolina University
geocoded the points and these locations were added to the North Carolina map in order to create a
visual depiction of colonoscopy access in Eastern North Carolina. See Exhibit 158 for the Northeastern
Region Colonoscopy Locations map.
Results There are 39 facilities in Eastern North Carolina that have the capability to provide endoscopy services.
Thirty-one licensed endoscopy facilities (hospitals and free-standing Ambulatory Surgery Facilities that
offer endoscopy) operate in Eastern North Carolina. [4-5] Four hospitals have ambulatory surgery beds
(endoscopy allowed) but do not have dedicated endoscopy beds. [5] There are 4 office-based
colonoscopy providers in the ENC region.[6] Nineteen of the 29 ENC counties have the capability to
provide endoscopy services.

116
Exhibit 158. Northeastern Region Colonoscopy Locations

117
Hospitals
Methods The number and distribution of hospitals in the region were indicated on the map to show access to
acute care.[7] Hospital locations were obtained from the North Carolina Hospital Association website
(Accessed January 2012). [8] Hospitals providing acute care were included; military hospitals, long-term
care facilities, mental health facilities, and drug/alcohol treatment centers were excluded. See Exhibit
159 for the Hospital Locations in Eastern North Carolina map.
Results Twenty-two hospitals provide acute care in the ENC region. Nineteen of the 29 ENC counties have at
least 1 hospital, 10 counties have no hospital. Vidant Medical Center (formerly Pitt County Memorial
Hospital) located in Greenville, NC is the largest hospital in the region (745 beds), with the only trauma
center east of Raleigh. Many of the hospitals in Eastern North Carolina are small, rural hospitals
(median number of beds, 131 beds). [8]

118
Exhibit 159. Hospital Locations in Eastern North Carolina

119
Federally Qualified Health Centers and Look-Alike Sites
Methods Number and distribution of Federally Qualified Health Centers and Look-Alike sites are indicated on the
map as a surrogate measure for access to primary care and screening for medically-underserved
populations.[7] Federally Qualified Health Center and Look-Alike site locations were obtained from the
Health Resources and Services Administration (HRSA) Data Warehouse- Health Centers and Look-alike
Sites Site Directory (Accessed January 2012).[9] HRSA extracts the most recent Federally Qualified
Health Center and Look-Alike data available for download on a daily basis and uploads it to the website.
HRSA-supported health centers are often referred to as “Community Health Centers” or “Federally
Qualified Health Centers (FQHCSs)” and are considered “330” or “Section 330” sites. Sites in this
category receive funding from HRSA’s Health Center Cluster grant program or a related program. Also
included are sites that qualify for HRSA grant funding under the Health Center Cluster program group,
but that do not currently receive any funding from those programs; these sites are often called a “Look-
Alike” site or sometimes “FQHC Look-Alike.”[9] Both Federally Qualified Health Centers and Look-Alike
sites were included in the map. Excluded from the map were dental care facilities, migrant health
centers, and other types of non-primary care facilities. See Exhibit 160 for the Federally Qualified Health
Centers (FQHC) in Eastern North Carolina map.
Results Forty Federally Qualified Health Centers and Look-Alike sites provide primary care in the region.
Eighteen of the 29 ENC counties have at least 1 Community Health Center, 11 counties have no federally
qualified health centers and look-alike sites. [9]

120
Exhibit 160. Federally Qualified Health Centers (FQHC) in Eastern North Carolina

121
Access to Care References 1. DHHS, U.S. Food and Drug Administration. (2011, Nov 21). Mammography Facilities Database, Nov
2011. Retrieved from http://www.accessdata.fda.gov/scripts/cdrh/cfdocs/cfmqsa/mqsa.cfm.
2. itouchmap.com. (2011, Nov 1). Latitude and Longitude of a Point. Retrieved from
http://itouchmap.com/latlong.html.
3. DHHS, Breast and Cervical Cancer Control Program (BCCCP). (2011, Nov 21). Eligibility and
Enrollment. Retrieved from http://bcccp.ncdhhs.gov/Eligibility.asp.
4. Department of Health and Human Services, DHHS, Division of Health Service Regulation. (2012, Jan
24). Ambulatory Surgical Facilities with endoscopy beds, Licensed by the State of North Carolina,
Updated 1/2012. Retrieved from http://www.ncdhhs.gov/dhsr/data/aslist.pdf.
5. Department of Health and Human Services, DHHS, Division of Health Services Regulation. (2012, Feb
6). Hospitals by County-Hospitals licensed by the State of North Carolina, Updated Feb 1, 2012.
Retrieved from http://www.ncdhhs.gov/dhsr/data/hllistco.pdf.
6. BlueCross BlueShield of North Carolina. (2012, Feb 3). Find a Doctor or Facility-Office Based
Colonoscopy Center. Updated Jan 31, 2012. Retrieved from
http://www.bcbsnc.com/content/providersearch/index.htm.
7. Center for Health Systems Research and Development, East Carolina University, Greenville, NC.
(http://www.ecu.edu/chsrd/). 2012
8. North Carolina Hospital Association. (2012, Jan 20). NCHA Member Hospitals. Retrieved from
https://www.ncha.org/nc-hospitals.
9. HRSA, Health Resources and Services Administration Data Warehouse. (2012, Jan 24). Health
Centers and Look-alike Sites Site Directory. Retrieved from,
http://findahealthcenter.hrsa.gov/Search_HCC.aspx?byCounty=1

122
Appendices

123
Demographic Data by County
0
10,000
20,000
30,000
40,000
50,000
60,000
Be
aufo
rt
Be
rtie
Cam
de
n
Car
tere
t
Ch
ow
an
Cra
ven
Cu
rrit
uck
Da
re
Du
plin
Ed
geco
mb
e
Ga
tes
Gre
ene
Ha
lifax
He
rtfo
rd
Hyd
e
Jon
es
Len
oir
Ma
rtin
Nas
h
No
rth
amp
ton
On
slo
w
Pam
lico
Pas
qu
ota
nk
Pe
rqu
iman
s
Pit
t
Tyr
rell
Was
hin
gto
n
Way
ne
Wils
on
No
rth
Car
olin
a
U.S
. D
olla
rs p
er
year
Exhibit 161. Median Household Income, by County, 2010
Source: U.S. Census, 2010
0%
5%
10%
15%
20%
25%
30%
35%
Be
aufo
rt
Be
rtie
Cam
de
n
Car
tere
t
Ch
ow
an
Cra
ven
Cu
rrit
uck
Da
re
Du
plin
Ed
geco
mb
e
Ga
tes
Gre
ene
Ha
lifax
He
rtfo
rd
Hyd
e
Jon
es
Len
oir
Ma
rtin
Nas
h
No
rth
amp
ton
On
slo
w
Pam
lico
Pas
qu
ota
nk
Pe
rqu
iman
s
Pit
t
Tyr
rell
Was
hin
gto
n
Way
ne
Wils
on
No
rth
Car
olin
a
Exhibit 162. Percent Persons Below Poverty Level, by County, 2009
Source: U.S. Census, 2010

124
0%
2%
4%
6%
8%
10%
12%
14%
16%
18%
Be
aufo
rt
Be
rtie
Cam
de
n
Car
tere
t
Ch
ow
an
Cra
ven
Cu
rrit
uck
Da
re
Du
plin
Ed
geco
mb
e
Ga
tes
Gre
ene
Ha
lifax
He
rtfo
rd
Hyd
e
Jon
es
Len
oir
Ma
rtin
Nas
h
No
rth
amp
ton
On
slo
w
Pam
lico
Pas
qu
ota
nk
Pe
rqu
iman
s
Pit
t
Tyr
rell
Was
hin
gto
n
Way
ne
Wils
on
No
rth
Car
olin
a
Exhibit 163. Percent Unemployment (Age 16+ Unemployed but Seeking
Work), by County, 2009
Source: County Health Rankings, 2011
0%
10%
20%
30%
40%
50%
60%
70%
80%
90%
100%
Be
aufo
rt
Be
rtie
Cam
de
n
Car
tere
t
Ch
ow
an
Cra
ven
Cu
rrit
uck
Da
re
Du
plin
Ed
geco
mb
e
Ga
tes
Gre
ene
Ha
lifax
He
rtfo
rd
Hyd
e
Jon
es
Len
oir
Ma
rtin
Nas
h
No
rth
amp
ton
On
slo
w
Pam
lico
Pas
qu
ota
nk
Pe
rqu
iman
s
Pit
t
Tyr
rell
Was
hin
gto
n
Way
ne
Wils
on
No
rth
Car
olin
a
Exhibit 164. Percent High School Graduation (Ninth Grade Cohort that
Graduates in 4 Years), by County, 2008-2009
Source: County Health Rankings website, 2011

125
Cancer Incidence and Mortality Rates by county
0%
5%
10%
15%
20%
25%
30%
35%
Be
aufo
rt
Be
rtie
Cam
de
n
Car
tere
t
Ch
ow
an
Cra
ven
Cu
rrit
uck
Da
re
Du
plin
Ed
geco
mb
e
Ga
tes
Gre
ene
Ha
lifax
He
rtfo
rd
Hyd
e
Jon
es
Len
oir
Ma
rtin
Nas
h
No
rth
amp
ton
On
slo
w
Pam
lico
Pas
qu
ota
nk
Pe
rqu
iman
s
Pit
t
Tyr
rell
Was
hin
gto
n
Way
ne
Wils
on
No
rth
Car
olin
a
Exhibit 165. Percent Uninsured Adults (Population Under Age 65 without
Health Insurance), by County, 2007
Source: County Health Rankings website, 2011
0
10
20
30
40
50
60
70
Be
rtie
Len
oir
He
rtfo
rd
Be
aufo
rt
Ed
geco
mb
e
Ga
tes
Hyd
e
Wils
on
Cam
de
n
Nas
h
Way
ne
Cu
rrit
uck
Pe
rqu
iman
s
Ha
lifax
Ch
ow
an
Ma
rtin
Was
hin
gto
n
Pas
qu
ota
nk
Cra
ven
Pit
t
On
slo
w
Gre
ene
Car
tere
t
No
rth
amp
ton
Jon
es
Da
re
Du
plin
Pam
lico
No
rth
Car
olin
a
Rat
e p
er
10
0,0
00
po
pu
lati
on
Exhibit 166. 2004-2008 Colorectal Cancer Incidence Rates per 100,000 persons,
by County
*Incidence rate from Tyrrell County suppressed due to small counts
Source: Cancer Control Planet, State Cancer Profiles, 2011
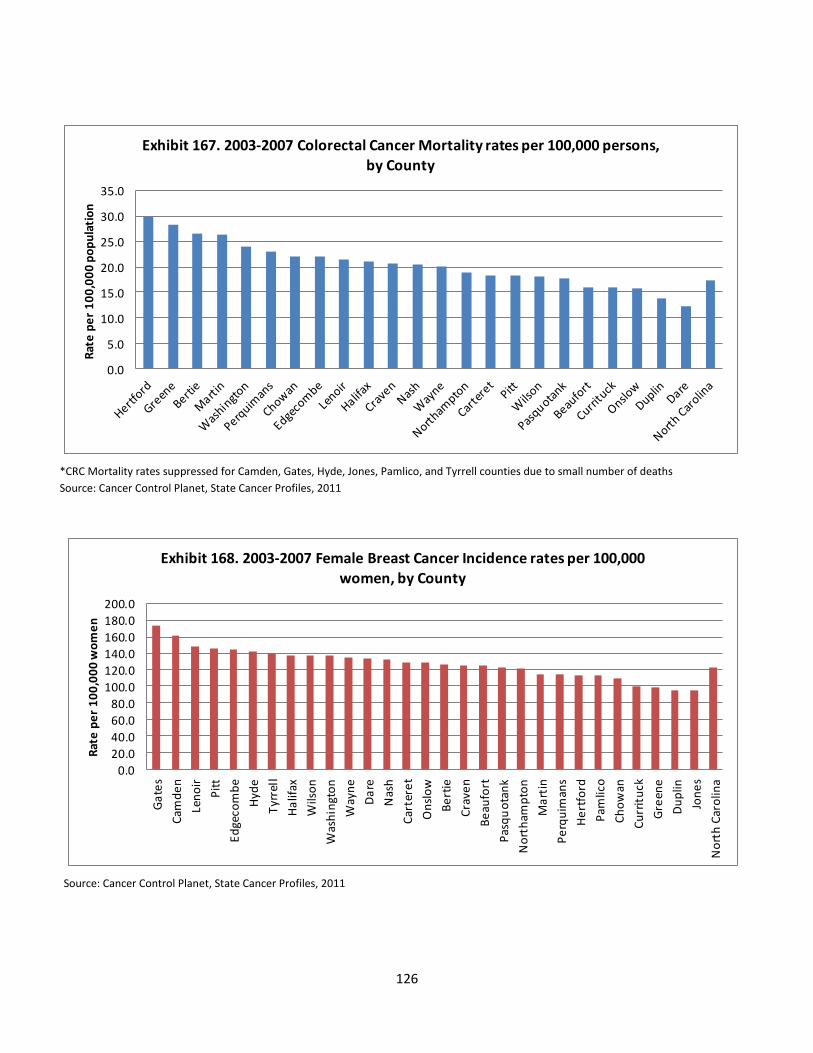
126
0.0
5.0
10.0
15.0
20.0
25.0
30.0
35.0
Rat
e p
er
10
0,0
00
po
pu
lati
on
Exhibit 167. 2003-2007 Colorectal Cancer Mortality rates per 100,000 persons,
by County
*CRC Mortality rates suppressed for Camden, Gates, Hyde, Jones, Pamlico, and Tyrrell counties due to small number of deaths
Source: Cancer Control Planet, State Cancer Profiles, 2011
0.0
20.0
40.0
60.0
80.0
100.0
120.0
140.0
160.0
180.0
200.0
Ga
tes
Cam
de
n
Len
oir
Pit
t
Ed
geco
mb
e
Hyd
e
Tyr
rell
Ha
lifax
Wils
on
Was
hin
gto
n
Way
ne
Da
re
Nas
h
Car
tere
t
On
slo
w
Be
rtie
Cra
ven
Be
aufo
rt
Pas
qu
ota
nk
No
rth
amp
ton
Ma
rtin
Pe
rqu
iman
s
He
rtfo
rd
Pam
lico
Ch
ow
an
Cu
rrit
uck
Gre
ene
Du
plin
Jon
es
No
rth
Car
olin
a
Rat
e p
er
10
0,0
00
wo
me
n
Exhibit 168. 2003-2007 Female Breast Cancer Incidence rates per 100,000
women, by County
Source: Cancer Control Planet, State Cancer Profiles, 2011
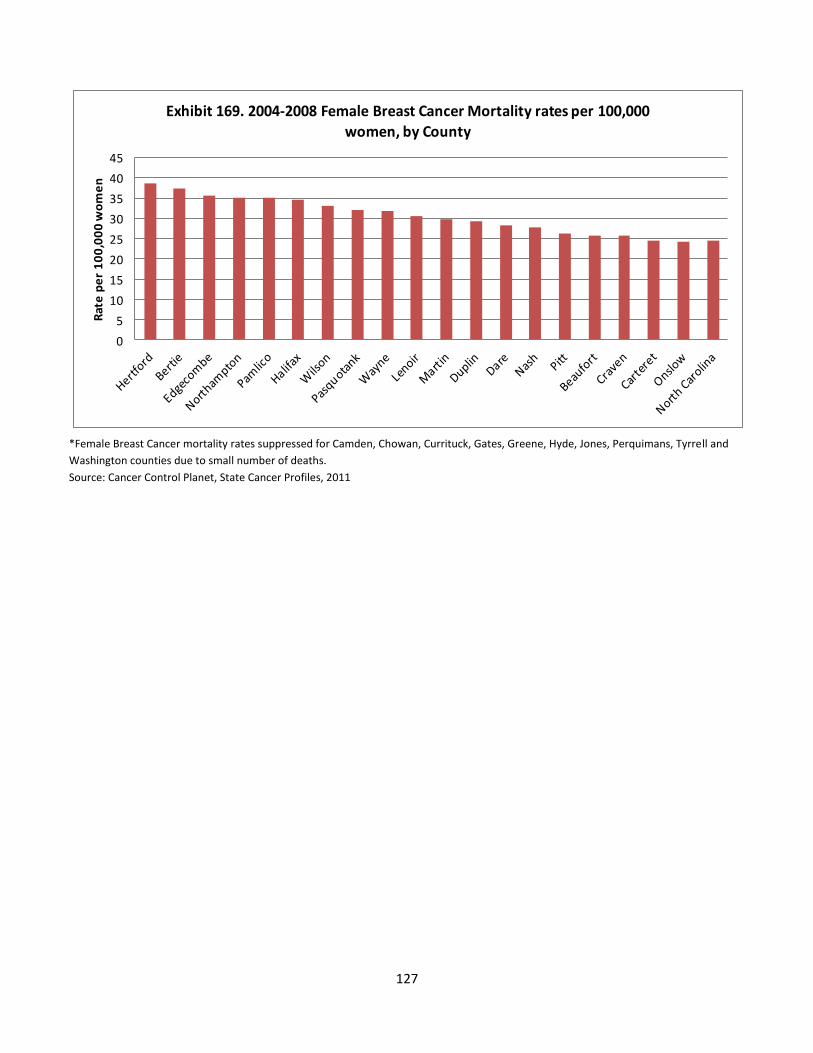
127
0
5
10
15
20
25
30
35
40
45
Rat
e p
er
10
0,0
00
wo
me
nExhibit 169. 2004-2008 Female Breast Cancer Mortality rates per 100,000
women, by County
*Female Breast Cancer mortality rates suppressed for Camden, Chowan, Currituck, Gates, Greene, Hyde, Jones, Perquimans, Tyrrell and
Washington counties due to small number of deaths.
Source: Cancer Control Planet, State Cancer Profiles, 2011

128
Exhibit 170. 2004-2008 Colorectal Cancer Age-Adjusted Incidence Rates
per 100,000 persons, by County
Bertie 66.4 Martin 50.8
Lenoir 66.3 Washington 50.6
Hertford 64.4 Pasquotank 49.3
Beaufort 62.1 Craven 49.1
Edgecombe 61.5 Pitt 49.0
Gates 60.4 Onslow 47.0
Hyde 56.3 Greene 46.6
Wilson 55.9 Carteret 45.9
Camden 55.6 Northampton 43.9
Nash 55.1 Jones 40.7
Wayne 53.8 Dare 38.9
Currituck 52.9 Duplin 35.1
Perquimans 52.7 Pamlico 32.9
Halifax 51.8 North Carolina 46.8
Chowan 51.7
*Incidence rate from Tyrrell County suppressed due to small counts
Source: Cancer Control Planet, State Cancer Profiles, 2011
Exhibit 171. 2003-2007 Colorectal Cancer Age-Adjusted Mortality Rates
per 100,000 persons, by County
Hertford 29.9 Wayne 20.1
Greene 28.3 Northampton 18.9
Bertie 26.5 Carteret 18.3
Martin 26.3 Pitt 18.3
Washington 24 Wilson 18.1
Perquimans 23.1 Pasquotank 17.7
Chowan 22.1 Beaufort 16
Edgecombe 22.1 Currituck 15.9
Lenoir 21.4 Onslow 15.7
Halifax 21.1 Duplin 13.9
Craven 20.6 Dare 12.3
Nash 20.4 North Carolina 17.3
*CRC Mortality rates suppressed for Camden, Gates, Hyde, Jones, Pamlico, and Tyrrell counties due to small number of deaths
Source: Cancer Control Planet, State Cancer Profiles

129
Exhibit 172. 2004-2008 Female Breast Cancer Age-Adjusted Incidence Rates
per 100,000 women, by County
Gates 173.4 Bertie 127.0
Camden 161.6 Craven 125.7
Lenoir 148.1 Beaufort 124.8
Pitt 145.2 Pasquotank 123.3
Edgecombe 144.0 Northampton 122.2
Hyde 141.8 Martin 114.4
Tyrrell 139.8 Perquimans 113.9
Halifax 137.5 Hertford 113.3
Wilson 137.4 Pamlico 113.0
Washington 136.9 Chowan 109.7
Wayne 135.1 Currituck 99.7
Dare 133.9 Greene 98.9
Nash 132.7 Duplin 95.0
Carteret 129.0 Jones 94.7
Onslow 128.8 North Carolina 123.3
Source: Cancer Control Planet, State Cancer Profiles, 2011
Exhibit 173. 2003-2007 Female Breast Cancer Age-Adjusted Mortality Rates
per 100,000 persons, by County
Hertford 38.7 Martin 29.7
Bertie 37.4 Duplin 29.4
Edgecombe 35.6 Dare 28.3
Northampton 35.1 Nash 27.9
Pamlico 35.0 Pitt 26.3
Halifax 34.7 Beaufort 25.8
Wilson 33.2 Craven 25.8
Pasquotank 32.1 Carteret 24.6
Wayne 31.7 Onslow 24.3
Lenoir 30.5 North Carolina 24.4
*Female Breast Cancer mortality rates suppressed for Camden, Chowan, Currituck, Gates, Greene, Hyde, Jones, Perquimans,
Tyrrell and Washington counties due to small number of deaths.
Source: Cancer Control Planet, State Cancer Profiles, 2011

130
Exhibit 174. Incidence Rates for North Carolina, 2004-2008, Colon & Rectum

131
Exhibit 175. Age-Adjusted Death Rates for North Carolina, 2004-2008, Colon & Rectum

132
Exhibit 176. Incidence Rates for North Carolina, 2004-2008, Cervix

133
Exhibit 177. Age-Adjusted Death Rates for North Carolina, 2004-2008, Cervix

134
Exhibit 178. Incidence Rates for North Carolina, 2004-2008, Breast

135
Exhibit 179. Age-Adjusted Death Rates for North Carolina, 2004-2008, Breast

136
Cancer Resource Directory
for Eastern North Carolina April 16, 2012

137
This document contains the following information about cancer diagnosis, treatment or support in Eastern North Carolina:
Colonoscopy Locations in Eastern North Carolina, 2011
Colposcopy Referral Sites in Eastern North Carolina, 2011
FDA Approved Mammography Facilities in Eastern North Carolina, 2011
Hospital Locations in Eastern North Carolina, 2012
Federally Qualified Health Centers and Look-Alike Sites in Eastern North Carolina, 2012
Disclaimer: The information in this resource guide does not fully reflect cancer services for screening preventable cancers in eastern North Carolina.

138
Colonoscopy Locations in Eastern North Carolina, 2011
Beaufort County Vidant Beaufort Hospital Endoscopy and Ambulatory Surgery Beds 628 East 12th Street Washington, NC 27889 (252)975-4100
Vidant Pungo Hospital Ambulatory Surgery beds 202 East Water Street Belhaven, NC 27810 (252)943-2111 Bertie County Vidant Bertie Hospital Ambulatory Surgery beds 1403 S. King Street Windsor, NC 27983 (252)794-6600 Carteret County
The Surgical Center of Morehead City NC Licensed Ambulatory Surgical Facility-offers endoscopy 3714 Guardian Avenue Morehead City, NC 28557 (252)247-0314
Carteret County General Hospital Endoscopy and Ambulatory Surgery beds 3500 Arendell St. Morehead City, NC 28557 (252)808-6000
Chowan County Vidant Chowan Hospital Endoscopy and Ambulatory Surgery Beds 211 Virginia Rd. Edenton, NC 27932 (252)482-8451
Craven County CCHC Endoscopy Center Office-Based Colonoscopy Facility 975 Newman Road New Bern, NC 28562 (252)514-6685
CarolinaEast Internal Medicine Office-based Colonoscopy Facility 2604 Martin Luther King Jr Blvd New Bern, NC 28562 (252)638-4023 CarolinaEast Health System Endoscopy and Ambulatory Surgery Beds 2000 Neuse Blvd New Bern, NC 28561 (252)633-8640
Dare County The Outer Banks Hospital Endoscopy and Ambulatory Surgery Beds 4800 S Croatan Highway Nags Head, NC 27959 (252)449-4500
Duplin County Vidant Duplin Hospital Endoscopy and Ambulatory Surgery Beds 401 N. Main St. Kenansville, NC 28349 (910)296-0941
Edgecombe County Tarboro Endoscopy Center NC Licensed Ambulatory Surgical Facility-offers endoscopy 201 Clinic Drive Tarboro, NC 27886 (252)823-2105

139
Vidant Edgecombe Hospital Endoscopy and Ambulatory Surgery beds 111 Hospital Drive Tarboro, NC 27886 (252)641-7740 Halifax County Halifax Regional Medical Center Endoscopy and Ambulatory Surgery beds 250 Smith Church Rd Roanoke Rapids, NC 27870 (252)535-8011 Halifax Gastroenterology P.C. Office-Based Colonoscopy Facility 1007 Gregory Drive Roanoke Rapids, NC 27870 (252)535-6478 Hertford County Vidant Roanoke-Chowan Hospital Endoscopy and Ambulatory Surgery beds 500 South Academy St. Ahoskie, NC 27910 (252)209-3000 Lenoir County Kinston Medical Specialists NC Licensed Ambulatory Surgical Facility-offers endoscopy 701 Doctors Dr., Suite NC Kinston, NC 28501 (252)233-3231 Park Endoscopy Center, LLC NC Licensed Ambulatory Surgical Facility-offers endoscopy 2602 N. Heritage St. Kinston, NC 28501 (252)527-6565 Lenoir Memorial Hospital Endoscopy and Ambulatory Surgery beds 100 Airport Rd Kinston, NC 28501 (252)522-7797
Martin County
Martin General Hospital Endoscopy and Ambulatory Surgery beds 310 S. McCaskey Rd Williamston, NC 27892 (252)809-6179
Nash County
Boice-Willis Clinic Endoscopy Center NC Licensed Ambulatory Surgical Facility-offers endoscopy Rocky Mount Medical Park 901 N. Winstead Ave Rocky Mount, 27804 (252)937-0220
Onslow County
Onslow Memorial Hospital Endoscopy and Ambulatory Surgery beds 317 Western Blvd. Jacksonville, NC 28546 (252)557-2345
East Carolina Gastroentorology Endoscopy Center NC Licensed Ambulatory Surgical Facility-offers endoscopy 4, Office Park Dr. Jacksonville, NC 28546 (910)353-6158
Pasquotank County
Albemarle Gastro Associates Office-Based Colonoscopy Facility 405 Hastings Lane Elizabeth City, NC 27909 (252)335-5588 Northside Park Gastroenterology Office-Based Colonoscopy Facility 102 Northside Park Drive Elizabeth City, NC 27909 (252)335-4619

140
Albemarle Hospital Endoscopy and Ambulatory Surgery beds 1144 North Road Street Elizabeth City, NC 27906 (252)335-0531
Pitt County
Vidant Medical Center Endoscopy and Ambulatory Surgery beds 2100 Stantonsburg Rd Greenville, NC 27835 (252)847-4451
Atlantic Gastroenterology Endoscopy Center, PA NC Licensed Ambulatory Surgical Facility-offers endoscopy 2465 Emerald Place Greenville, NC 27834-578 (252)758-2424
Carolina Digestive Diseases NC Licensed Ambulatory Surgical Facility-offers endoscopy 704 W.H. Smith Blvd Greenville, NC 27834 (252)758-8181
East Carolina Endoscopy Center NC Licensed Ambulatory Surgical Facility-offers endoscopy 2100 Stantonsburg Road Greenville, NC 27834 (252)744-6600
Gastroenterology East, PA NC Licensed Ambulatory Surgical Facility-offers endoscopy 2210 Hemby Lane Greenville, NC 27834 (252)551-3000
Quadrangle Endoscopy Center NC Licensed Ambulatory Surgical Facility-offers endoscopy 1850 W. Arlington Blvd Greenville, NC 27834
Washington County Washington County Ambulatory Surgery beds 958 US Hwy 64 East Plymouth, NC 27962 (252)793-4135 Wayne County Wayne Memorial Hospital Endoscopy and Ambulatory Surgery beds 2700 Wayne Memorial Drive Goldsboro, NC 27534-9459 (919)736-1110
Goldsboro Endoscopy Center, Inc NC Licensed Ambulatory Surgical Facility-offers endoscopy 2705 Medical Office Place Goldsboro, NC 27534 (919)580-9111
Wilson County Wilson Medical Center Endoscopy and Ambulatory Surgery beds 1705 Tarboro Street SW Wilson, NC 27893 (252)399-8040 CGS Endoscopy Center NC Licensed Ambulatory Surgical Facility-offers endoscopy 2520 Airport Blvd., Suite F Wilson, NC 27896 (252)206-5622 Wilson Digestive Diseases Center, P.A. NC Licensed Ambulatory Surgical Facility-offers endoscopy 2402 Camden Street Wilson, NC 27892 (252)237-5060
(252)757-3636

141
Colposcopy Referral Sites in Eastern North Carolina, 2011 Beaufort County Washington Women’s Care Accepts BCCCP? No 1204 Brown Street Washington, NC 27889 (252)946-6544
OBGYN of Washington- A subsidiary of Beaufort Regional Health System Accepts BCCCP? Yes 2010 N. Brown Street Washington, NC 27889 (252)975-1188
Bertie County Bertie County Rural Health Dr. Ricky Brookes Accepts BCCCP? Yes 222 County Farm Road Windsor, NC 27983 (252)794-3042
Carteret County Carteret Ob-Gyn Accepts BCCCP? Yes 3511 John Platt Drive Morehead City, NC 28557 (252)247-4297 Southside Healthcare for Women Dr. William Rawls Accepts BCCCP? Yes 3106 Arendell St. Morehead City, NC 28557 (252)808-2500
Dr. Darryl L. Falls Accepts BCCCP? No 1508 Arendell St. Morehead City, NC 28557 (252)726-7374
Craven County
Craven County Health Department Accepts BCCCP? Yes 2818 Neuse Boulevard New Bern, NC 28561 (252)636-4920
East Carolina Women’s Center, P.A. Accepts BCCCP? Yes 200 Stonebridge Square Havelock, NC 28532 (252)633-3942
Currituck County
Family Practice & Ob-Gyn Dr. Norman Dahm Accepts BCCCP? No 8845 Caratoke Highway Harbinger, NC 27941 (252)491-8550
Dare County
Coastal Women’s Clinic Accepts BCCCP? No 4810 S. Croatan Hwy Nags Head, 27959 (252)261-4885
Outer Banks Center for Women Accepts BCCCP? No 4917 South Croatan Highway Nags Head, 27959 (252)449-2100
Duplin County
Goshen Medical Center-Faison Accepts BCCCP? Yes 444 S. West Center St. Faison, NC 28341 (910)267-0421

142
Goshen Medical Center-Women’s Health Accepts BCCCP? Yes 212 Duplin St. Keenansville, NC 28349 (910)296-0790 Goshen Medical Center-Warsaw Accepts BCCCP? Yes 603 E. College St. Warsaw, NC 28398 (910)293-3900
Edgecombe County Tarboro Women’s Care Accepts BCCCP? Yes 2704 N. Main St. Tarboro, NC 27886 (252)823-6333 Halifax County Women’s Health Specialists, P.A. Accepts BCCCP? Yes 1381 Medical Center Drive Roanoke Rapids, NC 27870 (252) 535-1414 Hertford County OB-GYN Women’s Care of Ahoskie Accepts BCCCP? Yes 700 Academy St. S Ahoskie, NC 27910 (252)862-4054
Lenoir County Lenoir County Health Department Accepts BCCCP? Yes 130 South Queen Street Kinston, NC 28502 (252)559-6450
Kinston Community Health Center Accepts BCCCP? No 324 N. Queen Street Kinston, NC 28501 (252)208-1485 Lenoir Women’s Care (Kinston) Accepts BCCCP? No 103 Airport Rd Kinston, NC 28501 (252)527-7208
Dr. Joan Baker Accepts BCCCP? No 608 Airport Road Suite B Kinston, NC 28504 (252)520-0020
Martin County Martin County Health Department Accepts BCCCP? Yes 210 West Liberty Street Williamson, NC 27892 (252) 793-1619
Roanoke Women’s Healthcare Melissa Greene, CNM Accepts BCCCP? Yes 104 Medical Drive Williamston, NC 27892 (252) 809-6341
Nash County Nash OB/GYN Associates Accepts BCCCP? Yes 200 Nash Medical Arts Mall Rocky Mount, NC 27804 (252)443-5941 Englewood OB/GYN Associates Accepts BCCCP? Not indicated 140 N. Englewood Dr. Rocky Mount, NC 27804 (252)937-6611

143
Rocky Mount GYN and Women’s Health Accepts BCCCP? Not indicated 132 Foy Dr. Rocky Mount, NC 27804 (252)443-6622 Women’s Health of Rocky Mount Accepts BCCCP? Not indicated 804 English Rd, Suite 2010 Rocky Mount, NC 27804 (252)451-7060
Rocky Mount-OIC Medical Center Accepts BCCCP? Yes 111 Fairview Road Rocky Mount, NC 27803 (252)446-3333
Onslow County Crist Clinic for Women Accepts BCCCP? No 250 Memorial Drive Jacksonville, NC 28540 (910)353-2115
Women’s Healthcare Associates Accepts BCCCP? No 245 Memorial Drive Jacksonville, NC 28540 (910)353-4333
Pasquotank County Albemarle Regional Health Services-Pasquotank Accepts BCCCP? Yes 711 Roanoke Avenue, Elizabeth City, NC 27909 252-338-4400 Pitt County East Carolina Brody Outpatient Clinic Accepts BCCCP? No Emergency Road Greenville, NC 27834 (252)744-2350
ECU Physicians-Family Medicine Center Accepts BCCCP? No 101 Heart Drive Greenville, NC 27834 (252) 744-4611 James D. Bernstein Community Health Center Accepts BCCCP? No 261 Belvoir Hwy Greenville, NC 27834-8661 (252) 695-6352 Tyrrell County Tyrrell County Health Department Accepts BCCCP? Yes 408 Bridge Street Columbia, NC 27925 (252) 793-3023 Washington County Washington County Health Department Accepts BCCCP? Yes 198 NC Hwy 45 North Plymouth, NC 27962 (252) 793-3023
Wayne County Wayne Women’s Clinic Accepts BCCCP? Not indicated 102 Handley Park Court Goldsboro, NC 27534 (919) 734-3344
Goldsboro OBGYN, Associates, PLLC Accepts BCCCP? Yes 2608 Hospital Rd Goldsboro, NC 27534 (919)735-3464

144
Wilson County Wilson County Health Department Accepts BCCCP? Yes 1801 Glendale Drive Wilson, NC 27893 (252)237-3141
Harvest Family Health Center Accepts BCCCP? No 8282 NC 58 S Elm City, NC 27822 (252) 443-7744
Wilson OB/GYN Accepts BCCCP? Not indicated 2500 Horton Boulevard Southwest Wilson, NC 27893 (252) 206-1000

145
FDA Approved Mammography Facilities in Eastern North Carolina, 2011 Beaufort County
Vidant Pungo Hospital 202 East Water Street Belhaven, NC 27810 (252)944-2210
Eastern Radiologist Inc-Washington, NC 630 East Eleventh St. Washington, NC 27889 (252)946-2137
Bertie County
Vidant Bertie Hospital 1403 S. King Street Windsor, NC 27983 (252)794-6626
Carteret County CGH Imaging Center 3402 Arendell Street Morehead City, NC 28557 (252)808-6551
Carteret OBGYN Associates 3511 John Platt Dr. Morehead City, NC 28557 (252)247-4197
Chowan County East Carolina Health-Chowan, Inc DBA Chowan Hospital 211 Virginia Rd. Edenton, NC 27932 (252)482-6245
Craven County Naval Health Clinic-Cherry Point Building 4389 Beaufort Rd PSC Box 8023 Cherry Point, NC 28533 (252)466-0250
CCHC Imaging 1030 Medical Park Ave New Bern, NC 28562 (252)637-5480
Carolina Diagnostic Center 640 McCarthy Blvd New Bern, NC 28562 (252)634-6440
Eastern Carolina Internal Medicine PA 2604 Dr. Martin Luther King Jr Blvd New Bern, NC 28562 (252)633-1010
Dare County
Regional Medical Services, Inc 5200 N Croatan Hwy Kitty Hawk, NC 27949 (252)255-6040
The Outer Banks Hospital 4800 S. Croatan Hwy Nags Head, NC 27959 (252)449-5918
Duplin County
Goshen Medical Center, Inc 444 SW Center St. Faison, NC 28341 (910)267-0421
Vidant Duplin Hospital 401 N. Main St. Kenansville, NC 28349 (910)296-2665
Edgecombe County
Vidant Edgecombe Hospital 111 Hospital Dr. Tarboro, NC 27886 (252)641-7795
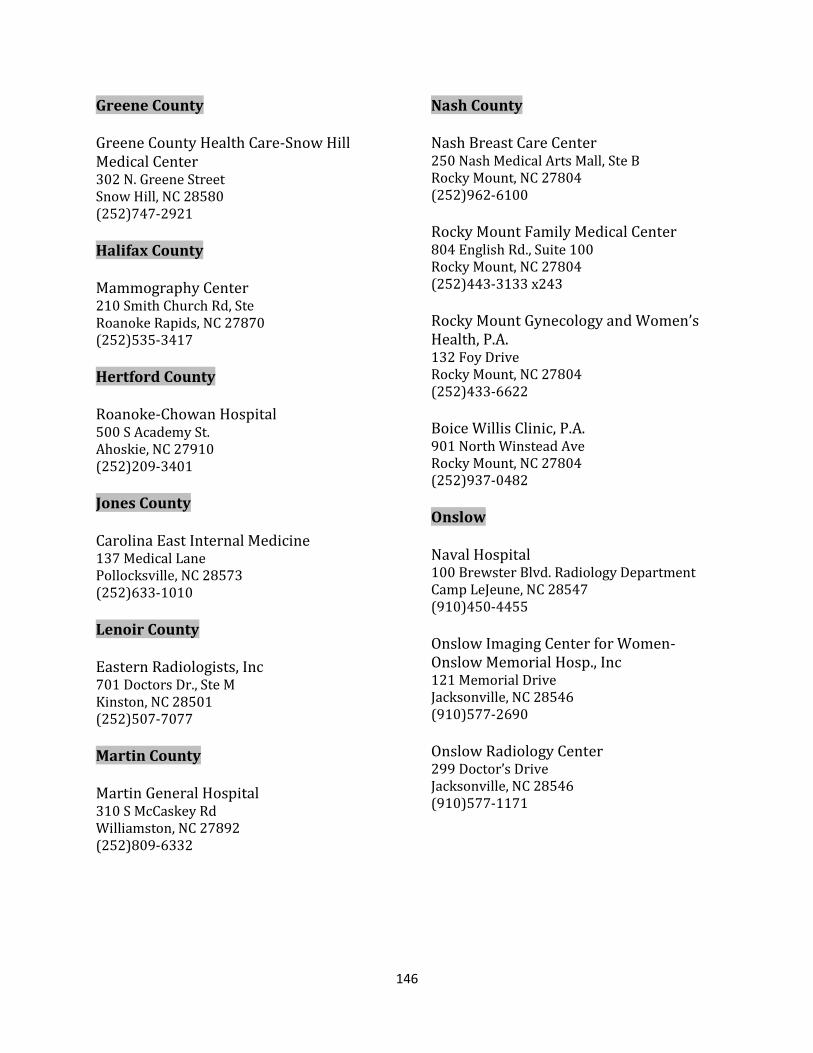
146
Greene County Greene County Health Care-Snow Hill Medical Center 302 N. Greene Street Snow Hill, NC 28580 (252)747-2921
Halifax County Mammography Center 210 Smith Church Rd, Ste Roanoke Rapids, NC 27870 (252)535-3417
Hertford County Roanoke-Chowan Hospital 500 S Academy St. Ahoskie, NC 27910 (252)209-3401
Jones County Carolina East Internal Medicine 137 Medical Lane Pollocksville, NC 28573 (252)633-1010 Lenoir County Eastern Radiologists, Inc 701 Doctors Dr., Ste M Kinston, NC 28501 (252)507-7077
Martin County Martin General Hospital 310 S McCaskey Rd Williamston, NC 27892 (252)809-6332
Nash County Nash Breast Care Center 250 Nash Medical Arts Mall, Ste B Rocky Mount, NC 27804 (252)962-6100 Rocky Mount Family Medical Center 804 English Rd., Suite 100 Rocky Mount, NC 27804 (252)443-3133 x243
Rocky Mount Gynecology and Women’s Health, P.A. 132 Foy Drive Rocky Mount, NC 27804 (252)433-6622 Boice Willis Clinic, P.A. 901 North Winstead Ave Rocky Mount, NC 27804 (252)937-0482
Onslow Naval Hospital 100 Brewster Blvd. Radiology Department Camp LeJeune, NC 28547 (910)450-4455 Onslow Imaging Center for Women- Onslow Memorial Hosp., Inc 121 Memorial Drive Jacksonville, NC 28546 (910)577-2690 Onslow Radiology Center 299 Doctor’s Drive Jacksonville, NC 28546 (910)577-1171
147
Pasquotank County Albemarle Hospital 1144 North Road Street Elizabeth City, NC 27909 (252)384-4128 Pitt County Physicians East P.A. Greenville Women’s Clinic 2251 Stantonsburg Rd Greenville, NC 27834 (252)757-3131
Physicians East-Greenville Obstetrics and Gynecology 101 Bethesda Dr. Greenville, NC 27834 (252)758-4181
Physicians East Diagnostic Center 1850 West Arlington Blvd Greenville, NC 27834 (252)413-6601
Eastern Radiologists, Inc Breast Imaging Center 2101 West Arlington Blvd. Suite 100 Greenville, NC 27834 (252)752-5000
Washington County Washington County Hospital 958 US Highway 64 East Plymouth, NC 27962 (252)793-7706 Wayne County Wayne Memorial Hospital 2700 Wayne Memorial Drive Goldsboro, NC 27530 (919)731-6013
Wayne Radiologist, P.A. 2700 Medical Office Place Goldsboro, NC 27534 (919)734-1866 x5310
Wilson County Wilson Medical Center Outpatient Imaging 1711 Medical Park Dr. Wilson, NC 27893 (252)399-8900
Family Medicine 2546 Ward Blvd. Wilson, NC 27893 (252)399-0707

148
Hospital Locations in Eastern North Carolina, 2012
Beaufort County Vidant Beaufort Hospital 628 East 12th Street Washington, NC 27889 (252)975-4100
Vidant Pungo Hospital 202 E. Water St. Belhaven, NC 27810 (252)943-2111
Bertie County Vidant Bertie Hospital 1403 S. King Street Windsor, NC 27983 (252)794-6626
Carteret County Carteret County General Hospital 3500 Arendell St. Morehead City, NC 28557 (252)808-6000
Chowan County Vidant Chowan Hospital 211 Virginia Rd. Edenton, NC 27932 (252)482-8451 Craven County CarolinaEast Health System 2000 Neuse Blvd New Bern, NC 28561 (252)633-8640
Dare County The Outer Banks Hospital 4800 S Croatan Highway Nags Head, NC 27959 (252)449-4500
Duplin County Vidant Duplin Hospital 401 N. Main St. Kenansville, NC 28349 (910)296-0941
Edgecombe County Vidant Edgecombe Hospital 111 Hospital Drive Tarboro, NC 27886 (252)641-7740
Halifax County Halifax Regional Medical Center 250 Smith Church Rd Roanoke Rapids, NC 27870 (252)535-8011 Our Community Hospital Bruce Medical Plaza 921 Junior High Rd Scotland Neck, NC 27874 (252)826-4144 Hertford County Vidant Roanoke-Chowan Hospital 500 South Academy St. Ahoskie, NC 27910 (252)209-3000

149
Lenoir County Lenoir Memorial Hospital, Inc 100 Airport Rd Kinston, NC 28501 (252)522-7797 Martin County Martin General Hospital 310 S. McCaskey Rd Williamston, NC 27892 (252)809-6179 Nash County Nash Health Care Systems 2460 Curtis Ellis Dr. Rocky Mount, NC 27804 (252)962-8000
Onslow County Onslow Memorial Hospital 317 Western Blvd. Jacksonville, NC 28546 (252)557-2345
Pasquotank County Albemarle Health 1144 North Road Street Elizabeth City, NC 27909 (252)335-0531 Pitt County Vidant Medical Center 2100 Stantonsburg Rd Greenville, NC 27835 (252)847-4451
Washington County Washington County Hospital 958 US Hwy 64 East Plymouth, NC 27962 (252)793-4135
Wayne County Wayne Memorial Hospital 2700 Wayne Memorial Drive Goldsboro, NC 27534-9459 (919)736-1110
Wilson County Wilson Medical Center 1705 Tarboro Street SW Wilson, NC 27893 (252)399-8040

150
Federally Qualified Health Centers and Look-Alike Sites in Eastern North Carolina, 2012
Beaufort County Agape Community Health Center 120 W. Martin Luther King Jr. Dr. Washington, NC 27889-4906 (252)940-0602
Bertie County Lewiston Community Health Center 307 S. Main St. Lewiston, NC 27849-9656 (252)348-2545
Windsor Community Health Center 104 Rhodes Ave Windsor, NC 27983-9656 (252)794-1835x226
Colerain Primary Care 109 W River St. Colerain, NC 27924-9006 (252)356-2404 Chowan County Gateway Community Health Centers-Tyner 2896 Virginia Rd Tyner, NC 27980-9777 (252)384-4805
Duplin County Community Health Services 325 North Carolina 55 Wes Mount Olive, NC 28365 (919)658-5900
Goshen Medical Center-Beulaville 119 Crossover Rd Beulaville, NC 28518-8801 (910)298-3125
Goshen Medical Center-Women’s Health 212 Duplin St. Kenansville, NC 28349-9024 (910)296-0790
Plainview Health Services 360 E Charity Rd Rose Hill, NC 28458-8303 (910)289-3086 Goshen Medical Center-Wallace Medical Services 112 Medical Village Dr. Wallace, NC 28466 (910)285-2330 Goshen Medical Center-Warsaw Wellness Center 113 S Pine St Warsaw, NC 28398-1924 (910)293-7246
Goshen Medical Center-Warsaw 603 E College St Warsaw, NC 28398-2104 (910)293-3900
Edgecombe County Freedom Hill Community Health Center 162 NC Highway 33 E Tarboro, NC 27886-8582 (252)641-0514
Rocky Mount OIC Family Medical Center 111 S Fairview Rd Rocky Mount, NC 27801-6971 (252)446-3333

151
Gates County
Gateway Community Health Centers-Gatesville 501 Main St. Gatesville, NC 27938-9424 (252)357-2167
Greene County
Greene County Health Care/Snow Hill Medical Center 302 N Greene St Snow Hill, NC 28580-1412 (252)747-8162
Kate B. Reynolds Medical Center 205 Martin Luther King Jr. Pkwy Snow Hill, NC 28580-1320 (252)747-4199
Walstonburg Medical Center 204 S Main St Walstonburg, NC 27888-8900 (252)753-3771
Halifax County
Rural Health Group at Lake Gaston 108 Mosby Ave Littleton, NC 27850-9411 (252)586-5411
Rural Health Group at Roanoke Rapids 2066 NC Highway 125 Roanoke Rapids, NC 27870-9436 (252)586-5000
Rural Health Group at Scotland Neck 919 Jr High School Rd Scotland Neck, NC 27874-1219 (252)826-3143
Rural Health Group at Twin County 204 Evans Rd. Hollister, NC 27844 (252)586-5151
Hertford County Roanoke Chowan Community Health Center Ahoskie 240 S. Academy St. Ahoskie, NC 27910-2451 (252)332-3548
Murfreesboro Primary Care 305 Beechwood Blvd Murfreesboro, NC 27855-1134 (252)398-3638
Jones County Goshen Medical Center-Trenton 104 E Lakeview Dr. Trenton, NC 28585-8893 (252)448-4321
Lenoir County Kinston Community Health Center 324 N Queen St Kinston, NC 28501-4932 (252)522-9485
Nash County Rural Health Group at Whitakers 105 SE Railroad St. Whitakers, NC 27891 (252)437-2171
Northampton County Rural Health Group at Jackson 9425 NC Highway 305 Jackson, NC 27845-9679 (252)534-1661
Rural Health Group at Rich Square 200 S Main St Rich Square, NC 27869 (252)539-2082

152
Onslow County Goshen Medical Center-New River 1200 Hargett St Jacksonville, NC 28540-5933 (910)219-1082 Pamlico County Pamlico Community Health Center 13531 Highway 55 E Alliance, NC 28509 (252)745-2070 Pitt County Grimesland Community Resource Center 550 River St Grimesland, NC 27837 (252)752-1857
James D. Bernstein Community Health Center 261 Belvoir Rd Greenville, NC 27834-8661 (252)695-6352
JR Harvey Health Resources Center 540 Queen St Grifton, NC 28530-7338 (252)524-3475
Wayne County Goshen Medical Center-East Pointe 200 W Ash St Ste 202 Goldsboro, NC 27530-3679
Goshen Medical Center-Fremont 109 S Sycamore St Fremont, NC 27830-8710 (919)242-4382
Goshen Medical Center-Goldsboro 2701 Medical Office Pl Goldsboro, NC 27534-9458 (919)739-8680
Goshen Medical Center-Lambert 130 NE Center St Mount Olive, NC 28365-1701 (919)658-2505 Wilson County Harvest Family Health Center 8282 S NC Highway 58 Elm City, NC 27822-8079 (252)433-7744 Wilson Community Health Center 303 Green St E Wilson, NC 27893-4105 (252)243-9800
(919)587-0364 End of file