Cancer Incidence in New South Wales Migrants 1991 to 2001
23
Cancer Incidence in New South Wales Migrants 1991 to 2001 Rajah Supramaniam 1 Dianne O’Connell 1 Elizabeth Tracey 2 Freddy Sitas 1 1 Cancer Epidemiology Research Unit, The Cancer Council NSW 2 NSW Central Cancer Registry, Cancer Institute NSW June 2006
Transcript of Cancer Incidence in New South Wales Migrants 1991 to 2001

Cancer Incidence in
New South Wales Migrants
1991 to 2001
Rajah Supramaniam1
Dianne O’Connell1
Elizabeth Tracey2
Freddy Sitas1
1 Cancer Epidemiology Research Unit, The Cancer Council NSW
2 NSW Central Cancer Registry, Cancer Institute NSW
June 2006
Cancer Incidence in NSW Migrants
2
Acknowledgments
The authors would like to thank Xue Qin Yu, Leslie McCawley, Katie Armstrong, David Smith and
Leonardo Simonella for reviewing a draft of this report. We would also like to thank Professor Richard
Taylor, Professor Erich Kliewer and Dr Jill Kaldor for reviewing the final draft of this report.
Thank you to Michael Ryan, Dr Andrew Hayen and Dr Mark Clements for their advice and assistance.
The NSW Central Cancer Registry provided the data. The Central Cancer Registry is managed and
operated by the Cancer Institute NSW under a memorandum of understanding with the NSW
Department of Health.
ISBN 192 1041 315
Key words: Neoplasms, incidence, ethnicity, migrants, New South Wales, Australia
Suggested citation:
Supramaniam R, O’Connell DL, Tracey EA, Sitas F. Cancer Incidence in New South Wales Migrants
1991 to 2001. Sydney: The Cancer Council NSW, 2006.
Published by The Cancer Council NSW March 2006
Other reports in this series:
Breast Cancer Survival in NSW in 1973 to 1995
Survival from Cancer in NSW in 1980 to 1995
Survival from Cancer in Central Sydney Area Health Service in 1980 to 1995
Survival from Cancer in Southern and Eastern Sydney Area Health Service in 1980 to 1995
Lung Cancer in NSW 1973 to 1998
Remoteness and Cancer Incidence, Mortality and Survival in New South Wales 1992 to 1996
Cancer survival, incidence and mortality by Area Health Service in NSW 1994 to 2000
Correspondence to:
Cancer Research and Registers Division
The Cancer Council NSW
Locked Mail Bag 8000
Potts Point 1335
NSW Australia
Telephone: 61 2 9334 1900
Fax: 61 2 9334 1778
Email: [email protected]
Internet: www.cancercouncil.com.au

Cancer Incidence in NSW Migrants
3
Table of Contents Page
Acknowledgements ......................................................................................................................... 2
Forewords........................................................................................................................................ 5
Summary ......................................................................................................................................... 7
Introduction ..................................................................................................................................... 15
Methods ........................................................................................................................................... 19
Guide to interpretation of results .................................................................................................... 21
Discussion ....................................................................................................................................... 22
Results Section 1: Cancer incidence by place of birth
China ............................................................................................................................................... 24
Egypt ............................................................................................................................................... 28
Fiji ................................................................................................................................................... 32
Germany .......................................................................................................................................... 36
Greece.............................................................................................................................................. 40
Hong Kong and Macau.................................................................................................................... 44
India................................................................................................................................................. 48
Indonesia ......................................................................................................................................... 52
Italy.................................................................................................................................................. 56
Korea ............................................................................................................................................... 60
Lebanon........................................................................................................................................... 64
Malaysia and Brunei........................................................................................................................ 68
Malta................................................................................................................................................ 72
Netherlands ..................................................................................................................................... 76
New Zealand.................................................................................................................................... 80
Philippines ....................................................................................................................................... 84
Poland.............................................................................................................................................. 88
Portugal ........................................................................................................................................... 92
South Africa .................................................................................................................................... 96
Spain................................................................................................................................................100
Sri Lanka .........................................................................................................................................104
United Kingdom and Ireland ...........................................................................................................108
United States of America.................................................................................................................112
Vietnam ...........................................................................................................................................116
Yugoslavia.......................................................................................................................................120
Results Section 2: Cancer incidence by cancer type
Bladder cancer.................................................................................................................................124
Breast cancer....................................................................................................................................128
Cancers of the brain and central nervous system.............................................................................130
Cancers with an indefinite site.........................................................................................................134
Cervical cancer ................................................................................................................................136
Colorectal cancer .............................................................................................................................138
Head and neck cancer ......................................................................................................................142
Kidney cancer..................................................................................................................................146
Leukaemia .......................................................................................................................................150
Liver cancer .....................................................................................................................................154
Lung cancer .....................................................................................................................................158
Melanoma of the skin ......................................................................................................................162
Non-Hodgkin lymphoma.................................................................................................................166
Ovarian cancer.................................................................................................................................170
Pancreatic cancer .............................................................................................................................172
Prostate cancer.................................................................................................................................176
Stomach cancer................................................................................................................................178
Testicular cancer..............................................................................................................................182
Thyroid cancer.................................................................................................................................184
Uterine cancer..................................................................................................................................188
Cancer Incidence in NSW Migrants
4
Appendices
Appendix 1 Estimated resident populations by place of birth, sex and year for NSW 1991 to
2001
Appendix 2 Places of birth included in this report and names of constituent places
Appendix 3 Cancer types included in this report and descriptions of grouped types
Appendix 4 Cases, standardised incidence ratios compared to Australian-born males and females
and 99% confidence intervals by cancer type by place of birth, NSW 1991 to 2001
Appendix 5 Cases, standardised incidence ratios compared to males and females living in their
place of birth and 99% confidence intervals by cancer type by place of birth NSW
1991 to 2001
Appendix 6 Calculation of standardised incidence ratios and confidence intervals
Appendix 7 References

Cancer Incidence in NSW Migrants
5
Forewords
From the School of Public Health and Community Medicine, The University of New South Wales Cancer is a life-threatening disease that affects all Australians, but differentially. The risk of getting
cancer varies according to family history, where we were born, our age and gender, among many
exposure factors. Yet, each person probably has a friend, family member or work colleague with
cancer. At least a quarter of us will be diagnosed with cancer before we turn 75. Cancer is on the rise in
Australia, and concerns us all.
To effectively fight cancer, we need timely and high quality data. Health services planning depends on
accurate knowledge of who is most at risk of cancer, what types of tumours are most prevalent, and the
trajectory of the disease. This report from The Cancer Council NSW describes the incidence of cancer
in the state from 1991 to 2001. A series of analyses done by place of birth, tumour type and sex
strongly confirm that cancer affects people differently. The report also highlights the complexities
involved in migration cancer studies. NSW is the most culturally diverse state in Australia. This rich
ethnic mix poses considerable challenges for cancer control.
Overall, Australia has an excellent record in cancer management. We still have a long way to go
however in ensuring equitable outcomes, such as timely detection and optimal treatment for everyone.
We are still learning about different cultural responses to cancer. Often, we do not provide appropriate
care for people who have grown up with different values about the early detection of life-threatening
diseases and subsequent intensive hospital treatment. The wide diversity in health beliefs and
knowledge about cancer is a barrier to optimal care, compounded by language barriers and a lack of
familiarity with the Australian health care system.
Regular, useful statistical analyses on cancer trends by place of birth are essential planning tools to
facilitate monitoring of equitable outcomes. At a national level, the Australian National Cancer
Strategies Group Data Monitoring Committee has noted the need for the kind of statistical analyses
contained in this report. The Cancer Council NSW is to be congratulated for its excellent report that
will support public health research and improve our knowledge of cancer incidence in NSW. The
Cancer Epidemiology Research Unit consistently produces work of top quality, with detailed and
careful analyses of practical use, and this is no exception.
Associate Professor Rosemary Knight
School of Public Health and Community Medicine
University of New South Wales, Sydney
From CanRevive This report provides an overview and some very comprehensive data for shaping the future provision
of treatment, information and prevention services for different migrant groups living with cancer. The
higher incidence rate of liver cancer, as revealed in this report, in Chinese male migrants from China
and Hong Kong and Macau, who were resident in NSW, coincides with the number of cancer cases
serviced by CanRevive.
Despite female migrants from China having had a 45% lower incidence rate of breast cancer compared
to the Australian-born population of NSW, CanRevive notes that the incidence rate in female migrants
from China has been on the rise in recent years. This rising trend matches with the findings on Chinese
migrants in NSW when compared with females still living in China.
CanRevive finds these migrant studies invaluable especially as NSW is where the majority of
Australian-Chinese migrants call home. This report contributes data and evidence leading to the
identification of specific health needs, such as diet and smoking among others, and to promote
awareness of protective behaviour in the migrant communities.
Dennis Yeung
President, CanRevive

Cancer Incidence in NSW Migrants
6
From Cancer Voices
Cancer Voices NSW is the state level voice for people affected by cancer. We welcome the Cancer
Council NSW publication of Cancer incidence in NSW migrants 1991 to 2001.
By providing an updated overview of the types of cancer experienced by people of many national
origins, this work will help planners and service providers. It offers a basis for helping the cancer
world understand what sort of diet, environment and lifestyle relates to which cancers. Clearer
information of this type will help all people affected by cancer.
We believe its findings will also be useful for the Cancer Councils’ Multicultural Information Service,
an important component of The Cancer Council NSW’s assistance to people of different national
origins.
We see this report as a building block for policies about prevention, protection, information and care,
with potential to positively influence the eventual journey of people affected by cancer.
Sally Crossing AM
Chair, Cancer Voices NSW
From the Cancer Council Multicultural Information Service
Cancer incidence in NSW migrants 1991 to 2001 is a long awaited report with valuable information on
cancer incidence among the migrant groups in NSW. The information contained in this report is
immensely useful for targeting program strategies towards combating certain types of cancers among
specific language groups and therefore enhancing the efficiency in delivering both prevention and
information and support programs in the migrant community.
The comparative rates of cancer among the different migrant communities as well as the comparisons
between the post- and pre-migration experience of cancer, is a unique contribution of this report and
perhaps very significant. The report captures this information in a fascinating way to form the basis for
future research. The impact of changes in lifestyles, food choices and general wellbeing after
migrating to a new country may need further investigations to answer questions regarding these
differential rates.
The Cancer Council Multicultural Information Service will be delighted to use this report as a resource.
This document will fill in gaps in information available on migrant communities and cancer and has the
potential to be used as a credible reference by health professionals, cancer services and the community.
Ms Gunjan Tripathi
Manager, Cancer Council Multicultural Information Service
The Cancer Council NSW

Cancer Incidence in NSW Migrants
7
Summary
In 1993, The Cancer Council NSW published a report called Common cancers in migrants to NSW in
1972 to 1990 (1)
. This new report follows that theme by describing the incidence of cancer in NSW for
the subsequent period 1991 to 2001 by place of birth. It describes the incidence of the 20 most common
cancers for the 25 most common places of birth in NSW.
The report uses data abstracted from the NSW Central Cancer Registry along with incidence data from
the International Agency for Research on Cancer’s GLOBOCAN databases to compare incidence in
migrants to Australia to both Australian-born people and to people still resident in their respective
places of birth.
Summary tables
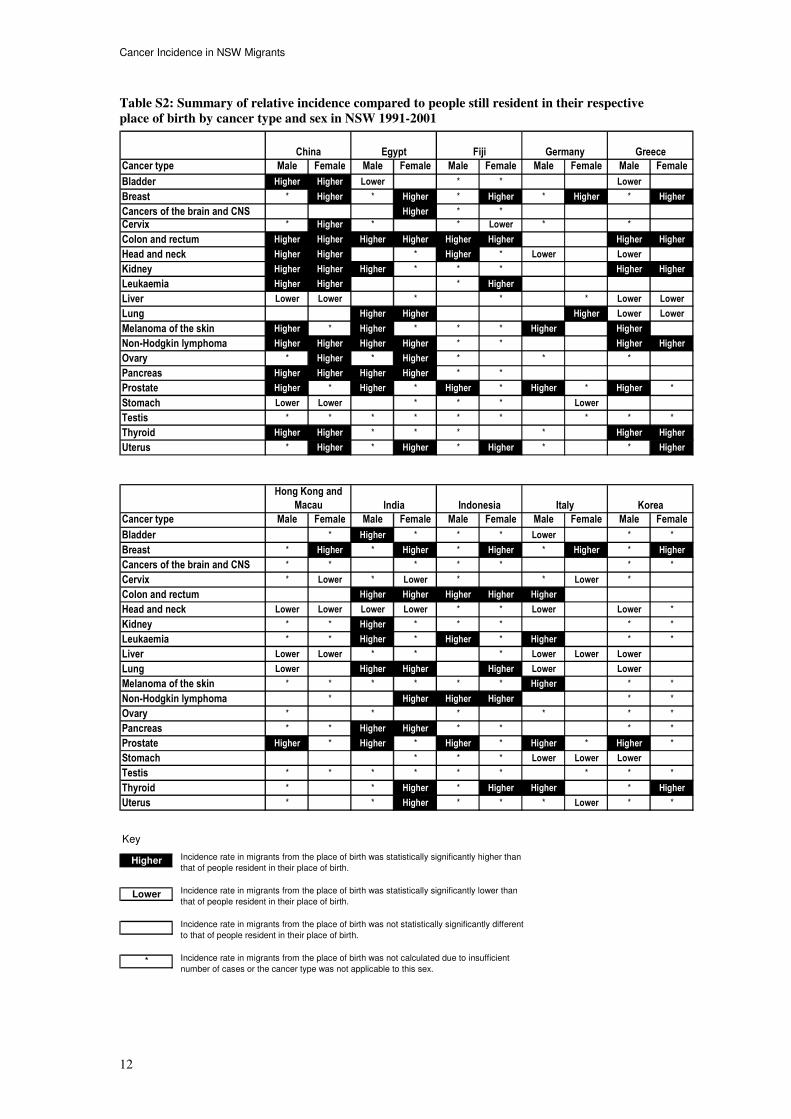
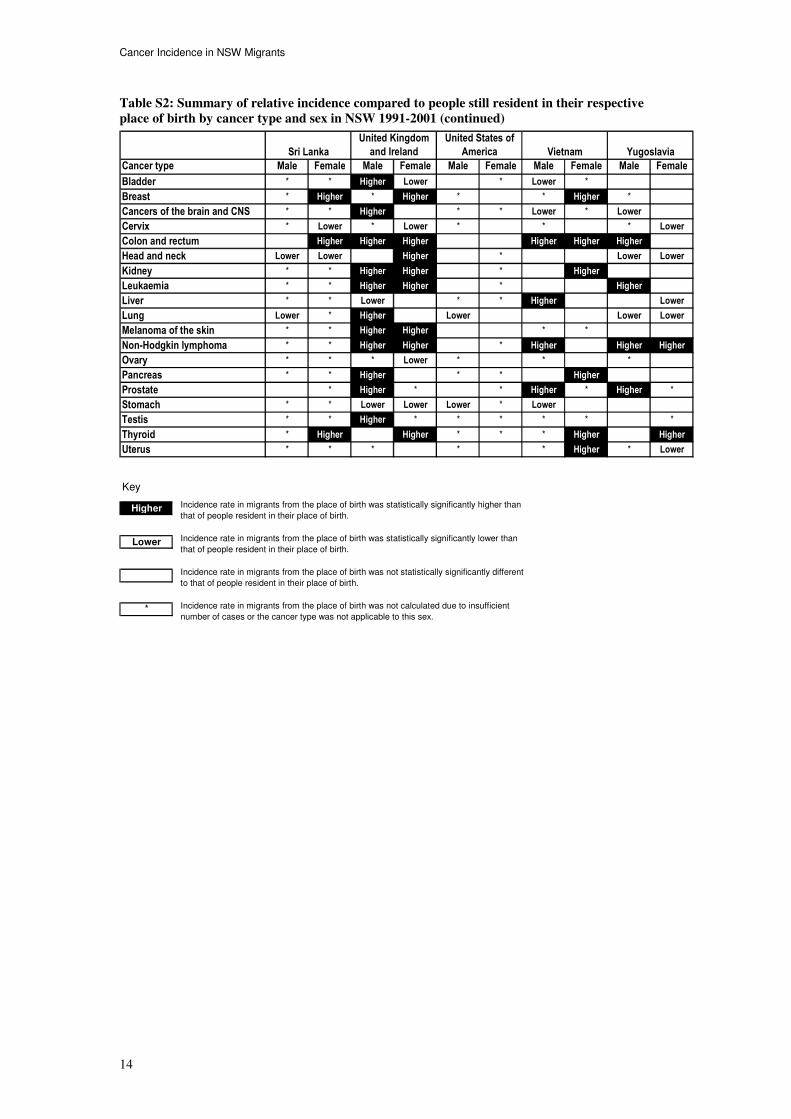
Tables S1 and S2 summarise the results. Table S1 shows the results of comparing the incidence of
cancer in NSW in 1991 to 2001 by place of birth and sex with the Australian-born population. Table S2
shows the results of comparing the incidence of cancer in NSW in 1991 to 2001 by place of birth and
sex with people still resident in their respective places of birth.
Incidence compared to Australian-born in NSW (Table S1)
Males
The observed incidence of liver and stomach cancers by place of birth were all higher than, or similar
to, that of the Australian-born male population.
The observed incidence of colorectal, brain and central nervous system and prostate cancers, cancers
with an indefinite or unspecified site, melanoma of the skin and non-Hodgkin lymphoma by place of
birth were all lower than, or similar to, that of the Australian-born male population.
The incidence by place of birth was mixed with some rates higher, some lower and some similar to the
Australian-born male population for leukaemia, cancers of the bladder, head and neck, kidney, lung,
testis and thyroid.
There were no significant differences in the incidence of pancreatic cancer by place of birth compared
to that of the Australian-born male population.
Females
The observed incidence by place of birth of liver, ovarian, stomach and thyroid cancers were all higher
than, or similar to, that of the Australian-born female population.
The observed incidence by place of birth of brain and central nervous system, breast, colorectal and
kidney cancers, cancers with an indefinite or unspecified site and melanoma of the skin were all lower
than, or similar to, that of the Australian-born female population.
The incidence by place of birth was mixed with some rates higher, some lower and some similar to the
Australian-born female population for non-Hodgkin lymphoma and cancers of the cervix, head and
neck, lung and uterus.
There were no significant differences in the incidence by place of birth of leukaemia and bladder and
pancreatic cancer compared to that of the Australian-born female population.
Incidence compared to place of birth (Table S2)
Males
The observed incidence in male migrants of kidney, pancreatic, prostate, testicular and thyroid cancers
as well as leukaemia, melanoma of the skin and non-Hodgkin lymphoma by place of birth were all
higher than, or similar to, that of males resident in their place of birth.
The observed incidence in male migrants of cancers of the stomach by place of birth was lower than, or
similar to, that of males resident in their place of birth.

Cancer Incidence in NSW Migrants
8
The incidence in male migrants by place of birth was mixed with some rates higher, some lower and
some similar to that of males resident in their place of birth for cancers of the bladder, brain and central
nervous system, colon and rectum, head and neck, liver and lung.
Females
The observed incidence in female migrants of breast, colorectal, kidney, pancreatic and thyroid
cancers, leukaemia and non-Hodgkin lymphoma by place of birth were all higher than, or similar to,
that of females resident in their place of birth.
The observed incidence in female migrants of liver and stomach cancers by place of birth was lower
than, or similar to, that of females resident in their place of birth.
The incidence in female migrants by place of birth was mixed with some rates higher, some lower and
some similar to that of females resident in their place of birth for cancers of the bladder, brain and
central nervous system, cervix, head and neck, lung, ovary and uterus and melanoma of the skin
Cancer Incidence in NSW Migrants
9
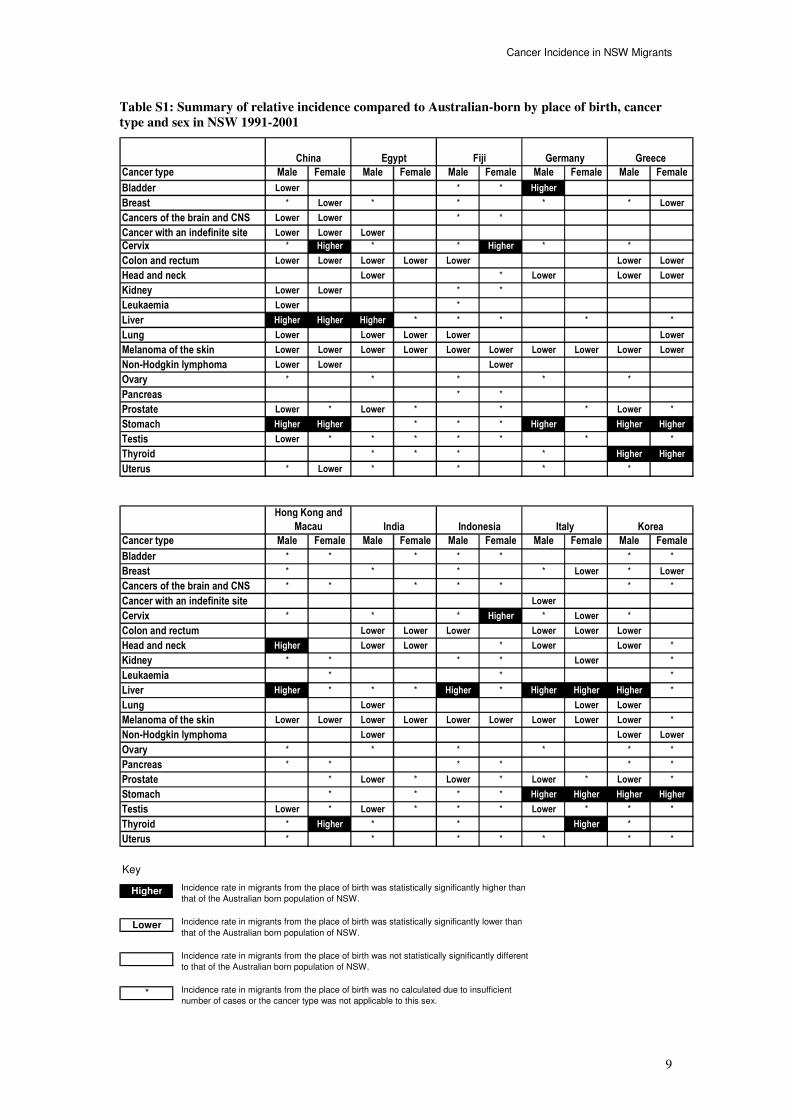
Table S1: Summary of relative incidence compared to Australian-born by place of birth, cancer
type and sex in NSW 1991-2001
Cancer type Male Female Male Female Male Female Male Female Male Female
Bladder Lower * * Higher
Breast * Lower * * * * Lower
Cancers of the brain and CNS Lower Lower * *
Cancer with an indefinite site Lower Lower Lower
Cervix * Higher * * Higher * *
Colon and rectum Lower Lower Lower Lower Lower Lower Lower
Head and neck Lower * Lower Lower Lower
Kidney Lower Lower * *
Leukaemia Lower *
Liver Higher Higher Higher * * * * *
Lung Lower Lower Lower Lower Lower
Melanoma of the skin Lower Lower Lower Lower Lower Lower Lower Lower Lower Lower
Non-Hodgkin lymphoma Lower Lower Lower
Ovary * * * * *
Pancreas * *
Prostate Lower * Lower * * * Lower *
Stomach Higher Higher * * * Higher Higher Higher
Testis Lower * * * * * * *
Thyroid * * * * Higher Higher
Uterus * Lower * * * *
Cancer type Male Female Male Female Male Female Male Female Male Female
Bladder * * * * * * *
Breast * * * * Lower * Lower
Cancers of the brain and CNS * * * * * * *
Cancer with an indefinite site Lower
Cervix * * * Higher * Lower *
Colon and rectum Lower Lower Lower Lower Lower Lower
Head and neck Higher Lower Lower * Lower Lower *
Kidney * * * * Lower *
Leukaemia * * *
Liver Higher * * * Higher * Higher Higher Higher *
Lung Lower Lower Lower
Melanoma of the skin Lower Lower Lower Lower Lower Lower Lower Lower Lower *
Non-Hodgkin lymphoma Lower Lower Lower
Ovary * * * * * *
Pancreas * * * * * *
Prostate * Lower * Lower * Lower * Lower *
Stomach * * * * Higher Higher Higher Higher
Testis Lower * Lower * * * Lower * * *
Thyroid * Higher * * Higher *
Uterus * * * * * * *
Greece
Hong Kong and
Macau India Indonesia Italy
EgyptChina Fiji Germany
Korea
Key
Higher
Lower
*
Incidence rate in migrants from the place of birth was statistically significantly higher than
that of the Australian born population of NSW.
Incidence rate in migrants from the place of birth was statistically significantly lower than
that of the Australian born population of NSW.
Incidence rate in migrants from the place of birth was no calculated due to insufficient
number of cases or the cancer type was not applicable to this sex.
Incidence rate in migrants from the place of birth was not statistically significantly different
to that of the Australian born population of NSW.
Cancer Incidence in NSW Migrants
10
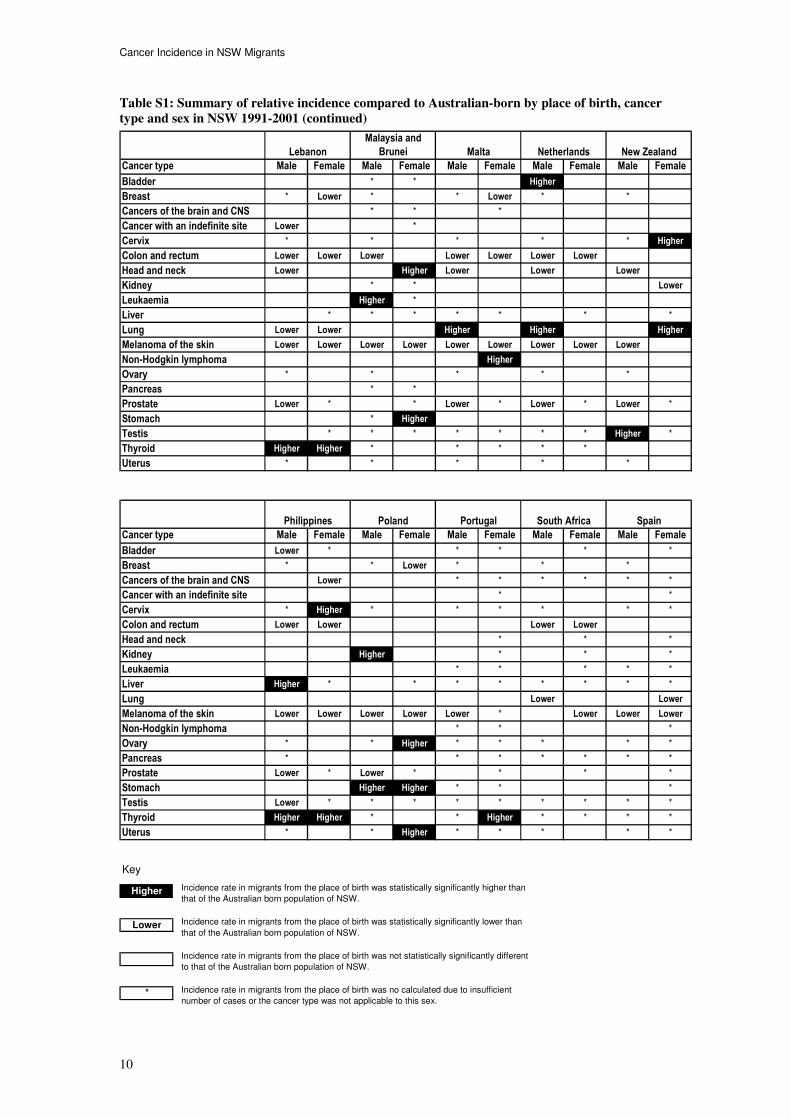
Table S1: Summary of relative incidence compared to Australian-born by place of birth, cancer
type and sex in NSW 1991-2001 (continued)
Cancer type Male Female Male Female Male Female Male Female Male Female
Bladder * * Higher
Breast * Lower * * Lower * *
Cancers of the brain and CNS * * *
Cancer with an indefinite site Lower *
Cervix * * * * * Higher
Colon and rectum Lower Lower Lower Lower Lower Lower Lower
Head and neck Lower Higher Lower Lower Lower
Kidney * * Lower
Leukaemia Higher *
Liver * * * * * * *
Lung Lower Lower Higher Higher Higher
Melanoma of the skin Lower Lower Lower Lower Lower Lower Lower Lower Lower
Non-Hodgkin lymphoma Higher
Ovary * * * * *
Pancreas * *
Prostate Lower * * Lower * Lower * Lower *
Stomach * Higher
Testis * * * * * * * Higher *
Thyroid Higher Higher * * * * *
Uterus * * * * *
Cancer type Male Female Male Female Male Female Male Female Male Female
Bladder Lower * * * * *
Breast * * Lower * * *
Cancers of the brain and CNS Lower * * * * * *
Cancer with an indefinite site * *
Cervix * Higher * * * * * *
Colon and rectum Lower Lower Lower Lower
Head and neck * * *
Kidney Higher * * *
Leukaemia * * * * *
Liver Higher * * * * * * * *
Lung Lower Lower
Melanoma of the skin Lower Lower Lower Lower Lower * Lower Lower Lower
Non-Hodgkin lymphoma * * *
Ovary * * Higher * * * * *
Pancreas * * * * * * *
Prostate Lower * Lower * * * *
Stomach Higher Higher * * *
Testis Lower * * * * * * * * *
Thyroid Higher Higher * * Higher * * * *
Uterus * * Higher * * * * *
Philippines
Malta Netherlands New Zealand
SpainPoland Portugal South Africa
Malaysia and
BruneiLebanon
Key
Higher
Lower
*
Incidence rate in migrants from the place of birth was statistically significantly higher than
that of the Australian born population of NSW.
Incidence rate in migrants from the place of birth was statistically significantly lower than
that of the Australian born population of NSW.
Incidence rate in migrants from the place of birth was no calculated due to insufficient
number of cases or the cancer type was not applicable to this sex.
Incidence rate in migrants from the place of birth was not statistically significantly different
to that of the Australian born population of NSW.
Cancer Incidence in NSW Migrants
11
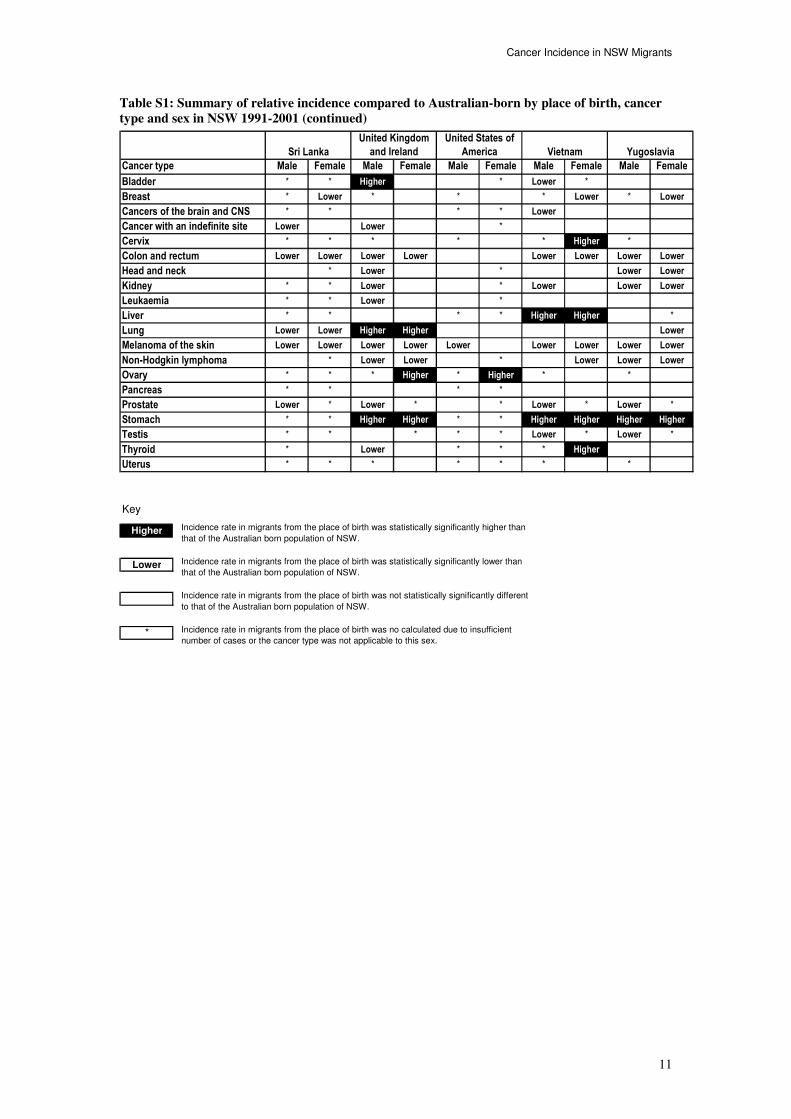
Table S1: Summary of relative incidence compared to Australian-born by place of birth, cancer
type and sex in NSW 1991-2001 (continued)
Cancer type Male Female Male Female Male Female Male Female Male Female
Bladder * * Higher * Lower *
Breast * Lower * * * Lower * Lower
Cancers of the brain and CNS * * * * Lower
Cancer with an indefinite site Lower Lower *
Cervix * * * * * Higher *
Colon and rectum Lower Lower Lower Lower Lower Lower Lower Lower
Head and neck * Lower * Lower Lower
Kidney * * Lower * Lower Lower Lower
Leukaemia * * Lower *
Liver * * * * Higher Higher *
Lung Lower Lower Higher Higher Lower
Melanoma of the skin Lower Lower Lower Lower Lower Lower Lower Lower Lower
Non-Hodgkin lymphoma * Lower Lower * Lower Lower Lower
Ovary * * * Higher * Higher * *
Pancreas * * * *
Prostate Lower * Lower * * Lower * Lower *
Stomach * * Higher Higher * * Higher Higher Higher Higher
Testis * * * * * Lower * Lower *
Thyroid * Lower * * * Higher
Uterus * * * * * * *
YugoslaviaSri Lanka
United Kingdom
and Ireland
United States of
America Vietnam
Key
Higher
Lower
*
Incidence rate in migrants from the place of birth was statistically significantly higher than
that of the Australian born population of NSW.
Incidence rate in migrants from the place of birth was statistically significantly lower than
that of the Australian born population of NSW.
Incidence rate in migrants from the place of birth was no calculated due to insufficient
number of cases or the cancer type was not applicable to this sex.
Incidence rate in migrants from the place of birth was not statistically significantly different
to that of the Australian born population of NSW.
Cancer Incidence in NSW Migrants
12
Table S2: Summary of relative incidence compared to people still resident in their respective
place of birth by cancer type and sex in NSW 1991-2001
Cancer type Male Female Male Female Male Female Male Female Male Female
Bladder Higher Higher Lower * * Lower
Breast * Higher * Higher * Higher * Higher * Higher
Cancers of the brain and CNS Higher * *
Cervix * Higher * * Lower * *
Colon and rectum Higher Higher Higher Higher Higher Higher Higher Higher
Head and neck Higher Higher * Higher * Lower Lower
Kidney Higher Higher Higher * * * Higher Higher
Leukaemia Higher Higher * Higher
Liver Lower Lower * * * Lower Lower
Lung Higher Higher Higher Lower Lower
Melanoma of the skin Higher * Higher * * * Higher Higher
Non-Hodgkin lymphoma Higher Higher Higher Higher * * Higher Higher
Ovary * Higher * Higher * * *
Pancreas Higher Higher Higher Higher * *
Prostate Higher * Higher * Higher * Higher * Higher *
Stomach Lower Lower * * * Lower
Testis * * * * * * * * *
Thyroid Higher Higher * * * * Higher Higher
Uterus * Higher * Higher * Higher * * Higher
Cancer type Male Female Male Female Male Female Male Female Male Female
Bladder * Higher * * * Lower * *
Breast * Higher * Higher * Higher * Higher * Higher
Cancers of the brain and CNS * * * * * * *
Cervix * Lower * Lower * * Lower *
Colon and rectum Higher Higher Higher Higher Higher
Head and neck Lower Lower Lower Lower * * Lower Lower *
Kidney * * Higher * * * * *
Leukaemia * * Higher * Higher * Higher * *
Liver Lower Lower * * * Lower Lower Lower
Lung Lower Higher Higher Higher Lower Lower
Melanoma of the skin * * * * * * Higher * *
Non-Hodgkin lymphoma * Higher Higher Higher * *
Ovary * * * * * *
Pancreas * * Higher Higher * * * *
Prostate Higher * Higher * Higher * Higher * Higher *
Stomach * * * Lower Lower Lower
Testis * * * * * * * * *
Thyroid * * Higher * Higher Higher * Higher
Uterus * * Higher * * * Lower * *
Greece
Hong Kong and
Macau India Indonesia Italy
EgyptChina Fiji Germany
Korea
Key
Higher
Lower
*
Incidence rate in migrants from the place of birth was statistically significantly higher than
that of people resident in their place of birth.
Incidence rate in migrants from the place of birth was statistically significantly lower than
that of people resident in their place of birth.
Incidence rate in migrants from the place of birth was not statistically significantly different
to that of people resident in their place of birth.
Incidence rate in migrants from the place of birth was not calculated due to insufficient
number of cases or the cancer type was not applicable to this sex.

Cancer Incidence in NSW Migrants
13
Table S2: Summary of relative incidence compared to people still resident in their respective
place of birth by cancer type and sex in NSW 1991-2001 (continued)
Cancer type Male Female Male Female Male Female Male Female Male Female
Bladder Higher * * Lower
Breast * Higher * Higher * * *
Cancers of the brain and CNS * * * * Higher Lower
Cervix * * * * *
Colon and rectum Higher Higher Lower Higher
Head and neck Lower Higher Lower Lower Lower
Kidney Higher Higher * *
Leukaemia Higher Higher *
Liver * * * * * * Lower *
Lung Higher Higher Higher Higher Lower
Melanoma of the skin * * * * * * Lower
Non-Hodgkin lymphoma Higher Higher Higher
Ovary * * * * * Lower
Pancreas * *
Prostate Higher * Higher * Higher * * *
Stomach Lower
Testis Higher * * * * * * * Higher *
Thyroid Higher Higher * * * * *
Uterus * * * Lower * *
Cancer type Male Female Male Female Male Female Male Female Male Female
Bladder * * * Higher * *
Breast * Higher * Higher * Higher * Higher * Higher
Cancers of the brain and CNS * * Higher * * * * * * *
Cervix * Lower * Lower * * * Lower * *
Colon and rectum Higher Higher Higher Higher
Head and neck Lower Lower * Lower * Lower * *
Kidney Higher Higher * Higher * *
Leukaemia Higher * * Higher * * *
Liver Higher Lower Lower * * * * * *
Lung Higher Higher * *
Melanoma of the skin * * Higher * * Higher Higher * *
Non-Hodgkin lymphoma Higher Higher Higher * * Higher Higher Higher *
Ovary * * * * * Higher * *
Pancreas * Higher * * * * * *
Prostate Higher * Higher * Higher * Higher * Higher *
Stomach Lower * *
Testis * * * * * * * * * *
Thyroid Higher Higher * Higher * Higher * * * *
Uterus * Higher * * * * * *
Philippines
Malta Netherlands New Zealand
SpainPoland Portugal South Africa
Malaysia and
BruneiLebanon
Key
Higher
Lower
*
Incidence rate in migrants from the place of birth was statistically significantly higher than
that of people resident in their place of birth.
Incidence rate in migrants from the place of birth was statistically significantly lower than
that of people resident in their place of birth.
Incidence rate in migrants from the place of birth was not statistically significantly different
to that of people resident in their place of birth.
Incidence rate in migrants from the place of birth was not calculated due to insufficient
number of cases or the cancer type was not applicable to this sex.
Cancer Incidence in NSW Migrants
14
Table S2: Summary of relative incidence compared to people still resident in their respective
place of birth by cancer type and sex in NSW 1991-2001 (continued)
Cancer type Male Female Male Female Male Female Male Female Male Female
Bladder * * Higher Lower * Lower *
Breast * Higher * Higher * * Higher *
Cancers of the brain and CNS * * Higher * * Lower * Lower
Cervix * Lower * Lower * * * Lower
Colon and rectum Higher Higher Higher Higher Higher Higher
Head and neck Lower Lower Higher * Lower Lower
Kidney * * Higher Higher * Higher
Leukaemia * * Higher Higher * Higher
Liver * * Lower * * Higher Lower
Lung Lower * Higher Lower Lower Lower
Melanoma of the skin * * Higher Higher * *
Non-Hodgkin lymphoma * * Higher Higher * Higher Higher Higher
Ovary * * * Lower * * *
Pancreas * * Higher * * Higher
Prostate * Higher * * Higher * Higher *
Stomach * * Lower Lower Lower * Lower
Testis * * Higher * * * * * *
Thyroid * Higher Higher * * * Higher Higher
Uterus * * * * * Higher * Lower
YugoslaviaSri Lanka
United Kingdom
and Ireland
United States of
America Vietnam
Key
Higher
Lower
*
Incidence rate in migrants from the place of birth was statistically significantly higher than
that of people resident in their place of birth.
Incidence rate in migrants from the place of birth was statistically significantly lower than
that of people resident in their place of birth.
Incidence rate in migrants from the place of birth was not statistically significantly different
to that of people resident in their place of birth.
Incidence rate in migrants from the place of birth was not calculated due to insufficient
number of cases or the cancer type was not applicable to this sex.

Cancer Incidence in NSW Migrants
15
Introduction
Geographical studies of disease such as this one have provided invaluable clues in discerning the
importance of environmental over genetic factors in their causation.
While it has been known since the turn of the twentieth century that the incidence and mortality of
some of the leading cancer types vary greatly across the world, contemporary population-based cancer
registries have allowed important differences in cancer patterns to be discovered. For example, as Table
I1 shows incidence rates for melanoma were highest for males in Australia and for females in New
Zealand, and were lowest in males in Egypt and females in Vietnam. Approximately ninety-five-fold
differences are seen in the incidence of prostate cancer between the highest rate in the United States of
America and lowest in Sri Lanka. Whereas rates of head and neck cancer observed in Sri Lanka are
more than twenty-fold that in Egypt. Table I1 shows some of the international differences observed for
selected cancers.
Table I1: International variation in projected age-standardised cancer incidence rates^ per
100,000 for 2000
Cancer type Country with highest incidence
(Rate) Country with lowest incidence
(Rate) Ratio*
Male
Melanoma of the skin Australia (40.5) Egypt (0) -
Prostate USA (104.3) Sri Lanka (1.1) 94.8
Colon and rectum New Zealand (55.3) Sri Lanka (1.8) 30.7
Lung Yugoslavia (80.9) Sri Lanka (1.9) 42.6
Stomach Korea (70) Sri Lanka (1.2) 58.3
Head and neck Sri Lanka (42.6) Egypt (1.7) 25.1
Thyroid USA (3) Spain (0.5) 6.0
Leukaemia New Zealand (11.8) India (3.1) 3.8
Female
Melanoma of the skin New Zealand (34.9) Vietnam (0.1) 349.0
Breast Netherlands (91.6) Korea (12.5) 7.3
Colon and rectum New Zealand (43.4) Sri Lanka (1.9) 22.8
Lung USA (34) Sri Lanka (1.1) 30.9
Stomach Korea (25.7) Sri Lanka (0.6) 42.8
Head and neck Sri Lanka (14.2) Egypt (0.6) 23.7
Cervix Fiji (38.7) China (5.2) 7.4
Thyroid Italy (8.5) China (1.6) 5.3
Leukaemia New Zealand (8.7) India (2.1) 4.1
^
Standardised to the World Population
* Ratio of highest to lowest incidence rate
Source: GLOBOCAN 2000 (2)
It has been shown that populations that migrate continue some lifestyle behaviours typical of their
former homeland. However, these lifestyle behaviours and resulting cancer incidence patterns among
migrants begin to resemble those of their host country the longer they live in that country.
Migrant studies are valuable in discerning time periods of aetiological importance; in identifying
protective behaviours; and in providing evidence for similar or dissimilar causes of different cancers. In
addition, studies among migrants may identify specific health needs that may differ from those of the
host population. Thomas and Karagas(3)
reviewed these issues and pointed out how migrant studies may
identify cancer profiles for populations where disease registration is unreliable and also help identify
possible factors of importance for further study.
New South Wales is the most culturally diverse state in Australia with 25% of the population being
born overseas. About 200 nationalities are represented in the NSW population. This rich diversity of
people offers many opportunities for the study of different risk factors for cancer such as diet, smoking,
infections, reproductive history and genetic heterogeneity that is not available in most places with more
homogeneous populations.

Cancer Incidence in NSW Migrants
16
Table I2 shows the median ages for migrants by sex in NSW for the top 25 places of birth and for
Australian-born. It has been predicted that between 1996 and 2011 the proportion of migrants over the
age of 65 will increase by 74% (4)
. By 2026, the three leading non-Australian birthplaces will be China,
Italy and Vietnam.
As shown in Table I3, the United Kingdom (including Northern Ireland) was the largest source of
migrants to Australia since federation in 1901. After World War II, the numbers of migrants from
Yugoslavia, the Netherlands, Poland, Italy, Greece and other European countries increased
considerably. Since the 1970s the numbers of immigrants from Asia, North Africa and the Middle East
also increased. Significant increases occurred in the number of Chinese migrants at the turn of the 20th
Century and then again after 1990 following a steady increase since the 1950s.
While life expectancy for the general population of NSW is improving(4)
, it is possible that this is not
shared equally among immigrant populations.
Earlier reports from Australia have shown that cancer rates differ substantially between migrants and
Australian-born residents.(1)(5)(6)
.
In 1993, The Cancer Council NSW published a report called Common cancers in migrants to NSW in
1972 to 1990 (1)
. This report follows the same theme by describing the incidence of cancer in NSW by
place of birth for the subsequent period of 1991 to 2001.
The objective of this report is to compare the relative incidence of cancer in populations according to
their places of birth with their expected incidence if they had been born in Australia or if they had
remained resident in their place of birth. This will help identify priority areas for the future provision of
cancer treatment, information and prevention services to specific migrant groups identified by their
place of birth.
Table I2 : Median age of migrants and Australian-born people resident in NSW by place of birth
and sex in 1991 to 2001
Median age (years)
Place of birth Male Female
Egypt 48.8 49.3 China 42.5 43.4 Fiji 34.1 34.5 Germany 50.9 52.7 Greece 54.3 53.7 Hong Kong and Macau 29.7 30.9 India 38.1 39.9 Indonesia 34.6 34.7 Italy 56.3 56.5 Korea 33.9 33.3 Lebanon 40.4 39.1 Malaysia and Brunei 34.4 35.8 Malta 52.5 52.8 Netherlands 54.7 54.8 New Zealand 36.3 36.9 Philippines 32.6 36.3 Poland 54.1 53.0 Portugal 40.9 40.6 South Africa 36.8 37.7 Spain 47.3 47.1 Sri Lanka 37.9 38.3 United Kingdom and Ireland 48.9 50.5 United States of America 36.7 35.1 Vietnam 35.0 36.0 Yugoslavia 46.9 46.1
Australian-born 32.4 34.8
Source: Australian Bureau of Statistics estimated resident populations 1991 to 2001

Cancer Incidence in NSW Migrants
17
Table I3: Australian population (in 100s) by place of birth 1901-2001
1901 1911 1921 1933 1947 1954 1961 1966
Oceania
New Zealand 258 319 386 460 436 434 470 525
Fiji 6 9 11 13 15 18 27 31
Other Oceania 98 24 23 22 28 33 53 83
Europe and the former USSR
Germany 384 330 224 168 146 654 1093 1087
Netherlands 6 7 14 13 22 520 1021 995
Greece 9 18 37 83 123 259 773 1401
Italy 57 67 81 268 336 1199 2283 2673
Malta 0 2 13 28 32 200 393 551
Spain 5 7 9 11 10 14 38 109
Yugoslavia 0 0 8 40 59 229 498 713
Poland 0 0 18 32 66 566 600 616
UK (excluding Ireland but including Nth Ireland) 4955 4543 5715 6363 4982 6260 7183 8705
Other Europe 2118 1669 1318 1066 739 1614 2013 2025
Middle East and North Africa
Lebanon 0 0 0 0 0 39 73 107
Arab Republic of Egypt 1 1 4 6 8 82 163 220
Other Middle East and North Africa 16 21 21 28 45 98 138 174
South East Asia
Indonesia 3 7 4 2 9 36 60 66
Malaysia 7 10 6 9 18 23 58 92
Philippines 7 4 3 2 1 2 4 10
Other South East Asia 0 3 0 0 1 11 46 67
North East Asia
China 0 208 152 86 64 103 145 174
Hong Kong and Macau 2 4 3 2 8 16 35 42
Korea 0 35 28 23 3 10 23 31
Other North East Asia 36 35 28 23 3 10 23 31
Southern Asia
India 76 69 69 68 82 120 142 158
Sri Lanka 6 6 6 6 0 20 34 56
Other Southern Asia 19 2 11 22 10 40 32 38
Other Asia 55 40 39 45 14 61 101 136
Northern America
USA 0 98 103 101 104 128 168 259
Other Northern America 32 31 37 40 41 47 64 92
Africa (excluding North Africa)
South Africa 15 39 54 62 59 60 79 97
Other Africa 13 9 9 10 8 17 44 99
Total overseas born 8654 7873 8540 9032 7441 12864 17787 21309
Total population (overseas and Australian-born) 37738 44550 54357 32627 75794 89865 105082 115505
Place of Birth
Year of census

Cancer Incidence in NSW Migrants
18
Table I3: Australian population (in 100s) by place of birth 1901-2001 (continued)
1971 1976 1981 1986 1991 1996 2001
Oceania
New Zealand 741 839 1607 1999 2641 2914 3558
Fiji 39 57 90 143 302 371 443
Other Oceania 115 185 252 345 422 494 550
Europe and the former USSR
Germany 1100 1069 1093 1135 1120 1103 1082
Netherlands 986 915 951 944 947 879 833
Greece 1590 1524 1458 1369 1359 1265 1164
Italy 2883 2795 2750 2610 2534 2382 2187
Malta 535 558 568 561 538 509 470
Spain 145 153 150 161 145 136 127
Yugoslavia 1282 1431 1486 1493 1606 1754 1813
Poland 595 559 590 669 686 651 581
UK (excluding Ireland but including Nth Ireland) 10398 10444 10758 10720 11074 10726 10362
Other Europe 2261 2457 2327 2337 2497 2552 2428
Middle East and North Africa
Lebanon 239 333 494 561 688 702 713
Arab Republic of Egypt 281 301 305 305 331 342 334
Other Middle East and North Africa 348 548 655 735 918 1089 1284
South East Asia
Indonesia 77 89 118 170 326 442 472
Malaysia 144 187 305 465 717 763 789
Philippines 23 55 148 328 730 929 1039
Other South East Asia 117 214 750 1399 1969 2431 2575
North East Asia
China 171 190 252 366 779 1110 1428
Hong Kong and Macau 54 84 153 278 592 703 691
Korea 44 66 109 187 390 531 644
Other North East Asia 40 57 76 117 311 427 480
Southern Asia
India 287 370 410 471 610 776 955
Sri Lanka 90 148 168 223 371 470 535
Other Southern Asia 26 50 47 61 114 210 352
Other Asia 183 321 872 1576 2394 3068 3408
Northern America
USA 388 424 453 566 662 747 810
Other Northern America 135 138 164 192 229 255 277
Africa (excluding North Africa)
South Africa 122 153 265 364 490 558 794
Other Africa 208 246 322 404 442 516 611
Total overseas born 25463 26894 31281 34373 40538 45250 51397
Total population (overseas and Australian-born) 127195 135149 145169 155426 167718 177528 187692
Place of Birth
Year of census
Cancer Incidence in NSW Migrants
19
Methods
Data sources
Population data and place of birth definitions The populations used in this report were the annual mid-year estimated resident populations of NSW
for each place of birth for each year from 1991 to 2001 by sex and five-year age groups (see Appendix
1). Populations were provided by the Australian Bureau of Statistics and abstracted from HOIST, a
SAS-based data warehouse operated by the Centre for Epidemiology and Research, NSW Department
of Health.
The places of birth groupings chosen for this report correspond to the population groupings available
from HOIST (see Appendix 2). Further, some of the populations have been amalgamated to allow
comparison with geographical boundaries and classifications available in GLOBOCAN 90 (7)
.
The places combined were: Malaysia and Brunei, the United Kingdom and Ireland, North and South
Korea, countries of the former republic of Yugoslavia, and Hong Kong and Macau. The United
Kingdom, in this report, includes England, Scotland, Northern Ireland and Wales. Yugoslavia includes
the current countries of Croatia, Bosnia and Herzegovina, Serbia and Montenegro, Slovenia and the
former Yugoslavian Republic of Macedonia. The country of China refers to mainland China excluding
both Taiwan and the Special Administrative Regions of Hong Kong and Macau.
International incidence rates Incidence rates for relevant places of birth were abstracted from the GLOBOCAN 90 and
GLOBOCAN 2000 databases created by the International Agency for Research on Cancer (IARC) for
the years 1990 and 2000 respectively (2)(7)
. Incidence rates for years 1991 to 1999 were linearly
interpolated and extrapolated for 2001.
Cases of cancer The incident cancer cases for the years 1991 to 2001 for people resident in NSW were abstracted from
the NSW Central Cancer Registry (CCR). The CCR was established in 1971 as a population-based
register of all cancers in NSW. Since 1972 notification of all malignant neoplasms, except for
non-melanocytic skin cancers, has been a statutory requirement for all NSW public and private
hospitals, radiotherapy departments and nursing homes. Notification became mandatory for pathology
laboratories and outpatients departments in 1985, and for day procedure centres in 1991.
The cancer types included in this report are those used in the detailed description section of the CCR’s
annual reports on cancer incidence and mortality in NSW.
However, for individual places of birth only cancer types where either the observed or expected
number of cases was greater than 11 cases in 11 years were included. Finally, some types were
amalgamated (see Appendix 3) to ensure comparability with the projected international incidence rates
available on GLOBOCAN 90 (7)
.
The cancer types described in this report are: cancers of the bladder, brain and central nervous system,
female breast, cervix, lung, colon and rectum, head and neck, indefinite sites (for comparison to
Australian-born only), kidney, liver, ovary, pancreas, prostate, stomach, testis, thyroid, and uterus and
melanoma of the skin, all leukaemias and non-Hodgkin lymphoma. See Appendix 3 for a list of all
cancer types included in the report and notes on any types that were amalgamated.
Standardised incidence ratios and confidence intervals
A standardised incidence ratio (SIR) allows for the comparison of incidence in a study population of
interest relative to the incidence in another standard population where the age distributions differ. In
this report, when the number of cases is relatively small in the study population, such as is observed in
some of the places of birth, then indirect standardisation provides a more robust method of comparing
incidence than does direct standardisation (8)
. However, SIRs do not allow for an easy comparison of
incidence rates between different study populations.
Cancer Incidence in NSW Migrants
20
The SIR was calculated by dividing the number of cases observed in the time period 1991 to 2001 in
the study population of interest, as defined by the place of birth, by the number of cases that would be
expected if the incidence was the same as that in the standard population. See Appendix 6 for a more
detailed explanation. The expected number of cases was obtained by multiplying the observed age-
specific rates for the standard population by the populations in each respective age group of the study
population.
In this report the study population of interest was defined by the place of birth and the standard
population was either the Australian-born NSW population or the population resident in the respective
place of birth.
An SIR greater than 1 indicates that the number of cases in the study population was greater than that
expected if the incidence was similar to the standard population. Conversely, an SIR less than 1
indicates that the observed number of cases was less than that expected if the study population had the
same age-specific incidence rates as the standard population.
Further, in this report we have calculated 99% Poisson confidence intervals (9)
to indicate the level of
precision of the SIRs (see Appendix 4 for a more detailed explanation). An SIR for a place of birth was
deemed to be significantly different from the Australian-born population of NSW or from residents of
that place of birth if the confidence interval did not include 1. Note that 99% confidence intervals are
used throughout this report. The use of 99% confidence intervals reduces the possibility that any
differences identified in this report are purely due to chance given the large number of comparisons that
were made.
Structure of the report
This report has been divided into two sections illustrating the same data in two different ways:
Section 1: Analysis by place of birth
This section describes the incidence of common cancers in NSW in 1991 to 2001 by the place of birth.
The first page shows the SIRs and 99% confidence intervals for selected cancers for migrants by place
of birth compared to the Australian-born population of NSW for the same time period. The second
page shows the SIRs and confidence intervals for migrants by place of birth compared to people of the
same sex resident in that place.
Section 2: Analysis by cancer type
This section presents the incidence data by cancer type. The first page shows the SIRs and 99%
confidence intervals comparing the cancer incidence in people with different places of birth to that of
the Australian-born population. The second page compares their cancer incidence to people of the same
sex resident in their respective places of birth.

Cancer Incidence in NSW Migrants
21
Guide to interpretation of results
As with all ecological studies of disease patterns there are a number of limitations to the interpretation
of the data presented here. Readers should be aware of these limitations before drawing their own
conclusions (10)
.
As no data were available on the CCR for the length of time people resided in Australia before they
were diagnosed with cancer, it is therefore not possible to quantify the respective risks of cancer
attributable to risk factors associated with their place of birth and those associated with migration to
Australia.
No information was available on the CCR on whether people emigrated directly to NSW from their
place of birth so any exposure to risk factors during any transitional or temporary residence cannot be
determined.
There are also limitations to using place of birth as a proxy for ethnic group. Immigrants to NSW may
not be representative of the dominant ethnic group in their place of birth. Refugees, for example, may
be predominantly from an ethnic minority in their place of birth. Immigrants to Australia may also be
from a specific socio-economic group or be generally healthier than those who do not migrate.
Place of birth reporting is not complete for all cancers in the CCR. Table I4 indicates the completeness
of place of birth by cancer site. The CCR uses place of birth information on death certificates as part of
their efforts in determining place of birth, as a result cancer types with a poor survival have slightly
higher rates of known countries of birth compared to those cancer types with better prognoses.
Table I4: Percentage of unknown place of birth by cancer type 1991 to 2001
Differences in international cancer registration practices, particularly under-registration of incident
cases in some places due to inadequate resources or incomplete population coverage, may lead to
differences in relative cancer incidence ratios that are not necessarily related to cancer risk.
Some countries of birth may be represented as cases in the registry but not included as part of the NSW
population denominator. For example people from New Caledonia are generally referred to and treated
in Sydney and thus may give a NSW address of residence during treatment, but will not have been
Cancer type
Place of birth
unknown %
Bladder 3%
Breast 8%
Cancers of the brain and CNS 2%
Cancers with an indefinite site 5%
Cervix 14%
Colon and rectum 5%
Head and neck 4%
Kidney 7%
Leukaemia 9%
Liver 2%
Lung 2%
Melanoma of the skin 40%
Non-Hodgkin lymphoma 8%
Ovary 4%
Pancreas 1%
Prostate 18%
Stomach 3%
Testis 6%
Thyroid 11%
Uterus 6%
Overall 11%

Cancer Incidence in NSW Migrants
22
counted in the Australian census populations upon which the resident populations are estimated. This
may occur to a lesser extent for people born in Fiji.
Finally the existence of free, de-facto and/or subsidised cancer screening services in Australia for
breast, prostate and cervical cancers in particular may lead to a detection bias resulting in breast or
prostate cancer rates being higher than in places without screening programs. However, detection and
treatment of pre-cancerous cervical lesions prevents cervical cancer so rates may be lower than in
places without a screening program.
Discussion The report is descriptive, showing the relationship between the incidence of 20 major cancer types in
migrants in NSW from 25 places of birth. The report illustrates the wide heterogeneity in the origin of
people in NSW, and by inference, their lifestyle characteristics, as well as how all these diverse
lifestyles in some way contribute to the cancer patterns shown in this report. Aside from this short
commentary, we hope the tabulations and graphs will generate discussion to develop hypotheses about
possible causality and progress for cancer prevention as well as the delivery of cancer services.
The results are in broad agreement with the previous report by McCredie et al(1)
. A new addition to this
report was the comparison of rates from places of birth using cancer incidence estimates from the
GLOBOCAN databases. However an important limitation is that for some of the countries, where no
reliable cancer incidence data exist, rates are derived from adjoining regions or from locally available
mortality data. They are therefore less reliable than population based cancer registration such as we
have in NSW.
It is clear that the current cancer incidence of NSW was governed by past immigration trends and
policies, and these trends are likely to have a profound effect on future cancer incidence. For example,
from 1991 to 2001 the estimated resident population born in United Kingdom and Ireland, the leading
migrant group in NSW, declined by 7% (from 344,410 to 322,364 persons), but for migrants born in
China the proportion increased by about 225% (from 48,337 to 108,807), and 227% for migrants born
in India (from 22,121 to 50,202). Increases in numbers have also been observed for people born in
Vietnam, South Africa, Indonesia, New Zealand and Sri Lanka (Appendix 1). Given that
72,883/297,457 (24.5%) cancers in 1991 to 2001 occurred in migrants, it is likely that the profile of
cancer patients will continue to change such that in the near future it may diverge quite significantly
from the ‘typical western’ profile.
The attribution of characteristics of a group to an individual or sub-group of individuals based on group
measures, often leads to incorrect conclusions being formulated. This widely accepted source of error
in interpretation is known as ecological confounding, or the ecological fallacy. For example, migrants
to a country such as Australia may not be representative of people from their place of birth. This may
occur due to several factors such as an influx of ethnic minorities fleeing unrest, or Australian
migration policies favouring people with particular skills, or people of higher or lower socio-economic
status, or lastly, that only people of good health have the ability to migrate long distances. This final
reason is often called the ‘healthy migrant effect’ and may play a part in explaining perceived
anomalies in cancer incidence found in this report.
Liver, stomach, head and neck, cervical, and thyroid cancers are some of the cancer types that show
significant heterogeneity in incidence by place of birth and are likely to continue to increase in these
groups, unless targeted interventions are initiated. These are leading cancer types in several South East
Asian migrants and some Southern European migrants as well.
Lung cancer deserves special mention because of the large heterogeneity observed for this common
cancer type by place of birth. Chinese-born males, for example, have approximately a 20% lower
incidence of lung cancer, whilst those born in the United Kingdom and Ireland have a 19% increased
incidence compared to those born in Australia. Although some of the differences in rates may be due to
ecological confounding there also appears to be a doubling of lung cancer incidence in males from
India, the Philippines and Egypt, when compared to rates observed in their respective places of birth.
With such wide heterogeneity in lung cancer incidence, the calculation of tobacco-attributed cancer
risks based on estimates from largely ‘Caucasian’ populations may well turn out to be misleading.
Cancer Incidence in NSW Migrants
23
Cervical cancer also deserves special mention not only because it is preventable by screening, but
because there appears to be a higher incidence among migrants from a number of South East Asian and
Pacific Island communities. By contrast, compared to the Australian-born males, we found a low
incidence of testicular cancer among migrants from South East Asia and the Philippines (SIR < 0.2) but
higher incidences in migrants from the United Kingdom and Ireland, New Zealand and Germany (SIR
> 1.2). This may point to opportunities for examining the causality of this disease.
Melanoma of the skin in all migrant groups, except for those from South Africa and New Zealand, had
lower rates compared to people born in Australia. South African migrants are perhaps an obvious
example of ecological confounding. Most migrants from South Africa are of ‘European’ origin,
however they comprise only 20% of the total South African population. Likewise there may be other
migrant groups that differ substantially in health status, lifestyle and socioeconomic condition from the
population of their places of birth.
The Central Cancer Registry does not collect the date of arrival to Australia, but clearly, such a variable
would be key to our understanding of the causal significance of genetic versus environmental factors
and the effect of migration at different time periods. It is often thought that one’s place of birth ‘locks’
one into a particular cancer risk trajectory, date of arrival information would allow us to discern the
degree to which recent exposure might be modifiable as determined by length of stay in Australia.
However some indication of a shift in risk profile is gleaned from the changes observed compared to
rates reported in their place of birth. Bearing in mind the possibility of ecological confounding, and
diagnostic bias, the magnitude of the difference in SIRs between migrants and those living in their
place of birth is quite remarkable, and would not support the hypothesis of lifestyle patterns being
‘locked’ at an early age. The high SIR for breast, colorectal, lung, thyroid, pancreatic and prostate
cancers, and melanoma of the skin and non-Hodgkin lymphoma in migrants compared with rates in
their place of birth is noteworthy. By contrast, very little heterogeneity was observed for ovarian
cancer, in keeping with international observations of small variations in this cancer type. Clearly
studies among migrants would produce a rich source of information regarding lifestyle and cancer.


![Migrants Powerpoint 2[1]](https://static.fdocuments.in/doc/165x107/5568660ed8b42a203d8b4dbf/migrants-powerpoint-21.jpg)