Cancer in Tasmania Incidence and Mortality 2005 · International Classification of Diseases for...
67
Cancer in Tasmania Incidence and Mortality 2005 Tasmanian Cancer Registry University of Tasmania Menzies Research Institute 52 Bathurst Street Hobart Tasmania Australia 7000 Postal address: Private Bag 23 Hobart Tasmania Australia 7001 Telephone (03) 6226 7757 Facsimile (03) 6226 7755 URL: www.menzies.utas.edu.au/cancer_reg.html Email: [email protected] Editors: Dalton M, Venn A, Albion T, Otahal P, Blizzard L Publication date: July 2008
Transcript of Cancer in Tasmania Incidence and Mortality 2005 · International Classification of Diseases for...
Cancer in Tasmania Incidence and Mortality 2005
Tasmanian Cancer Registry University of Tasmania
Menzies Research Institute
52 Bathurst Street
Hobart Tasmania Australia 7000
Postal address:
Private Bag 23
Hobart Tasmania Australia 7001
Telephone (03) 6226 7757
Facsimile (03) 6226 7755
URL: www.menzies.utas.edu.au/cancer_reg.html
Email: [email protected]
Editors: Dalton M, Venn A, Albion T, Otahal P, Blizzard L
Publication date: July 2008

Acknowledgements The Tasmanian Cancer Registry is funded by the Tasmanian Department of Health and Human Services (DHHS), through its
Population Health subdivision, and by the Menzies Research Institute. Additional funds are raised from the community and
research funding bodies. The work of collecting and collating cancer registry data would not be possible without the continuing
assistance and support of a number of people. These include staff members of:
Private and public pathology laboratories
The Registry of Births, Deaths and Marriages
Medical Records Departments of all Tasmanian hospitals
WP Holman Clinics in Launceston and Hobart
Medical practitioners in specialist and general practices
The Australian Bureau of Statistics
Other State and Territory cancer registries
The assistance provided by the Registry’s Advisory Committee is greatly appreciated. The administrative staff and volunteers of
the Registry are commended for their commitment and efforts towards achieving the high level of accuracy and completeness of
data upon which this report is based. We also thank other Menzies Research Institute staff for their assistance with statistical,
computing, administrative, financial, media and editorial matters.
Citation The following citation is suggested in referring to this report:
Dalton M, Venn A, Albion T, Otahal P, Blizzard L. Cancer in Tasmania: Incidence and Mortality 2005. Menzies Research Institute,
Hobart, 2008.
2 | Tasmanian Cancer Registry

Tasmanian Cancer Registry Staff Assoc Prof A Venn Director
Ms M Dalton Manager
Mrs K Jackman Administrative Officer
Ms J Luck Administrative Officer
Mrs P Whelan Administrative Assistant
Assoc Prof L Blizzard Biostatistician, Menzies Research Institute
Mr T Albion IT Systems Manager, Menzies Research Institute
Mr P Otahal Biostatistician, Menzies Research Institute
Members of the Advisory Committee 2007-8 Mr K Churchill Australian Bureau of Statistics, Tasmania
Dr R Brodribb The Cancer Council Tasmania, Tasmania
Ms G Raw Department of Health and Human Services, Tasmania
Professor P Stanton School of Medicine, Department of Surgery, University of Tasmania, Tasmania
Dr R Taylor Director of Public Health and Director of Population Health, Department of Health and Human Services,
Tasmania
Tasmanian Cancer Registry | 3

4 | Tasmanian Cancer Registry
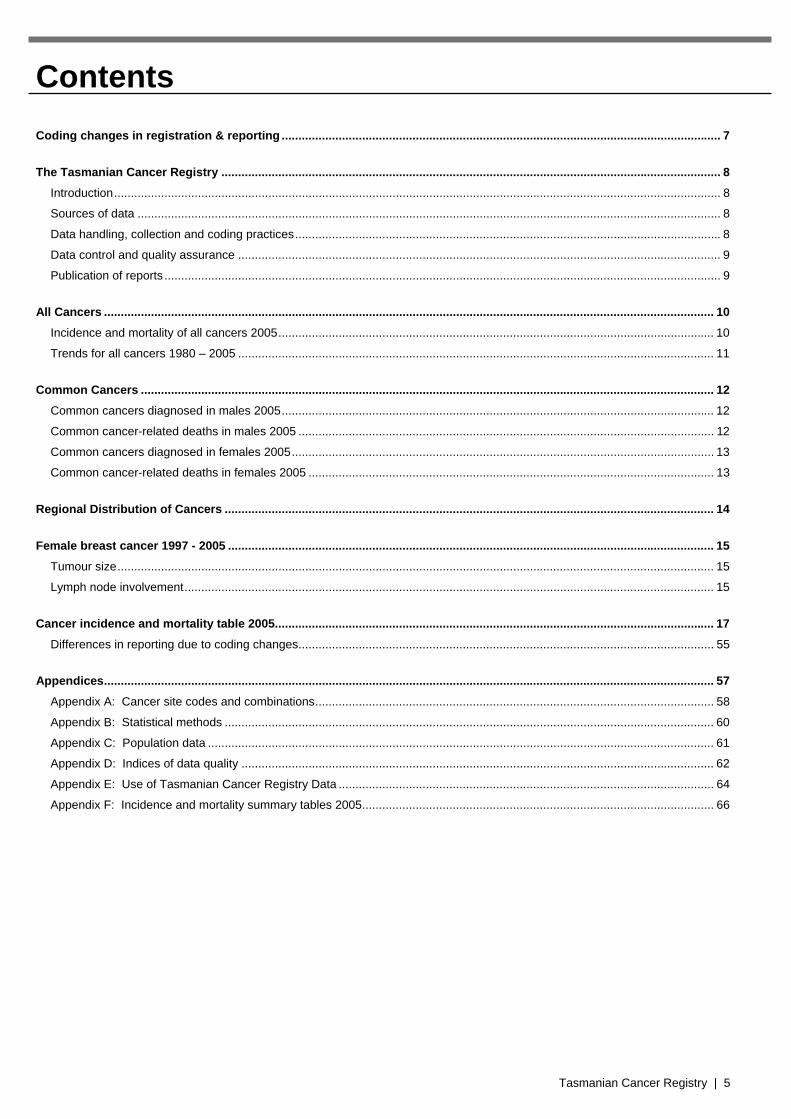
Contents Coding changes in registration & reporting ................................................................................................................................... 7
The Tasmanian Cancer Registry ..................................................................................................................................................... 8 Introduction ..................................................................................................................................................................................... 8 Sources of data .............................................................................................................................................................................. 8 Data handling, collection and coding practices ............................................................................................................................... 8 Data control and quality assurance ................................................................................................................................................ 9 Publication of reports ...................................................................................................................................................................... 9
All Cancers ...................................................................................................................................................................................... 10 Incidence and mortality of all cancers 2005 .................................................................................................................................. 10 Trends for all cancers 1980 – 2005 .............................................................................................................................................. 11
Common Cancers ........................................................................................................................................................................... 12 Common cancers diagnosed in males 2005 ................................................................................................................................. 12 Common cancer-related deaths in males 2005 ............................................................................................................................ 12 Common cancers diagnosed in females 2005 .............................................................................................................................. 13 Common cancer-related deaths in females 2005 ......................................................................................................................... 13
Regional Distribution of Cancers .................................................................................................................................................. 14
Female breast cancer 1997 - 2005 ................................................................................................................................................. 15 Tumour size .................................................................................................................................................................................. 15 Lymph node involvement .............................................................................................................................................................. 15
Cancer incidence and mortality table 2005 ................................................................................................................................... 17 Differences in reporting due to coding changes ............................................................................................................................ 55
Appendices ...................................................................................................................................................................................... 57 Appendix A: Cancer site codes and combinations ....................................................................................................................... 58 Appendix B: Statistical methods .................................................................................................................................................. 60 Appendix C: Population data ....................................................................................................................................................... 61 Appendix D: Indices of data quality ............................................................................................................................................. 62 Appendix E: Use of Tasmanian Cancer Registry Data ................................................................................................................ 64 Appendix F: Incidence and mortality summary tables 2005 ......................................................................................................... 66
Tasmanian Cancer Registry | 5

6 | Tasmanian Cancer Registry

Coding changes in registration & reporting
This report provides a summary of cancer incidence and
mortality statistics for Tasmania in 2005. It includes all cancers
notified to the Tasmanian Cancer Registry that were first
diagnosed in Tasmanian residents between 1 January 2005
and 31 December 2005.
In this report, the primary site and morphology for cancers
diagnosed in Tasmania in 2005 were coded using the
International Classification of Diseases for Oncology, Third
Edition (ICD-O31). In reports prior to 2003, the primary sites of
cancers diagnosed in Tasmania were coded using the
International Classification of Diseases for Oncology, Ninth
Edition (ICD-9) and the morphologies were coded using the
Systematized Nomenclature of Medicine and Modifications
(SNOMED) and the International Classification of Diseases for
Oncology, Second Edition (ICD-O2) 2. The Cancer in
Tasmania 2003 report was the first to be produced using codes
from ICD-03.
In this report, cancers have been tabulated according to ICD-
103 codes (refer to Appendix A on page 58), but coded using
ICD-O3. This allows comparisons to be made with national
cancer incidence and mortality. Cancers were also tabulated in
ICD-10 in the 2001 and 2002 annual reports, but were coded
using ICD-9 and SNOMED/ICD-O2 codes. In earlier annual
reports, cancers were tabulated in ICD-9, and coded using
ICD-9 and SNOMED/ICD-O2 codes. Cancer types and groups
are mostly comparable across reports. An explanation of
differences in the reporting of cancers due to coding changes
over the last few years is provided on page 55.
Tasmanian Cancer Registry | 7
1 Fritz A, Percy C, Jack A et al eds. International Classification of
Diseases for Oncology, Third edition 2 Percy C, Van Holten V, Muir C eds. International Classification of
Diseases for Oncology, Second edition 3 The International Statistical Classification of Diseases and Related
Health Problems, Tenth Revision, Australian Modification (ICD-10-AM)
In line with all other Australian state and territory cancer
registries, the Tasmanian Cancer Registry routinely codes all
melanomas of unknown site to ICD-03 C44 (skin), and these
are reported as ICD-10 C43 ‘Melanoma of Skin’. This is
consistent with reporting practices in the 2003 and 2004
reports. Melanoma morphology codes occurring at other sites
are coded to the site in which they occurred. Cancers reported
as C44 skin cancer include all malignant cancers of the skin,
but exclude basal cell carcinoma, squamous cell carcinoma,
melanoma (reported as ICD-10 C43), some Kaposi sarcomas
(reported as ICD-10 C46), and some types of lymphomas (ICD-
10 C81-C85).
The Tasmanian Cancer Registry
Introduction The Tasmanian Cancer Registry was established in 1977 as a
population-based registry covering the whole of Tasmania. The
Registry was established to provide the State Government with
accurate cancer incidence and mortality statistics and to
monitor cancer trends. In July 1988 the operation of the Cancer
Registry was moved from the Department of Health Services to
the Menzies Research Institute. Cancer was proclaimed a
notifiable disease in December 1992 and cancer registration
since then has had a legislative basis.
Registry staff includes a Director, Manager, two Administrative
Officers and an Administration Assistant. Volunteers also
assist with the paper data handling. The Registry has access to
a biostatistician and a computer consultant. An Advisory
Committee assists the Registry. The Tasmanian Cancer
Registry is a full member of the Australasian Association of
Cancer Registries (AACR) and the International Association of
Cancer Registries (IACR).
Sources of data All pathology laboratories in the State provide the Registry with
copies of histopathological and cytology reports of cancer and
cell marker reports. Cancer notification forms are supplied by
the two radiation oncology clinics. Private and public hospitals
notify diagnoses of cancer to the Registry upon discharge of
patients or provide a computerised listing of cancer cases
periodically. Death notifications of Tasmanian people are
reviewed for mention of cancer as a cause of death. Since
1994 breast and cervical cancer screening programs have
been undertaken in Tasmania and listings from these sources
are available to check against Registry records. Interstate
registries supply data to the Tasmanian Cancer Registry on
Tasmanian residents who seek treatment interstate or who
move interstate at some time after cancer diagnosis.
Data handling, collection and coding practices Paper copies of all scanned notifications are retained until
coding and validation of cases for that year is complete. Paper
records for persons deceased are archived two years after
death. Data for cancers diagnosed between 1 January 2005
and 31 December 2005 were registered on an ACCESS
database developed in–house for the Tasmanian Cancer
Registry. This database was developed to enable: the
registration of cancers using International Classification of
Diseases for Oncology, Third Edition (ICD-O3) codes; the
electronic transfer and processing of cancer incidence and
death notifications; the collection of the minimum dataset
defined by the Australasian Association of Cancer Registries
members; and improved access and manipulation of registry
data for data requests and reporting.
Information collected by the Registry includes demographic
and clinical data for the cancer patient in accordance with the
minimum data defined in the Cancer Registries Data
Dictionary. Additional tumour data are collected for
melanomas, lymphomas, unknown primaries, and breast and
bladder cancers.
The Tasmanian Cancer Registry collects and registers non-
melanoma skin cancers (NMSC) on a register established in
2001 for this purpose. Currently NMSC registrations are
complete from 1978 to 2005. NMSC notifications are registered
only when additional funding sources are obtained. Resource
considerations prevent the routine registration of these cancers
and the pathology reports are stored until additional funds
become available.
Both the primary site and morphology of cancers diagnosed in
Tasmania in 2005 were coded to the International
Classification of Diseases for Oncology, Third Edition (ICD-
O3). This report presents data for invasive cancers only
(behaviour = 3, site C000 – C809). In situ cancers and second
primary cancers with the same three-digit topography code and
related morphologies are not included in this report. Coding
practices specific to the Tasmanian Cancer Registry are
detailed in Appendix A on page 58.
In this report, incidence refers to the number of new primary
tumours that are diagnosed in the Tasmanian population in any
year, rather than the number of people with cancer. While the
Tasmanian Cancer Registry registers multiple primary cancers
8 | Tasmanian Cancer Registry

Tasmanian Cancer Registry | 9
diagnosed in a person, not all primary tumours are reported in
incidence rates according to the rules for incidence reporting
recommended by the International Agency for Research on
Cancer. Applying these rules to incidence reporting improves
the comparability of Tasmanian cancer data with national and
international cancer data.
Data control and quality assurance The quality of information provided by the Registry depends on
the quality of data received. The indices used to measure the
quality of the 2005 data are provided in Appendix D on page
62. To help achieve high data quality and case ascertainment,
data are obtained from multiple sources such as pathology
laboratories, hospitals and the Registrar of Births, Deaths and
Marriages. Most registered cases include data from both a
pathology laboratory and a hospital service (inpatient or
radiation oncology clinic). Where insufficient information is
received to enable complete registration, active follow-up is
undertaken by contacting treating doctors, pathology
laboratories and hospital medical record departments.
The quality also depends on the accuracy of data processing
by the Registry. The new information system is able to detect a
number of errors when data entry is performed. Data matching
programs enable the identification and amendment of duplicate
entries by identifying incorrect spellings, name changes and
date of birth inconsistencies. In addition, the National Cancer
Statistics Clearing House (NCSCH) collates all state and
territory data and checks for duplicate registrations across two
or more states.
On average, the Registry receives cancer notifications once or
twice a week from pathology laboratories, half yearly and ad
hoc from hospitals, and monthly from the Registrar of Births,
Deaths and Marriages. The cases are usually registered within
six months of notification and resolution of incomplete
information can take up to 18 months.
Publication of reports The incidence and mortality data in this report are based on
cancer registrations for 2005 and for 1980 - 2005 for trend
analysis. Despite intensive efforts to ensure the completeness
of incidence data, the database is continually updated with
previously unregistered cases and new information for
registered cases. The data in this report were complete as of
31st May 2008. This improves the quality of data but future
publications and responses to requests for data will reflect any
subsequent revisions to the data and may not exactly
correspond to the figures in this report.

All Cancers All Cancers
Incidence and mortality of all cancers 2005 Incidence and mortality of all cancers 2005 There were 2,737 new cases of cancer (excluding non-melanoma skin cancers) diagnosed among Tasmanian residents during
2005 (1,508 males and 1,229 females). The overall age standardised incidence was 376.4 per 100,000 for males and 292.2 per
100,000 for females2. The risk of developing any cancer by age 75 years was 1 in 3 for males and 1 in 4 for females. The risk
estimate does not include the risk of developing non-melanoma skin cancer.
There were 2,737 new cases of cancer (excluding non-melanoma skin cancers) diagnosed among Tasmanian residents during
2005 (1,508 males and 1,229 females). The overall age standardised incidence was 376.4 per 100,000 for males and 292.2 per
100,000 for females2. The risk of developing any cancer by age 75 years was 1 in 3 for males and 1 in 4 for females. The risk
estimate does not include the risk of developing non-melanoma skin cancer.
Cancer incidence generally increased with age (Figure 1). Male rates exceeded female rates for Tasmanians aged 55 years and
over. Prostate, lung and colorectal cancers were responsible for the greater male cancer incidence at these ages. Breast cancer
accounted for the slightly higher female rates among younger adults. There is no obvious explanation for the decrease in female
incidence rate seen in the 80-84 age bracket.
There were 1,051 (568 male and 483 female) cancer-related deaths among Tasmanian residents in 2005. The overall age
standardised mortality rate was 128.4 per 100,000 for males and 94.0 per 100,000 for females. The person years life lost to age 75
years was 4,595 for males and 4,060 for females.
There were 1,051 (568 male and 483 female) cancer-related deaths among Tasmanian residents in 2005. The overall age
standardised mortality rate was 128.4 per 100,000 for males and 94.0 per 100,000 for females. The person years life lost to age 75
years was 4,595 for males and 4,060 for females.
Figure 1: Age specific incidence and mortality for all cancers (excluding non-melanoma skin cancers) 2005 Figure 1: Age specific incidence and mortality for all cancers (excluding non-melanoma skin cancers) 2005
0
500
1000
1500
2000
2500
3000
3500
4000
4500
0-4
5-9
10-1
4
15-1
9
20-2
4
25-2
9
30-3
4
35-3
9
40-4
4
45-4
9
50-5
4
55-5
9
60-6
4
65-6
9
70-7
4
75-7
9
80-8
4
85+
Age (years)
Age
-spe
cific
rate
s pe
r 100
,000
Male IncidenceFemale IncidenceMale MortalityFemale Mortality
2 Age standardised incidence was calculated using the World Standard Population (1960)
10 | Tasmanian Cancer Registry

Tasmanian Cancer Registry | 11
Trends for all cancers 1980 – 2005
The age standardised incidence rates (ASR) of all cancers (excluding non-melanoma skin cancers) increased by 33% for males
and 30% for females during the 25-year period from 1980 to 2005 (comparing 2004-2005 with 1980-1981), and increased by 7%
for males and 9% for females during the period 2004 to 2005. Some of the largest increases since 1980 were observed for
prostate cancer and malignant melanoma in males and breast cancer and malignant melanoma in females. The increase in
incidence during the 1990s coincided with the greater use of prostate-antigen testing (PSA) for prostate cancer in men and the
introduction of mammography screening for breast cancer in women. While the number of new cancer cases and cancer deaths
occurring each year have generally risen since 1980, age standardised mortality rates per 100,000 population have remained
relatively stable for females and have shown a slight decrease for males. An increase in the total new cancer cases is again seen
in 2005: the ASR for all cancers in males increased from 350.8 in 2004 to 376.4 in 2005, whilst in females it increased from 267.2
in 2004 to 292.2 in 2005. The ASR of head and neck cancers in males is seen to have risen by 48% from 2004 to 2005, whilst in
females malignant melanoma has seen an increase in ASR of 41%. The age-standardised mortality rate for prostate cancer has
decreased by 21%, and in females decreases can be seen in mortality rates for all lymphomas (37%) and colorectal cancer (29%).
The mortality rate for lung cancer in females, however, has increased by 33%, with an increase of 48% for melanoma in males.
0
50
100
150
200
250
300
350
400
450
500
550
600
650
1980
1981
1982
1983
1984
1985
1986
1987
1988
1989
1990
1991
1992
1993
1994
1995
1996
1997
1998
1999
2000
2001
2002
2003
2004
2005
Year
Cru
de
rate
s p
er
100
,000
po
pu
lati
on
Male Incidence
Female Incidence
Male Mortality
Female Mortality
0
50
100
150
200
250
300
350
400
450
500
550
600
650
1980
1981
1982
1983
1984
1985
1986
1987
1988
1989
1990
1991
1992
1993
1994
1995
1996
1997
1998
1999
2000
2001
2002
2003
2004
2005
Year
Ag
e s
tand
ard
ised
ra
tes
per
100
,00
0 (W
orl
d 1
960
)
Male Incidence
Female Incidence
Male Mortality
Female Mortality
Figure 2: Trends in age standardised
incidence and mortality of all cancers
(excluding non-melanoma skin cancers)
1980 – 2005*
*Incidence and mortality for all cancers from 1980 to 2000 is reported in ICD-9 while data for 2001 to 2005 are reported in ICD-10.
Figure 3: Trends in crude incidence and
mortality of all cancers (excluding non-
melanoma skin cancers) 1980 – 2005*

Common Cancers Common Cancers
Common cancers diagnosed in males 2005 Common cancers diagnosed in males 2005 The most common cancer diagnosed in males in 2005 was prostate cancer, followed by colorectal cancer, lung cancer, melanoma
skin cancer and bladder cancer.
The most common cancer diagnosed in males in 2005 was prostate cancer, followed by colorectal cancer, lung cancer, melanoma
skin cancer and bladder cancer.
Figure 4: Common cancers diagnosed in males 2005 Figure 4: Common cancers diagnosed in males 2005
485
198
158
148
51
0 100 200 300 400 500 600
Prostate
Colorectal
Lung
Melanoma of skin
Bladder
Number of cancer cases
Common cancer-related deaths in males 2005 The most common causes of cancer-related deaths in male Tasmanian residents in 2005 were lung cancer, colorectal cancer,
prostate cancer, melanoma skin cancer and stomach cancer.
Figure 5: Common causes of cancer-related deaths in males 2005
151
85
62
28
23
0 20 40 60 80 100 120 140 160
Lung
Colorectal
Prostate
Melanoma of skin
Stomach
Number of cancer deaths
12 | Tasmanian Cancer Registry
Tasmanian Cancer Registry | 13
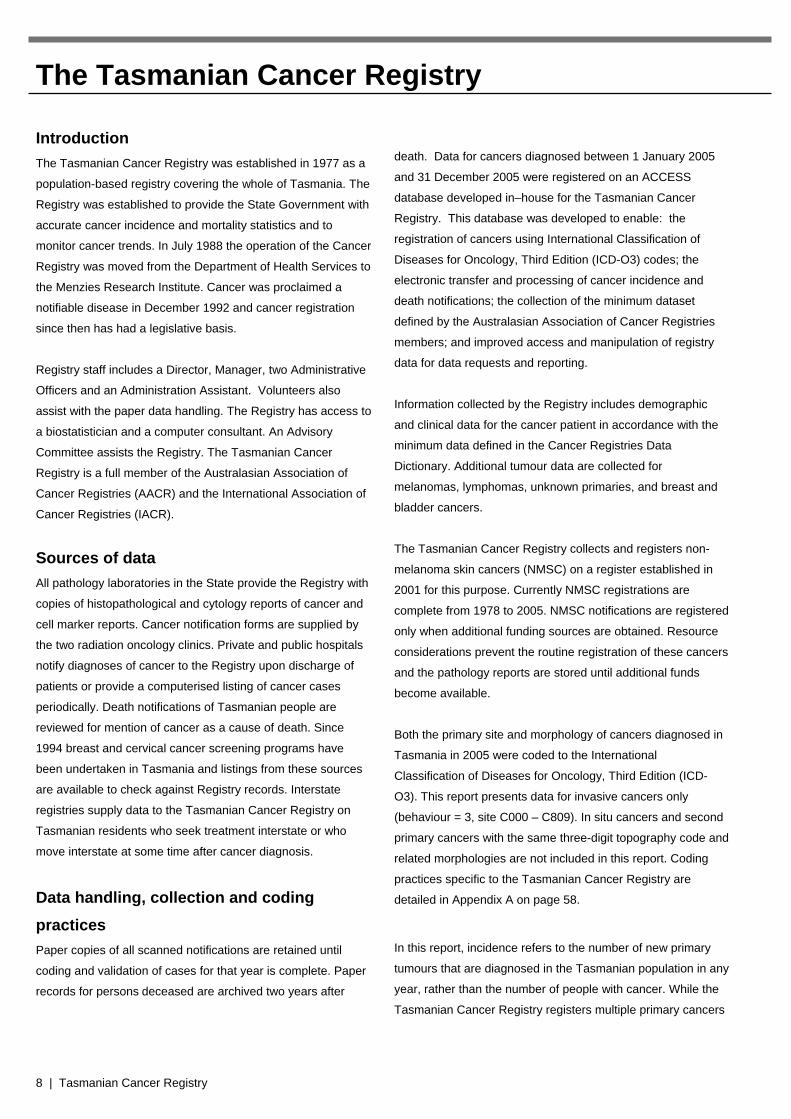
Common cancers diagnosed in females 2005 The most common cancer diagnosed in females in 2005 was breast cancer, followed by colorectal cancer, melanoma skin cancer,
lung cancer and all lymphomas.
Figure 6: Common cancers diagnosed in females 2005
323
178
137
109
53
0 50 100 150 200 250 300 350
Breast
Colorectal
Melanoma of skin
Lung
All lymphomas
Number of cancer cases
Common cancer-related deaths in females 2005 The most common causes of cancer-related deaths in female Tasmanian residents in 2005 were lung cancer, breast cancer,
colorectal cancer, cancer of the pancreas, all leukaemias and all lymphomas.
Figure 7: Common causes of cancer-related deaths in females 2005
90
83
57
20
16
16
0 20 40 60 80 100
Lung
Breast
Colorectal
Pancreas
All leukaemia
All lymphomas
Number of cancer deaths
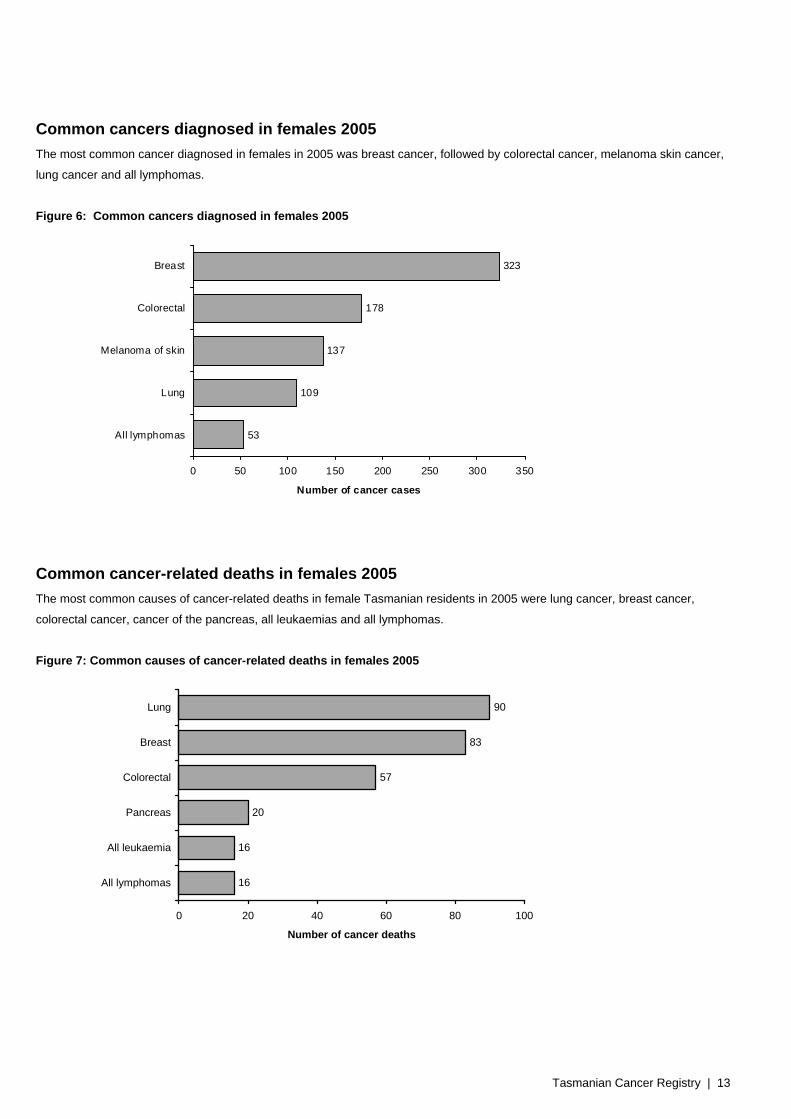
Regional Distribution of Cancers Regional Distribution of Cancers
The regional distribution of common cancers is shown as the number of cases and the percentage of all cases of each cancer site
in each statistical division (Table 1). This information is based on recorded postcode of residence. On the basis of population
numbers in each of the statistical divisions, the distribution of cancers would be expected to be 49% in the South, 29% in the North
and 22% in the Mersey-Lyell division. Variation around that distribution can be expected due to chance occurrences and
differences in the age distribution between the regional populations.
Table 1: Regional distribution of cancer incidence for all sites with a minimum of 50 new cases 2005
ICD-10 Site Southern Northern Mersey-Lyell Total#
239,444 (49%) 137,936 (28%) 107,883 (22%) 485,263 (100%)
C61 Prostate 257 (53%) 126 (26%) 102 (21%) 485
C18 - C21 Colorectal 176 (47%) 96 (26%) 104 (28%) 376
C50 Breast 182 (56%) 84 (26%) 60 (18%) 326
C43 Melanoma of skin 130 (46%) 77 (27%) 78 (27%) 285
C33, C34 Lung 134 (50%) 85 (32%) 48 (18%) 267
C81 - C85 All lymphomas 49 (51%) 29 (30%) 18 (19%) 96
C91 - C95 All leukaemia 47 (64%) 17 (23%) 10 (14%) 74
C67 Bladder 35 (50%) 18 (26%) 17 (24%) 70
C64 Kidney 33 (52%) 17 (27%) 13 (21%) 63
C16 Stomach 31 (51%) 19 (31%) 11 (18%) 61
Total new cases 1074 (51%) 568 (27%) 461 (22%) 2103
*Cancer types may not add up to 100% due to rounding. #Source: Australian Bureau of Statistics (ABS), Population Estimates by Age and Sex, Tasmania, June: 2005 Copyright © Commonwealth of
Australia 2006 (Cat. No. 3201.0)
14 | Tasmanian Cancer Registry
Tasmanian Cancer Registry | 15
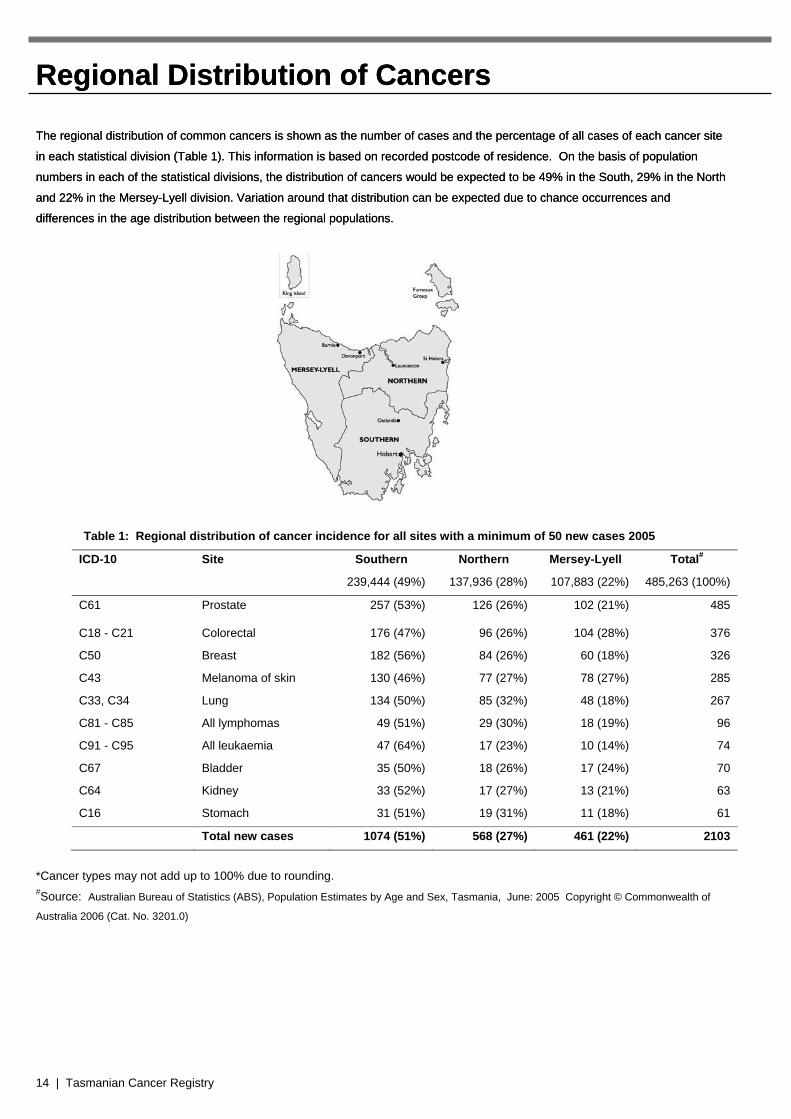
Female breast cancer 1997 - 2005 The Tasmanian Cancer Registry first recorded breast cancer tumour size and lymph node involvement in 1997 when funding was
provided to all Australian cancer registries for this purpose.
Tumour size
In 2005, 98% of the 323 primary breast cancer cases (female) were histologically examined3. Information about tumour size was
available for 296 (91%) of these cases. Of these tumours, 44 (14%) were less than 10mm in diameter, 117 (40%) were between 10
and 19mm, 117 (40%) were between 20 and 49mm, and 18 (6%) were at least 50mm in diameter. Figure 8 compares categories of
tumour size from 1997 to 2005.
Figure 8: Breast cancer - Size of histologically confirmed tumours 1997 - 2005
0
5
10
15
20
25
30
35
40
45
50
1997 1998 1999 2000 2001 2002 2003 2004 2005
Year
Per
cen
tag
e o
f ca
ses
01 - 09 mm
10 - 19 mm
20 - 49 mm
50+ mm
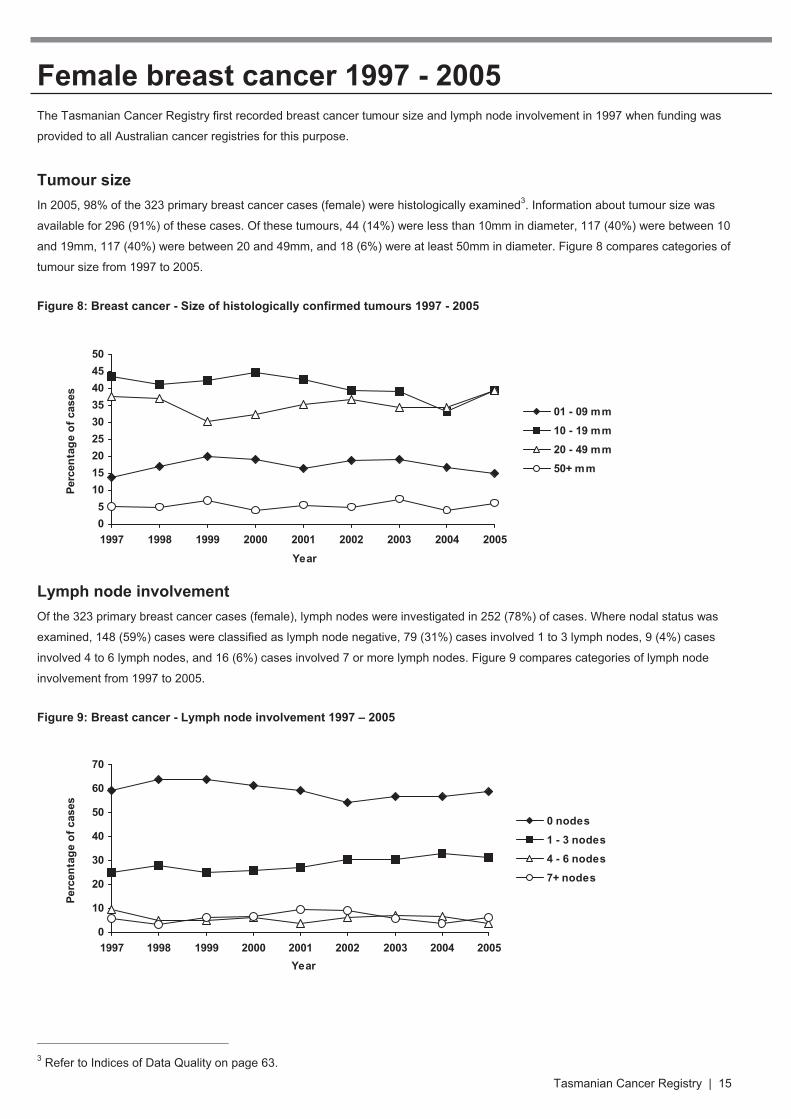
Lymph node involvement
Of the 323 primary breast cancer cases (female), lymph nodes were investigated in 252 (78%) of cases. Where nodal status was
examined, 148 (59%) cases were classified as lymph node negative, 79 (31%) cases involved 1 to 3 lymph nodes, 9 (4%) cases
involved 4 to 6 lymph nodes, and 16 (6%) cases involved 7 or more lymph nodes. Figure 9 compares categories of lymph node
involvement from 1997 to 2005.
Figure 9: Breast cancer - Lymph node involvement 1997 – 2005
0
10
20
30
40
50
60
70
1997 1998 1999 2000 2001 2002 2003 2004 2005
Year
Per
cen
tag
e o
f ca
ses
0 nodes
1 - 3 nodes
4 - 6 nodes
7+ nodes
3 Refer to Indices of Data Quality on page 63.

16 | Tasmanian Cancer Registry
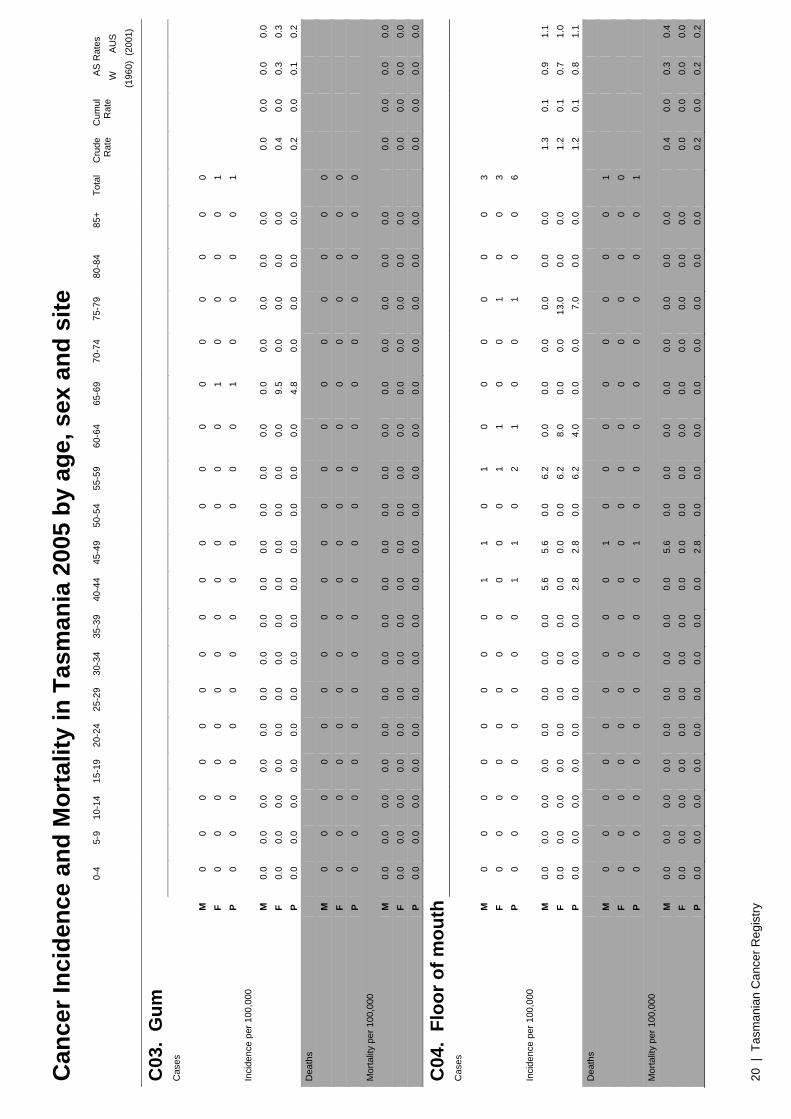
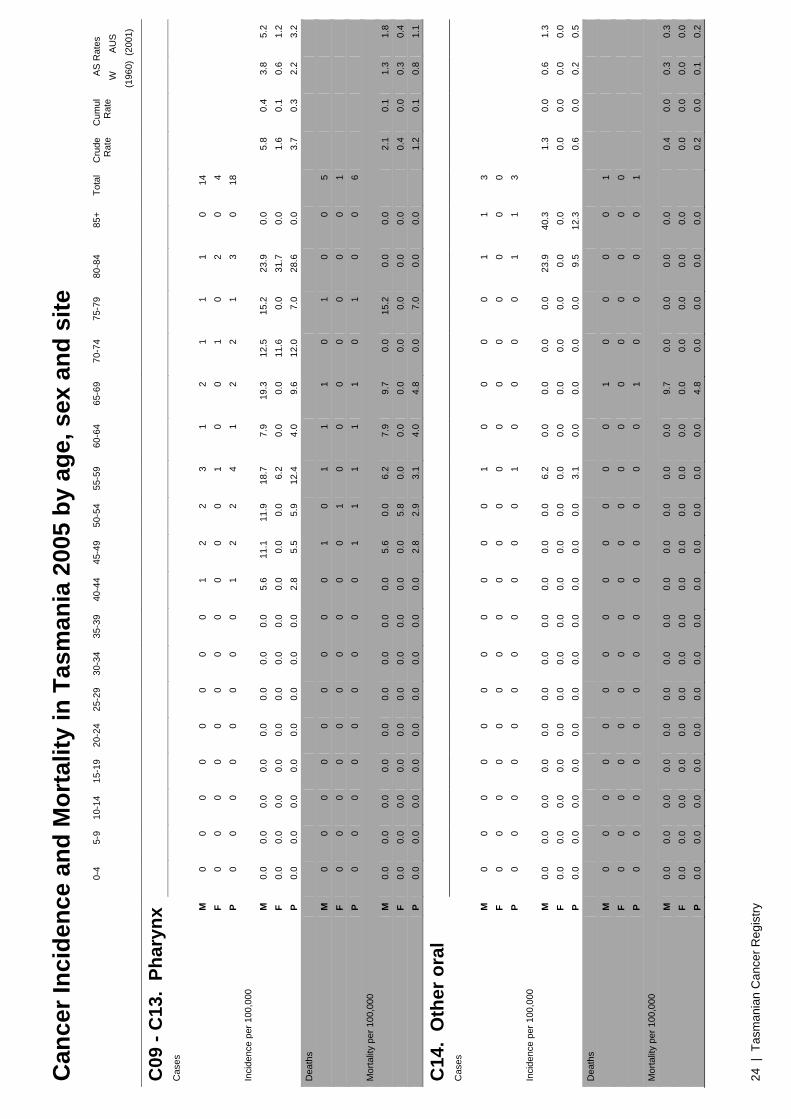
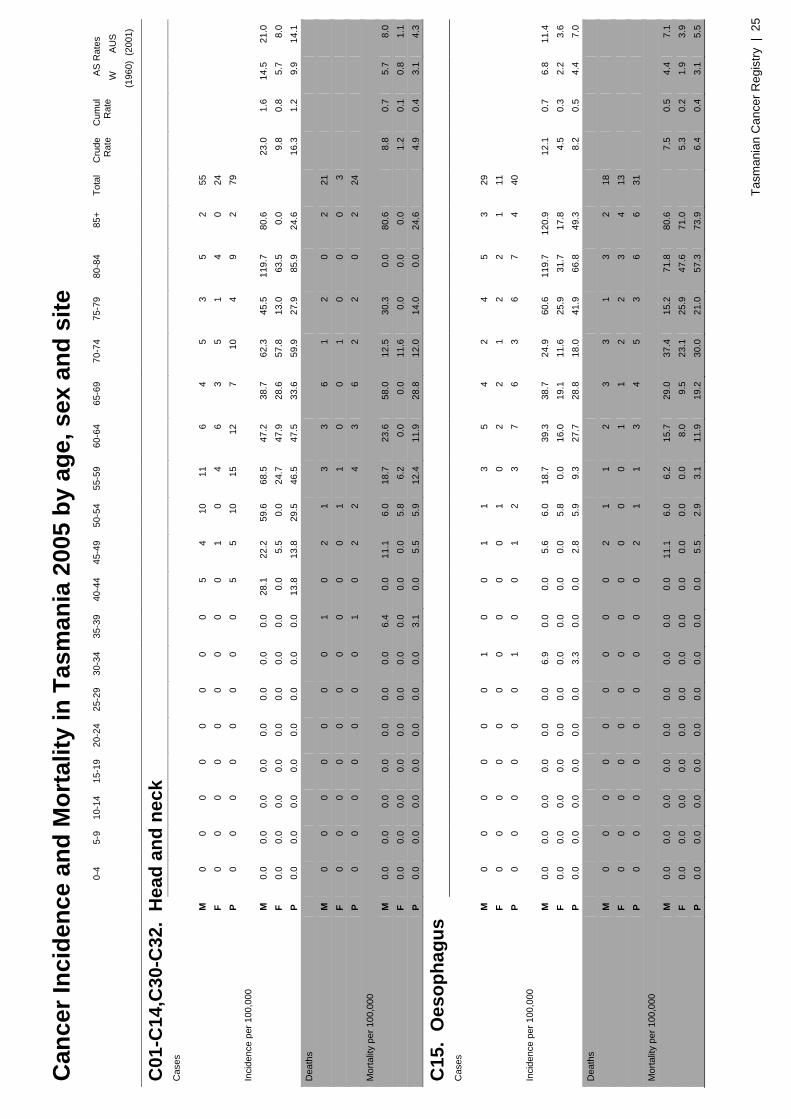
Cancer incidence and mortality table 2005
- Numbers of new cases and deaths
- Age-specific incidence and mortality rates per 100,000
- Crude incidence and mortality rates per 100,000 (Crude Rates)
- Cumulative incidence and mortality rates (Cumul Rates)
- Age standardised incidence and mortality rates using the Australian Standard Population (2001) and
the World Standard Population (1960)
Tasmanian Cancer Registry | 17

18 | Tasmanian Cancer Registry

Can
cer I
ncid
ence
and
Mor
talit
y in
Tas
man
ia 2
005
by a
ge, s
ex a
nd s
ite
Tasm
ania
n C
ance
r Reg
istry
| 1
9
0-
4 5-
9 10
-14
15-1
9 20
-24
25-2
9 30
-34
35-3
9 40
-44
45-4
9 50
-54
55-5
9 60
-64
65-6
9 70
-74
75-7
9 80
-84
85+
Tota
l C
rude
R
ate
Cum
ul
Rat
e AS
Rat
es
W
AU
S
(196
0) (
2001
)
C00
. Li
p C
ases
M
0 0
0 0
1 1
0 0
0 2
0 3
4 1
0 0
2 1
15
F
0 0
0 0
0 0
0 0
0 0
1 0
0 0
2 0
2 1
6
P 0
0 0
0 1
1 0
0 0
2 1
3 4
1 2
0 4
2 21
In
cide
nce
per 1
00,0
00
M
0.
0 0.
0 0.
0 0.
0 6.
2 7.
5 0.
0 0.
0 0.
0 11
.1
0.0
18.7
31
.4
9.7
0.0
0.0
47.9
40
.3
6.
3 0.
4 4.
5 5.
7
F 0.
0 0.
0 0.
0 0.
0 0.
0 0.
0 0.
0 0.
0 0.
0 0.
0 5.
8 0.
0 0.
0 0.
0 23
.1
0.0
31.7
17
.8
2.
4 0.
1 1.
0 1.
9
P 0.
0 0.
0 0.
0 0.
0 3.
2 3.
8 0.
0 0.
0 0.
0 5.
5 2.
9 9.
3 15
.8
4.8
12.0
0.
0 38
.2
24.6
4.3
0.3
2.7
3.8
Dea
ths
M
0
0 0
0 0
0 0
0 0
0 0
0 0
0 0
0 0
0 0
F
0 0
0 0
0 0
0 0
0 0
0 0
0 0
0 0
0 0
0
P 0
0 0
0 0
0 0
0 0
0 0
0 0
0 0
0 0
0 0
Mor
talit
y pe
r 100
,000
M
0.0
0.0
0.0
0.0
0.0
0.0
0.0
0.0
0.0
0.0
0.0
0.0
0.0
0.0
0.0
0.0
0.0
0.0
0.
0 0.
0 0.
0 0.
0
F 0.
0 0.
0 0.
0 0.
0 0.
0 0.
0 0.
0 0.
0 0.
0 0.
0 0.
0 0.
0 0.
0 0.
0 0.
0 0.
0 0.
0 0.
0
0.0
0.0
0.0
0.0
P
0.0
0.0
0.0
0.0
0.0
0.0
0.0
0.0
0.0
0.0
0.0
0.0
0.0
0.0
0.0
0.0
0.0
0.0
0.
0 0.
0 0.
0 0.
0
C01
, C02
. To
ngue
C
ases
M
0 0
0 0
0 0
0 0
1 0
2 0
1 0
1 1
1 0
7
F 0
0 0
0 0
0 0
0 0
0 0
0 2
0 0
0 1
0 3
P
0 0
0 0
0 0
0 0
1 0
2 0
3 0
1 1
2 0
10
Inci
denc
e pe
r 100
,000
M
0.0
0.0
0.0
0.0
0.0
0.0
0.0
0.0
5.6
0.0
11.9
0.
0 7.
9 0.
0 12
.5
15.2
23
.9
0.0
2.
9 0.
2 1.
8 2.
8
F 0.
0 0.
0 0.
0 0.
0 0.
0 0.
0 0.
0 0.
0 0.
0 0.
0 0.
0 0.
0 16
.0
0.0
0.0
0.0
15.9
0.
0
1.2
0.1
0.7
0.9
P
0.0
0.0
0.0
0.0
0.0
0.0
0.0
0.0
2.8
0.0
5.9
0.0
11.9
0.
0 6.
0 7.
0 19
.1
0.0
2.
1 0.
1 1.
2 1.
8 D
eath
s
M
0 0
0 0
0 0
0 1
0 0
0 0
1 2
0 1
0 0
5
F 0
0 0
0 0
0 0
0 0
0 0
0 0
0 0
0 0
0 0
P
0 0
0 0
0 0
0 1
0 0
0 0
1 2
0 1
0 0
5
M
orta
lity
per 1
00,0
00
M
0.
0 0.
0 0.
0 0.
0 0.
0 0.
0 0.
0 6.
4 0.
0 0.
0 0.
0 0.
0 7.
9 19
.3
0.0
15.2
0.
0 0.
0
2.1
0.2
1.4
1.9
F
0.0
0.0
0.0
0.0
0.0
0.0
0.0
0.0
0.0
0.0
0.0
0.0
0.0
0.0
0.0
0.0
0.0
0.0
0.
0 0.
0 0.
0 0.
0
P 0.
0 0.
0 0.
0 0.
0 0.
0 0.
0 0.
0 3.
1 0.
0 0.
0 0.
0 0.
0 4.
0 9.
6 0.
0 7.
0 0.
0 0.
0
1.0
0.1
0.7
0.9
Can
cer I
ncid
ence
and
Mor
talit
y in
Tas
man
ia 2
005
by a
ge, s
ex a
nd s
ite
20 |
Tas
man
ian
Can
cer R
egis
try
0-
4 5-
9 10
-14
15-1
9 20
-24
25-2
9 30
-34
35-3
9 40
-44
45-4
9 50
-54
55-5
9 60
-64
65-6
9 70
-74
75-7
9 80
-84
85+
Tota
l C
rude
R
ate
Cum
ul
Rat
e AS
Rat
es
W
AU
S
(196
0) (
2001
)
C03
. G
um
Cas
es
M
0
0 0
0 0
0 0
0 0
0 0
0 0
0 0
0 0
0 0
F
0 0
0 0
0 0
0 0
0 0
0 0
0 1
0 0
0 0
1
P 0
0 0
0 0
0 0
0 0
0 0
0 0
1 0
0 0
0 1
Inci
denc
e pe
r 100
,000
M
0.0
0.0
0.0
0.0
0.0
0.0
0.0
0.0
0.0
0.0
0.0
0.0
0.0
0.0
0.0
0.0
0.0
0.0
0.
0 0.
0 0.
0 0.
0
F 0.
0 0.
0 0.
0 0.
0 0.
0 0.
0 0.
0 0.
0 0.
0 0.
0 0.
0 0.
0 0.
0 9.
5 0.
0 0.
0 0.
0 0.
0
0.4
0.0
0.3
0.3
P
0.0
0.0
0.0
0.0
0.0
0.0
0.0
0.0
0.0
0.0
0.0
0.0
0.0
4.8
0.0
0.0
0.0
0.0
0.
2 0.
0 0.
1 0.
2 D
eath
s
M
0 0
0 0
0 0
0 0
0 0
0 0
0 0
0 0
0 0
0
F 0
0 0
0 0
0 0
0 0
0 0
0 0
0 0
0 0
0 0
P
0 0
0 0
0 0
0 0
0 0
0 0
0 0
0 0
0 0
0
M
orta
lity
per 1
00,0
00
M
0.
0 0.
0 0.
0 0.
0 0.
0 0.
0 0.
0 0.
0 0.
0 0.
0 0.
0 0.
0 0.
0 0.
0 0.
0 0.
0 0.
0 0.
0
0.0
0.0
0.0
0.0
F
0.0
0.0
0.0
0.0
0.0
0.0
0.0
0.0
0.0
0.0
0.0
0.0
0.0
0.0
0.0
0.0
0.0
0.0
0.
0 0.
0 0.
0 0.
0
P 0.
0 0.
0 0.
0 0.
0 0.
0 0.
0 0.
0 0.
0 0.
0 0.
0 0.
0 0.
0 0.
0 0.
0 0.
0 0.
0 0.
0 0.
0
0.0
0.0
0.0
0.0
C04
. Fl
oor o
f mou
th
Cas
es
M
0
0 0
0 0
0 0
0 1
1 0
1 0
0 0
0 0
0 3
F
0 0
0 0
0 0
0 0
0 0
0 1
1 0
0 1
0 0
3
P 0
0 0
0 0
0 0
0 1
1 0
2 1
0 0
1 0
0 6
Inci
denc
e pe
r 100
,000
M
0.0
0.0
0.0
0.0
0.0
0.0
0.0
0.0
5.6
5.6
0.0
6.2
0.0
0.0
0.0
0.0
0.0
0.0
1.
3 0.
1 0.
9 1.
1
F 0.
0 0.
0 0.
0 0.
0 0.
0 0.
0 0.
0 0.
0 0.
0 0.
0 0.
0 6.
2 8.
0 0.
0 0.
0 13
.0
0.0
0.0
1.
2 0.
1 0.
7 1.
0
P 0.
0 0.
0 0.
0 0.
0 0.
0 0.
0 0.
0 0.
0 2.
8 2.
8 0.
0 6.
2 4.
0 0.
0 0.
0 7.
0 0.
0 0.
0
1.2
0.1
0.8
1.1
Dea
ths
M
0
0 0
0 0
0 0
0 0
1 0
0 0
0 0
0 0
0 1
F
0 0
0 0
0 0
0 0
0 0
0 0
0 0
0 0
0 0
0
P 0
0 0
0 0
0 0
0 0
1 0
0 0
0 0
0 0
0 1
Mor
talit
y pe
r 100
,000
M
0.0
0.0
0.0
0.0
0.0
0.0
0.0
0.0
0.0
5.6
0.0
0.0
0.0
0.0
0.0
0.0
0.0
0.0
0.
4 0.
0 0.
3 0.
4
F 0.
0 0.
0 0.
0 0.
0 0.
0 0.
0 0.
0 0.
0 0.
0 0.
0 0.
0 0.
0 0.
0 0.
0 0.
0 0.
0 0.
0 0.
0
0.0
0.0
0.0
0.0
P
0.0
0.0
0.0
0.0
0.0
0.0
0.0
0.0
0.0
2.8
0.0
0.0
0.0
0.0
0.0
0.0
0.0
0.0
0.
2 0.
0 0.
2 0.
2

Can
cer I
ncid
ence
and
Mor
talit
y in
Tas
man
ia 2
005
by a
ge, s
ex a
nd s
ite
Tasm
ania
n C
ance
r Reg
istry
| 2
1
0-
4 5-
9 10
-14
15-1
9 20
-24
25-2
9 30
-34
35-3
9 40
-44
45-4
9 50
-54
55-5
9 60
-64
65-6
9 70
-74
75-7
9 80
-84
85+
Tota
l C
rude
R
ate
Cum
ul
Rat
e AS
Rat
es
W
AU
S
(196
0) (
2001
)
C05
, C06
. O
ther
mou
th
Cas
es
M
0
0 0
0 0
0 0
0 0
0 0
2 1
0 0
0 0
1 4
F
0 0
0 0
0 0
0 0
0 0
0 0
1 0
1 0
1 0
3
P 0
0 0
0 0
0 0
0 0
0 0
2 2
0 1
0 1
1 7
Inci
denc
e pe
r 100
,000
M
0.0
0.0
0.0
0.0
0.0
0.0
0.0
0.0
0.0
0.0
0.0
12.4
7.
9 0.
0 0.
0 0.
0 0.
0 40
.3
1.
7 0.
1 1.
0 1.
5
F 0.
0 0.
0 0.
0 0.
0 0.
0 0.
0 0.
0 0.
0 0.
0 0.
0 0.
0 0.
0 8.
0 0.
0 11
.6
0.0
15.9
0.
0
1.2
0.1
0.6
1.0
P
0.0
0.0
0.0
0.0
0.0
0.0
0.0
0.0
0.0
0.0
0.0
6.2
7.9
0.0
6.0
0.0
9.5
12.3
1.4
0.1
0.8
1.2
Dea
ths
M
0
0 0
0 0
0 0
0 0
0 1
0 0
0 0
0 0
0 1
F
0 0
0 0
0 0
0 0
0 0
0 0
0 0
0 0
0 0
0
P 0
0 0
0 0
0 0
0 0
0 1
0 0
0 0
0 0
0 1
Mor
talit
y pe
r 100
,000
M
0.0
0.0
0.0
0.0
0.0
0.0
0.0
0.0
0.0
0.0
6.0
0.0
0.0
0.0
0.0
0.0
0.0
0.0
0.
4 0.
0 0.
3 0.
4
F 0.
0 0.
0 0.
0 0.
0 0.
0 0.
0 0.
0 0.
0 0.
0 0.
0 0.
0 0.
0 0.
0 0.
0 0.
0 0.
0 0.
0 0.
0
0.0
0.0
0.0
0.0
P
0.0
0.0
0.0
0.0
0.0
0.0
0.0
0.0
0.0
0.0
2.9
0.0
0.0
0.0
0.0
0.0
0.0
0.0
0.
2 0.
0 0.
1 0.
2
C01
- C
06.
Ora
l Cav
ity
Cas
es
M
0
0 0
0 0
0 0
0 2
1 2
3 2
0 1
1 1
1 14
F 0
0 0
0 0
0 0
0 0
0 0
1 4
1 1
1 2
0 10
P 0
0 0
0 0
0 0
0 2
1 2
4 6
1 2
2 3
1 24
In
cide
nce
per 1
00,0
00
M
0.
0 0.
0 0.
0 0.
0 0.
0 0.
0 0.
0 0.
0 11
.2
5.6
11.9
18
.7
15.7
0.
0 12
.5
15.2
23
.9
40.3
5.8
0.4
3.7
5.5
F
0.0
0.0
0.0
0.0
0.0
0.0
0.0
0.0
0.0
0.0
0.0
6.2
32.0
9.
5 11
.6
13.0
31
.7
0.0
4.
1 0.
3 2.
3 3.
3
P 0.
0 0.
0 0.
0 0.
0 0.
0 0.
0 0.
0 0.
0 5.
5 2.
8 5.
9 12
.4
23.8
4.
8 12
.0
14.0
28
.6
12.3
4.9
0.3
3.0
4.2
Dea
ths
M
0
0 0
0 0
0 0
1 0
1 1
0 1
2 0
1 0
0 7
F
0 0
0 0
0 0
0 0
0 0
0 0
0 0
0 0
0 0
0
P 0
0 0
0 0
0 0
1 0
1 1
0 1
2 0
1 0
0 7
Mor
talit
y pe
r 100
,000
M
0.0
0.0
0.0
0.0
0.0
0.0
0.0
6.4
0.0
5.6
6.0
0.0
7.9
19.3
0.
0 15
.2
0.0
0.0
2.
9 0.
2 2.
1 2.
7
F 0.
0 0.
0 0.
0 0.
0 0.
0 0.
0 0.
0 0.
0 0.
0 0.
0 0.
0 0.
0 0.
0 0.
0 0.
0 0.
0 0.
0 0.
0
0.0
0.0
0.0
0.0
P
0.0
0.0
0.0
0.0
0.0
0.0
0.0
3.1
0.0
2.8
2.9
0.0
4.0
9.6
0.0
7.0
0.0
0.0
1.
4 0.
1 1.
0 1.
3

Can
cer I
ncid
ence
and
Mor
talit
y in
Tas
man
ia 2
005
by a
ge, s
ex a
nd s
ite
22 |
Tas
man
ian
Can
cer R
egis
try
0-
4 5-
9 10
-14
15-1
9 20
-24
25-2
9 30
-34
35-3
9 40
-44
45-4
9 50
-54
55-5
9 60
-64
65-6
9 70
-74
75-7
9 80
-84
85+
Tota
l C
rude
R
ate
Cum
ul
Rat
e AS
Rat
es
W
AU
S
(196
0) (
2001
)
C07
, C08
. Sa
livar
y gl
ands
C
ases
M
0 0
0 0
0 0
0 0
1 1
0 0
0 0
2 0
0 0
4
F 0
0 0
0 0
0 0
0 0
1 0
0 1
1 1
0 0
0 4
P
0 0
0 0
0 0
0 0
1 2
0 0
1 1
3 0
0 0
8
In
cide
nce
per 1
00,0
00
M
0.
0 0.
0 0.
0 0.
0 0.
0 0.
0 0.
0 0.
0 5.
6 5.
6 0.
0 0.
0 0.
0 0.
0 24
.9
0.0
0.0
0.0
1.
7 0.
2 1.
2 1.
6
F 0.
0 0.
0 0.
0 0.
0 0.
0 0.
0 0.
0 0.
0 0.
0 5.
5 0.
0 0.
0 8.
0 9.
5 11
.6
0.0
0.0
0.0
1.
6 0.
2 1.
2 1.
4
P 0.
0 0.
0 0.
0 0.
0 0.
0 0.
0 0.
0 0.
0 2.
8 5.
5 0.
0 0.
0 4.
0 4.
8 18
.0
0.0
0.0
0.0
1.
6 0.
2 1.
2 1.
5 D
eath
s
M
0 0
0 0
0 0
0 0
0 0
0 0
0 0
1 0
0 0
1
F 0
0 0
0 0
0 0
0 0
0 0
1 0
0 0
0 0
0 1
P
0 0
0 0
0 0
0 0
0 0
0 1
0 0
1 0
0 0
2
M
orta
lity
per 1
00,0
00
M
0.
0 0.
0 0.
0 0.
0 0.
0 0.
0 0.
0 0.
0 0.
0 0.
0 0.
0 0.
0 0.
0 0.
0 12
.5
0.0
0.0
0.0
0.
4 0.
1 0.
2 0.
4
F 0.
0 0.
0 0.
0 0.
0 0.
0 0.
0 0.
0 0.
0 0.
0 0.
0 0.
0 6.
2 0.
0 0.
0 0.
0 0.
0 0.
0 0.
0
0.4
0.0
0.2
0.3
P
0.0
0.0
0.0
0.0
0.0
0.0
0.0
0.0
0.0
0.0
0.0
3.1
0.0
0.0
6.0
0.0
0.0
0.0
0.
4 0.
0 0.
2 0.
4
C09
, C10
. O
roph
aryn
x C
ases
M
0 0
0 0
0 0
0 0
1 1
1 1
1 2
1 1
1 0
10
F
0 0
0 0
0 0
0 0
0 0
0 1
0 0
1 0
1 0
3
P 0
0 0
0 0
0 0
0 1
1 1
2 1
2 2
1 2
0 13
In
cide
nce
per 1
00,0
00
M
0.
0 0.
0 0.
0 0.
0 0.
0 0.
0 0.
0 0.
0 5.
6 5.
6 6.
0 6.
2 7.
9 19
.3
12.5
15
.2
23.9
0.
0
4.2
0.3
2.6
3.8
F
0.0
0.0
0.0
0.0
0.0
0.0
0.0
0.0
0.0
0.0
0.0
6.2
0.0
0.0
11.6
0.
0 15
.9
0.0
1.
2 0.
1 0.
6 1.
0
P 0.
0 0.
0 0.
0 0.
0 0.
0 0.
0 0.
0 0.
0 2.
8 2.
8 2.
9 6.
2 4.
0 9.
6 12
.0
7.0
19.1
0.
0
2.7
0.2
1.6
2.3
Dea
ths
M
0
0 0
0 0
0 0
0 0
0 0
1 0
1 0
1 0
0 3
F
0 0
0 0
0 0
0 0
0 0
0 0
0 0
0 0
0 0
0
P 0
0 0
0 0
0 0
0 0
0 0
1 0
1 0
1 0
0 3
Mor
talit
y pe
r 100
,000
M
0.0
0.0
0.0
0.0
0.0
0.0
0.0
0.0
0.0
0.0
0.0
6.2
0.0
9.7
0.0
15.2
0.
0 0.
0
1.3
0.1
0.7
1.1
F
0.0
0.0
0.0
0.0
0.0
0.0
0.0
0.0
0.0
0.0
0.0
0.0
0.0
0.0
0.0
0.0
0.0
0.0
0.
0 0.
0 0.
0 0.
0
P 0.
0 0.
0 0.
0 0.
0 0.
0 0.
0 0.
0 0.
0 0.
0 0.
0 0.
0 3.
1 0.
0 4.
8 0.
0 7.
0 0.
0 0.
0
0.6
0.0
0.3
0.5

Can
cer I
ncid
ence
and
Mor
talit
y in
Tas
man
ia 2
005
by a
ge, s
ex a
nd s
ite
Tasm
ania
n C
ance
r Reg
istry
| 2
3
0-
4 5-
9 10
-14
15-1
9 20
-24
25-2
9 30
-34
35-3
9 40
-44
45-4
9 50
-54
55-5
9 60
-64
65-6
9 70
-74
75-7
9 80
-84
85+
Tota
l C
rude
R
ate
Cum
ul
Rat
e AS
Rat
es
W
AU
S
(196
0) (
2001
)
C11
. N
asop
hary
nx
Cas
es
M
0
0 0
0 0
0 0
0 0
1 0
1 0
0 0
0 0
0 2
F
0 0
0 0
0 0
0 0
0 0
0 0
0 0
0 0
1 0
1
P 0
0 0
0 0
0 0
0 0
1 0
1 0
0 0
0 1
0 3
Inci
denc
e pe
r 100
,000
M
0.0
0.0
0.0
0.0
0.0
0.0
0.0
0.0
0.0
5.6
0.0
6.2
0.0
0.0
0.0
0.0
0.0
0.0
0.
8 0.
1 0.
6 0.
7
F 0.
0 0.
0 0.
0 0.
0 0.
0 0.
0 0.
0 0.
0 0.
0 0.
0 0.
0 0.
0 0.
0 0.
0 0.
0 0.
0 15
.9
0.0
0.
4 0.
0 0.
1 0.
3
P 0.
0 0.
0 0.
0 0.
0 0.
0 0.
0 0.
0 0.
0 0.
0 2.
8 0.
0 3.
1 0.
0 0.
0 0.
0 0.
0 9.
5 0.
0
0.6
0.0
0.3
0.5
Dea
ths
M
0
0 0
0 0
0 0
0 0
1 0
0 0
0 0
0 0
0 1
F
0 0
0 0
0 0
0 0
0 0
1 0
0 0
0 0
0 0
1
P 0
0 0
0 0
0 0
0 0
1 1
0 0
0 0
0 0
0 2
Mor
talit
y pe
r 100
,000
M
0.0
0.0
0.0
0.0
0.0
0.0
0.0
0.0
0.0
5.6
0.0
0.0
0.0
0.0
0.0
0.0
0.0
0.0
0.
4 0.
0 0.
3 0.
4
F 0.
0 0.
0 0.
0 0.
0 0.
0 0.
0 0.
0 0.
0 0.
0 0.
0 5.
8 0.
0 0.
0 0.
0 0.
0 0.
0 0.
0 0.
0
0.4
0.0
0.3
0.4
P
0.0
0.0
0.0
0.0
0.0
0.0
0.0
0.0
0.0
2.8
2.9
0.0
0.0
0.0
0.0
0.0
0.0
0.0
0.
4 0.
0 0.
3 0.
4
C12
, C13
. H
ypop
hary
nx
Cas
es
M
0
0 0
0 0
0 0
0 0
0 1
1 0
0 0
0 0
0 2
F
0 0
0 0
0 0
0 0
0 0
0 0
0 0
0 0
0 0
0
P 0
0 0
0 0
0 0
0 0
0 1
1 0
0 0
0 0
0 2
Inci
denc
e pe
r 100
,000
M
0.0
0.0
0.0
0.0
0.0
0.0
0.0
0.0
0.0
0.0
6.0
6.2
0.0
0.0
0.0
0.0
0.0
0.0
0.
8 0.
1 0.
5 0.
7
F 0.
0 0.
0 0.
0 0.
0 0.
0 0.
0 0.
0 0.
0 0.
0 0.
0 0.
0 0.
0 0.
0 0.
0 0.
0 0.
0 0.
0 0.
0
0.0
0.0
0.0
0.0
P
0.0
0.0
0.0
0.0
0.0
0.0
0.0
0.0
0.0
0.0
2.9
3.1
0.0
0.0
0.0
0.0
0.0
0.0
0.
4 0.
0 0.
3 0.
4 D
eath
s
M
0 0
0 0
0 0
0 0
0 0
0 0
1 0
0 0
0 0
1
F 0
0 0
0 0
0 0
0 0
0 0
0 0
0 0
0 0
0 0
P
0 0
0 0
0 0
0 0
0 0
0 0
1 0
0 0
0 0
1
M
orta
lity
per 1
00,0
00
M
0.
0 0.
0 0.
0 0.
0 0.
0 0.
0 0.
0 0.
0 0.
0 0.
0 0.
0 0.
0 7.
9 0.
0 0.
0 0.
0 0.
0 0.
0
0.4
0.0
0.3
0.3
F
0.0
0.0
0.0
0.0
0.0
0.0
0.0
0.0
0.0
0.0
0.0
0.0
0.0
0.0
0.0
0.0
0.0
0.0
0.
0 0.
0 0.
0 0.
0
P 0.
0 0.
0 0.
0 0.
0 0.
0 0.
0 0.
0 0.
0 0.
0 0.
0 0.
0 0.
0 4.
0 0.
0 0.
0 0.
0 0.
0 0.
0
0.2
0.0
0.2
0.2
Can
cer I
ncid
ence
and
Mor
talit
y in
Tas
man
ia 2
005
by a
ge, s
ex a
nd s
ite
24 |
Tas
man
ian
Can
cer R
egis
try
0-
4 5-
9 10
-14
15-1
9 20
-24
25-2
9 30
-34
35-3
9 40
-44
45-4
9 50
-54
55-5
9 60
-64
65-6
9 70
-74
75-7
9 80
-84
85+
Tota
l C
rude
R
ate
Cum
ul
Rat
e AS
Rat
es
W
AU
S
(196
0) (
2001
)
C09
- C
13.
Phar
ynx
Cas
es
M
0
0 0
0 0
0 0
0 1
2 2
3 1
2 1
1 1
0 14
F 0
0 0
0 0
0 0
0 0
0 0
1 0
0 1
0 2
0 4
P
0 0
0 0
0 0
0 0
1 2
2 4
1 2
2 1
3 0
18
Inci
denc
e pe
r 100
,000
M
0.0
0.0
0.0
0.0
0.0
0.0
0.0
0.0
5.6
11.1
11
.9
18.7
7.
9 19
.3
12.5
15
.2
23.9
0.
0
5.8
0.4
3.8
5.2
F
0.0
0.0
0.0
0.0
0.0
0.0
0.0
0.0
0.0
0.0
0.0
6.2
0.0
0.0
11.6
0.
0 31
.7
0.0
1.
6 0.
1 0.
6 1.
2
P 0.
0 0.
0 0.
0 0.
0 0.
0 0.
0 0.
0 0.
0 2.
8 5.
5 5.
9 12
.4
4.0
9.6
12.0
7.
0 28
.6
0.0
3.
7 0.
3 2.
2 3.
2 D
eath
s
M
0 0
0 0
0 0
0 0
0 1
0 1
1 1
0 1
0 0
5
F 0
0 0
0 0
0 0
0 0
0 1
0 0
0 0
0 0
0 1
P
0 0
0 0
0 0
0 0
0 1
1 1
1 1
0 1
0 0
6
M
orta
lity
per 1
00,0
00
M
0.
0 0.
0 0.
0 0.
0 0.
0 0.
0 0.
0 0.
0 0.
0 5.
6 0.
0 6.
2 7.
9 9.
7 0.
0 15
.2
0.0
0.0
2.
1 0.
1 1.
3 1.
8
F 0.
0 0.
0 0.
0 0.
0 0.
0 0.
0 0.
0 0.
0 0.
0 0.
0 5.
8 0.
0 0.
0 0.
0 0.
0 0.
0 0.
0 0.
0
0.4
0.0
0.3
0.4
P
0.0
0.0
0.0
0.0
0.0
0.0
0.0
0.0
0.0
2.8
2.9
3.1
4.0
4.8
0.0
7.0
0.0
0.0
1.
2 0.
1 0.
8 1.
1
C14
. O
ther
ora
l C
ases
M
0 0
0 0
0 0
0 0
0 0
0 1
0 0
0 0
1 1
3
F 0
0 0
0 0
0 0
0 0
0 0
0 0
0 0
0 0
0 0
P
0 0
0 0
0 0
0 0
0 0
0 1
0 0
0 0
1 1
3
In
cide
nce
per 1
00,0
00
M
0.
0 0.
0 0.
0 0.
0 0.
0 0.
0 0.
0 0.
0 0.
0 0.
0 0.
0 6.
2 0.
0 0.
0 0.
0 0.
0 23
.9
40.3
1.3
0.0
0.6
1.3
F
0.0
0.0
0.0
0.0
0.0
0.0
0.0
0.0
0.0
0.0
0.0
0.0
0.0
0.0
0.0
0.0
0.0
0.0
0.
0 0.
0 0.
0 0.
0
P 0.
0 0.
0 0.
0 0.
0 0.
0 0.
0 0.
0 0.
0 0.
0 0.
0 0.
0 3.
1 0.
0 0.
0 0.
0 0.
0 9.
5 12
.3
0.
6 0.
0 0.
2 0.
5 D
eath
s
M
0 0
0 0
0 0
0 0
0 0
0 0
0 1
0 0
0 0
1
F 0
0 0
0 0
0 0
0 0
0 0
0 0
0 0
0 0
0 0
P
0 0
0 0
0 0
0 0
0 0
0 0
0 1
0 0
0 0
1
M
orta
lity
per 1
00,0
00
M
0.
0 0.
0 0.
0 0.
0 0.
0 0.
0 0.
0 0.
0 0.
0 0.
0 0.
0 0.
0 0.
0 9.
7 0.
0 0.
0 0.
0 0.
0
0.4
0.0
0.3
0.3
F
0.0
0.0
0.0
0.0
0.0
0.0
0.0
0.0
0.0
0.0
0.0
0.0
0.0
0.0
0.0
0.0
0.0
0.0
0.
0 0.
0 0.
0 0.
0
P 0.
0 0.
0 0.
0 0.
0 0.
0 0.
0 0.
0 0.
0 0.
0 0.
0 0.
0 0.
0 0.
0 4.
8 0.
0 0.
0 0.
0 0.
0
0.2
0.0
0.1
0.2
Can
cer I
ncid
ence
and
Mor
talit
y in
Tas
man
ia 2
005
by a
ge, s
ex a
nd s
ite
Tasm
ania
n C
ance
r Reg
istry
| 2
5
0-
4 5-
9 10
-14
15-1
9 20
-24
25-2
9 30
-34
35-3
9 40
-44
45-4
9 50
-54
55-5
9 60
-64
65-6
9 70
-74
75-7
9 80
-84
85+
Tota
l C
rude
R
ate
Cum
ul
Rat
e AS
Rat
es
W
AU
S
(196
0) (
2001
)
C01
-C14
,C30
-C32
. H
ead
and
neck
C
ases
M
0 0
0 0
0 0
0 0
5 4
10
11
6 4
5 3
5 2
55
F
0 0
0 0
0 0
0 0
0 1
0 4
6 3
5 1
4 0
24
P
0 0
0 0
0 0
0 0
5 5
10
15
12
7 10
4
9 2
79
Inci
denc
e pe
r 100
,000
M
0.0
0.0
0.0
0.0
0.0
0.0
0.0
0.0
28.1
22
.2
59.6
68
.5
47.2
38
.7
62.3
45
.5
119.
7 80
.6
23
.0
1.6
14.5
21
.0
F
0.0
0.0
0.0
0.0
0.0
0.0
0.0
0.0
0.0
5.5
0.0
24.7
47
.9
28.6
57
.8
13.0
63
.5
0.0
9.
8 0.
8 5.
7 8.
0
P 0.
0 0.
0 0.
0 0.
0 0.
0 0.
0 0.
0 0.
0 13
.8
13.8
29
.5
46.5
47
.5
33.6
59
.9
27.9
85
.9
24.6
16.3
1.
2 9.
9 14
.1
Dea
ths
M
0
0 0
0 0
0 0
1 0
2 1
3 3
6 1
2 0
2 21
F 0
0 0
0 0
0 0
0 0
0 1
1 0
0 1
0 0
0 3
P
0 0
0 0
0 0
0 1
0 2
2 4
3 6
2 2
0 2
24
Mor
talit
y pe
r 100
,000
M
0.0
0.0
0.0
0.0
0.0
0.0
0.0
6.4
0.0
11.1
6.
0 18
.7
23.6
58
.0
12.5
30
.3
0.0
80.6
8.8
0.7
5.7
8.0
F
0.0
0.0
0.0
0.0
0.0
0.0
0.0
0.0
0.0
0.0
5.8
6.2
0.0
0.0
11.6
0.
0 0.
0 0.
0
1.2
0.1
0.8
1.1
P
0.0
0.0
0.0
0.0
0.0
0.0
0.0
3.1
0.0
5.5
5.9
12.4
11
.9
28.8
12
.0
14.0
0.
0 24
.6
4.
9 0.
4 3.
1 4.
3
C15
. O
esop
hagu
s C
ases
M
0 0
0 0
0 0
1 0
0 1
1 3
5 4
2 4
5 3
29
F
0 0
0 0
0 0
0 0
0 0
1 0
2 2
1 2
2 1
11
P
0 0
0 0
0 0
1 0
0 1
2 3
7 6
3 6
7 4
40
Inci
denc
e pe
r 100
,000
M
0.0
0.0
0.0
0.0
0.0
0.0
6.9
0.0
0.0
5.6
6.0
18.7
39
.3
38.7
24
.9
60.6
11
9.7
120.
9
12.1
0.
7 6.
8 11
.4
F
0.0
0.0
0.0
0.0
0.0
0.0
0.0
0.0
0.0
0.0
5.8
0.0
16.0
19
.1
11.6
25
.9
31.7
17
.8
4.
5 0.
3 2.
2 3.
6
P 0.
0 0.
0 0.
0 0.
0 0.
0 0.
0 3.
3 0.
0 0.
0 2.
8 5.
9 9.
3 27
.7
28.8
18
.0
41.9
66
.8
49.3
8.2
0.5
4.4
7.0
Dea
ths
M
0
0 0
0 0
0 0
0 0
2 1
1 2
3 3
1 3
2 18
F 0
0 0
0 0
0 0
0 0
0 0
0 1
1 2
2 3
4 13
P 0
0 0
0 0
0 0
0 0
2 1
1 3
4 5
3 6
6 31
M
orta
lity
per 1
00,0
00
M
0.
0 0.
0 0.
0 0.
0 0.
0 0.
0 0.
0 0.
0 0.
0 11
.1
6.0
6.2
15.7
29
.0
37.4
15
.2
71.8
80
.6
7.
5 0.
5 4.
4 7.
1
F 0.
0 0.
0 0.
0 0.
0 0.
0 0.
0 0.
0 0.
0 0.
0 0.
0 0.
0 0.
0 8.
0 9.
5 23
.1
25.9
47
.6
71.0
5.3
0.2
1.9
3.9
P
0.0
0.0
0.0
0.0
0.0
0.0
0.0
0.0
0.0
5.5
2.9
3.1
11.9
19
.2
30.0
21
.0
57.3
73
.9
6.
4 0.
4 3.
1 5.
5

Can
cer I
ncid
ence
and
Mor
talit
y in
Tas
man
ia 2
005
by a
ge, s
ex a
nd s
ite
26 |
Tas
man
ian
Can
cer R
egis
try
0-
4 5-
9 10
-14
15-1
9 20
-24
25-2
9 30
-34
35-3
9 40
-44
45-4
9 50
-54
55-5
9 60
-64
65-6
9 70
-74
75-7
9 80
-84
85+
Tota
l C
rude
R
ate
Cum
ul
Rat
e AS
Rat
es
W
AU
S
(196
0) (
2001
)
C16
. St
omac
h C
ases
M
0 0
0 0
0 0
0 0
3 0
3 2
8 6
7 6
6 2
43
F
0 0
0 0
0 0
0 0
0 1
1 2
0 2
2 3
2 5
18
P
0 0
0 0
0 0
0 0
3 1
4 4
8 8
9 9
8 7
61
Inci
denc
e pe
r 100
,000
M
0.0
0.0
0.0
0.0
0.0
0.0
0.0
0.0
16.9
0.
0 17
.9
12.4
62
.9
58.0
87
.2
91.0
14
3.6
80.6
18.0
1.
3 10
.4
16.7
F 0.
0 0.
0 0.
0 0.
0 0.
0 0.
0 0.
0 0.
0 0.
0 5.
5 5.
8 12
.3
0.0
19.1
23
.1
38.9
31
.7
88.8
7.3
0.3
3.1
5.6
P
0.0
0.0
0.0
0.0
0.0
0.0
0.0
0.0
8.3
2.8
11.8
12
.4
31.7
38
.4
54.0
62
.9
76.3
86
.3
12
.6
0.8
6.7
10.9
D
eath
s
M
0 0
0 0
0 0
0 0
0 0
1 2
4 3
4 6
3 0
23
F
0 0
0 0
0 0
0 0
0 0
0 1
3 0
2 4
3 2
15
P
0 0
0 0
0 0
0 0
0 0
1 3
7 3
6 10
6
2 38
M
orta
lity
per 1
00,0
00
M
0.
0 0.
0 0.
0 0.
0 0.
0 0.
0 0.
0 0.
0 0.
0 0.
0 6.
0 12
.4
31.4
29
.0
49.8
91
.0
71.8
0.
0
9.6
0.6
5.2
8.7
F
0.0
0.0
0.0
0.0
0.0
0.0
0.0
0.0
0.0
0.0
0.0
6.2
24.0
0.
0 23
.1
51.8
47
.6
35.5
6.1
0.3
2.6
4.8
P
0.0
0.0
0.0
0.0
0.0
0.0
0.0
0.0
0.0
0.0
2.9
9.3
27.7
14
.4
36.0
69
.9
57.3
24
.6
7.
8 0.
5 3.
9 6.
7
C17
. Sm
all i
ntes
tine
Cas
es
M
0
0 0
0 0
0 0
0 0
1 0
0 1
0 0
0 0
0 2
F
0 0
0 0
0 0
0 0
0 0
0 2
1 1
1 0
0 1
6
P 0
0 0
0 0
0 0
0 0
1 0
2 2
1 1
0 0
1 8
Inci
denc
e pe
r 100
,000
M
0.0
0.0
0.0
0.0
0.0
0.0
0.0
0.0
0.0
5.6
0.0
0.0
7.9
0.0
0.0
0.0
0.0
0.0
0.
8 0.
1 0.
6 0.
7
F 0.
0 0.
0 0.
0 0.
0 0.
0 0.
0 0.
0 0.
0 0.
0 0.
0 0.
0 12
.3
8.0
9.5
11.6
0.
0 0.
0 17
.8
2.
4 0.
2 1.
4 1.
9
P 0.
0 0.
0 0.
0 0.
0 0.
0 0.
0 0.
0 0.
0 0.
0 2.
8 0.
0 6.
2 7.
9 4.
8 6.
0 0.
0 0.
0 12
.3
1.
6 0.
1 1.
1 1.
4 D
eath
s
M
0 0
0 0
0 0
0 0
0 0
0 0
0 1
0 0
1 0
2
F 0
0 0
0 0
0 0
0 0
0 0
0 0
0 0
1 0
1 2
P
0 0
0 0
0 0
0 0
0 0
0 0
0 1
0 1
1 1
4
M
orta
lity
per 1
00,0
00
M
0.
0 0.
0 0.
0 0.
0 0.
0 0.
0 0.
0 0.
0 0.
0 0.
0 0.
0 0.
0 0.
0 9.
7 0.
0 0.
0 23
.9
0.0
0.
8 0.
0 0.
4 0.
7
F 0.
0 0.
0 0.
0 0.
0 0.
0 0.
0 0.
0 0.
0 0.
0 0.
0 0.
0 0.
0 0.
0 0.
0 0.
0 13
.0
0.0
17.8
0.8
0.0
0.2
0.6
P
0.0
0.0
0.0
0.0
0.0
0.0
0.0
0.0
0.0
0.0
0.0
0.0
0.0
4.8
0.0
7.0
9.5
12.3
0.8
0.0
0.3
0.7
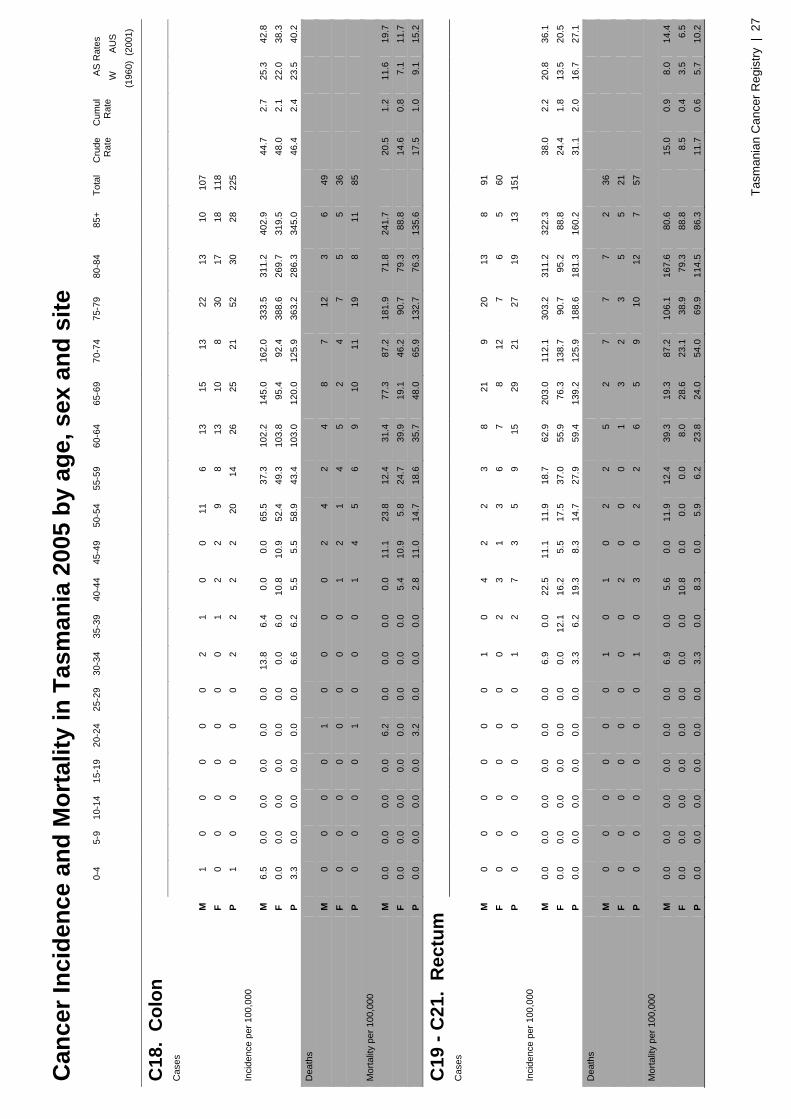
Can
cer I
ncid
ence
and
Mor
talit
y in
Tas
man
ia 2
005
by a
ge, s
ex a
nd s
ite
Tasm
ania
n C
ance
r Reg
istry
| 2
7
0-
4 5-
9 10
-14
15-1
9 20
-24
25-2
9 30
-34
35-3
9 40
-44
45-4
9 50
-54
55-5
9 60
-64
65-6
9 70
-74
75-7
9 80
-84
85+
Tota
l C
rude
R
ate
Cum
ul
Rat
e AS
Rat
es
W
AU
S
(196
0) (
2001
)
C18
. C
olon
C
ases
M
1 0
0 0
0 0
2 1
0 0
11
6 13
15
13
22
13
10
10
7
F 0
0 0
0 0
0 0
1 2
2 9
8 13
10
8
30
17
18
118
P
1 0
0 0
0 0
2 2
2 2
20
14
26
25
21
52
30
28
225
Inci
denc
e pe
r 100
,000
M
6.5
0.0
0.0
0.0
0.0
0.0
13.8
6.
4 0.
0 0.
0 65
.5
37.3
10
2.2
145.
0 16
2.0
333.
5 31
1.2
402.
9
44.7
2.
7 25
.3
42.8
F 0.
0 0.
0 0.
0 0.
0 0.
0 0.
0 0.
0 6.
0 10
.8
10.9
52
.4
49.3
10
3.8
95.4
92
.4
388.
6 26
9.7
319.
5
48.0
2.
1 22
.0
38.3
P 3.
3 0.
0 0.
0 0.
0 0.
0 0.
0 6.
6 6.
2 5.
5 5.
5 58
.9
43.4
10
3.0
120.
0 12
5.9
363.
2 28
6.3
345.
0
46.4
2.
4 23
.5
40.2
D
eath
s
M
0 0
0 0
1 0
0 0
0 2
4 2
4 8
7 12
3
6 49
F 0
0 0
0 0
0 0
0 1
2 1
4 5
2 4
7 5
5 36
P 0
0 0
0 1
0 0
0 1
4 5
6 9
10
11
19
8 11
85
M
orta
lity
per 1
00,0
00
M
0.
0 0.
0 0.
0 0.
0 6.
2 0.
0 0.
0 0.
0 0.
0 11
.1
23.8
12
.4
31.4
77
.3
87.2
18
1.9
71.8
24
1.7
20
.5
1.2
11.6
19
.7
F
0.0
0.0
0.0
0.0
0.0
0.0
0.0
0.0
5.4
10.9
5.
8 24
.7
39.9
19
.1
46.2
90
.7
79.3
88
.8
14
.6
0.8
7.1
11.7
P 0.
0 0.
0 0.
0 0.
0 3.
2 0.
0 0.
0 0.
0 2.
8 11
.0
14.7
18
.6
35.7
48
.0
65.9
13
2.7
76.3
13
5.6
17
.5
1.0
9.1
15.2
C19
- C
21.
Rec
tum
C
ases
M
0 0
0 0
0 0
1 0
4 2
2 3
8 21
9
20
13
8 91
F 0
0 0
0 0
0 0
2 3
1 3
6 7
8 12
7
6 5
60
P
0 0
0 0
0 0
1 2
7 3
5 9
15
29
21
27
19
13
151
Inci
denc
e pe
r 100
,000
M
0.0
0.0
0.0
0.0
0.0
0.0
6.9
0.0
22.5
11
.1
11.9
18
.7
62.9
20
3.0
112.
1 30
3.2
311.
2 32
2.3
38
.0
2.2
20.8
36
.1
F
0.0
0.0
0.0
0.0
0.0
0.0
0.0
12.1
16
.2
5.5
17.5
37
.0
55.9
76
.3
138.
7 90
.7
95.2
88
.8
24
.4
1.8
13.5
20
.5
P
0.0
0.0
0.0
0.0
0.0
0.0
3.3
6.2
19.3
8.
3 14
.7
27.9
59
.4
139.
2 12
5.9
188.
6 18
1.3
160.
2
31.1
2.
0 16
.7
27.1
D
eath
s
M
0 0
0 0
0 0
1 0
1 0
2 2
5 2
7 7
7 2
36
F
0 0
0 0
0 0
0 0
2 0
0 0
1 3
2 3
5 5
21
P
0 0
0 0
0 0
1 0
3 0
2 2
6 5
9 10
12
7
57
Mor
talit
y pe
r 100
,000
M
0.0
0.0
0.0
0.0
0.0
0.0
6.9
0.0
5.6
0.0
11.9
12
.4
39.3
19
.3
87.2
10
6.1
167.
6 80
.6
15
.0
0.9
8.0
14.4
F 0.
0 0.
0 0.
0 0.
0 0.
0 0.
0 0.
0 0.
0 10
.8
0.0
0.0
0.0
8.0
28.6
23
.1
38.9
79
.3
88.8
8.5
0.4
3.5
6.5
P
0.0
0.0
0.0
0.0
0.0
0.0
3.3
0.0
8.3
0.0
5.9
6.2
23.8
24
.0
54.0
69
.9
114.
5 86
.3
11
.7
0.6
5.7
10.2

Can
cer I
ncid
ence
and
Mor
talit
y in
Tas
man
ia 2
005
by a
ge, s
ex a
nd s
ite
28 |
Tas
man
ian
Can
cer R
egis
try
0-
4 5-
9 10
-14
15-1
9 20
-24
25-2
9 30
-34
35-3
9 40
-44
45-4
9 50
-54
55-5
9 60
-64
65-6
9 70
-74
75-7
9 80
-84
85+
Tota
l C
rude
R
ate
Cum
ul
Rat
e AS
Rat
es
W
AU
S
(196
0) (
2001
)
C18
- C
21.
Col
orec
tal
Cas
es
M
1
0 0
0 0
0 3
1 4
2 13
9
21
36
22
42
26
18
198
F
0 0
0 0
0 0
0 3
5 3
12
14
20
18
20
37
23
23
178
P
1 0
0 0
0 0
3 4
9 5
25
23
41
54
42
79
49
41
376
Inci
denc
e pe
r 100
,000
M
6.5
0.0
0.0
0.0
0.0
0.0
20.7
6.
4 22
.5
11.1
77
.5
56.0
16
5.1
347.
9 27
4.1
636.
7 62
2.5
725.
2
82.7
4.
9 46
.2
78.8
F 0.
0 0.
0 0.
0 0.
0 0.
0 0.
0 0.
0 18
.1
27.0
16
.4
69.9
86
.3
159.
8 17
1.7
231.
1 47
9.3
364.
9 40
8.3
72
.4
3.9
35.5
58
.8
P
3.3
0.0
0.0
0.0
0.0
0.0
9.9
12.4
24
.8
13.8
73
.6
71.2
16
2.4
259.
2 25
1.8
551.
8 46
7.6
505.
2
77.5
4.
4 40
.3
67.3
D
eath
s
M
0 0
0 0
1 0
1 0
1 2
6 4
9 10
14
19
10
8
85
F
0 0
0 0
0 0
0 0
3 2
1 4
6 5
6 10
10
10
57
P 0
0 0
0 1
0 1
0 4
4 7
8 15
15
20
29
20
18
14
2
M
orta
lity
per 1
00,0
00
M
0.
0 0.
0 0.
0 0.
0 6.
2 0.
0 6.
9 0.
0 5.
6 11
.1
35.8
24
.9
70.7
96
.6
174.
4 28
8.1
239.
4 32
2.3
35
.5
2.2
19.6
34
.1
F
0.0
0.0
0.0
0.0
0.0
0.0
0.0
0.0
16.2
10
.9
5.8
24.7
47
.9
47.7
69
.3
129.
5 15
8.7
177.
5
23.2
1.
1 10
.6
18.2
P 0.
0 0.
0 0.
0 0.
0 3.
2 0.
0 3.
3 0.
0 11
.0
11.0
20
.6
24.8
59
.4
72.0
11
9.9
202.
6 19
0.8
221.
8
29.3
1.
6 14
.8
25.4
C22
. Li
ver
Cas
es
M
0
0 0
0 0
0 0
0 0
2 1
0 1
2 1
1 2
0 10
F 0
0 0
0 0
0 0
0 0
0 1
0 1
0 1
3 2
4 12
P 0
0 0
0 0
0 0
0 0
2 2
0 2
2 2
4 4
4 22
In
cide
nce
per 1
00,0
00
M
0.
0 0.
0 0.
0 0.
0 0.
0 0.
0 0.
0 0.
0 0.
0 11
.1
6.0
0.0
7.9
19.3
12
.5
15.2
47
.9
0.0
4.
2 0.
3 2.
5 3.
8
F 0.
0 0.
0 0.
0 0.
0 0.
0 0.
0 0.
0 0.
0 0.
0 0.
0 5.
8 0.
0 8.
0 0.
0 11
.6
38.9
31
.7
71.0
4.9
0.1
1.7
3.7
P
0.0
0.0
0.0
0.0
0.0
0.0
0.0
0.0
0.0
5.5
5.9
0.0
7.9
9.6
12.0
27
.9
38.2
49
.3
4.
5 0.
2 2.
2 3.
9 D
eath
s
M
0 0
0 0
0 0
0 0
0 0
2 0
0 2
1 2
1 1
9
F 0
0 0
0 0
0 0
0 0
0 1
0 0
1 1
3 2
4 12
P 0
0 0
0 0
0 0
0 0
0 3
0 0
3 2
5 3
5 21
M
orta
lity
per 1
00,0
00
M
0.
0 0.
0 0.
0 0.
0 0.
0 0.
0 0.
0 0.
0 0.
0 0.
0 11
.9
0.0
0.0
19.3
12
.5
30.3
23
.9
40.3
3.8
0.2
2.0
3.7
F
0.0
0.0
0.0
0.0
0.0
0.0
0.0
0.0
0.0
0.0
5.8
0.0
0.0
9.5
11.6
38
.9
31.7
71
.0
4.
9 0.
1 1.
7 3.
7
P 0.
0 0.
0 0.
0 0.
0 0.
0 0.
0 0.
0 0.
0 0.
0 0.
0 8.
8 0.
0 0.
0 14
.4
12.0
34
.9
28.6
61
.6
4.
3 0.
2 1.
9 3.
8
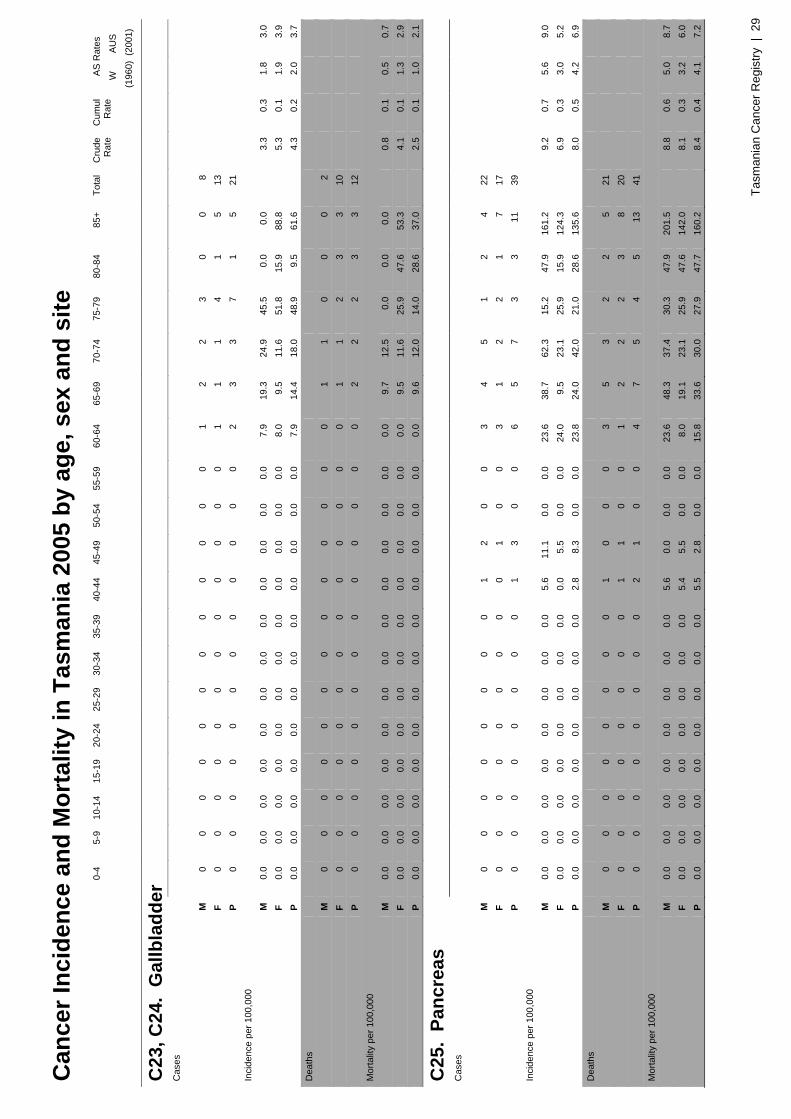
Can
cer I
ncid
ence
and
Mor
talit
y in
Tas
man
ia 2
005
by a
ge, s
ex a
nd s
ite
Tasm
ania
n C
ance
r Reg
istry
| 2
9
0-
4 5-
9 10
-14
15-1
9 20
-24
25-2
9 30
-34
35-3
9 40
-44
45-4
9 50
-54
55-5
9 60
-64
65-6
9 70
-74
75-7
9 80
-84
85+
Tota
l C
rude
R
ate
Cum
ul
Rat
e AS
Rat
es
W
AU
S
(196
0) (
2001
)
C23
, C24
. G
allb
ladd
er
Cas
es
M
0
0 0
0 0
0 0
0 0
0 0
0 1
2 2
3 0
0 8
F
0 0
0 0
0 0
0 0
0 0
0 0
1 1
1 4
1 5
13
P
0 0
0 0
0 0
0 0
0 0
0 0
2 3
3 7
1 5
21
Inci
denc
e pe
r 100
,000
M
0.0
0.0
0.0
0.0
0.0
0.0
0.0
0.0
0.0
0.0
0.0
0.0
7.9
19.3
24
.9
45.5
0.
0 0.
0
3.3
0.3
1.8
3.0
F
0.0
0.0
0.0
0.0
0.0
0.0
0.0
0.0
0.0
0.0
0.0
0.0
8.0
9.5
11.6
51
.8
15.9
88
.8
5.
3 0.
1 1.
9 3.
9
P 0.
0 0.
0 0.
0 0.
0 0.
0 0.
0 0.
0 0.
0 0.
0 0.
0 0.
0 0.
0 7.
9 14
.4
18.0
48
.9
9.5
61.6
4.3
0.2
2.0
3.7
Dea
ths
M
0
0 0
0 0
0 0
0 0
0 0
0 0
1 1
0 0
0 2
F
0 0
0 0
0 0
0 0
0 0
0 0
0 1
1 2
3 3
10
P
0 0
0 0
0 0
0 0
0 0
0 0
0 2
2 2
3 3
12
Mor
talit
y pe
r 100
,000
M
0.0
0.0
0.0
0.0
0.0
0.0
0.0
0.0
0.0
0.0
0.0
0.0
0.0
9.7
12.5
0.
0 0.
0 0.
0
0.8
0.1
0.5
0.7
F
0.0
0.0
0.0
0.0
0.0
0.0
0.0
0.0
0.0
0.0
0.0
0.0
0.0
9.5
11.6
25
.9
47.6
53
.3
4.
1 0.
1 1.
3 2.
9
P 0.
0 0.
0 0.
0 0.
0 0.
0 0.
0 0.
0 0.
0 0.
0 0.
0 0.
0 0.
0 0.
0 9.
6 12
.0
14.0
28
.6
37.0
2.5
0.1
1.0
2.1
C25
. Pa
ncre
as
Cas
es
M
0
0 0
0 0
0 0
0 1
2 0
0 3
4 5
1 2
4 22
F 0
0 0
0 0
0 0
0 0
1 0
0 3
1 2
2 1
7 17
P 0
0 0
0 0
0 0
0 1
3 0
0 6
5 7
3 3
11
39
Inci
denc
e pe
r 100
,000
M
0.0
0.0
0.0
0.0
0.0
0.0
0.0
0.0
5.6
11.1
0.
0 0.
0 23
.6
38.7
62
.3
15.2
47
.9
161.
2
9.2
0.7
5.6
9.0
F
0.0
0.0
0.0
0.0
0.0
0.0
0.0
0.0
0.0
5.5
0.0
0.0
24.0
9.
5 23
.1
25.9
15
.9
124.
3
6.9
0.3
3.0
5.2
P
0.0
0.0
0.0
0.0
0.0
0.0
0.0
0.0
2.8
8.3
0.0
0.0
23.8
24
.0
42.0
21
.0
28.6
13
5.6
8.
0 0.
5 4.
2 6.
9 D
eath
s
M
0 0
0 0
0 0
0 0
1 0
0 0
3 5
3 2
2 5
21
F
0 0
0 0
0 0
0 0
1 1
0 0
1 2
2 2
3 8
20
P
0 0
0 0
0 0
0 0
2 1
0 0
4 7
5 4
5 13
41
M
orta
lity
per 1
00,0
00
M
0.
0 0.
0 0.
0 0.
0 0.
0 0.
0 0.
0 0.
0 5.
6 0.
0 0.
0 0.
0 23
.6
48.3
37
.4
30.3
47
.9
201.
5
8.8
0.6
5.0
8.7
F
0.0
0.0
0.0
0.0
0.0
0.0
0.0
0.0
5.4
5.5
0.0
0.0
8.0
19.1
23
.1
25.9
47
.6
142.
0
8.1
0.3
3.2
6.0
P
0.0
0.0
0.0
0.0
0.0
0.0
0.0
0.0
5.5
2.8
0.0
0.0
15.8
33
.6
30.0
27
.9
47.7
16
0.2
8.
4 0.
4 4.
1 7.
2

Can
cer I
ncid
ence
and
Mor
talit
y in
Tas
man
ia 2
005
by a
ge, s
ex a
nd s
ite
30 |
Tas
man
ian
Can
cer R
egis
try
0-
4 5-
9 10
-14
15-1
9 20
-24
25-2
9 30
-34
35-3
9 40
-44
45-4
9 50
-54
55-5
9 60
-64
65-6
9 70
-74
75-7
9 80
-84
85+
Tota
l C
rude
R
ate
Cum
ul
Rat
e AS
Rat
es
W
AU
S
(196
0) (
2001
)
C30
, C31
. N
asal
cav
ities
C
ases
M
0 0
0 0
0 0
0 0
0 0
2 0
1 1
1 1
1 0
7
F 0
0 0
0 0
0 0
0 0
0 0
1 0
0 1
0 0
0 2
P
0 0
0 0
0 0
0 0
0 0
2 1
1 1
2 1
1 0
9
In
cide
nce
per 1
00,0
00
M
0.
0 0.
0 0.
0 0.
0 0.
0 0.
0 0.
0 0.
0 0.
0 0.
0 11
.9
0.0
7.9
9.7
12.5
15
.2
23.9
0.
0
2.9
0.2
1.7
2.7
F
0.0
0.0
0.0
0.0
0.0
0.0
0.0
0.0
0.0
0.0
0.0
6.2
0.0
0.0
11.6
0.
0 0.
0 0.
0
0.8
0.1
0.5
0.7
P
0.0
0.0
0.0
0.0
0.0
0.0
0.0
0.0
0.0
0.0
5.9
3.1
4.0
4.8
12.0
7.
0 9.
5 0.
0
1.9
0.1
1.1
1.6
Dea
ths
M
0
0 0
0 0
0 0
0 0
0 0
1 1
1 0
0 0
1 4
F
0 0
0 0
0 0
0 0
0 0
0 0
0 0
0 0
0 0
0
P 0
0 0
0 0
0 0
0 0
0 0
1 1
1 0
0 0
1 4
Mor
talit
y pe
r 100
,000
M
0.0
0.0
0.0
0.0
0.0
0.0
0.0
0.0
0.0
0.0
0.0
6.2
7.9
9.7
0.0
0.0
0.0
40.3
1.7
0.1
1.1
1.5
F
0.0
0.0
0.0
0.0
0.0
0.0
0.0
0.0
0.0
0.0
0.0
0.0
0.0
0.0
0.0
0.0
0.0
0.0
0.
0 0.
0 0.
0 0.
0
P 0.
0 0.
0 0.
0 0.
0 0.
0 0.
0 0.
0 0.
0 0.
0 0.
0 0.
0 3.
1 4.
0 4.
8 0.
0 0.
0 0.
0 12
.3
0.
8 0.
1 0.
5 0.
7
C32
. La
rynx
C
ases
M
0 0
0 0
0 0
0 0
1 0
4 4
2 1
0 0
1 0
13
F
0 0
0 0
0 0
0 0
0 0
0 1
1 1
1 0
0 0
4
P 0
0 0
0 0
0 0
0 1
0 4
5 3
2 1
0 1
0 17
In
cide
nce
per 1
00,0
00
M
0.
0 0.
0 0.
0 0.
0 0.
0 0.
0 0.
0 0.
0 5.
6 0.
0 23
.8
24.9
15
.7
9.7
0.0
0.0
23.9
0.
0
5.4
0.4
3.6
4.7
F
0.0
0.0
0.0
0.0
0.0
0.0
0.0
0.0
0.0
0.0
0.0
6.2
8.0
9.5
11.6
0.
0 0.
0 0.
0
1.6
0.2
1.1
1.4
P
0.0
0.0
0.0
0.0
0.0
0.0
0.0
0.0
2.8
0.0
11.8
15
.5
11.9
9.
6 6.
0 0.
0 9.
5 0.
0
3.5
0.3
2.3
3.0
Dea
ths
M
0
0 0
0 0
0 0
0 0
0 0
1 0
1 0
0 0
1 3
F
0 0
0 0
0 0
0 0
0 0
0 0
0 0
1 0
0 0
1
P 0
0 0
0 0
0 0
0 0
0 0
1 0
1 1
0 0
1 4
Mor
talit
y pe
r 100
,000
M
0.0
0.0
0.0
0.0
0.0
0.0
0.0
0.0
0.0
0.0
0.0
6.2
0.0
9.7
0.0
0.0
0.0
40.3
1.3
0.1
0.7
1.2
F
0.0
0.0
0.0
0.0
0.0
0.0
0.0
0.0
0.0
0.0
0.0
0.0
0.0
0.0
11.6
0.
0 0.
0 0.
0
0.4
0.1
0.2
0.4
P
0.0
0.0
0.0
0.0
0.0
0.0
0.0
0.0
0.0
0.0
0.0
3.1
0.0
4.8
6.0
0.0
0.0
12.3
0.8
0.1
0.4
0.7

Can
cer I
ncid
ence
and
Mor
talit
y in
Tas
man
ia 2
005
by a
ge, s
ex a
nd s
ite
Tasm
ania
n C
ance
r Reg
istry
| 3
1
0-
4 5-
9 10
-14
15-1
9 20
-24
25-2
9 30
-34
35-3
9 40
-44
45-4
9 50
-54
55-5
9 60
-64
65-6
9 70
-74
75-7
9 80
-84
85+
Tota
l C
rude
R
ate
Cum
ul
Rat
e AS
Rat
es
W
AU
S
(196
0) (
2001
)
C33
, C34
. Lu
ng
Cas
es
M
0
0 0
0 0
0 0
1 1
2 3
12
18
29
34
26
21
11
158
F
0 0
0 0
0 0
0 1
3 3
9 11
12
17
14
19
12
8
109
P
0 0
0 0
0 0
0 2
4 5
12
23
30
46
48
45
33
19
267
Inci
denc
e pe
r 100
,000
M
0.0
0.0
0.0
0.0
0.0
0.0
0.0
6.4
5.6
11.1
17
.9
74.7
14
1.5
280.
3 42
3.6
394.
2 50
2.8
443.
2
66.0
4.
8 36
.5
61.7
F 0.
0 0.
0 0.
0 0.
0 0.
0 0.
0 0.
0 6.
0 16
.2
16.4
52
.4
67.8
95
.9
162.
1 16
1.8
246.
1 19
0.4
142.
0
44.3
2.
9 23
.7
36.7
P 0.
0 0.
0 0.
0 0.
0 0.
0 0.
0 0.
0 6.
2 11
.0
13.8
35
.3
71.2
11
8.9
220.
8 28
7.8
314.
3 31
4.9
234.
1
55.0
3.
8 29
.5
47.6
D
eath
s
M
0 0
0 0
0 0
0 0
0 1
6 12
14
26
28
31
22
11
15
1
F 0
0 0
0 0
0 0
0 0
0 5
8 10
15
10
23
13
6
90
P
0 0
0 0
0 0
0 0
0 1
11
20
24
41
38
54
35
17
241
Mor
talit
y pe
r 100
,000
M
0.0
0.0
0.0
0.0
0.0
0.0
0.0
0.0
0.0
5.6
35.8
74
.7
110.
1 25
1.3
348.
8 47
0.0
526.
7 44
3.2
63
.1
4.1
33.6
59
.2
F
0.0
0.0
0.0
0.0
0.0
0.0
0.0
0.0
0.0
0.0
29.1
49
.3
79.9
14
3.0
115.
6 29
7.9
206.
3 10
6.5
36
.6
2.1
17.8
29
.7
P
0.0
0.0
0.0
0.0
0.0
0.0
0.0
0.0
0.0
2.8
32.4
61
.9
95.1
19
6.8
227.
8 37
7.2
334.
0 20
9.5
49
.7
3.1
25.0
42
.6
C37
, C38
. Th
ymus
etc
C
ases
M
0 0
0 0
0 0
0 0
0 0
0 0
0 0
0 0
0 0
0
F 0
0 0
0 0
0 0
1 0
0 0
0 0
0 0
0 0
0 1
P
0 0
0 0
0 0
0 1
0 0
0 0
0 0
0 0
0 0
1
In
cide
nce
per 1
00,0
00
M
0.
0 0.
0 0.
0 0.
0 0.
0 0.
0 0.
0 0.
0 0.
0 0.
0 0.
0 0.
0 0.
0 0.
0 0.
0 0.
0 0.
0 0.
0
0.0
0.0
0.0
0.0
F
0.0
0.0
0.0
0.0
0.0
0.0
0.0
6.0
0.0
0.0
0.0
0.0
0.0
0.0
0.0
0.0
0.0
0.0
0.
4 0.
0 0.
4 0.
5
P 0.
0 0.
0 0.
0 0.
0 0.
0 0.
0 0.
0 3.
1 0.
0 0.
0 0.
0 0.
0 0.
0 0.
0 0.
0 0.
0 0.
0 0.
0
0.2
0.0
0.2
0.2
Dea
ths
M
0
0 0
0 0
0 0
0 0
0 0
0 0
0 0
0 0
0 0
F
0 0
0 0
0 0
0 0
0 1
0 0
0 0
0 0
0 0
1
P 0
0 0
0 0
0 0
0 0
1 0
0 0
0 0
0 0
0 1
Mor
talit
y pe
r 100
,000
M
0.0
0.0
0.0
0.0
0.0
0.0
0.0
0.0
0.0
0.0
0.0
0.0
0.0
0.0
0.0
0.0
0.0
0.0
0.
0 0.
0 0.
0 0.
0
F 0.
0 0.
0 0.
0 0.
0 0.
0 0.
0 0.
0 0.
0 0.
0 5.
5 0.
0 0.
0 0.
0 0.
0 0.
0 0.
0 0.
0 0.
0
0.4
0.0
0.3
0.4
P
0.0
0.0
0.0
0.0
0.0
0.0
0.0
0.0
0.0
2.8
0.0
0.0
0.0
0.0
0.0
0.0
0.0
0.0
0.
2 0.
0 0.
2 0.
2

Can
cer I
ncid
ence
and
Mor
talit
y in
Tas
man
ia 2
005
by a
ge, s
ex a
nd s
ite
32 |
Tas
man
ian
Can
cer R
egis
try
0-
4 5-
9 10
-14
15-1
9 20
-24
25-2
9 30
-34
35-3
9 40
-44
45-4
9 50
-54
55-5
9 60
-64
65-6
9 70
-74
75-7
9 80
-84
85+
Tota
l C
rude
R
ate
Cum
ul
Rat
e AS
Rat
es
W
AU
S
(196
0) (
2001
)
C40
, C41
. B
one
Cas
es
M
0
0 0
0 0
0 0
1 0
1 1
0 0
1 0
2 0
0 6
F
0 0
0 0
0 0
0 0
0 0
0 0
1 0
0 0
0 0
1
P 0
0 0
0 0
0 0
1 0
1 1
0 1
1 0
2 0
0 7
Inci
denc
e pe
r 100
,000
M
0.0
0.0
0.0
0.0
0.0
0.0
0.0
6.4
0.0
5.6
6.0
0.0
0.0
9.7
0.0
30.3
0.
0 0.
0
2.5
0.1
1.6
2.4
F
0.0
0.0
0.0
0.0
0.0
0.0
0.0
0.0
0.0
0.0
0.0
0.0
8.0
0.0
0.0
0.0
0.0
0.0
0.
4 0.
0 0.
3 0.
3
P 0.
0 0.
0 0.
0 0.
0 0.
0 0.
0 0.
0 3.
1 0.
0 2.
8 2.
9 0.
0 4.
0 4.
8 0.
0 14
.0
0.0
0.0
1.
4 0.
1 0.
9 1.
3 D
eath
s
M
0 0
0 0
0 0
0 0
0 0
0 0
0 0
1 0
0 0
1
F 0
0 0
0 0
0 0
0 0
0 0
0 1
0 1
0 0
0 2
P
0 0
0 0
0 0
0 0
0 0
0 0
1 0
2 0
0 0
3
M
orta
lity
per 1
00,0
00
M
0.
0 0.
0 0.
0 0.
0 0.
0 0.
0 0.
0 0.
0 0.
0 0.
0 0.
0 0.
0 0.
0 0.
0 12
.5
0.0
0.0
0.0
0.
4 0.
1 0.
2 0.
4
F 0.
0 0.
0 0.
0 0.
0 0.
0 0.
0 0.
0 0.
0 0.
0 0.
0 0.
0 0.
0 8.
0 0.
0 11
.6
0.0
0.0
0.0
0.
8 0.
1 0.
6 0.
7
P 0.
0 0.
0 0.
0 0.
0 0.
0 0.
0 0.
0 0.
0 0.
0 0.
0 0.
0 0.
0 4.
0 0.
0 12
.0
0.0
0.0
0.0
0.
6 0.
1 0.
4 0.
6
C43
. M
elan
oma
of s
kin
Cas
es
M
0
0 0
0 3
4 5
3 11
17
14
18
15
12
15
19
5
7 14
8
F 0
0 0
1 3
2 8
7 16
15
15
15
16
8
12
9 8
2 13
7
P 0
0 0
1 6
6 13
10
27
32
29
33
31
20
27
28
13
9
285
Inci
denc
e pe
r 100
,000
M
0.0
0.0
0.0
0.0
18.7
30
.1
34.4
19
.1
61.9
94
.5
83.4
11
2.0
117.
9 11
6.0
186.
9 28
8.1
119.
7 28
2.0
61
.8
4.4
42.0
59
.1
F
0.0
0.0
0.0
6.0
20.0
15
.0
50.6
42
.3
86.3
82
.1
87.4
92
.4
127.
8 76
.3
138.
7 11
6.6
126.
9 35
.5
55
.7
4.1
39.2
51
.3
P
0.0
0.0
0.0
2.9
19.4
22
.5
42.8
31
.0
74.4
88
.2
85.4
10
2.2
122.
8 96
.0
161.
9 19
5.6
124.
0 11
0.9
58
.7
4.2
40.3
54
.4
Dea
ths
M
0
0 0
0 0
0 0
0 0
0 5
2 3
4 6
3 3
2 28
F 0
0 0
0 0
0 0
0 0
2 0
0 0
0 4
2 0
1 9
P
0 0
0 0
0 0
0 0
0 2
5 2
3 4
10
5 3
3 37
M
orta
lity
per 1
00,0
00
M
0.
0 0.
0 0.
0 0.
0 0.
0 0.
0 0.
0 0.
0 0.
0 0.
0 29
.8
12.4
23
.6
38.7
74
.7
45.5
71
.8
80.6
11.7
0.
9 6.
8 11
.0
F
0.0
0.0
0.0
0.0
0.0
0.0
0.0
0.0
0.0
10.9
0.
0 0.
0 0.
0 0.
0 46
.2
25.9
0.
0 17
.8
3.
7 0.
3 1.
9 3.
2
P 0.
0 0.
0 0.
0 0.
0 0.
0 0.
0 0.
0 0.
0 0.
0 5.
5 14
.7
6.2
11.9
19
.2
59.9
34
.9
28.6
37
.0
7.
6 0.
6 4.
2 6.
8
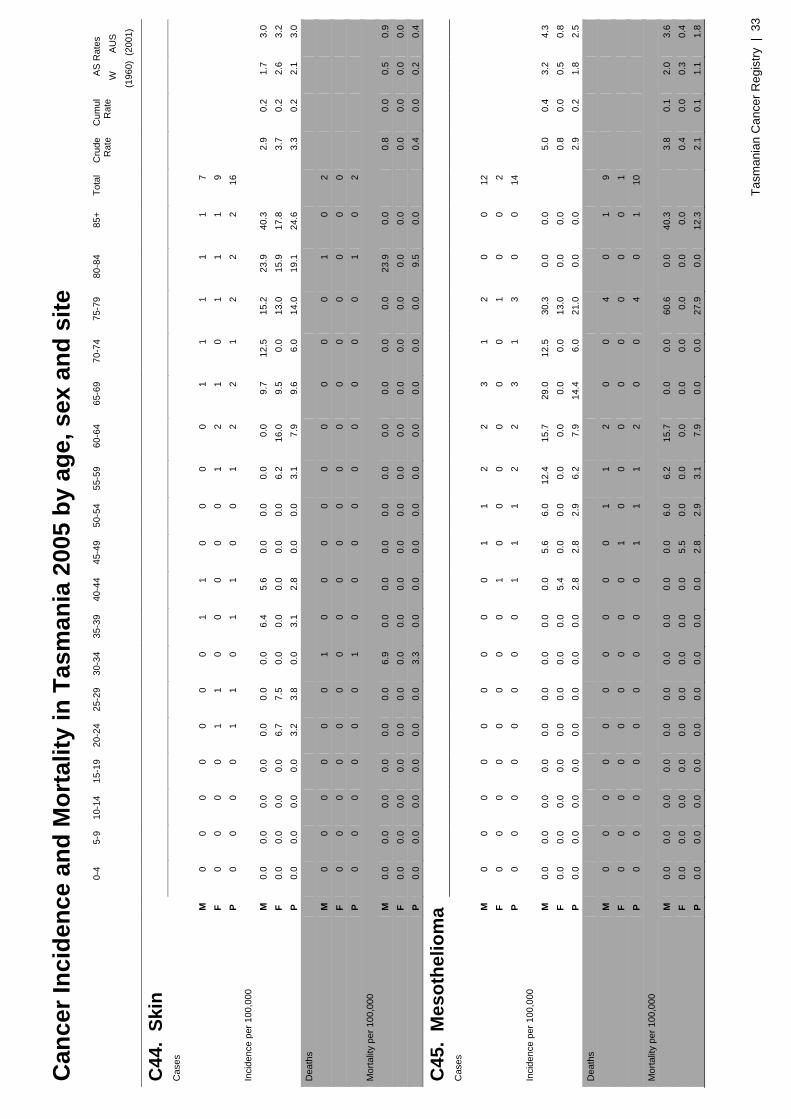
Can
cer I
ncid
ence
and
Mor
talit
y in
Tas
man
ia 2
005
by a
ge, s
ex a
nd s
ite
Tasm
ania
n C
ance
r Reg
istry
| 3
3
0-
4 5-
9 10
-14
15-1
9 20
-24
25-2
9 30
-34
35-3
9 40
-44
45-4
9 50
-54
55-5
9 60
-64
65-6
9 70
-74
75-7
9 80
-84
85+
Tota
l C
rude
R
ate
Cum
ul
Rat
e AS
Rat
es
W
AU
S
(196
0) (
2001
)
C44
. Sk
in
Cas
es
M
0
0 0
0 0
0 0
1 1
0 0
0 0
1 1
1 1
1 7
F
0 0
0 0
1 1
0 0
0 0
0 1
2 1
0 1
1 1
9
P 0
0 0
0 1
1 0
1 1
0 0
1 2
2 1
2 2
2 16
In
cide
nce
per 1
00,0
00
M
0.
0 0.
0 0.
0 0.
0 0.
0 0.
0 0.
0 6.
4 5.
6 0.
0 0.
0 0.
0 0.
0 9.
7 12
.5
15.2
23
.9
40.3
2.9
0.2
1.7
3.0
F
0.0
0.0
0.0
0.0
6.7
7.5
0.0
0.0
0.0
0.0
0.0
6.2
16.0
9.
5 0.
0 13
.0
15.9
17
.8
3.
7 0.
2 2.
6 3.
2
P 0.
0 0.
0 0.
0 0.
0 3.
2 3.
8 0.
0 3.
1 2.
8 0.
0 0.
0 3.
1 7.
9 9.
6 6.
0 14
.0
19.1
24
.6
3.
3 0.
2 2.
1 3.
0 D
eath
s
M
0 0
0 0
0 0
1 0
0 0
0 0
0 0
0 0
1 0
2
F 0
0 0
0 0
0 0
0 0
0 0
0 0
0 0
0 0
0 0
P
0 0
0 0
0 0
1 0
0 0
0 0
0 0
0 0
1 0
2
M
orta
lity
per 1
00,0
00
M
0.
0 0.
0 0.
0 0.
0 0.
0 0.
0 6.
9 0.
0 0.
0 0.
0 0.
0 0.
0 0.
0 0.
0 0.
0 0.
0 23
.9
0.0
0.
8 0.
0 0.
5 0.
9
F 0.
0 0.
0 0.
0 0.
0 0.
0 0.
0 0.
0 0.
0 0.
0 0.
0 0.
0 0.
0 0.
0 0.
0 0.
0 0.
0 0.
0 0.
0
0.0
0.0
0.0
0.0
P
0.0
0.0
0.0
0.0
0.0
0.0
3.3
0.0
0.0
0.0
0.0
0.0
0.0
0.0
0.0
0.0
9.5
0.0
0.
4 0.
0 0.
2 0.
4
C45
. M
esot
helio
ma
Cas
es
M
0
0 0
0 0
0 0
0 0
1 1
2 2
3 1
2 0
0 12
F 0
0 0
0 0
0 0
0 1
0 0
0 0
0 0
1 0
0 2
P
0 0
0 0
0 0
0 0
1 1
1 2
2 3
1 3
0 0
14
Inci
denc
e pe
r 100
,000
M
0.0
0.0
0.0
0.0
0.0
0.0
0.0
0.0
0.0
5.6
6.0
12.4
15
.7
29.0
12
.5
30.3
0.
0 0.
0
5.0
0.4
3.2
4.3
F
0.0
0.0
0.0
0.0
0.0
0.0
0.0
0.0
5.4
0.0
0.0
0.0
0.0
0.0
0.0
13.0
0.
0 0.
0
0.8
0.0
0.5
0.8
P
0.0
0.0
0.0
0.0
0.0
0.0
0.0
0.0
2.8
2.8
2.9
6.2
7.9
14.4
6.
0 21
.0
0.0
0.0
2.
9 0.
2 1.
8 2.
5 D
eath
s
M
0 0
0 0
0 0
0 0
0 0
1 1
2 0
0 4
0 1
9
F 0
0 0
0 0
0 0
0 0
1 0
0 0
0 0
0 0
0 1
P
0 0
0 0
0 0
0 0
0 1
1 1
2 0
0 4
0 1
10
Mor
talit
y pe
r 100
,000
M
0.0
0.0
0.0
0.0
0.0
0.0
0.0
0.0
0.0
0.0
6.0
6.2
15.7
0.
0 0.
0 60
.6
0.0
40.3
3.8
0.1
2.0
3.6
F
0.0
0.0
0.0
0.0
0.0
0.0
0.0
0.0
0.0
5.5
0.0
0.0
0.0
0.0
0.0
0.0
0.0
0.0
0.
4 0.
0 0.
3 0.
4
P 0.
0 0.
0 0.
0 0.
0 0.
0 0.
0 0.
0 0.
0 0.
0 2.
8 2.
9 3.
1 7.
9 0.
0 0.
0 27
.9
0.0
12.3
2.1
0.1
1.1
1.8

Can
cer I
ncid
ence
and
Mor
talit
y in
Tas
man
ia 2
005
by a
ge, s
ex a
nd s
ite
34 |
Tas
man
ian
Can
cer R
egis
try
0-
4 5-
9 10
-14
15-1
9 20
-24
25-2
9 30
-34
35-3
9 40
-44
45-4
9 50
-54
55-5
9 60
-64
65-6
9 70
-74
75-7
9 80
-84
85+
Tota
l C
rude
R
ate
Cum
ul
Rat
e AS
Rat
es
W
AU
S
(196
0) (
2001
)
C46
. K
apos
i sar
com
a C
ases
M
0 0
0 0
0 0
0 0
0 1
0 0
0 0
0 0
0 0
1
F 0
0 0
0 0
0 0
0 0
0 0
0 0
0 0
0 0
0 0
P
0 0
0 0
0 0
0 0
0 1
0 0
0 0
0 0
0 0
1
In
cide
nce
per 1
00,0
00
M
0.
0 0.
0 0.
0 0.
0 0.
0 0.
0 0.
0 0.
0 0.
0 5.
6 0.
0 0.
0 0.
0 0.
0 0.
0 0.
0 0.
0 0.
0
0.4
0.0
0.3
0.4
F
0.0
0.0
0.0
0.0
0.0
0.0
0.0
0.0
0.0
0.0
0.0
0.0
0.0
0.0
0.0
0.0
0.0
0.0
0.
0 0.
0 0.
0 0.
0
P 0.
0 0.
0 0.
0 0.
0 0.
0 0.
0 0.
0 0.
0 0.
0 2.
8 0.
0 0.
0 0.
0 0.
0 0.
0 0.
0 0.
0 0.
0
0.2
0.0
0.2
0.2
Dea
ths
M
0
0 0
0 0
0 0
0 0
0 0
0 0
0 0
0 0
0 0
F
0 0
0 0
0 0
0 0
0 0
0 0
0 0
0 0
0 0
0
P 0
0 0
0 0
0 0
0 0
0 0
0 0
0 0
0 0
0 0
Mor
talit
y pe
r 100
,000
M
0.0
0.0
0.0
0.0
0.0
0.0
0.0
0.0
0.0
0.0
0.0
0.0
0.0
0.0
0.0
0.0
0.0
0.0
0.
0 0.
0 0.
0 0.
0
F 0.
0 0.
0 0.
0 0.
0 0.
0 0.
0 0.
0 0.
0 0.
0 0.
0 0.
0 0.
0 0.
0 0.
0 0.
0 0.
0 0.
0 0.
0
0.0
0.0
0.0
0.0
P
0.0
0.0
0.0
0.0
0.0
0.0
0.0
0.0
0.0
0.0
0.0
0.0
0.0
0.0
0.0
0.0
0.0
0.0
0.
0 0.
0 0.
0 0.
0
C47
, C49
. C
onne
ctiv
e tis
sue
Cas
es
M
0
0 0
0 0
0 0
1 1
0 0
2 1
0 0
2 2
0 9
F
0 0
0 0
0 0
0 0
0 0
0 1
0 1
1 0
0 3
6
P 0
0 0
0 0
0 0
1 1
0 0
3 1
1 1
2 2
3 15
In
cide
nce
per 1
00,0
00
M
0.
0 0.
0 0.
0 0.
0 0.
0 0.
0 0.
0 6.
4 5.
6 0.
0 0.
0 12
.4
7.9
0.0
0.0
30.3
47
.9
0.0
3.
8 0.
2 2.
1 3.
5
F 0.
0 0.
0 0.
0 0.
0 0.
0 0.
0 0.
0 0.
0 0.
0 0.
0 0.
0 6.
2 0.
0 9.
5 11
.6
0.0
0.0
53.3
2.4
0.1
1.0
1.8
P
0.0
0.0
0.0
0.0
0.0
0.0
0.0
3.1
2.8
0.0
0.0
9.3
4.0
4.8
6.0
14.0
19
.1
37.0
3.1
0.1
1.6
2.7
Dea
ths
M
0
0 0
0 0
0 0
0 0
0 0
0 1
0 0
0 1
0 2
F
0 0
0 0
0 0
0 0
0 0
0 1
0 0
0 0
0 2
3
P 0
0 0
0 0
0 0
0 0
0 0
1 1
0 0
0 1
2 5
Mor
talit
y pe
r 100
,000
M
0.0
0.0
0.0
0.0
0.0
0.0
0.0
0.0
0.0
0.0
0.0
0.0
7.9
0.0
0.0
0.0
23.9
0.
0
0.8
0.0
0.4
0.7
F
0.0
0.0
0.0
0.0
0.0
0.0
0.0
0.0
0.0
0.0
0.0
6.2
0.0
0.0
0.0
0.0
0.0
35.5
1.2
0.0
0.4
0.8
P
0.0
0.0
0.0
0.0
0.0
0.0
0.0
0.0
0.0
0.0
0.0
3.1
4.0
0.0
0.0
0.0
9.5
24.6
1.0
0.0
0.5
0.8

Can
cer I
ncid
ence
and
Mor
talit
y in
Tas
man
ia 2
005
by a
ge, s
ex a
nd s
ite
Tasm
ania
n C
ance
r Reg
istry
| 3
5
0-
4 5-
9 10
-14
15-1
9 20
-24
25-2
9 30
-34
35-3
9 40
-44
45-4
9 50
-54
55-5
9 60
-64
65-6
9 70
-74
75-7
9 80
-84
85+
Tota
l C
rude
R
ate
Cum
ul
Rat
e AS
Rat
es
W
AU
S
(196
0) (
2001
)
C48
. Pe
riton
eum
& re
trop
erito
neum
C
ases
M
0 0
0 0
0 0
0 0
0 0
0 0
0 0
0 0
0 0
0
F 0
0 0
0 0
0 0
0 0
0 0
0 1
0 0
0 0
1 2
P
0 0
0 0
0 0
0 0
0 0
0 0
1 0
0 0
0 1
2
In
cide
nce
per 1
00,0
00
M
0.
0 0.
0 0.
0 0.
0 0.
0 0.
0 0.
0 0.
0 0.
0 0.
0 0.
0 0.
0 0.
0 0.
0 0.
0 0.
0 0.
0 0.
0
0.0
0.0
0.0
0.0
F
0.0
0.0
0.0
0.0
0.0
0.0
0.0
0.0
0.0
0.0
0.0
0.0
8.0
0.0
0.0
0.0
0.0
17.8
0.8
0.0
0.4
0.6
P
0.0
0.0
0.0
0.0
0.0
0.0
0.0
0.0
0.0
0.0
0.0
0.0
4.0
0.0
0.0
0.0
0.0
12.3
0.4
0.0
0.2
0.3
Dea
ths
M
0
0 0
0 0
0 0
0 0
0 0
0 0
0 0
0 0
0 0
F
0 0
0 0
0 0
0 0
0 0
0 0
0 0
0 0
0 1
1
P 0
0 0
0 0
0 0
0 0
0 0
0 0
0 0
0 0
1 1
Mor
talit
y pe
r 100
,000
M
0.0
0.0
0.0
0.0
0.0
0.0
0.0
0.0
0.0
0.0
0.0
0.0
0.0
0.0
0.0
0.0
0.0
0.0
0.
0 0.
0 0.
0 0.
0
F 0.
0 0.
0 0.
0 0.
0 0.
0 0.
0 0.
0 0.
0 0.
0 0.
0 0.
0 0.
0 0.
0 0.
0 0.
0 0.
0 0.
0 17
.8
0.
4 0.
0 0.
1 0.
2
P 0.
0 0.
0 0.
0 0.
0 0.
0 0.
0 0.
0 0.
0 0.
0 0.
0 0.
0 0.
0 0.
0 0.
0 0.
0 0.
0 0.
0 12
.3
0.
2 0.
0 0.
1 0.
2
C50
. B
reas
t C
ases
M
0 0
0 0
0 0
0 0
0 0
0 0
0 0
1 1
0 1
3
F 0
0 0
0 0
1 0
9 28
40
38
45
38
44
23
25
15
17
32
3
P 0
0 0
0 0
1 0
9 28
40
38
45
38
44
24
26
15
18
32
6
In
cide
nce
per 1
00,0
00
M
0.
0 0.
0 0.
0 0.
0 0.
0 0.
0 0.
0 0.
0 0.
0 0.
0 0.
0 0.
0 0.
0 0.
0 12
.5
15.2
0.
0 40
.3
1.
3 0.
1 0.
6 1.
4
F 0.
0 0.
0 0.
0 0.
0 0.
0 7.
5 0.
0 54
.4
151.
1 21
8.9
221.
3 27
7.3
303.
5 41
9.6
265.
8 32
3.8
238.
0 30
1.8
13
1.4
9.6
84.2
11
4.0
P
0.0
0.0
0.0
0.0
0.0
3.8
0.0
27.9
77
.1
110.
3 11
1.9
139.
4 15
0.6
211.
2 14
3.9
181.
6 14
3.1
221.
8
67.2
4.
9 43
.3
59.6
D
eath
s
M
0 0
0 0
0 0
0 0
0 0
0 0
0 0
0 0
0 1
1
F 0
0 0
0 0
0 0
3 4
5 11
12
9
7 8
8 12
4
83
P
0 0
0 0
0 0
0 3
4 5
11
12
9 7
8 8
12
5 84
M
orta
lity
per 1
00,0
00
M
0.
0 0.
0 0.
0 0.
0 0.
0 0.
0 0.
0 0.
0 0.
0 0.
0 0.
0 0.
0 0.
0 0.
0 0.
0 0.
0 0.
0 40
.3
0.
4 0.
0 0.
2 0.
6
F 0.
0 0.
0 0.
0 0.
0 0.
0 0.
0 0.
0 18
.1
21.6
27
.4
64.1
74
.0
71.9
66
.8
92.4
10
3.6
190.
4 71
.0
33
.8
2.2
19.3
28
.5
P
0.0
0.0
0.0
0.0
0.0
0.0
0.0
9.3
11.0
13
.8
32.4
37
.2
35.7
33
.6
48.0
55
.9
114.
5 61
.6
17
.3
1.1
10.0
15
.2

Can
cer I
ncid
ence
and
Mor
talit
y in
Tas
man
ia 2
005
by a
ge, s
ex a
nd s
ite
36 |
Tas
man
ian
Can
cer R
egis
try
0-
4 5-
9 10
-14
15-1
9 20
-24
25-2
9 30
-34
35-3
9 40
-44
45-4
9 50
-54
55-5
9 60
-64
65-6
9 70
-74
75-7
9 80
-84
85+
Tota
l C
rude
R
ate
Cum
ul
Rat
e AS
Rat
es
W
AU
S
(196
0) (
2001
)
C53
. C
ervi
x C
ases
M
- -
- -
- -
- -
- -
- -
- -
- -
- -
-
F 0
0 0
0 1
2 1
1 3
3 1
6 2
0 0
1 2
1 24
P -
- -
- -
- -
- -
- -
- -
- -
- -
- -
Inci
denc
e pe
r 100
,000
M
- -
- -
- -
- -
- -
- -
- -
- -
- -
-
- -
-
F 0.
0 0.
0 0.
0 0.
0 6.
7 15
.0
6.3
6.0
16.2
16
.4
5.8
37.0
16
.0
0.0
0.0
13.0
31
.7
17.8
9.8
0.6
7.2
9.0
P
- -
- -
- -
- -
- -
- -
- -
- -
- -
-
- -
- D
eath
s
M
- -
- -
- -
- -
- -
- -
- -
- -
- -
-
F 0
0 0
0 0
0 0
0 1
3 2
1 1
0 1
2 0
0 11
P -
- -
- -
- -
- -
- -
- -
- -
- -
- -
Mor
talit
y pe
r 100
,000
M
- -
- -
- -
- -
- -
- -
- -
- -
- -
-
- -
-
F 0.
0 0.
0 0.
0 0.
0 0.
0 0.
0 0.
0 0.
0 5.
4 16
.4
11.6
6.
2 8.
0 0.
0 11
.6
25.9
0.
0 0.
0
4.5
0.3
2.9
4.1
P
- -
- -
- -
- -
- -
- -
- -
- -
- -
-
- -
-
C54
, C55
. U
teru
s C
ases
M
- -
- -
- -
- -
- -
- -
- -
- -
- -
-
F 0
0 0
0 0
0 1
1 4
0 6
7 4
8 4
8 2
1 46
P -
- -
- -
- -
- -
- -
- -
- -
- -
- -
Inci
denc
e pe
r 100
,000
M
- -
- -
- -
- -
- -
- -
- -
- -
- -
-
- -
-
F 0.
0 0.
0 0.
0 0.
0 0.
0 0.
0 6.
3 6.
0 21
.6
0.0
34.9
43
.1
32.0
76
.3
46.2
10
3.6
31.7
17
.8
18
.7
1.3
11.3
16
.3
P
- -
- -
- -
- -
- -
- -
- -
- -
- -
-
- -
- D
eath
s
M
- -
- -
- -
- -
- -
- -
- -
- -
- -
-
F 0
0 0
0 0
0 0
0 0
0 1
0 2
1 1
3 1
0 9
P
- -
- -
- -
- -
- -
- -
- -
- -
- -
-
M
orta
lity
per 1
00,0
00
M
-
- -
- -
- -
- -
- -
- -
- -
- -
-
- -
- -
F
0.0
0.0
0.0
0.0
0.0
0.0
0.0
0.0
0.0
0.0
5.8
0.0
16.0
9.
5 11
.6
38.9
15
.9
0.0
3.
7 0.
2 1.
9 3.
1
P -
- -
- -
- -
- -
- -
- -
- -
- -
-
- -
- -

Can
cer I
ncid
ence
and
Mor
talit
y in
Tas
man
ia 2
005
by a
ge, s
ex a
nd s
ite
Tasm
ania
n C
ance
r Reg
istry
| 3
7
0-
4 5-
9 10
-14
15-1
9 20
-24
25-2
9 30
-34
35-3
9 40
-44
45-4
9 50
-54
55-5
9 60
-64
65-6
9 70
-74
75-7
9 80
-84
85+
Tota
l C
rude
R
ate
Cum
ul
Rat
e AS
Rat
es
W
AU
S
(196
0) (
2001
)
C51
, C52
, C57
. Vu
lva
etc
Cas
es
M
-
- -
- -
- -
- -
- -
- -
- -
- -
- -
F
0 0
0 0
0 0
0 0
1 0
0 3
2 1
1 1
2 1
12
P
- -
- -
- -
- -
- -
- -
- -
- -
- -
-
In
cide
nce
per 1
00,0
00
M
-
- -
- -
- -
- -
- -
- -
- -
- -
-
- -
- -
F
0.0
0.0
0.0
0.0
0.0
0.0
0.0
0.0
5.4
0.0
0.0
18.5
16
.0
9.5
11.6
13
.0
31.7
17
.8
4.
9 0.
3 2.
6 3.
9
P -
- -
- -
- -
- -
- -
- -
- -
- -
-
- -
- -
Dea
ths
M
-
- -
- -
- -
- -
- -
- -
- -
- -
- -
F
0 0
0 0
0 0
0 0
0 0
0 0
0 1
1 2
0 2
6
P -
- -
- -
- -
- -
- -
- -
- -
- -
- -
Mor
talit
y pe
r 100
,000
M
- -
- -
- -
- -
- -
- -
- -
- -
- -
-
- -
-
F 0.
0 0.
0 0.
0 0.
0 0.
0 0.
0 0.
0 0.
0 0.
0 0.
0 0.
0 0.
0 0.
0 9.
5 11
.6
25.9
0.
0 35
.5
2.
4 0.
1 1.
0 1.
9
P -
- -
- -
- -
- -
- -
- -
- -
- -
-
- -
- -
C56
. O
vary
C
ases
M
- -
- -
- -
- -
- -
- -
- -
- -
- -
-
F 0
0 0
0 0
0 0
0 0
1 0
3 2
3 7
3 3
1 23
P -
- -
- -
- -
- -
- -
- -
- -
- -
- -
Inci
denc
e pe
r 100
,000
M
- -
- -
- -
- -
- -
- -
- -
- -
- -
-
- -
-
F 0.
0 0.
0 0.
0 0.
0 0.
0 0.
0 0.
0 0.
0 0.
0 5.
5 0.
0 18
.5
16.0
28
.6
80.9
38
.9
47.6
17
.8
9.
4 0.
7 4.
9 7.
8
P -
- -
- -
- -
- -
- -
- -
- -
- -
-
- -
- -
Dea
ths
M
-
- -
- -
- -
- -
- -
- -
- -
- -
- -
F
0 0
0 0
0 0
0 0
0 0
3 0
0 2
5 1
2 2
15
P
- -
- -
- -
- -
- -
- -
- -
- -
- -
-
M
orta
lity
per 1
00,0
00
M
-
- -
- -
- -
- -
- -
- -
- -
- -
-
- -
- -
F
0.0
0.0
0.0
0.0
0.0
0.0
0.0
0.0
0.0
0.0
17.5
0.
0 0.
0 19
.1
57.8
13
.0
31.7
35
.5
6.
1 0.
5 3.
1 5.
1
P -
- -
- -
- -
- -
- -
- -
- -
- -
-
- -
- -
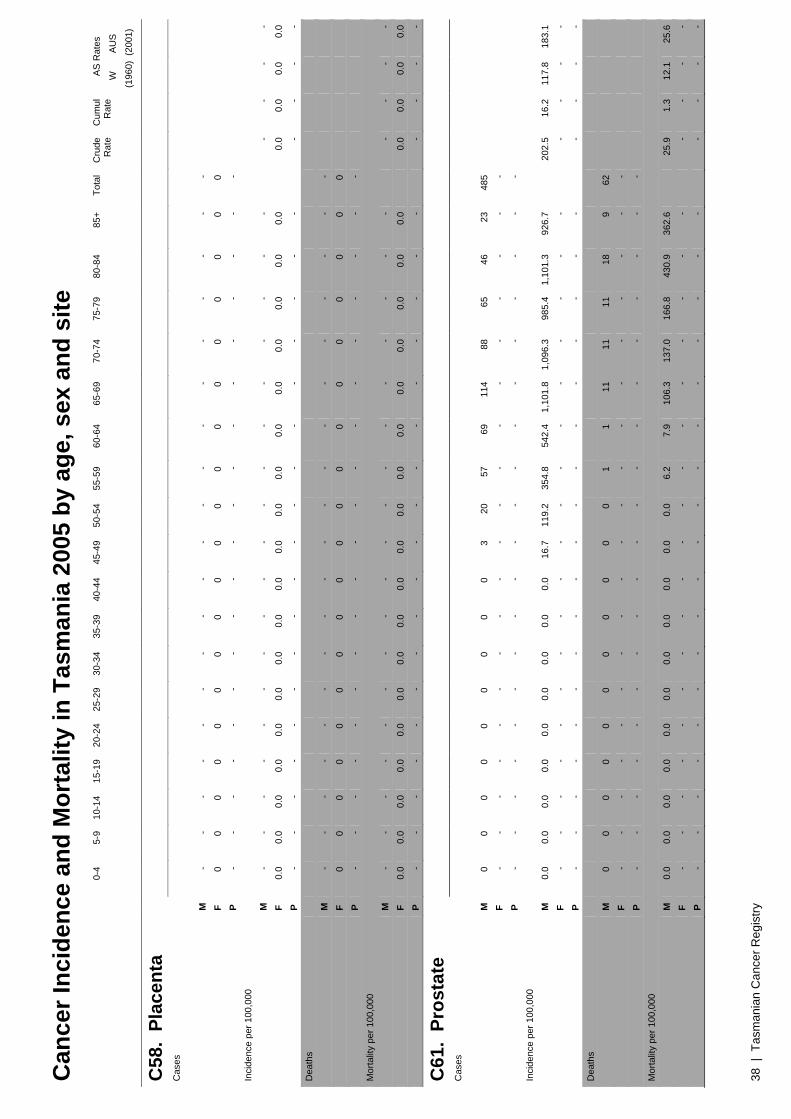
Can
cer I
ncid
ence
and
Mor
talit
y in
Tas
man
ia 2
005
by a
ge, s
ex a
nd s
ite
38 |
Tas
man
ian
Can
cer R
egis
try
0-
4 5-
9 10
-14
15-1
9 20
-24
25-2
9 30
-34
35-3
9 40
-44
45-4
9 50
-54
55-5
9 60
-64
65-6
9 70
-74
75-7
9 80
-84
85+
Tota
l C
rude
R
ate
Cum
ul
Rat
e AS
Rat
es
W
AU
S
(196
0) (
2001
)
C58
. Pl
acen
ta
Cas
es
M
-
- -
- -
- -
- -
- -
- -
- -
- -
- -
F
0 0
0 0
0 0
0 0
0 0
0 0
0 0
0 0
0 0
0
P -
- -
- -
- -
- -
- -
- -
- -
- -
- -
Inci
denc
e pe
r 100
,000
M
- -
- -
- -
- -
- -
- -
- -
- -
- -
-
- -
-
F 0.
0 0.
0 0.
0 0.
0 0.
0 0.
0 0.
0 0.
0 0.
0 0.
0 0.
0 0.
0 0.
0 0.
0 0.
0 0.
0 0.
0 0.
0
0.0
0.0
0.0
0.0
P
- -
- -
- -
- -
- -
- -
- -
- -
- -
-
- -
- D
eath
s
M
- -
- -
- -
- -
- -
- -
- -
- -
- -
-
F 0
0 0
0 0
0 0
0 0
0 0
0 0
0 0
0 0
0 0
P
- -
- -
- -
- -
- -
- -
- -
- -
- -
-
M
orta
lity
per 1
00,0
00
M
-
- -
- -
- -
- -
- -
- -
- -
- -
-
- -
- -
F
0.0
0.0
0.0
0.0
0.0
0.0
0.0
0.0
0.0
0.0
0.0
0.0
0.0
0.0
0.0
0.0
0.0
0.0
0.
0 0.
0 0.
0 0.
0
P -
- -
- -
- -
- -
- -
- -
- -
- -
-
- -
- -
C61
. Pr
osta
te
Cas
es
M
0
0 0
0 0
0 0
0 0
3 20
57
69
11
4 88
65
46
23
48
5
F -
- -
- -
- -
- -
- -
- -
- -
- -
- -
P
- -
- -
- -
- -
- -
- -
- -
- -
- -
-
In
cide
nce
per 1
00,0
00
M
0.
0 0.
0 0.
0 0.
0 0.
0 0.
0 0.
0 0.
0 0.
0 16
.7
119.
2 35
4.8
542.
4 1,
101.
8 1,
096.
3 98
5.4
1,10
1.3
926.
7
202.
5 16
.2
117.
8 18
3.1
F
- -
- -
- -
- -
- -
- -
- -
- -
- -
-
- -
-
P -
- -
- -
- -
- -
- -
- -
- -
- -
-
- -
- -
Dea
ths
M
0
0 0
0 0
0 0
0 0
0 0
1 1
11
11
11
18
9 62
F -
- -
- -
- -
- -
- -
- -
- -
- -
- -
P
- -
- -
- -
- -
- -
- -
- -
- -
- -
-
M
orta
lity
per 1
00,0
00
M
0.
0 0.
0 0.
0 0.
0 0.
0 0.
0 0.
0 0.
0 0.
0 0.
0 0.
0 6.
2 7.
9 10
6.3
137.
0 16
6.8
430.
9 36
2.6
25
.9
1.3
12.1
25
.6
F
- -
- -
- -
- -
- -
- -
- -
- -
- -
-
- -
-
P -
- -
- -
- -
- -
- -
- -
- -
- -
-
- -
- -

Can
cer I
ncid
ence
and
Mor
talit
y in
Tas
man
ia 2
005
by a
ge, s
ex a
nd s
ite
Tasm
ania
n C
ance
r Reg
istry
| 3
9
0-
4 5-
9 10
-14
15-1
9 20
-24
25-2
9 30
-34
35-3
9 40
-44
45-4
9 50
-54
55-5
9 60
-64
65-6
9 70
-74
75-7
9 80
-84
85+
Tota
l C
rude
R
ate
Cum
ul
Rat
e AS
Rat
es
W
AU
S
(196
0) (
2001
)
C62
. Te
stis
C
ases
M
0 0
0 0
3 2
4 1
2 1
0 0
0 0
0 0
0 0
13
F
- -
- -
- -
- -
- -
- -
- -
- -
- -
-
P -
- -
- -
- -
- -
- -
- -
- -
- -
- -
Inci
denc
e pe
r 100
,000
M
0.0
0.0
0.0
0.0
18.7
15
.1
27.5
6.
4 11
.2
5.6
0.0
0.0
0.0
0.0
0.0
0.0
0.0
0.0
5.
4 0.
4 5.
7 6.
2
F -
- -
- -
- -
- -
- -
- -
- -
- -
-
- -
- -
P
- -
- -
- -
- -
- -
- -
- -
- -
- -
-
- -
- D
eath
s
M
0 0
0 1
0 0
0 0
0 0
0 0
0 0
0 0
0 0
1
F -
- -
- -
- -
- -
- -
- -
- -
- -
- -
P
- -
- -
- -
- -
- -
- -
- -
- -
- -
-
M
orta
lity
per 1
00,0
00
M
0.
0 0.
0 0.
0 5.
7 0.
0 0.
0 0.
0 0.
0 0.
0 0.
0 0.
0 0.
0 0.
0 0.
0 0.
0 0.
0 0.
0 0.
0
0.4
0.0
0.5
0.4
F
- -
- -
- -
- -
- -
- -
- -
- -
- -
-
- -
-
P -
- -
- -
- -
- -
- -
- -
- -
- -
-
- -
- -
C60
, C63
. Pe
nis
etc
Cas
es
M
0
0 0
0 0
0 0
0 0
0 1
2 0
0 0
0 0
0 3
F
- -
- -
- -
- -
- -
- -
- -
- -
- -
-
P -
- -
- -
- -
- -
- -
- -
- -
- -
- -
Inci
denc
e pe
r 100
,000
M
0.0
0.0
0.0
0.0
0.0
0.0
0.0
0.0
0.0
0.0
6.0
12.4
0.
0 0.
0 0.
0 0.
0 0.
0 0.
0
1.3
0.1
0.8
1.0
F
- -
- -
- -
- -
- -
- -
- -
- -
- -
-
- -
-
P -
- -
- -
- -
- -
- -
- -
- -
- -
-
- -
- -
Dea
ths
M
0
0 0
0 0
0 0
0 0
0 0
0 0
0 0
0 0
0 0
F
- -
- -
- -
- -
- -
- -
- -
- -
- -
-
P -
- -
- -
- -
- -
- -
- -
- -
- -
- -
Mor
talit
y pe
r 100
,000
M
0.0
0.0
0.0
0.0
0.0
0.0
0.0
0.0
0.0
0.0
0.0
0.0
0.0
0.0
0.0
0.0
0.0
0.0
0.
0 0.
0 0.
0 0.
0
F -
- -
- -
- -
- -
- -
- -
- -
- -
-
- -
- -
P
- -
- -
- -
- -
- -
- -
- -
- -
- -
-
- -
-

Can
cer I
ncid
ence
and
Mor
talit
y in
Tas
man
ia 2
005
by a
ge, s
ex a
nd s
ite
40 |
Tas
man
ian
Can
cer R
egis
try
0-
4 5-
9 10
-14
15-1
9 20
-24
25-2
9 30
-34
35-3
9 40
-44
45-4
9 50
-54
55-5
9 60
-64
65-6
9 70
-74
75-7
9 80
-84
85+
Tota
l C
rude
R
ate
Cum
ul
Rat
e AS
Rat
es
W
AU
S
(196
0) (
2001
)
C64
. K
idne
y C
ases
M
1 1
0 0
0 0
1 0
3 1
4 6
0 5
3 6
5 2
38
F
0 0
0 0
0 0
1 2
2 4
3 2
2 0
3 3
0 3
25
P
1 1
0 0
0 0
2 2
5 5
7 8
2 5
6 9
5 5
63
Inci
denc
e pe
r 100
,000
M
6.5
6.1
0.0
0.0
0.0
0.0
6.9
0.0
16.9
5.
6 23
.8
37.3
0.
0 48
.3
37.4
91
.0
119.
7 80
.6
15
.9
0.9
9.9
15.1
F 0.
0 0.
0 0.
0 0.
0 0.
0 0.
0 6.
3 12
.1
10.8
21
.9
17.5
12
.3
16.0
0.
0 34
.7
38.9
0.
0 53
.3
10
.2
0.7
6.4
9.2
P
3.3
3.1
0.0
0.0
0.0
0.0
6.6
6.2
13.8
13
.8
20.6
24
.8
7.9
24.0
36
.0
62.9
47
.7
61.6
13.0
0.
8 8.
1 11
.8
Dea
ths
M
0
0 0
0 0
0 0
0 0
0 0
0 2
3 1
2 7
1 16
F 0
0 0
0 0
0 0
0 0
0 1
0 0
2 1
1 1
2 8
P
0 0
0 0
0 0
0 0
0 0
1 0
2 5
2 3
8 3
24
Mor
talit
y pe
r 100
,000
M
0.0
0.0
0.0
0.0
0.0
0.0
0.0
0.0
0.0
0.0
0.0
0.0
15.7
29
.0
12.5
30
.3
167.
6 40
.3
6.
7 0.
3 3.
1 6.
3
F 0.
0 0.
0 0.
0 0.
0 0.
0 0.
0 0.
0 0.
0 0.
0 0.
0 5.
8 0.
0 0.
0 19
.1
11.6
13
.0
15.9
35
.5
3.
3 0.
2 1.
5 2.
5
P 0.
0 0.
0 0.
0 0.
0 0.
0 0.
0 0.
0 0.
0 0.
0 0.
0 2.
9 0.
0 7.
9 24
.0
12.0
21
.0
76.3
37
.0
4.
9 0.
2 2.
2 4.
1
C67
. B
ladd
er
Cas
es
M
0
0 0
0 0
0 0
0 0
3 1
4 4
6 14
6
8 5
51
F
0 0
0 0
0 0
0 0
0 0
0 1
2 2
6 3
1 4
19
P
0 0
0 0
0 0
0 0
0 3
1 5
6 8
20
9 9
9 70
In
cide
nce
per 1
00,0
00
M
0.
0 0.
0 0.
0 0.
0 0.
0 0.
0 0.
0 0.
0 0.
0 16
.7
6.0
24.9
31
.4
58.0
17
4.4
91.0
19
1.5
201.
5
21.3
1.
6 11
.7
20.4
F 0.
0 0.
0 0.
0 0.
0 0.
0 0.
0 0.
0 0.
0 0.
0 0.
0 0.
0 6.
2 16
.0
19.1
69
.3
38.9
15
.9
71.0
7.7
0.6
3.7
6.2
P
0.0
0.0
0.0
0.0
0.0
0.0
0.0
0.0
0.0
8.3
2.9
15.5
23
.8
38.4
11
9.9
62.9
85
.9
110.
9
14.4
1.
0 7.
4 12
.5
Dea
ths
M
0
0 0
0 0
0 0
0 0
0 1
1 2
0 4
7 2
3 20
F 0
0 0
0 0
0 0
1 0
0 0
0 0
0 2
2 1
2 8
P
0 0
0 0
0 0
0 1
0 0
1 1
2 0
6 9
3 5
28
Mor
talit
y pe
r 100
,000
M
0.0
0.0
0.0
0.0
0.0
0.0
0.0
0.0
0.0
0.0
6.0
6.2
15.7
0.
0 49
.8
106.
1 47
.9
120.
9
8.4
0.4
4.1
8.3
F
0.0
0.0
0.0
0.0
0.0
0.0
0.0
6.0
0.0
0.0
0.0
0.0
0.0
0.0
23.1
25
.9
15.9
35
.5
3.
3 0.
1 1.
3 2.
7
P 0.
0 0.
0 0.
0 0.
0 0.
0 0.
0 0.
0 3.
1 0.
0 0.
0 2.
9 3.
1 7.
9 0.
0 36
.0
62.9
28
.6
61.6
5.8
0.3
2.6
5.1
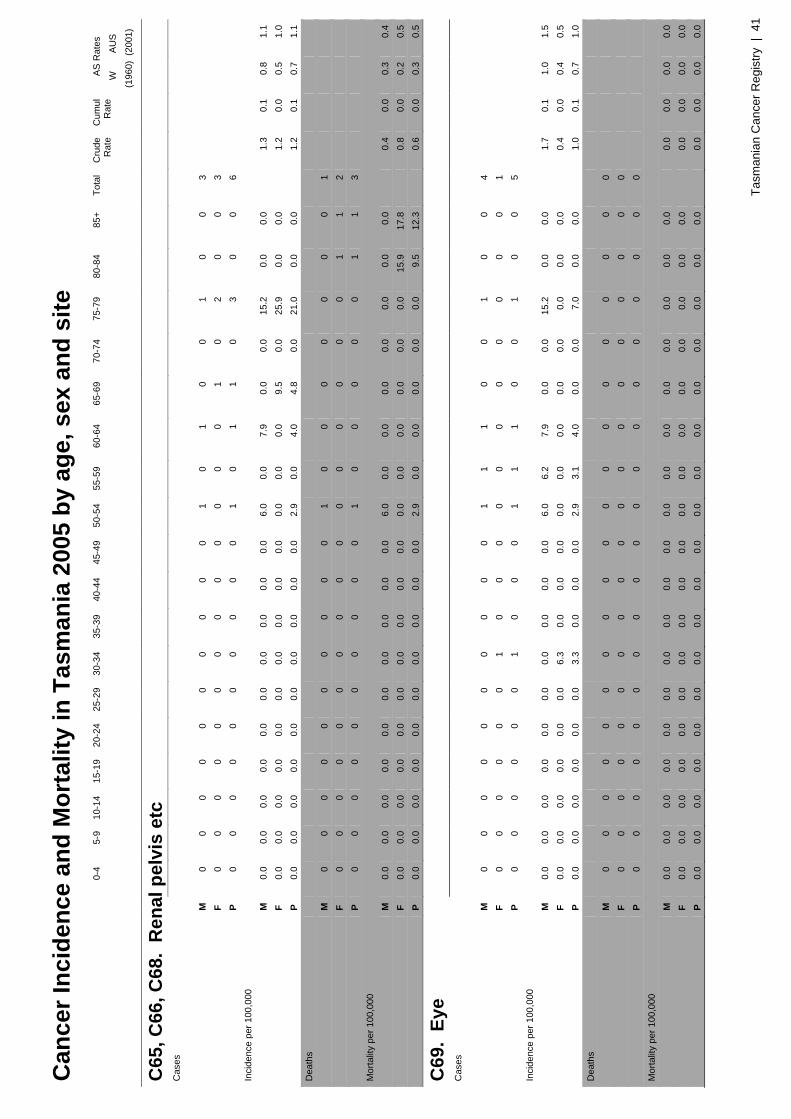
Can
cer I
ncid
ence
and
Mor
talit
y in
Tas
man
ia 2
005
by a
ge, s
ex a
nd s
ite
Tasm
ania
n C
ance
r Reg
istry
| 4
1
0-
4 5-
9 10
-14
15-1
9 20
-24
25-2
9 30
-34
35-3
9 40
-44
45-4
9 50
-54
55-5
9 60
-64
65-6
9 70
-74
75-7
9 80
-84
85+
Tota
l C
rude
R
ate
Cum
ul
Rat
e AS
Rat
es
W
AU
S
(196
0) (
2001
)
C65
, C66
, C68
. R
enal
pel
vis
etc
Cas
es
M
0
0 0
0 0
0 0
0 0
0 1
0 1
0 0
1 0
0 3
F
0 0
0 0
0 0
0 0
0 0
0 0
0 1
0 2
0 0
3
P 0
0 0
0 0
0 0
0 0
0 1
0 1
1 0
3 0
0 6
Inci
denc
e pe
r 100
,000
M
0.0
0.0
0.0
0.0
0.0
0.0
0.0
0.0
0.0
0.0
6.0
0.0
7.9
0.0
0.0
15.2
0.
0 0.
0
1.3
0.1
0.8
1.1
F
0.0
0.0
0.0
0.0
0.0
0.0
0.0
0.0
0.0
0.0
0.0
0.0
0.0
9.5
0.0
25.9
0.
0 0.
0
1.2
0.0
0.5
1.0
P
0.0
0.0
0.0
0.0
0.0
0.0
0.0
0.0
0.0
0.0
2.9
0.0
4.0
4.8
0.0
21.0
0.
0 0.
0
1.2
0.1
0.7
1.1
Dea
ths
M
0
0 0
0 0
0 0
0 0
0 1
0 0
0 0
0 0
0 1
F
0 0
0 0
0 0
0 0
0 0
0 0
0 0
0 0
1 1
2
P 0
0 0
0 0
0 0
0 0
0 1
0 0
0 0
0 1
1 3
Mor
talit
y pe
r 100
,000
M
0.0
0.0
0.0
0.0
0.0
0.0
0.0
0.0
0.0
0.0
6.0
0.0
0.0
0.0
0.0
0.0
0.0
0.0
0.
4 0.
0 0.
3 0.
4
F 0.
0 0.
0 0.
0 0.
0 0.
0 0.
0 0.
0 0.
0 0.
0 0.
0 0.
0 0.
0 0.
0 0.
0 0.
0 0.
0 15
.9
17.8
0.8
0.0
0.2
0.5
P
0.0
0.0
0.0
0.0
0.0
0.0
0.0
0.0
0.0
0.0
2.9
0.0
0.0
0.0
0.0
0.0
9.5
12.3
0.6
0.0
0.3
0.5
C69
. Ey
e C
ases
M
0 0
0 0
0 0
0 0
0 0
1 1
1 0
0 1
0 0
4
F 0
0 0
0 0
0 1
0 0
0 0
0 0
0 0
0 0
0 1
P
0 0
0 0
0 0
1 0
0 0
1 1
1 0
0 1
0 0
5
In
cide
nce
per 1
00,0
00
M
0.
0 0.
0 0.
0 0.
0 0.
0 0.
0 0.
0 0.
0 0.
0 0.
0 6.
0 6.
2 7.
9 0.
0 0.
0 15
.2
0.0
0.0
1.
7 0.
1 1.
0 1.
5
F 0.
0 0.
0 0.
0 0.
0 0.
0 0.
0 6.
3 0.
0 0.
0 0.
0 0.
0 0.
0 0.
0 0.
0 0.
0 0.
0 0.
0 0.
0
0.4
0.0
0.4
0.5
P
0.0
0.0
0.0
0.0
0.0
0.0
3.3
0.0
0.0
0.0
2.9
3.1
4.0
0.0
0.0
7.0
0.0
0.0
1.
0 0.
1 0.
7 1.
0 D
eath
s
M
0 0
0 0
0 0
0 0
0 0
0 0
0 0
0 0
0 0
0
F 0
0 0
0 0
0 0
0 0
0 0
0 0
0 0
0 0
0 0
P
0 0
0 0
0 0
0 0
0 0
0 0
0 0
0 0
0 0
0
M
orta
lity
per 1
00,0
00
M
0.
0 0.
0 0.
0 0.
0 0.
0 0.
0 0.
0 0.
0 0.
0 0.
0 0.
0 0.
0 0.
0 0.
0 0.
0 0.
0 0.
0 0.
0
0.0
0.0
0.0
0.0
F
0.0
0.0
0.0
0.0
0.0
0.0
0.0
0.0
0.0
0.0
0.0
0.0
0.0
0.0
0.0
0.0
0.0
0.0
0.
0 0.
0 0.
0 0.
0
P 0.
0 0.
0 0.
0 0.
0 0.
0 0.
0 0.
0 0.
0 0.
0 0.
0 0.
0 0.
0 0.
0 0.
0 0.
0 0.
0 0.
0 0.
0
0.0
0.0
0.0
0.0
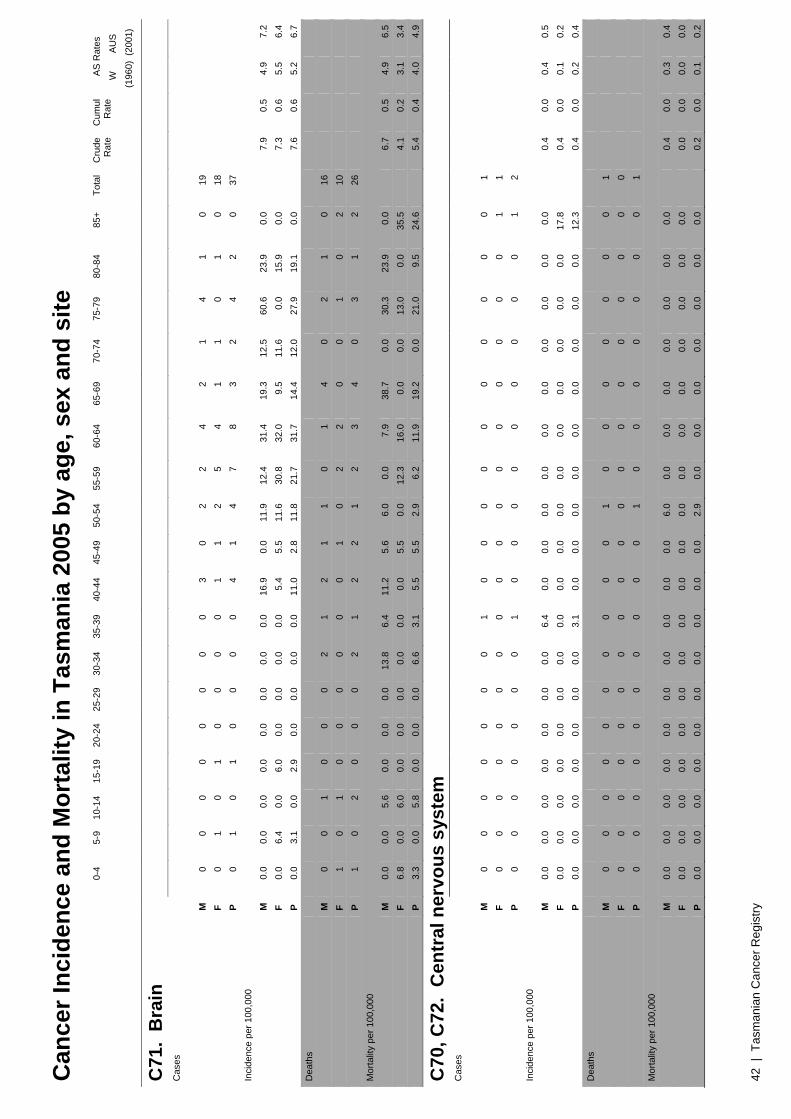
Can
cer I
ncid
ence
and
Mor
talit
y in
Tas
man
ia 2
005
by a
ge, s
ex a
nd s
ite
42 |
Tas
man
ian
Can
cer R
egis
try
0-
4 5-
9 10
-14
15-1
9 20
-24
25-2
9 30
-34
35-3
9 40
-44
45-4
9 50
-54
55-5
9 60
-64
65-6
9 70
-74
75-7
9 80
-84
85+
Tota
l C
rude
R
ate
Cum
ul
Rat
e AS
Rat
es
W
AU
S
(196
0) (
2001
)
C71
. B
rain
C
ases
M
0 0
0 0
0 0
0 0
3 0
2 2
4 2
1 4
1 0
19
F
0 1
0 1
0 0
0 0
1 1
2 5
4 1
1 0
1 0
18
P
0 1
0 1
0 0
0 0
4 1
4 7
8 3
2 4
2 0
37
Inci
denc
e pe
r 100
,000
M
0.0
0.0
0.0
0.0
0.0
0.0
0.0
0.0
16.9
0.
0 11
.9
12.4
31
.4
19.3
12
.5
60.6
23
.9
0.0
7.
9 0.
5 4.
9 7.
2
F 0.
0 6.
4 0.
0 6.
0 0.
0 0.
0 0.
0 0.
0 5.
4 5.
5 11
.6
30.8
32
.0
9.5
11.6
0.
0 15
.9
0.0
7.
3 0.
6 5.
5 6.
4
P 0.
0 3.
1 0.
0 2.
9 0.
0 0.
0 0.
0 0.
0 11
.0
2.8
11.8
21
.7
31.7
14
.4
12.0
27
.9
19.1
0.
0
7.6
0.6
5.2
6.7
Dea
ths
M
0
0 1
0 0
0 2
1 2
1 1
0 1
4 0
2 1
0 16
F 1
0 1
0 0
0 0
0 0
1 0
2 2
0 0
1 0
2 10
P 1
0 2
0 0
0 2
1 2
2 1
2 3
4 0
3 1
2 26
M
orta
lity
per 1
00,0
00
M
0.
0 0.
0 5.
6 0.
0 0.
0 0.
0 13
.8
6.4
11.2
5.
6 6.
0 0.
0 7.
9 38
.7
0.0
30.3
23
.9
0.0
6.
7 0.
5 4.
9 6.
5
F 6.
8 0.
0 6.
0 0.
0 0.
0 0.
0 0.
0 0.
0 0.
0 5.
5 0.
0 12
.3
16.0
0.
0 0.
0 13
.0
0.0
35.5
4.1
0.2
3.1
3.4
P
3.3
0.0
5.8
0.0
0.0
0.0
6.6
3.1
5.5
5.5
2.9
6.2
11.9
19
.2
0.0
21.0
9.
5 24
.6
5.
4 0.
4 4.
0 4.
9
C70
, C72
. C
entr
al n
ervo
us s
yste
m
Cas
es
M
0
0 0
0 0
0 0
1 0
0 0
0 0
0 0
0 0
0 1
F
0 0
0 0
0 0
0 0
0 0
0 0
0 0
0 0
0 1
1
P 0
0 0
0 0
0 0
1 0
0 0
0 0
0 0
0 0
1 2
Inci
denc
e pe
r 100
,000
M
0.0
0.0
0.0
0.0
0.0
0.0
0.0
6.4
0.0
0.0
0.0
0.0
0.0
0.0
0.0
0.0
0.0
0.0
0.
4 0.
0 0.
4 0.
5
F 0.
0 0.
0 0.
0 0.
0 0.
0 0.
0 0.
0 0.
0 0.
0 0.
0 0.
0 0.
0 0.
0 0.
0 0.
0 0.
0 0.
0 17
.8
0.
4 0.
0 0.
1 0.
2
P 0.
0 0.
0 0.
0 0.
0 0.
0 0.
0 0.
0 3.
1 0.
0 0.
0 0.
0 0.
0 0.
0 0.
0 0.
0 0.
0 0.
0 12
.3
0.
4 0.
0 0.
2 0.
4 D
eath
s
M
0 0
0 0
0 0
0 0
0 0
1 0
0 0
0 0
0 0
1
F 0
0 0
0 0
0 0
0 0
0 0
0 0
0 0
0 0
0 0
P
0 0
0 0
0 0
0 0
0 0
1 0
0 0
0 0
0 0
1
M
orta
lity
per 1
00,0
00
M
0.
0 0.
0 0.
0 0.
0 0.
0 0.
0 0.
0 0.
0 0.
0 0.
0 6.
0 0.
0 0.
0 0.
0 0.
0 0.
0 0.
0 0.
0
0.4
0.0
0.3
0.4
F
0.0
0.0
0.0
0.0
0.0
0.0
0.0
0.0
0.0
0.0
0.0
0.0
0.0
0.0
0.0
0.0
0.0
0.0
0.
0 0.
0 0.
0 0.
0
P 0.
0 0.
0 0.
0 0.
0 0.
0 0.
0 0.
0 0.
0 0.
0 0.
0 2.
9 0.
0 0.
0 0.
0 0.
0 0.
0 0.
0 0.
0
0.2
0.0
0.1
0.2

Can
cer I
ncid
ence
and
Mor
talit
y in
Tas
man
ia 2
005
by a
ge, s
ex a
nd s
ite
Tasm
ania
n C
ance
r Reg
istry
| 4
3
0-
4 5-
9 10
-14
15-1
9 20
-24
25-2
9 30
-34
35-3
9 40
-44
45-4
9 50
-54
55-5
9 60
-64
65-6
9 70
-74
75-7
9 80
-84
85+
Tota
l C
rude
R
ate
Cum
ul
Rat
e AS
Rat
es
W
AU
S
(196
0) (
2001
)
C73
. Th
yroi
d C
ases
M
0 0
0 0
0 0
0 1
0 0
1 0
0 0
3 0
0 0
5
F 0
0 0
0 0
0 2
2 4
3 3
2 1
1 1
1 0
0 20
P 0
0 0
0 0
0 2
3 4
3 4
2 1
1 4
1 0
0 25
In
cide
nce
per 1
00,0
00
M
0.
0 0.
0 0.
0 0.
0 0.
0 0.
0 0.
0 6.
4 0.
0 0.
0 6.
0 0.
0 0.
0 0.
0 37
.4
0.0
0.0
0.0
2.
1 0.
2 1.
4 2.
1
F 0.
0 0.
0 0.
0 0.
0 0.
0 0.
0 12
.6
12.1
21
.6
16.4
17
.5
12.3
8.
0 9.
5 11
.6
13.0
0.
0 0.
0
8.1
0.6
6.1
7.9
P
0.0
0.0
0.0
0.0
0.0
0.0
6.6
9.3
11.0
8.
3 11
.8
6.2
4.0
4.8
24.0
7.
0 0.
0 0.
0
5.2
0.4
3.8
5.1
Dea
ths
M
0
0 0
0 0
0 0
0 0
0 0
0 0
0 0
0 0
0 0
F
0 0
0 0
0 0
0 0
0 0
0 0
0 0
0 0
0 1
1
P 0
0 0
0 0
0 0
0 0
0 0
0 0
0 0
0 0
1 1
Mor
talit
y pe
r 100
,000
M
0.0
0.0
0.0
0.0
0.0
0.0
0.0
0.0
0.0
0.0
0.0
0.0
0.0
0.0
0.0
0.0
0.0
0.0
0.
0 0.
0 0.
0 0.
0
F 0.
0 0.
0 0.
0 0.
0 0.
0 0.
0 0.
0 0.
0 0.
0 0.
0 0.
0 0.
0 0.
0 0.
0 0.
0 0.
0 0.
0 17
.8
0.
4 0.
0 0.
1 0.
2
P 0.
0 0.
0 0.
0 0.
0 0.
0 0.
0 0.
0 0.
0 0.
0 0.
0 0.
0 0.
0 0.
0 0.
0 0.
0 0.
0 0.
0 12
.3
0.
2 0.
0 0.
1 0.
2
C74
, C75
. O
ther
end
ocrin
e C
ases
M
0 0
0 0
0 0
0 1
1 0
0 0
0 0
0 0
0 0
2
F 0
0 0
0 0
0 0
0 0
0 0
0 0
0 0
0 0
0 0
P
0 0
0 0
0 0
0 1
1 0
0 0
0 0
0 0
0 0
2
In
cide
nce
per 1
00,0
00
M
0.
0 0.
0 0.
0 0.
0 0.
0 0.
0 0.
0 6.
4 5.
6 0.
0 0.
0 0.
0 0.
0 0.
0 0.
0 0.
0 0.
0 0.
0
0.8
0.1
0.7
0.9
F
0.0
0.0
0.0
0.0
0.0
0.0
0.0
0.0
0.0
0.0
0.0
0.0
0.0
0.0
0.0
0.0
0.0
0.0
0.
0 0.
0 0.
0 0.
0
P 0.
0 0.
0 0.
0 0.
0 0.
0 0.
0 0.
0 3.
1 2.
8 0.
0 0.
0 0.
0 0.
0 0.
0 0.
0 0.
0 0.
0 0.
0
0.4
0.0
0.4
0.4
Dea
ths
M
0
0 0
0 0
0 0
0 0
0 0
0 0
0 0
0 0
0 0
F
0 0
0 0
0 0
0 0
0 0
0 1
0 0
0 0
0 0
1
P 0
0 0
0 0
0 0
0 0
0 0
1 0
0 0
0 0
0 1
Mor
talit
y pe
r 100
,000
M
0.0
0.0
0.0
0.0
0.0
0.0
0.0
0.0
0.0
0.0
0.0
0.0
0.0
0.0
0.0
0.0
0.0
0.0
0.
0 0.
0 0.
0 0.
0
F 0.
0 0.
0 0.
0 0.
0 0.
0 0.
0 0.
0 0.
0 0.
0 0.
0 0.
0 6.
2 0.
0 0.
0 0.
0 0.
0 0.
0 0.
0
0.4
0.0
0.2
0.3
P
0.0
0.0
0.0
0.0
0.0
0.0
0.0
0.0
0.0
0.0
0.0
3.1
0.0
0.0
0.0
0.0
0.0
0.0
0.
2 0.
0 0.
1 0.
2

Can
cer I
ncid
ence
and
Mor
talit
y in
Tas
man
ia 2
005
by a
ge, s
ex a
nd s
ite
44 |
Tas
man
ian
Can
cer R
egis
try
0-
4 5-
9 10
-14
15-1
9 20
-24
25-2
9 30
-34
35-3
9 40
-44
45-4
9 50
-54
55-5
9 60
-64
65-6
9 70
-74
75-7
9 80
-84
85+
Tota
l C
rude
R
ate
Cum
ul
Rat
e AS
Rat
es
W
AU
S
(196
0) (
2001
)
C81
. H
odgk
in d
isea
se
Cas
es
M
0
0 0
2 1
0 1
0 0
0 0
1 0
0 0
0 1
1 7
F
0 0
0 1
1 1
1 0
1 0
1 1
0 1
0 0
0 0
8
P 0
0 0
3 2
1 2
0 1
0 1
2 0
1 0
0 1
1 15
In
cide
nce
per 1
00,0
00
M
0.
0 0.
0 0.
0 11
.4
6.2
0.0
6.9
0.0
0.0
0.0
0.0
6.2
0.0
0.0
0.0
0.0
23.9
40
.3
2.
9 0.
2 2.
5 3.
0
F 0.
0 0.
0 0.
0 6.
0 6.
7 7.
5 6.
3 0.
0 5.
4 0.
0 5.
8 6.
2 0.
0 9.
5 0.
0 0.
0 0.
0 0.
0
3.3
0.3
3.2
3.3
P
0.0
0.0
0.0
8.8
6.5
3.8
6.6
0.0
2.8
0.0
2.9
6.2
0.0
4.8
0.0
0.0
9.5
12.3
3.1
0.2
2.8
3.0
Dea
ths
M
0
0 0
0 0
0 1
0 0
0 0
0 0
0 0
1 1
0 3
F
0 0
0 0
0 0
0 0
0 0
0 0
0 0
0 0
0 0
0
P 0
0 0
0 0
0 1
0 0
0 0
0 0
0 0
1 1
0 3
Mor
talit
y pe
r 100
,000
M
0.0
0.0
0.0
0.0
0.0
0.0
6.9
0.0
0.0
0.0
0.0
0.0
0.0
0.0
0.0
15.2
23
.9
0.0
1.
3 0.
0 0.
7 1.
3
F 0.
0 0.
0 0.
0 0.
0 0.
0 0.
0 0.
0 0.
0 0.
0 0.
0 0.
0 0.
0 0.
0 0.
0 0.
0 0.
0 0.
0 0.
0
0.0
0.0
0.0
0.0
P
0.0
0.0
0.0
0.0
0.0
0.0
3.3
0.0
0.0
0.0
0.0
0.0
0.0
0.0
0.0
7.0
9.5
0.0
0.
6 0.
0 0.
3 0.
6
C82
. N
odul
ar N
HL
Cas
es
M
0
0 0
0 0
0 0
0 3
0 0
1 2
0 0
3 1
1 11
F 0
0 0
0 0
0 0
0 2
1 2
0 0
1 4
1 1
0 12
P 0
0 0
0 0
0 0
0 5
1 2
1 2
1 4
4 2
1 23
In
cide
nce
per 1
00,0
00
M
0.
0 0.
0 0.
0 0.
0 0.
0 0.
0 0.
0 0.
0 16
.9
0.0
0.0
6.2
15.7
0.
0 0.
0 45
.5
23.9
40
.3
4.
6 0.
2 2.
7 4.
4
F 0.
0 0.
0 0.
0 0.
0 0.
0 0.
0 0.
0 0.
0 10
.8
5.5
11.6
0.
0 0.
0 9.
5 46
.2
13.0
15
.9
0.0
4.
9 0.
4 3.
0 4.
5
P 0.
0 0.
0 0.
0 0.
0 0.
0 0.
0 0.
0 0.
0 13
.8
2.8
5.9
3.1
7.9
4.8
24.0
27
.9
19.1
12
.3
4.
7 0.
3 2.
8 4.
3 D
eath
s
M
0 0
0 0
0 0
0 0
0 0
0 1
0 0
0 0
2 0
3
F 0
0 0
0 0
0 0
0 0
0 0
0 0
0 1
0 1
1 3
P
0 0
0 0
0 0
0 0
0 0
0 1
0 0
1 0
3 1
6
M
orta
lity
per 1
00,0
00
M
0.
0 0.
0 0.
0 0.
0 0.
0 0.
0 0.
0 0.
0 0.
0 0.
0 0.
0 6.
2 0.
0 0.
0 0.
0 0.
0 47
.9
0.0
1.
3 0.
0 0.
5 1.
1
F 0.
0 0.
0 0.
0 0.
0 0.
0 0.
0 0.
0 0.
0 0.
0 0.
0 0.
0 0.
0 0.
0 0.
0 11
.6
0.0
15.9
17
.8
1.
2 0.
1 0.
4 0.
9
P 0.
0 0.
0 0.
0 0.
0 0.
0 0.
0 0.
0 0.
0 0.
0 0.
0 0.
0 3.
1 0.
0 0.
0 6.
0 0.
0 28
.6
12.3
1.2
0.0
0.4
1.0
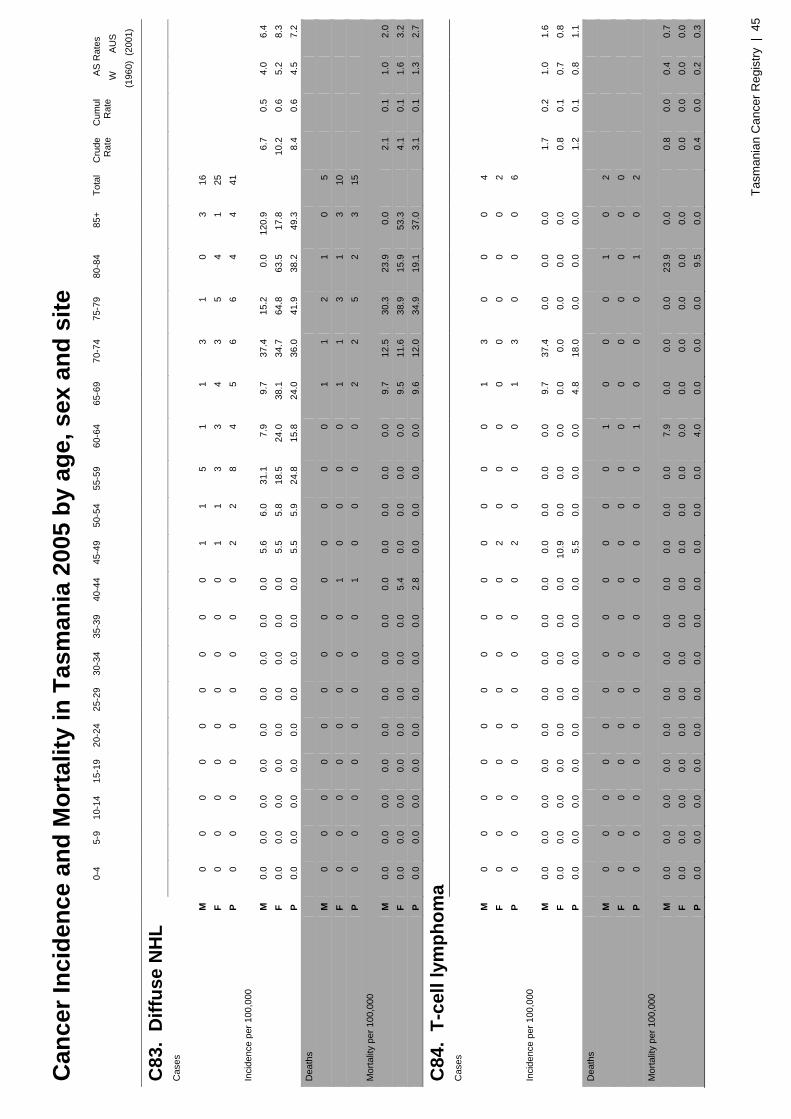
Can
cer I
ncid
ence
and
Mor
talit
y in
Tas
man
ia 2
005
by a
ge, s
ex a
nd s
ite
Tasm
ania
n C
ance
r Reg
istry
| 4
5
0-
4 5-
9 10
-14
15-1
9 20
-24
25-2
9 30
-34
35-3
9 40
-44
45-4
9 50
-54
55-5
9 60
-64
65-6
9 70
-74
75-7
9 80
-84
85+
Tota
l C
rude
R
ate
Cum
ul
Rat
e AS
Rat
es
W
AU
S
(196
0) (
2001
)
C83
. D
iffus
e N
HL
Cas
es
M
0
0 0
0 0
0 0
0 0
1 1
5 1
1 3
1 0
3 16
F 0
0 0
0 0
0 0
0 0
1 1
3 3
4 3
5 4
1 25
P 0
0 0
0 0
0 0
0 0
2 2
8 4
5 6
6 4
4 41
In
cide
nce
per 1
00,0
00
M
0.
0 0.
0 0.
0 0.
0 0.
0 0.
0 0.
0 0.
0 0.
0 5.
6 6.
0 31
.1
7.9
9.7
37.4
15
.2
0.0
120.
9
6.7
0.5
4.0
6.4
F
0.0
0.0
0.0
0.0
0.0
0.0
0.0
0.0
0.0
5.5
5.8
18.5
24
.0
38.1
34
.7
64.8
63
.5
17.8
10.2
0.
6 5.
2 8.
3
P 0.
0 0.
0 0.
0 0.
0 0.
0 0.
0 0.
0 0.
0 0.
0 5.
5 5.
9 24
.8
15.8
24
.0
36.0
41
.9
38.2
49
.3
8.
4 0.
6 4.
5 7.
2 D
eath
s
M
0 0
0 0
0 0
0 0
0 0
0 0
0 1
1 2
1 0
5
F 0
0 0
0 0
0 0
0 1
0 0
0 0
1 1
3 1
3 10
P 0
0 0
0 0
0 0
0 1
0 0
0 0
2 2
5 2
3 15
M
orta
lity
per 1
00,0
00
M
0.
0 0.
0 0.
0 0.
0 0.
0 0.
0 0.
0 0.
0 0.
0 0.
0 0.
0 0.
0 0.
0 9.
7 12
.5
30.3
23
.9
0.0
2.
1 0.
1 1.
0 2.
0
F 0.
0 0.
0 0.
0 0.
0 0.
0 0.
0 0.
0 0.
0 5.
4 0.
0 0.
0 0.
0 0.
0 9.
5 11
.6
38.9
15
.9
53.3
4.1
0.1
1.6
3.2
P
0.0
0.0
0.0
0.0
0.0
0.0
0.0
0.0
2.8
0.0
0.0
0.0
0.0
9.6
12.0
34
.9
19.1
37
.0
3.
1 0.
1 1.
3 2.
7
C84
. T-
cell
lym
phom
a C
ases
M
0 0
0 0
0 0
0 0
0 0
0 0
0 1
3 0
0 0
4
F 0
0 0
0 0
0 0
0 0
2 0
0 0
0 0
0 0
0 2
P
0 0
0 0
0 0
0 0
0 2
0 0
0 1
3 0
0 0
6
In
cide
nce
per 1
00,0
00
M
0.
0 0.
0 0.
0 0.
0 0.
0 0.
0 0.
0 0.
0 0.
0 0.
0 0.
0 0.
0 0.
0 9.
7 37
.4
0.0
0.0
0.0
1.
7 0.
2 1.
0 1.
6
F 0.
0 0.
0 0.
0 0.
0 0.
0 0.
0 0.
0 0.
0 0.
0 10
.9
0.0
0.0
0.0
0.0
0.0
0.0
0.0
0.0
0.
8 0.
1 0.
7 0.
8
P 0.
0 0.
0 0.
0 0.
0 0.
0 0.
0 0.
0 0.
0 0.
0 5.
5 0.
0 0.
0 0.
0 4.
8 18
.0
0.0
0.0
0.0
1.
2 0.
1 0.
8 1.
1 D
eath
s
M
0 0
0 0
0 0
0 0
0 0
0 0
1 0
0 0
1 0
2
F 0
0 0
0 0
0 0
0 0
0 0
0 0
0 0
0 0
0 0
P
0 0
0 0
0 0
0 0
0 0
0 0
1 0
0 0
1 0
2
M
orta
lity
per 1
00,0
00
M
0.
0 0.
0 0.
0 0.
0 0.
0 0.
0 0.
0 0.
0 0.
0 0.
0 0.
0 0.
0 7.
9 0.
0 0.
0 0.
0 23
.9
0.0
0.
8 0.
0 0.
4 0.
7
F 0.
0 0.
0 0.
0 0.
0 0.
0 0.
0 0.
0 0.
0 0.
0 0.
0 0.
0 0.
0 0.
0 0.
0 0.
0 0.
0 0.
0 0.
0
0.0
0.0
0.0
0.0
P
0.0
0.0
0.0
0.0
0.0
0.0
0.0
0.0
0.0
0.0
0.0
0.0
4.0
0.0
0.0
0.0
9.5
0.0
0.
4 0.
0 0.
2 0.
3
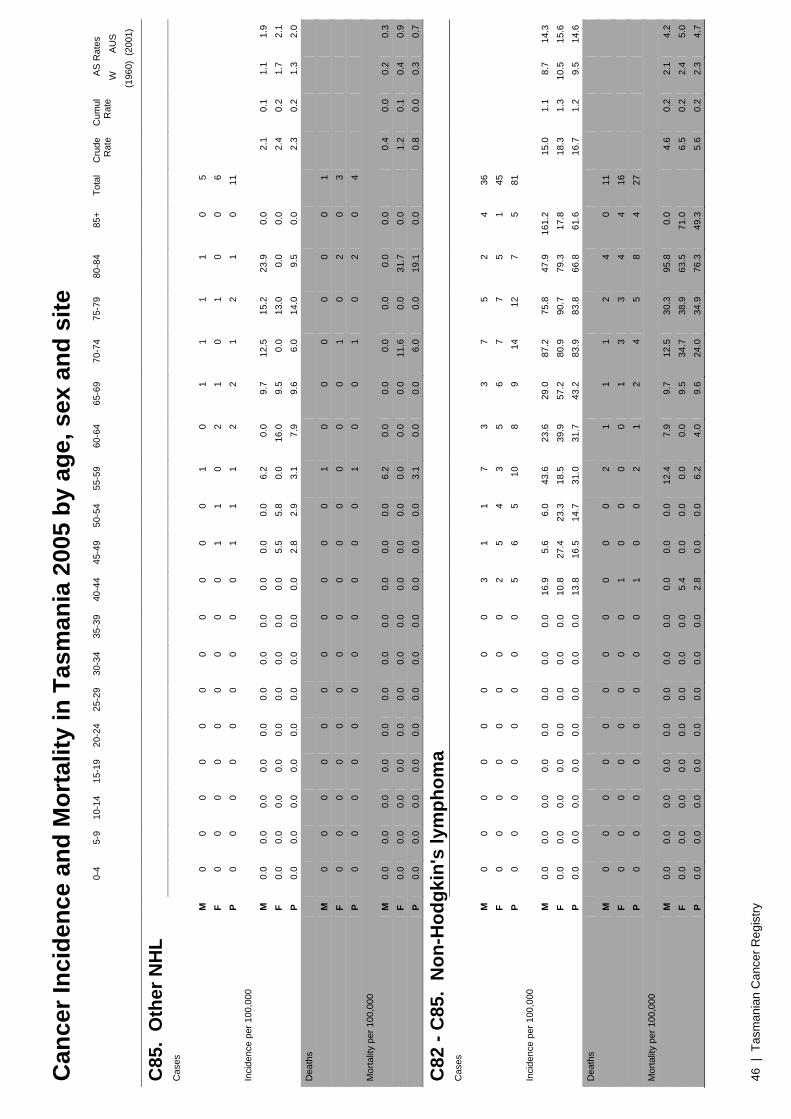
Can
cer I
ncid
ence
and
Mor
talit
y in
Tas
man
ia 2
005
by a
ge, s
ex a
nd s
ite
46 |
Tas
man
ian
Can
cer R
egis
try
0-
4 5-
9 10
-14
15-1
9 20
-24
25-2
9 30
-34
35-3
9 40
-44
45-4
9 50
-54
55-5
9 60
-64
65-6
9 70
-74
75-7
9 80
-84
85+
Tota
l C
rude
R
ate
Cum
ul
Rat
e AS
Rat
es
W
AU
S
(196
0) (
2001
)
C85
. O
ther
NH
L C
ases
M
0 0
0 0
0 0
0 0
0 0
0 1
0 1
1 1
1 0
5
F 0
0 0
0 0
0 0
0 0
1 1
0 2
1 0
1 0
0 6
P
0 0
0 0
0 0
0 0
0 1
1 1
2 2
1 2
1 0
11
Inci
denc
e pe
r 100
,000
M
0.0
0.0
0.0
0.0
0.0
0.0
0.0
0.0
0.0
0.0
0.0
6.2
0.0
9.7
12.5
15
.2
23.9
0.
0
2.1
0.1
1.1
1.9
F
0.0
0.0
0.0
0.0
0.0
0.0
0.0
0.0
0.0
5.5
5.8
0.0
16.0
9.
5 0.
0 13
.0
0.0
0.0
2.
4 0.
2 1.
7 2.
1
P 0.
0 0.
0 0.
0 0.
0 0.
0 0.
0 0.
0 0.
0 0.
0 2.
8 2.
9 3.
1 7.
9 9.
6 6.
0 14
.0
9.5
0.0
2.
3 0.
2 1.
3 2.
0 D
eath
s
M
0 0
0 0
0 0
0 0
0 0
0 1
0 0
0 0
0 0
1
F 0
0 0
0 0
0 0
0 0
0 0
0 0
0 1
0 2
0 3
P
0 0
0 0
0 0
0 0
0 0
0 1
0 0
1 0
2 0
4
M
orta
lity
per 1
00,0
00
M
0.
0 0.
0 0.
0 0.
0 0.
0 0.
0 0.
0 0.
0 0.
0 0.
0 0.
0 6.
2 0.
0 0.
0 0.
0 0.
0 0.
0 0.
0
0.4
0.0
0.2
0.3
F
0.0
0.0
0.0
0.0
0.0
0.0
0.0
0.0
0.0
0.0
0.0
0.0
0.0
0.0
11.6
0.
0 31
.7
0.0
1.
2 0.
1 0.
4 0.
9
P 0.
0 0.
0 0.
0 0.
0 0.
0 0.
0 0.
0 0.
0 0.
0 0.
0 0.
0 3.
1 0.
0 0.
0 6.
0 0.
0 19
.1
0.0
0.
8 0.
0 0.
3 0.
7
C82
- C
85.
Non
-Hod
gkin
's ly
mph
oma
Cas
es
M
0
0 0
0 0
0 0
0 3
1 1
7 3
3 7
5 2
4 36
F 0
0 0
0 0
0 0
0 2
5 4
3 5
6 7
7 5
1 45
P 0
0 0
0 0
0 0
0 5
6 5
10
8 9
14
12
7 5
81
Inci
denc
e pe
r 100
,000
M
0.0
0.0
0.0
0.0
0.0
0.0
0.0
0.0
16.9
5.
6 6.
0 43
.6
23.6
29
.0
87.2
75
.8
47.9
16
1.2
15
.0
1.1
8.7
14.3
F 0.
0 0.
0 0.
0 0.
0 0.
0 0.
0 0.
0 0.
0 10
.8
27.4
23
.3
18.5
39
.9
57.2
80
.9
90.7
79
.3
17.8
18.3
1.
3 10
.5
15.6
P 0.
0 0.
0 0.
0 0.
0 0.
0 0.
0 0.
0 0.
0 13
.8
16.5
14
.7
31.0
31
.7
43.2
83
.9
83.8
66
.8
61.6
16.7
1.
2 9.
5 14
.6
Dea
ths
M
0
0 0
0 0
0 0
0 0
0 0
2 1
1 1
2 4
0 11
F 0
0 0
0 0
0 0
0 1
0 0
0 0
1 3
3 4
4 16
P 0
0 0
0 0
0 0
0 1
0 0
2 1
2 4
5 8
4 27
M
orta
lity
per 1
00,0
00
M
0.
0 0.
0 0.
0 0.
0 0.
0 0.
0 0.
0 0.
0 0.
0 0.
0 0.
0 12
.4
7.9
9.7
12.5
30
.3
95.8
0.
0
4.6
0.2
2.1
4.2
F
0.0
0.0
0.0
0.0
0.0
0.0
0.0
0.0
5.4
0.0
0.0
0.0
0.0
9.5
34.7
38
.9
63.5
71
.0
6.
5 0.
2 2.
4 5.
0
P 0.
0 0.
0 0.
0 0.
0 0.
0 0.
0 0.
0 0.
0 2.
8 0.
0 0.
0 6.
2 4.
0 9.
6 24
.0
34.9
76
.3
49.3
5.6
0.2
2.3
4.7

Can
cer I
ncid
ence
and
Mor
talit
y in
Tas
man
ia 2
005
by a
ge, s
ex a
nd s
ite
Tasm
ania
n C
ance
r Reg
istry
| 4
7
0-
4 5-
9 10
-14
15-1
9 20
-24
25-2
9 30
-34
35-3
9 40
-44
45-4
9 50
-54
55-5
9 60
-64
65-6
9 70
-74
75-7
9 80
-84
85+
Tota
l C
rude
R
ate
Cum
ul
Rat
e AS
Rat
es
W
AU
S
(196
0) (
2001
)
C81
- C
85.
All
lym
phom
as
Cas
es
M
0
0 0
2 1
0 1
0 3
1 1
8 3
3 7
5 3
5 43
F 0
0 0
1 1
1 1
0 3
5 5
4 5
7 7
7 5
1 53
P 0
0 0
3 2
1 2
0 6
6 6
12
8 10
14
12
8
6 96
In
cide
nce
per 1
00,0
00
M
0.
0 0.
0 0.
0 11
.4
6.2
0.0
6.9
0.0
16.9
5.
6 6.
0 49
.8
23.6
29
.0
87.2
75
.8
71.8
20
1.5
18
.0
1.2
11.3
17
.3
F
0.0
0.0
0.0
6.0
6.7
7.5
6.3
0.0
16.2
27
.4
29.1
24
.7
39.9
66
.8
80.9
90
.7
79.3
17
.8
21
.6
1.6
13.7
19
.0
P
0.0
0.0
0.0
8.8
6.5
3.8
6.6
0.0
16.5
16
.5
17.7
37
.2
31.7
48
.0
83.9
83
.8
76.3
73
.9
19
.8
1.4
12.3
17
.7
Dea
ths
M
0
0 0
0 0
0 1
0 0
0 0
2 1
1 1
3 5
0 14
F 0
0 0
0 0
0 0
0 1
0 0
0 0
1 3
3 4
4 16
P 0
0 0
0 0
0 1
0 1
0 0
2 1
2 4
6 9
4 30
M
orta
lity
per 1
00,0
00
M
0.
0 0.
0 0.
0 0.
0 0.
0 0.
0 6.
9 0.
0 0.
0 0.
0 0.
0 12
.4
7.9
9.7
12.5
45
.5
119.
7 0.
0
5.8
0.2
2.8
5.5
F
0.0
0.0
0.0
0.0
0.0
0.0
0.0
0.0
5.4
0.0
0.0
0.0
0.0
9.5
34.7
38
.9
63.5
71
.0
6.
5 0.
2 2.
4 5.
0
P 0.
0 0.
0 0.
0 0.
0 0.
0 0.
0 3.
3 0.
0 2.
8 0.
0 0.
0 6.
2 4.
0 9.
6 24
.0
41.9
85
.9
49.3
6.2
0.2
2.6
5.3
C88
. Im
mun
opro
lifer
ativ
e di
seas
es
Cas
es
M
0
0 0
0 0
0 0
0 0
0 0
0 0
0 1
1 0
0 2
F
0 0
0 0
0 0
0 0
0 0
0 0
0 0
0 0
1 0
1
P 0
0 0
0 0
0 0
0 0
0 0
0 0
0 1
1 1
0 3
Inci
denc
e pe
r 100
,000
M
0.0
0.0
0.0
0.0
0.0
0.0
0.0
0.0
0.0
0.0
0.0
0.0
0.0
0.0
12.5
15
.2
0.0
0.0
0.
8 0.
1 0.
4 0.
8
F 0.
0 0.
0 0.
0 0.
0 0.
0 0.
0 0.
0 0.
0 0.
0 0.
0 0.
0 0.
0 0.
0 0.
0 0.
0 0.
0 15
.9
0.0
0.
4 0.
0 0.
1 0.
3
P 0.
0 0.
0 0.
0 0.
0 0.
0 0.
0 0.
0 0.
0 0.
0 0.
0 0.
0 0.
0 0.
0 0.
0 6.
0 7.
0 9.
5 0.
0
0.6
0.0
0.2
0.5
Dea
ths
M
0
0 0
0 0
0 0
0 0
0 0
0 0
0 0
0 0
0 0
F
0 0
0 0
0 0
0 0
0 0
0 0
0 0
0 0
0 0
0
P 0
0 0
0 0
0 0
0 0
0 0
0 0
0 0
0 0
0 0
Mor
talit
y pe
r 100
,000
M
0.0
0.0
0.0
0.0
0.0
0.0
0.0
0.0
0.0
0.0
0.0
0.0
0.0
0.0
0.0
0.0
0.0
0.0
0.
0 0.
0 0.
0 0.
0
F 0.
0 0.
0 0.
0 0.
0 0.
0 0.
0 0.
0 0.
0 0.
0 0.
0 0.
0 0.
0 0.
0 0.
0 0.
0 0.
0 0.
0 0.
0
0.0
0.0
0.0
0.0
P
0.0
0.0
0.0
0.0
0.0
0.0
0.0
0.0
0.0
0.0
0.0
0.0
0.0
0.0
0.0
0.0
0.0
0.0
0.
0 0.
0 0.
0 0.
0

Can
cer I
ncid
ence
and
Mor
talit
y in
Tas
man
ia 2
005
by a
ge, s
ex a
nd s
ite
48 |
Tas
man
ian
Can
cer R
egis
try
0-
4 5-
9 10
-14
15-1
9 20
-24
25-2
9 30
-34
35-3
9 40
-44
45-4
9 50
-54
55-5
9 60
-64
65-6
9 70
-74
75-7
9 80
-84
85+
Tota
l C
rude
R
ate
Cum
ul
Rat
e AS
Rat
es
W
AU
S
(196
0) (
2001
)
C90
. M
ultip
le m
yelo
ma
Cas
es
M
0
0 0
0 0
0 0
0 0
0 2
2 4
1 4
3 1
3 20
F 0
0 0
0 0
0 0
0 0
0 0
3 1
1 1
3 2
1 12
P 0
0 0
0 0
0 0
0 0
0 2
5 5
2 5
6 3
4 32
In
cide
nce
per 1
00,0
00
M
0.
0 0.
0 0.
0 0.
0 0.
0 0.
0 0.
0 0.
0 0.
0 0.
0 11
.9
12.4
31
.4
9.7
49.8
45
.5
23.9
12
0.9
8.
4 0.
6 4.
8 8.
0
F 0.
0 0.
0 0.
0 0.
0 0.
0 0.
0 0.
0 0.
0 0.
0 0.
0 0.
0 18
.5
8.0
9.5
11.6
38
.9
31.7
17
.8
4.
9 0.
2 2.
2 3.
8
P 0.
0 0.
0 0.
0 0.
0 0.
0 0.
0 0.
0 0.
0 0.
0 0.
0 5.
9 15
.5
19.8
9.
6 30
.0
41.9
28
.6
49.3
6.6
0.4
3.4
5.6
Dea
ths
M
0
0 0
0 0
0 0
0 0
1 2
1 0
2 0
3 1
1 11
F 0
0 0
0 0
0 0
0 0
0 0
1 0
1 2
3 1
2 10
P 0
0 0
0 0
0 0
0 0
1 2
2 0
3 2
6 2
3 21
M
orta
lity
per 1
00,0
00
M
0.
0 0.
0 0.
0 0.
0 0.
0 0.
0 0.
0 0.
0 0.
0 5.
6 11
.9
6.2
0.0
19.3
0.
0 45
.5
23.9
40
.3
4.
6 0.
2 2.
5 4.
4
F 0.
0 0.
0 0.
0 0.
0 0.
0 0.
0 0.
0 0.
0 0.
0 0.
0 0.
0 6.
2 0.
0 9.
5 23
.1
38.9
15
.9
35.5
4.1
0.2
1.6
3.2
P
0.0
0.0
0.0
0.0
0.0
0.0
0.0
0.0
0.0
2.8
5.9
6.2
0.0
14.4
12
.0
41.9
19
.1
37.0
4.3
0.2
2.1
3.8
C91
. Ly
mph
oid
leuk
aem
ia
Cas
es
M
1
2 1
1 0
0 0
0 0
0 4
2 6
4 6
3 3
2 35
F 0
1 0
0 0
0 0
1 0
1 0
1 3
2 1
3 3
3 19
P 1
3 1
1 0
0 0
1 0
1 4
3 9
6 7
6 6
5 54
In
cide
nce
per 1
00,0
00
M
6.
5 12
.3
5.6
5.7
0.0
0.0
0.0
0.0
0.0
0.0
23.8
12
.4
47.2
38
.7
74.7
45
.5
71.8
80
.6
14
.6
1.1
10.5
13
.7
F
0.0
6.4
0.0
0.0
0.0
0.0
0.0
6.0
0.0
5.5
0.0
6.2
24.0
19
.1
11.6
38
.9
47.6
53
.3
7.
7 0.
4 4.
2 6.
3
P 3.
3 9.
4 2.
9 2.
9 0.
0 0.
0 0.
0 3.
1 0.
0 2.
8 11
.8
9.3
35.7
28
.8
42.0
41
.9
57.3
61
.6
11
.1
0.8
7.3
9.8
Dea
ths
M
0
0 0
0 1
0 0
0 0
0 0
0 0
0 2
0 1
0 4
F
0 0
0 0
0 0
0 0
0 0
0 1
0 0
0 1
1 2
5
P 0
0 0
0 1
0 0
0 0
0 0
1 0
0 2
1 2
2 9
Mor
talit
y pe
r 100
,000
M
0.0
0.0
0.0
0.0
6.2
0.0
0.0
0.0
0.0
0.0
0.0
0.0
0.0
0.0
24.9
0.
0 23
.9
0.0
1.
7 0.
2 1.
1 1.
6
F 0.
0 0.
0 0.
0 0.
0 0.
0 0.
0 0.
0 0.
0 0.
0 0.
0 0.
0 6.
2 0.
0 0.
0 0.
0 13
.0
15.9
35
.5
2.
0 0.
0 0.
6 1.
4
P 0.
0 0.
0 0.
0 0.
0 3.
2 0.
0 0.
0 0.
0 0.
0 0.
0 0.
0 3.
1 0.
0 0.
0 12
.0
7.0
19.1
24
.6
1.
9 0.
1 0.
9 1.
6

Can
cer I
ncid
ence
and
Mor
talit
y in
Tas
man
ia 2
005
by a
ge, s
ex a
nd s
ite
Tasm
ania
n C
ance
r Reg
istry
| 4
9
0-
4 5-
9 10
-14
15-1
9 20
-24
25-2
9 30
-34
35-3
9 40
-44
45-4
9 50
-54
55-5
9 60
-64
65-6
9 70
-74
75-7
9 80
-84
85+
Tota
l C
rude
R
ate
Cum
ul
Rat
e AS
Rat
es
W
AU
S
(196
0) (
2001
)
C91
.0.
Acu
te ly
mph
oid
leuk
aem
ia
Cas
es
M
1
2 0
0 0
0 0
0 0
0 0
0 0
0 1
0 0
0 4
F
0 0
0 0
0 0
0 1
0 0
0 0
0 1
0 0
0 0
2
P 1
2 0
0 0
0 0
1 0
0 0
0 0
1 1
0 0
0 6
Inci
denc
e pe
r 100
,000
M
6.5
12.3
0.
0 0.
0 0.
0 0.
0 0.
0 0.
0 0.
0 0.
0 0.
0 0.
0 0.
0 0.
0 12
.5
0.0
0.0
0.0
1.
7 0.
2 2.
3 1.
7
F 0.
0 0.
0 0.
0 0.
0 0.
0 0.
0 0.
0 6.
0 0.
0 0.
0 0.
0 0.
0 0.
0 9.
5 0.
0 0.
0 0.
0 0.
0
0.8
0.1
0.6
0.8
P
3.3
6.3
0.0
0.0
0.0
0.0
0.0
3.1
0.0
0.0
0.0
0.0
0.0
4.8
6.0
0.0
0.0
0.0
1.
2 0.
1 1.
5 1.
3 D
eath
s
M
0 0
0 0
1 0
0 0
0 0
0 0
0 0
1 0
0 0
2
F 0
0 0
0 0
0 0
0 0
0 0
0 0
0 0
0 0
0 0
P
0 0
0 0
1 0
0 0
0 0
0 0
0 0
1 0
0 0
2
M
orta
lity
per 1
00,0
00
M
0.
0 0.
0 0.
0 0.
0 6.
2 0.
0 0.
0 0.
0 0.
0 0.
0 0.
0 0.
0 0.
0 0.
0 12
.5
0.0
0.0
0.0
0.
8 0.
1 0.
7 0.
8
F 0.
0 0.
0 0.
0 0.
0 0.
0 0.
0 0.
0 0.
0 0.
0 0.
0 0.
0 0.
0 0.
0 0.
0 0.
0 0.
0 0.
0 0.
0
0.0
0.0
0.0
0.0
P
0.0
0.0
0.0
0.0
3.2
0.0
0.0
0.0
0.0
0.0
0.0
0.0
0.0
0.0
6.0
0.0
0.0
0.0
0.
4 0.
0 0.
4 0.
4
C91
.1.
Chr
onic
lym
phoi
d le
ukae
mia
C
ases
M
0 0
0 0
0 0
0 0
0 0
2 2
6 4
5 3
3 1
26
F
0 0
0 0
0 0
0 0
0 1
0 1
2 1
1 3
2 3
14
P
0 0
0 0
0 0
0 0
0 1
2 3
8 5
6 6
5 4
40
Inci
denc
e pe
r 100
,000
M
0.0
0.0
0.0
0.0
0.0
0.0
0.0
0.0
0.0
0.0
11.9
12
.4
47.2
38
.7
62.3
45
.5
71.8
40
.3
10
.9
0.9
6.4
9.8
F
0.0
0.0
0.0
0.0
0.0
0.0
0.0
0.0
0.0
5.5
0.0
6.2
16.0
9.
5 11
.6
38.9
31
.7
53.3
5.7
0.2
2.5
4.4
P
0.0
0.0
0.0
0.0
0.0
0.0
0.0
0.0
0.0
2.8
5.9
9.3
31.7
24
.0
36.0
41
.9
47.7
49
.3
8.
2 0.
5 4.
4 7.
0 D
eath
s
M
0 0
0 0
0 0
0 0
0 0
0 0
0 0
1 0
1 0
2
F 0
0 0
0 0
0 0
0 0
0 0
1 0
0 0
1 1
2 5
P
0 0
0 0
0 0
0 0
0 0
0 1
0 0
1 1
2 2
7
M
orta
lity
per 1
00,0
00
M
0.
0 0.
0 0.
0 0.
0 0.
0 0.
0 0.
0 0.
0 0.
0 0.
0 0.
0 0.
0 0.
0 0.
0 12
.5
0.0
23.9
0.
0
0.8
0.1
0.4
0.8
F
0.0
0.0
0.0
0.0
0.0
0.0
0.0
0.0
0.0
0.0
0.0
6.2
0.0
0.0
0.0
13.0
15
.9
35.5
2.0
0.0
0.6
1.4
P
0.0
0.0
0.0
0.0
0.0
0.0
0.0
0.0
0.0
0.0
0.0
3.1
0.0
0.0
6.0
7.0
19.1
24
.6
1.
4 0.
0 0.
5 1.
2

Can
cer I
ncid
ence
and
Mor
talit
y in
Tas
man
ia 2
005
by a
ge, s
ex a
nd s
ite
50 |
Tas
man
ian
Can
cer R
egis
try
0-
4 5-
9 10
-14
15-1
9 20
-24
25-2
9 30
-34
35-3
9 40
-44
45-4
9 50
-54
55-5
9 60
-64
65-6
9 70
-74
75-7
9 80
-84
85+
Tota
l C
rude
R
ate
Cum
ul
Rat
e AS
Rat
es
W
AU
S
(196
0) (
2001
)
C92
. M
yelo
id L
euka
emia
C
ases
M
1 0
0 0
0 1
0 1
0 0
0 0
2 2
1 1
0 1
10
F
0 0
1 0
0 0
1 0
1 0
0 1
1 0
0 2
0 0
7
P 1
0 1
0 0
1 1
1 1
0 0
1 3
2 1
3 0
1 17
In
cide
nce
per 1
00,0
00
M
6.
5 0.
0 0.
0 0.
0 0.
0 7.
5 0.
0 6.
4 0.
0 0.
0 0.
0 0.
0 15
.7
19.3
12
.5
15.2
0.
0 40
.3
4.
2 0.
3 3.
6 4.
2
F 0.
0 0.
0 6.
0 0.
0 0.
0 0.
0 6.
3 0.
0 5.
4 0.
0 0.
0 6.
2 8.
0 0.
0 0.
0 25
.9
0.0
0.0
2.
8 0.
2 2.
1 2.
7
P 3.
3 0.
0 2.
9 0.
0 0.
0 3.
8 3.
3 3.
1 2.
8 0.
0 0.
0 3.
1 11
.9
9.6
6.0
21.0
0.
0 12
.3
3.
5 0.
2 2.
8 3.
3 D
eath
s
M
0 0
0 0
0 0
0 0
0 0
1 1
2 2
1 0
1 1
9
F 0
0 0
0 0
0 0
0 0
0 0
0 0
3 1
1 2
0 7
P
0 0
0 0
0 0
0 0
0 0
1 1
2 5
2 1
3 1
16
Mor
talit
y pe
r 100
,000
M
0.0
0.0
0.0
0.0
0.0
0.0
0.0
0.0
0.0
0.0
6.0
6.2
15.7
19
.3
12.5
0.
0 23
.9
40.3
3.8
0.3
2.3
3.4
F
0.0
0.0
0.0
0.0
0.0
0.0
0.0
0.0
0.0
0.0
0.0
0.0
0.0
28.6
11
.6
13.0
31
.7
0.0
2.
8 0.
2 1.
4 2.
3
P 0.
0 0.
0 0.
0 0.
0 0.
0 0.
0 0.
0 0.
0 0.
0 0.
0 2.
9 3.
1 7.
9 24
.0
12.0
7.
0 28
.6
12.3
3.3
0.2
1.8
2.8
C92
.0.
Acu
te m
yelo
id le
ukae
mia
C
ases
M
1 0
0 0
0 0
0 0
0 0
0 0
2 1
0 1
0 0
5
F 0
0 0
0 0
0 0
0 0
0 0
1 0
0 0
1 0
0 2
P
1 0
0 0
0 0
0 0
0 0
0 1
2 1
0 2
0 0
7
In
cide
nce
per 1
00,0
00
M
6.
5 0.
0 0.
0 0.
0 0.
0 0.
0 0.
0 0.
0 0.
0 0.
0 0.
0 0.
0 15
.7
9.7
0.0
15.2
0.
0 0.
0
2.1
0.2
1.8
1.8
F
0.0
0.0
0.0
0.0
0.0
0.0
0.0
0.0
0.0
0.0
0.0
6.2
0.0
0.0
0.0
13.0
0.
0 0.
0
0.8
0.0
0.4
0.7
P
3.3
0.0
0.0
0.0
0.0
0.0
0.0
0.0
0.0
0.0
0.0
3.1
7.9
4.8
0.0
14.0
0.
0 0.
0
1.4
0.1
1.1
1.3
Dea
ths
M
0
0 0
0 0
0 0
0 0
0 0
1 2
1 0
0 0
0 4
F
0 0
0 0
0 0
0 0
0 0
0 0
0 1
0 1
2 0
4
P 0
0 0
0 0
0 0
0 0
0 0
1 2
2 0
1 2
0 8
Mor
talit
y pe
r 100
,000
M
0.0
0.0
0.0
0.0
0.0
0.0
0.0
0.0
0.0
0.0
0.0
6.2
15.7
9.
7 0.
0 0.
0 0.
0 0.
0
1.7
0.2
1.2
1.3
F
0.0
0.0
0.0
0.0
0.0
0.0
0.0
0.0
0.0
0.0
0.0
0.0
0.0
9.5
0.0
13.0
31
.7
0.0
1.
6 0.
0 0.
6 1.
2
P 0.
0 0.
0 0.
0 0.
0 0.
0 0.
0 0.
0 0.
0 0.
0 0.
0 0.
0 3.
1 7.
9 9.
6 0.
0 7.
0 19
.1
0.0
1.
6 0.
1 0.
9 1.
3

Can
cer I
ncid
ence
and
Mor
talit
y in
Tas
man
ia 2
005
by a
ge, s
ex a
nd s
ite
Tasm
ania
n C
ance
r Reg
istry
| 5
1
0-
4 5-
9 10
-14
15-1
9 20
-24
25-2
9 30
-34
35-3
9 40
-44
45-4
9 50
-54
55-5
9 60
-64
65-6
9 70
-74
75-7
9 80
-84
85+
Tota
l C
rude
R
ate
Cum
ul
Rat
e AS
Rat
es
W
AU
S
(196
0) (
2001
)
C92
.1.
Chr
onic
mye
loid
leuk
aem
ia
Cas
es
M
0
0 0
0 0
1 0
1 0
0 0
0 0
0 0
0 0
0 2
F
0 0
1 0
0 0
0 0
0 0
0 0
0 0
0 0
0 0
1
P 0
0 1
0 0
1 0
1 0
0 0
0 0
0 0
0 0
0 3
Inci
denc
e pe
r 100
,000
M
0.0
0.0
0.0
0.0
0.0
7.5
0.0
6.4
0.0
0.0
0.0
0.0
0.0
0.0
0.0
0.0
0.0
0.0
0.
8 0.
1 1.
0 1.
0
F 0.
0 0.
0 6.
0 0.
0 0.
0 0.
0 0.
0 0.
0 0.
0 0.
0 0.
0 0.
0 0.
0 0.
0 0.
0 0.
0 0.
0 0.
0
0.4
0.0
0.5
0.4
P
0.0
0.0
2.9
0.0
0.0
3.8
0.0
3.1
0.0
0.0
0.0
0.0
0.0
0.0
0.0
0.0
0.0
0.0
0.
6 0.
0 0.
7 0.
7 D
eath
s
M
0 0
0 0
0 0
0 0
0 0
0 0
0 0
1 0
0 0
1
F 0
0 0
0 0
0 0
0 0
0 0
0 0
0 1
0 0
0 1
P
0 0
0 0
0 0
0 0
0 0
0 0
0 0
2 0
0 0
2
M
orta
lity
per 1
00,0
00
M
0.
0 0.
0 0.
0 0.
0 0.
0 0.
0 0.
0 0.
0 0.
0 0.
0 0.
0 0.
0 0.
0 0.
0 12
.5
0.0
0.0
0.0
0.
4 0.
1 0.
2 0.
4
F 0.
0 0.
0 0.
0 0.
0 0.
0 0.
0 0.
0 0.
0 0.
0 0.
0 0.
0 0.
0 0.
0 0.
0 11
.6
0.0
0.0
0.0
0.
4 0.
1 0.
2 0.
4
P 0.
0 0.
0 0.
0 0.
0 0.
0 0.
0 0.
0 0.
0 0.
0 0.
0 0.
0 0.
0 0.
0 0.
0 12
.0
0.0
0.0
0.0
0.
4 0.
1 0.
2 0.
4
C93
- C
95.
Oth
er a
nd u
nspe
cifie
d le
ukae
mia
C
ases
M
0 0
0 0
0 0
0 0
0 0
0 0
1 0
0 0
0 0
1
F 0
0 0
0 0
0 0
0 0
0 1
0 0
0 0
0 0
1 2
P
0 0
0 0
0 0
0 0
0 0
1 0
1 0
0 0
0 1
3
In
cide
nce
per 1
00,0
00
M
0.
0 0.
0 0.
0 0.
0 0.
0 0.
0 0.
0 0.
0 0.
0 0.
0 0.
0 0.
0 7.
9 0.
0 0.
0 0.
0 0.
0 0.
0
0.4
0.0
0.3
0.3
F
0.0
0.0
0.0
0.0
0.0
0.0
0.0
0.0
0.0
0.0
5.8
0.0
0.0
0.0
0.0
0.0
0.0
17.8
0.8
0.0
0.4
0.6
P
0.0
0.0
0.0
0.0
0.0
0.0
0.0
0.0
0.0
0.0
2.9
0.0
4.0
0.0
0.0
0.0
0.0
12.3
0.6
0.0
0.4
0.5
Dea
ths
M
0
0 0
0 0
0 0
0 0
0 0
0 1
0 1
0 0
0 2
F
0 0
0 0
0 0
0 0
0 0
1 0
0 1
0 0
0 2
4
P 0
0 0
0 0
0 0
0 0
0 1
0 1
1 1
0 0
2 6
Mor
talit
y pe
r 100
,000
M
0.0
0.0
0.0
0.0
0.0
0.0
0.0
0.0
0.0
0.0
0.0
0.0
7.9
0.0
12.5
0.
0 0.
0 0.
0
0.8
0.1
0.6
0.7
F
0.0
0.0
0.0
0.0
0.0
0.0
0.0
0.0
0.0
0.0
5.8
0.0
0.0
9.5
0.0
0.0
0.0
35.5
1.6
0.1
0.8
1.2
P
0.0
0.0
0.0
0.0
0.0
0.0
0.0
0.0
0.0
0.0
2.9
0.0
4.0
4.8
6.0
0.0
0.0
24.6
1.2
0.1
0.7
1.1
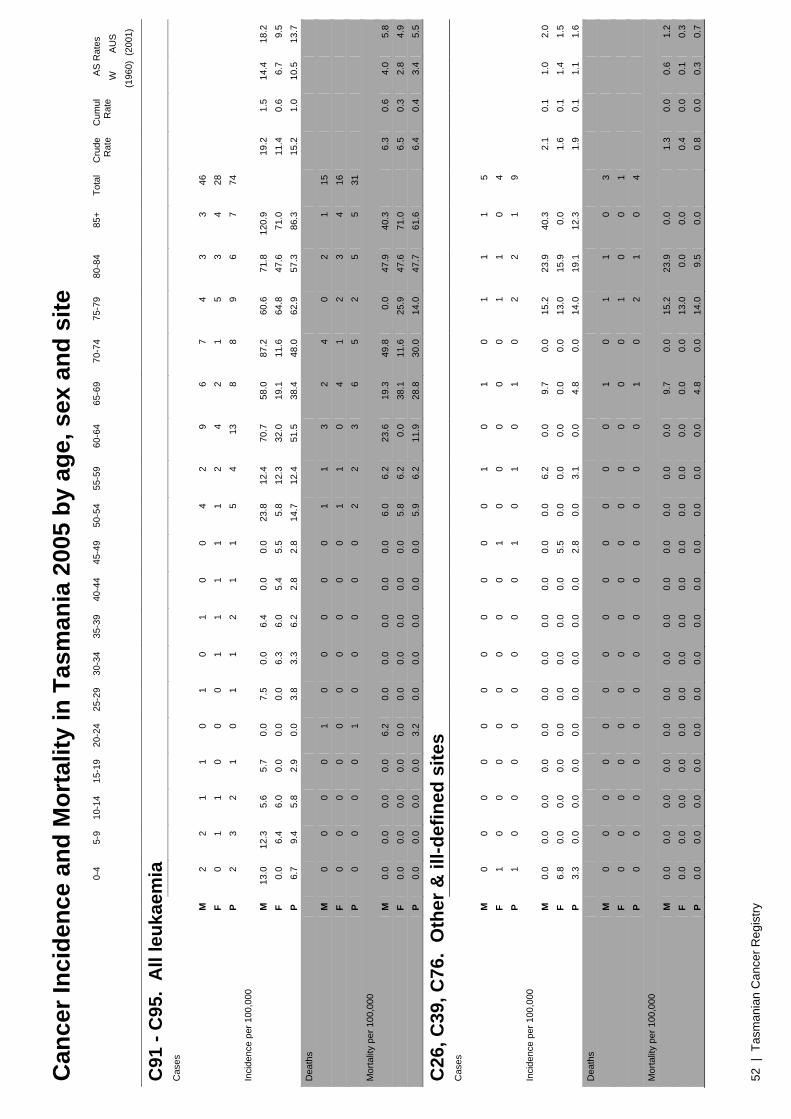
Can
cer I
ncid
ence
and
Mor
talit
y in
Tas
man
ia 2
005
by a
ge, s
ex a
nd s
ite
52 |
Tas
man
ian
Can
cer R
egis
try
0-
4 5-
9 10
-14
15-1
9 20
-24
25-2
9 30
-34
35-3
9 40
-44
45-4
9 50
-54
55-5
9 60
-64
65-6
9 70
-74
75-7
9 80
-84
85+
Tota
l C
rude
R
ate
Cum
ul
Rat
e AS
Rat
es
W
AU
S
(196
0) (
2001
)
C91
- C
95.
All
leuk
aem
ia
Cas
es
M
2
2 1
1 0
1 0
1 0
0 4
2 9
6 7
4 3
3 46
F 0
1 1
0 0
0 1
1 1
1 1
2 4
2 1
5 3
4 28
P 2
3 2
1 0
1 1
2 1
1 5
4 13
8
8 9
6 7
74
Inci
denc
e pe
r 100
,000
M
13.0
12
.3
5.6
5.7
0.0
7.5
0.0
6.4
0.0
0.0
23.8
12
.4
70.7
58
.0
87.2
60
.6
71.8
12
0.9
19
.2
1.5
14.4
18
.2
F
0.0
6.4
6.0
0.0
0.0
0.0
6.3
6.0
5.4
5.5
5.8
12.3
32
.0
19.1
11
.6
64.8
47
.6
71.0
11.4
0.
6 6.
7 9.
5
P 6.
7 9.
4 5.
8 2.
9 0.
0 3.
8 3.
3 6.
2 2.
8 2.
8 14
.7
12.4
51
.5
38.4
48
.0
62.9
57
.3
86.3
15.2
1.
0 10
.5
13.7
D
eath
s
M
0 0
0 0
1 0
0 0
0 0
1 1
3 2
4 0
2 1
15
F
0 0
0 0
0 0
0 0
0 0
1 1
0 4
1 2
3 4
16
P
0 0
0 0
1 0
0 0
0 0
2 2
3 6
5 2
5 5
31
Mor
talit
y pe
r 100
,000
M
0.0
0.0
0.0
0.0
6.2
0.0
0.0
0.0
0.0
0.0
6.0
6.2
23.6
19
.3
49.8
0.
0 47
.9
40.3
6.3
0.6
4.0
5.8
F
0.0
0.0
0.0
0.0
0.0
0.0
0.0
0.0
0.0
0.0
5.8
6.2
0.0
38.1
11
.6
25.9
47
.6
71.0
6.5
0.3
2.8
4.9
P
0.0
0.0
0.0
0.0
3.2
0.0
0.0
0.0
0.0
0.0
5.9
6.2
11.9
28
.8
30.0
14
.0
47.7
61
.6
6.
4 0.
4 3.
4 5.
5
C26
, C39
, C76
. O
ther
& il
l-def
ined
site
s C
ases
M
0 0
0 0
0 0
0 0
0 0
0 1
0 1
0 1
1 1
5
F 1
0 0
0 0
0 0
0 0
1 0
0 0
0 0
1 1
0 4
P
1 0
0 0
0 0
0 0
0 1
0 1
0 1
0 2
2 1
9
In
cide
nce
per 1
00,0
00
M
0.
0 0.
0 0.
0 0.
0 0.
0 0.
0 0.
0 0.
0 0.
0 0.
0 0.
0 6.
2 0.
0 9.
7 0.
0 15
.2
23.9
40
.3
2.
1 0.
1 1.
0 2.
0
F 6.
8 0.
0 0.
0 0.
0 0.
0 0.
0 0.
0 0.
0 0.
0 5.
5 0.
0 0.
0 0.
0 0.
0 0.
0 13
.0
15.9
0.
0
1.6
0.1
1.4
1.5
P
3.3
0.0
0.0
0.0
0.0
0.0
0.0
0.0
0.0
2.8
0.0
3.1
0.0
4.8
0.0
14.0
19
.1
12.3
1.9
0.1
1.1
1.6
Dea
ths
M
0
0 0
0 0
0 0
0 0
0 0
0 0
1 0
1 1
0 3
F
0 0
0 0
0 0
0 0
0 0
0 0
0 0
0 1
0 0
1
P 0
0 0
0 0
0 0
0 0
0 0
0 0
1 0
2 1
0 4
Mor
talit
y pe
r 100
,000
M
0.0
0.0
0.0
0.0
0.0
0.0
0.0
0.0
0.0
0.0
0.0
0.0
0.0
9.7
0.0
15.2
23
.9
0.0
1.
3 0.
0 0.
6 1.
2
F 0.
0 0.
0 0.
0 0.
0 0.
0 0.
0 0.
0 0.
0 0.
0 0.
0 0.
0 0.
0 0.
0 0.
0 0.
0 13
.0
0.0
0.0
0.
4 0.
0 0.
1 0.
3
P 0.
0 0.
0 0.
0 0.
0 0.
0 0.
0 0.
0 0.
0 0.
0 0.
0 0.
0 0.
0 0.
0 4.
8 0.
0 14
.0
9.5
0.0
0.
8 0.
0 0.
3 0.
7

Can
cer I
ncid
ence
and
Mor
talit
y in
Tas
man
ia 2
005
by a
ge, s
ex a
nd s
ite
Tasm
ania
n C
ance
r Reg
istry
| 5
3
0-
4 5-
9 10
-14
15-1
9 20
-24
25-2
9 30
-34
35-3
9 40
-44
45-4
9 50
-54
55-5
9 60
-64
65-6
9 70
-74
75-7
9 80
-84
85+
Tota
l C
rude
R
ate
Cum
ul
Rat
e AS
Rat
es
W
AU
S
(196
0) (
2001
)
C80
. U
nspe
cifie
d si
te
Cas
es
M
0
0 0
0 0
0 0
0 1
1 0
2 2
1 5
5 8
9 34
F 0
0 0
0 0
0 0
1 2
1 3
0 6
6 5
10
7 14
55
P 0
0 0
0 0
0 0
1 3
2 3
2 8
7 10
15
15
23
89
In
cide
nce
per 1
00,0
00
M
0.
0 0.
0 0.
0 0.
0 0.
0 0.
0 0.
0 0.
0 5.
6 5.
6 0.
0 12
.4
15.7
9.
7 62
.3
75.8
19
1.5
362.
6
14.2
0.
6 6.
9 14
.8
F
0.0
0.0
0.0
0.0
0.0
0.0
0.0
6.0
10.8
5.
5 17
.5
0.0
47.9
57
.2
57.8
12
9.5
111.
1 24
8.5
22
.4
1.0
10.1
17
.5
P
0.0
0.0
0.0
0.0
0.0
0.0
0.0
3.1
8.3
5.5
8.8
6.2
31.7
33
.6
59.9
10
4.8
143.
1 28
3.4
18
.3
0.8
8.4
15.8
D
eath
s
M
0 0
0 0
0 0
0 0
0 0
0 3
1 1
6 5
7 8
31
F
0 0
0 0
0 0
0 0
1 2
1 1
7 5
5 4
4 11
41
P 0
0 0
0 0
0 0
0 1
2 1
4 8
6 11
9
11
19
72
Mor
talit
y pe
r 100
,000
M
0.0
0.0
0.0
0.0
0.0
0.0
0.0
0.0
0.0
0.0
0.0
18.7
7.
9 9.
7 74
.7
75.8
16
7.6
322.
3
12.9
0.
6 6.
1 13
.4
F
0.0
0.0
0.0
0.0
0.0
0.0
0.0
0.0
5.4
10.9
5.
8 6.
2 55
.9
47.7
57
.8
51.8
63
.5
195.
3
16.7
0.
9 8.
2 13
.0
P
0.0
0.0
0.0
0.0
0.0
0.0
0.0
0.0
2.8
5.5
2.9
12.4
31
.7
28.8
65
.9
62.9
10
5.0
234.
1
14.8
0.
8 6.
9 12
.6
D45
- D
47.
Mye
lopr
olife
rativ
e &
mye
lody
spla
stic
syn
drom
es
Cas
es
M
0
0 0
0 0
0 0
0 0
0 1
0 1
1 0
3 2
0 8
F
0 0
0 0
0 0
0 0
0 1
0 1
0 1
0 2
1 3
9
P 0
0 0
0 0
0 0
0 0
1 1
1 1
2 0
5 3
3 17
In
cide
nce
per 1
00,0
00
M
0.
0 0.
0 0.
0 0.
0 0.
0 0.
0 0.
0 0.
0 0.
0 0.
0 6.
0 0.
0 7.
9 9.
7 0.
0 45
.5
47.9
0.
0
3.3
0.1
1.6
3.1
F
0.0
0.0
0.0
0.0
0.0
0.0
0.0
0.0
0.0
5.5
0.0
6.2
0.0
9.5
0.0
25.9
15
.9
53.3
3.7
0.1
1.5
2.7
P
0.0
0.0
0.0
0.0
0.0
0.0
0.0
0.0
0.0
2.8
2.9
3.1
4.0
9.6
0.0
34.9
28
.6
37.0
3.5
0.1
1.6
3.0
Dea
ths
M
0
0 0
0 0
0 0
0 0
0 0
0 0
1 0
0 1
0 2
F
0 0
0 0
0 0
0 0
0 0
0 0
0 0
0 3
1 2
6
P 0
0 0
0 0
0 0
0 0
0 0
0 0
1 0
3 2
2 8
Mor
talit
y pe
r 100
,000
M
0.0
0.0
0.0
0.0
0.0
0.0
0.0
0.0
0.0
0.0
0.0
0.0
0.0
9.7
0.0
0.0
23.9
0.
0
0.8
0.0
0.4
0.7
F
0.0
0.0
0.0
0.0
0.0
0.0
0.0
0.0
0.0
0.0
0.0
0.0
0.0
0.0
0.0
38.9
15
.9
35.5
2.4
0.0
0.6
1.8
P
0.0
0.0
0.0
0.0
0.0
0.0
0.0
0.0
0.0
0.0
0.0
0.0
0.0
4.8
0.0
21.0
19
.1
24.6
1.6
0.0
0.6
1.4

Can
cer I
ncid
ence
and
Mor
talit
y in
Tas
man
ia 2
005
by a
ge, s
ex a
nd s
ite
54 |
Tas
man
ian
Can
cer R
egis
try
0-
4 5-
9 10
-14
15-1
9 20
-24
25-2
9 30
-34
35-3
9 40
-44
45-4
9 50
-54
55-5
9 60
-64
65-6
9 70
-74
75-7
9 80
-84
85+
Tota
l C
rude
R
ate
Cum
ul
Rat
e AS
Rat
es
W
AU
S
(196
0) (
2001
)
C00
- C
96.
All
canc
ers
(exc
ludi
ng N
MSC
s)
Cas
es
M
4
3 1
3 8
8 15
13
40
46
86
14
9 18
4 24
5 22
9 21
8 15
5 10
1 1,
508
F
1 2
1 3
6 7
16
29
74
85
102
134
139
133
122
157
104
114
1,22
9
P 5
5 2
6 14
15
31
42
11
4 13
1 18
8 28
3 32
3 37
8 35
1 37
5 25
9 21
5 2,
737
Inci
denc
e pe
r 100
,000
M
25.9
18
.4
5.6
17.2
49
.9
60.2
10
3.3
82.8
22
4.9
255.
8 51
2.4
927.
5 1,
446.
4 2,
367.
8 2,
852.
9 3,
305.
0 3,
710.
8 4,
069.
3
629.
8 44
.8
376.
4 58
9.4
F
6.8
12.8
6.
0 18
.1
40.1
52
.5
101.
1 17
5.3
399.
3 46
5.1
594.
0 82
5.8
1,11
0.3
1,26
8.4
1,40
9.8
2,03
3.7
1,65
0.0
2,02
3.8
50
0.0
32.4
29
2.2
424.
4
P 16
.6
15.7
5.
8 17
.6
45.2
56
.4
102.
2 13
0.3
313.
9 36
1.3
553.
7 87
6.4
1,27
9.7
1,81
4.4
2,10
4.2
2,61
9.4
2,47
1.4
2,64
9.4
56
4.0
38.5
33
0.5
496.
0 D
eath
s
M
0 0
1 1
2 0
5 2
4 9
30
34
52
87
89
104
92
56
568
F
1 0
1 0
0 0
0 4
11
18
28
34
43
49
60
85
68
81
483
P
1 0
2 1
2 0
5 6
15
27
58
68
95
136
149
189
160
137
1,05
1
M
orta
lity
per 1
00,0
00
M
0.
0 0.
0 5.
6 5.
7 12
.5
0.0
34.4
12
.7
22.5
50
.0
178.
8 21
1.6
408.
8 84
0.8
1,10
8.8
1,57
6.7
2,20
2.5
2,25
6.2
23
7.2
14.5
12
8.4
227.
2
F 6.
8 0.
0 6.
0 0.
0 0.
0 0.
0 0.
0 24
.2
59.4
98
.5
163.
1 20
9.5
343.
5 46
7.3
693.
3 1,
101.
0 1,
078.
9 1,
438.
0
196.
5 10
.4
94.0
15
7.2
P
3.3
0.0
5.8
2.9
6.5
0.0
16.5
18
.6
41.3
74
.5
170.
8 21
0.6
376.
4 65
2.8
893.
2 1,
320.
2 1,
526.
7 1,
688.
2
216.
6 12
.4
109.
5 18
7.3
Differences in reporting due to coding changes
In this report, as in the 2003 and 2004 reports, cancers were tabulated according to ICD-10 codes, but coded in ICD-O3. In the 2001
and 2002 annual reports, cancers were also tabulated according to ICD-10 codes, but coded in ICD-9 and SNOMED/ICD-O2. While
cancer types and groups are mostly comparable between reports, some coding and reporting changes have had an effect on
incidence and mortality counts and rates. The changes in reporting have been made to improve the comparability of Tasmanian
cancer data with other Australian state and territory cancer registries.
Non-Hodgkin’s Lymphoma (ICD-10 C82-C85) Lymphoid granulomatosis, which was previously considered of uncertain behaviour (morphology code 9766/1) is now deemed to be
invasive (9766/3) and is reported in the table C85 ‘Other and unspecified types of NHL’. This change in reporting was made in
response to a decision by the AACR coding and reporting committee in April 2006, and was first introduced in the 2004 report.
Leukaemia (ICD-10 C91-C95) The change from ICD-O2 to ICD-O3 mid-way through 2003 meant the reporting of some chronic myeloproliferative (CMD) and
myelodysplastic syndromes previously coded as leukaemias. This might have resulted in a decrease in reported leukaemia rates,
however this has not been seen since the coding change occurred.
Kidney Cancer (ICD-10 C64) Transitional cell carcinomas of the kidney (C649) are now coded to renal pelvis (C659). This change in reporting was made in
response to a decision by the AACR coding and reporting committee in August 2006, and was first introduced in the 2004 report.
Tasmanian Cancer Registry | 55

56 | Tasmanian Cancer Registry
Appendices
Appendix A: Cancer site codes and combinations
Appendix B: Statistical methods
Appendix C: Population data
Appendix D: Indices of data quality
Appendix E: Use of Tasmanian Cancer Registry data
Appendix F: Incidence and mortality summary tables 2005
Tasmanian Cancer Registry | 57
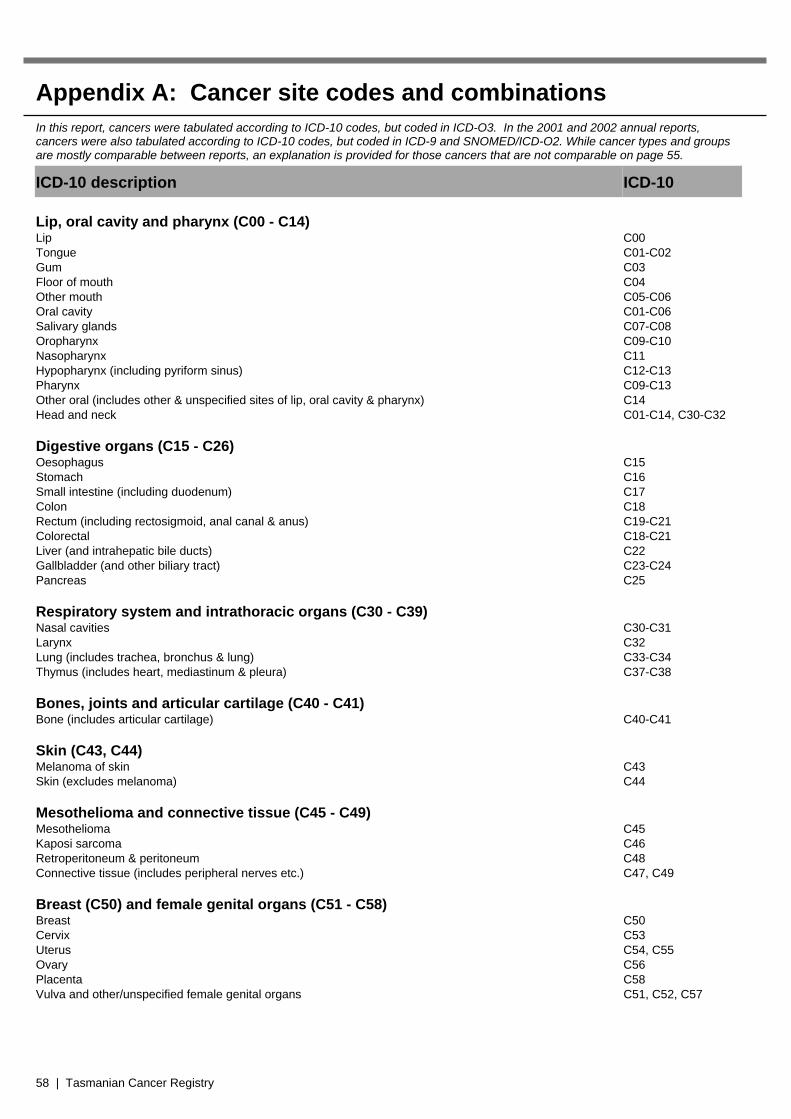
58 | Tasmanian Cancer Registry
Appendix A: Cancer site codes and combinations In this report, cancers were tabulated according to ICD-10 codes, but coded in ICD-O3. In the 2001 and 2002 annual reports, cancers were also tabulated according to ICD-10 codes, but coded in ICD-9 and SNOMED/ICD-O2. While cancer types and groups are mostly comparable between reports, an explanation is provided for those cancers that are not comparable on page 55.
ICD-10 description ICD-10 Lip, oral cavity and pharynx (C00 - C14) Lip C00 Tongue C01-C02 Gum C03 Floor of mouth C04 Other mouth C05-C06 Oral cavity C01-C06 Salivary glands C07-C08 Oropharynx C09-C10 Nasopharynx C11 Hypopharynx (including pyriform sinus) C12-C13 Pharynx C09-C13 Other oral (includes other & unspecified sites of lip, oral cavity & pharynx) C14 Head and neck C01-C14, C30-C32 Digestive organs (C15 - C26) Oesophagus C15 Stomach C16 Small intestine (including duodenum) C17 Colon C18 Rectum (including rectosigmoid, anal canal & anus) C19-C21 Colorectal C18-C21 Liver (and intrahepatic bile ducts) C22 Gallbladder (and other biliary tract) C23-C24 Pancreas C25 Respiratory system and intrathoracic organs (C30 - C39) Nasal cavities C30-C31 Larynx C32 Lung (includes trachea, bronchus & lung) C33-C34 Thymus (includes heart, mediastinum & pleura) C37-C38 Bones, joints and articular cartilage (C40 - C41) Bone (includes articular cartilage) C40-C41 Skin (C43, C44) Melanoma of skin C43 Skin (excludes melanoma) C44 Mesothelioma and connective tissue (C45 - C49) Mesothelioma C45 Kaposi sarcoma C46 Retroperitoneum & peritoneum C48 Connective tissue (includes peripheral nerves etc.) C47, C49 Breast (C50) and female genital organs (C51 - C58) Breast C50 Cervix C53 Uterus C54, C55 Ovary C56 Placenta C58 Vulva and other/unspecified female genital organs C51, C52, C57

Tasmanian Cancer Registry | 59
ICD-10 description ICD-10 Male genital organs (C60 - C63) Prostate C61 Testis C62 Penis (and other male genital organs) C60, C63 Urinary tract (C64 - C68) Kidney (except renal pelvis) C64 Bladder C67 Renal pelvis (including other/unspecified urinary organs) C65, C66, C68 Eye, brain and other parts of the central nervous system (C69 - C71) Eye C69 Brain C71 Central nervous system (includes meninges) C70, C72 Thyroid and other endocrine glands (C73 - C75) Thyroid C73 Other endocrine (glands and related structures) C74, C75 Malignant neoplasms of lymphoid, haematopoietic and related tissue (C81 - C96) Hodgkin's disease C81 Nodular non-Hodgkin's lymphoma C82 Diffuse non-Hodgkin's lymphoma C83 T-cell lymphoma C84 Other non-Hodgkin's lymphoma C85 Non-Hodgkin's lymphoma C82-C85 All lymphomas C81-C85 Immunoproliferative disease C88 Multiple myeloma (and malignant plasma cell neoplasms) C90 Lymphoid leukaemia C91 Acute lymphoid leukaemia C91.0 Chronic lymphoid leukaemia C91.1 Myeloid leukaemia C92 Acute myeloid leukaemia C92.0 Chronic myeloid leukaemia C92.1 Other and unspecified leukaemia C93 - C95 All leukaemia C91-C95 Unknown primary site (C80) Unspecified sites C80 Other and ill-defined sites C26, C39, C76 All cancers (excluding non-melanoma skin cancers) C00-C96
Appendix B: Statistical methods
The 2005 report contains numbers of new cases and deaths,
and age specific, crude, cumulative, and age standardised
incidence and mortality rates of Tasmanian residents
diagnosed with cancer. They are based on registrations
completed by 31 May 2008.
Incidence Cancer incidence is defined as the number of new cases of
cancer in a population during a specific period. The incidence
data in this report refer to the number of primary cancers first
diagnosed between 1 January 2005 and 31 December 2005 in
persons who were residents of Tasmania at the time of
diagnosis.
Mortality The mortality data in this report refer to deaths from cancer of
people who were first diagnosed as having cancer while they
were residents of Tasmania. In many instances, other State or
Territory cancer registries notify the Tasmanian Cancer
Registry of cancer patients who die outside Tasmania. Details
of patients diagnosed interstate who die in Tasmania are
forwarded to the relevant cancer registry. Deaths from other
causes are also recorded so that survival proportions can be
calculated.
Crude rates (CR) The crude incidence (rate) is calculated as the number of new
cases of cancer divided by the population at risk in a specified
time period. The crude mortality rate substitutes deaths for new
cases in this calculation. Both are conventionally expressed as
annual rates per 100,000 population. The Australian Bureau of
Statistics (ABS) supplied the estimated Tasmanian population
by age and sex for 2005 in June 2006.
Age specific rates Age specific rates are calculated by dividing the number of
cases occurring in each specified age group by the
corresponding population in the same age group and are
expressed as an annual rate per 100,000 population.
Age standardised rates (ASR) Rates are adjusted for age to facilitate comparisons between
populations that have different age structures, e.g. between
youthful and aging communities. In this publication we use
direct standardisation in which age specific rates are used to
calculate the number of cases that would have occurred if the
population had the same age distribution as the World
Standard Population 1960, World Standard Population 2000
and the Australian Standard Population 2001. This effectively
removes the influence of age structure on the summary rate,
which is described as the age standardised rate. The method
may be used for both incidence and mortality calculations.
Cumulative rates The cumulative rate is a directly standardised rate calculated
by summing the age specific rate for each year of life prior to
age 75. Cumulative risk to age 75 can be calculated from the
cumulative rate.
60 | Tasmanian Cancer Registry

Appendix C: Population data Appendix C: Population data
Estimated resident population of Tasmania by age group and sex for 30 June 20051 Estimated resident population of Tasmania by age group and sex for 30 June 20051 Age Age Males Males FemalesFemales Persons Persons
0-4 15,440 14,632 30072
5-9 16,299 15,606 31905
10-14 17,749 16,790 34539
15-19 17,473 16,603 34076
20-24 16,018 14,970 30988
25-29 13,288 13,326 26614
30-34 14,523 15,822 30345
35-39 15,692 16,547 32239
40-44 17,782 18,531 36313
45-49 17,986 18,275 36261
50-54 16,783 17,171 33954
55-59 16,065 16,227 32292
60-64 12,721 12,519 25240
65-69 10,347 10,486 20833
70-74 8,027 8,654 16681
75-79 6,596 7,720 14316
80-84 4,177 6,303 10480
85+ 2,482 5,633 8115
Total 239,448 245,815 485,263
Tasmanian Cancer Registry | 61
Australian Standard Population and World Standard Populations
Age Australian Standard
Population (2001)2
World Standard
Population(1960)3
World Standard
Population (2000)4
0-4 1,282,357 12,000 8.86
5-9 1,351,664 10,000 8.69
10-14 1,353,177 9,000 8.60
15-19 1,352,745 9,000 8.47
20-24 1,302,412 8,000 8.22
25-29 1,407,081 8,000 7.93
30-34 1,466,615 6,000 7.61
35-39 1,492,204 6,000 7.15
40-44 1,479,257 6,000 6.59
45-49 1,358,594 6,000 6.04
50-54 1,300,777 5,000 5.37
55-59 1,008,799 4,000 4.55
60-64 822,024 4,000 3.72
65-69 682,513 3,000 2.96
70-74 638,380 2,000 2.21
75-79 519,356 1,000 1.52
80-84 330,050 500 0.91
85+ 265,235 500 0.63
Total 19,413,240 100,000 100.03
The Australian Standard Population 20012 approximates
the proportional age distribution of the whole of
Australia in 2001. Similarly the World Standard
Population3 approximates the proportional age
distribution of the whole world. Standard populations are
used widely for direct standardisation to enable
comparisons between populations of differing age
structure.
1 Australian Bureau of Statistics (ABS), Population Estimates
by Age and Sex, Tasmania, At 30 June: 2005 Copyright ©
Commonwealth of Australia 2006 (Cat. No. 3201.0)
2 Australian Bureau of Statistics (ABS) 2004, Australian
demographic statistics, March quarter 2004 (Cat. No. 3101.0). 3 Parkin D M, Whelan S, Ferlay J, Raymond L and Young J.
Cancer Incidence in Five Continents Vol VII, IARC Scientific
Publications No. 143. Lyon: International Agency for Research
on Cancer, 1997 (p 67).
4Ahmad OB, Boschi-Pinto C ,Lopez AD, Murray CJL, Lozano R
& Inoue M, 2000. Age standardization of rates: a new WHO
standard. GPE Discussion Paper Series No. 31. Geneva:
World Health Organisation (available at
http://www.who.int/health-systems-
performance/docs/levelofhealth_docs.htm).
Appendix D: Indices of data quality
Three indices of data quality are commonly used by Australian
Cancer Registries: the mortality to incidence ratio (M/I%), the
proportion of cancers with histological verification (HV%) and
the proportion of cancers registered on the basis of death
certificate only (DCO%). The Tasmanian Cancer Registry has
calculated these three indices and also determined the
proportion of cancers with morphological verification (MV%)
and the proportion of cancers of unknown primary site (PSU)
for 2005 data.
Death Certificate Only (DCO) In the past, the Tasmanian Cancer Registry did not register
cases on the basis of DCO, unlike other State and Territory
cancer registries that registered these cases and included them
in their reports. Each death certificate notification is actively
followed up until the time and place of diagnosis are
ascertained and the diagnosis verified. If the diagnostic details
cannot be confirmed morphologically, the case is registered on
the basis of a clinical diagnosis4. In 2005, 59 DCO cases were
registered and these cases have been included in the 2005
incidence data. This will increase the number of new cancers
by 2.2% (1.8% for males and 2.6% for females). For DCO
cases, the date of diagnosis is taken as the date of death.
Where there is a low DCO%, as is the case for this Registry,
the potential error in registration is reduced.
Mortality to Incidence Ratio (M/I%) One way of assessing the completeness of cancer
ascertainment is the M/I%. This measure is calculated by
dividing the number of deaths attributed to a specific cancer in
a defined population by the number of new cases of the same
cancer registered during the same period in the same
population. For cancers with a poor prognosis, the ratio will be
close to 100%. If it exceeds 100% this may indicate that the
cancer is being under-registered, but a more likely explanation
for this result with uncommon cancers is that it is a result of
random fluctuations in the annual number of new cases and
deaths.
62 | Tasmanian Cancer Registry
4 Note: Prior to 2000, DCO cases were not registered by the
Tasmanian Cancer Registry.
Histological Verification (HV%) HV% is the percentage of cases with verification by histological
investigation. Histological verification of diagnosis shows that it
has been possible to investigate a patient with such
thoroughness that a portion of the suspected neoplasm has
been removed for microscopic examination5. For 2005, 83% of
all male and 84% of all female registered cases had a
diagnosis on the basis of tissue examination. HV% includes
only the cancers that were diagnosed following tissue or needle
biopsy and did not include diagnoses made on the basis of
cytology examination of smears or aspirates (including
haematological examinations).
Morphological Verification (MV%) If we add the diagnoses based on exfoliative cytology,
haematological examinations (for leukaemia) as well as
diagnoses based on histological examination of a tissue
specimen, then the percentage of all cancers with
morphological verification (MV%) in 2005 was 89% for males
and 89% for females6.
Unknown Primary Site (PSU) The Registry calculated the percentage of all cancers that were
classified as PSU (reported as ICD-10 C80 Unspecified site),
because it is one of the quality indicators used for international
comparisons7. In 2005, the percentage of all cases classified
as PSU was 3.3% (2.3% for males and 4.5% for females).
5 Parkin D.M, Chen V.W, Ferlay J, Galceran J, Storm H.H and Whelan
S. Comparability and Quality Control in Cancer Registration. IARC
Technical Report No 19. Lyon: International Agency for Research on
Cancer, 1994 (p 43). 6 Parkin D.M, Whelan S, Ferlay J, Raymond L and Young J. Cancer
Incidence in Five Continents Vol VII. IARC Scientific Publication No
143. Lyon: International Agency for Research on Cancer, 1997 (p 50). 7 Parkin D.M, Chen V.W, Ferlay J, Galceran J, Storm H.H and Whelan
S. Comparability and Quality Control in Cancer Registration. IARC
Technical Report No 19. Lyon: International Agency for Research on
Cancer, 1994 (p 51).
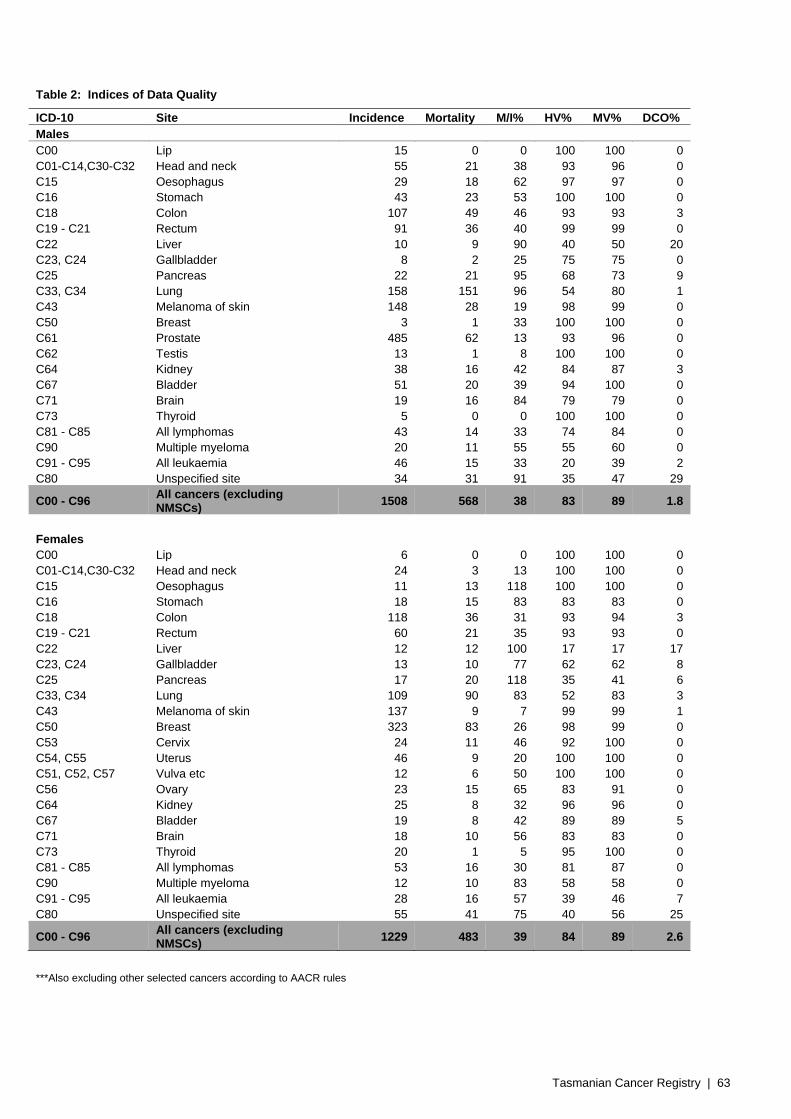
Tasmanian Cancer Registry | 63
Table 2: Indices of Data Quality
ICD-10 Site Incidence Mortality M/I% HV% MV% DCO%Males C00 Lip 15 0 0 100 100 0 C01-C14,C30-C32 Head and neck 55 21 38 93 96 0 C15 Oesophagus 29 18 62 97 97 0 C16 Stomach 43 23 53 100 100 0 C18 Colon 107 49 46 93 93 3 C19 - C21 Rectum 91 36 40 99 99 0 C22 Liver 10 9 90 40 50 20 C23, C24 Gallbladder 8 2 25 75 75 0 C25 Pancreas 22 21 95 68 73 9 C33, C34 Lung 158 151 96 54 80 1 C43 Melanoma of skin 148 28 19 98 99 0 C50 Breast 3 1 33 100 100 0 C61 Prostate 485 62 13 93 96 0 C62 Testis 13 1 8 100 100 0 C64 Kidney 38 16 42 84 87 3 C67 Bladder 51 20 39 94 100 0 C71 Brain 19 16 84 79 79 0 C73 Thyroid 5 0 0 100 100 0 C81 - C85 All lymphomas 43 14 33 74 84 0 C90 Multiple myeloma 20 11 55 55 60 0 C91 - C95 All leukaemia 46 15 33 20 39 2 C80 Unspecified site 34 31 91 35 47 29
C00 - C96 All cancers (excluding NMSCs) 1508 568 38 83 89 1.8
Females C00 Lip 6 0 0 100 100 0 C01-C14,C30-C32 Head and neck 24 3 13 100 100 0 C15 Oesophagus 11 13 118 100 100 0 C16 Stomach 18 15 83 83 83 0 C18 Colon 118 36 31 93 94 3 C19 - C21 Rectum 60 21 35 93 93 0 C22 Liver 12 12 100 17 17 17 C23, C24 Gallbladder 13 10 77 62 62 8 C25 Pancreas 17 20 118 35 41 6 C33, C34 Lung 109 90 83 52 83 3 C43 Melanoma of skin 137 9 7 99 99 1 C50 Breast 323 83 26 98 99 0 C53 Cervix 24 11 46 92 100 0 C54, C55 Uterus 46 9 20 100 100 0 C51, C52, C57 Vulva etc 12 6 50 100 100 0 C56 Ovary 23 15 65 83 91 0 C64 Kidney 25 8 32 96 96 0 C67 Bladder 19 8 42 89 89 5 C71 Brain 18 10 56 83 83 0 C73 Thyroid 20 1 5 95 100 0 C81 - C85 All lymphomas 53 16 30 81 87 0 C90 Multiple myeloma 12 10 83 58 58 0 C91 - C95 All leukaemia 28 16 57 39 46 7 C80 Unspecified site 55 41 75 40 56 25
C00 - C96 All cancers (excluding NMSCs) 1229 483 39 84 89 2.6
***Also excluding other selected cancers according to AACR rules
Appendix E: Use of Tasmanian Cancer Registry Data ncer Registry Data
Confidentiality of information Confidentiality of information Confidentiality of data is a requirement of the Public Health Act
1997. The Registry cannot release data identifying an
individual unless authorised by the Director of Public Health.
The relevant sections of this Act are reproduced below.
Confidentiality of data is a requirement of the Public Health Act
1997. The Registry cannot release data identifying an
individual unless authorised by the Director of Public Health.
The relevant sections of this Act are reproduced below.
64 | Tasmanian Cancer Registry
Disclosure of information relating to a notifiable disease Section 61: A person, unless authorised to do so under section
147, must not disclose any information in relation to:
(a) Any notification relating to a notifiable disease; or
(b) Any investigation or inquiry into a notifiable disease;
or
(c) The identity of any person to whom any notification,
investigation or inquiry relates.
Disclosure of information Section 147: A person must not disclose any information
obtained for the purpose of this Act relating to a person except
in accordance with any relevant guidelines and:
(a) With the written consent of the person or parent or
guardian of a child or person to whom the information
relates; or
(b) To a registered medical practitioner who is directly
involved in the treatment of that person; or
(c) To a person apparently in charge of any institution or
facility which is involved in the diagnosis or treatment of
that person; or
(d) To a person authorised by the Director; or
(e) For the purpose of notifying a notifiable disease; or
(f) For the purpose of an epidemiological study or research
authorised by the Director; or
(g) For the purpose of legal proceedings arising out of this
Act; or
(h) For a purpose authorised or required by this Act or
another Act; or
(i) For the purposes of study or research approved by the
Director.
Requests for non-identifying data Non-identifying cancer data are available upon request. Data
are usually released as incidence or mortality rates, or number
of cases or deaths, for specific cancers, cancer morphologies,
time periods or age groups. Data that can be compiled using
existing reporting systems have a turnaround of approximately
1 week. Data needing input from the biostatistician require
more notice. Such data are provided to epidemiological and
clinical researchers, the Department of Health and Human
Services, students and the public. It is generally not feasible to
release data for small geographical areas, because this could
lead to identification of the persons diagnosed and the Registry
may not have population data for the area with which to assess
the rate of occurrence. In addition to data requests, the
Registry receives personal enquiries regarding cancer. When
appropriate, these enquiries are referred to other agencies or
health professionals.
Requests for identifying data The release of named data is strictly controlled. Named data
may be released only after approval of a formal application
submitted to the Director of the Tasmanian Cancer Registry,
and with subsequent approval by the Director of Public Health.
Applications for research purposes need the approval of the
researchers’ institutional ethics committee and the Human
Research Ethics Committee (Tasmania) Network. Prior to
contacting persons named, researchers must notify the
patient’s medical practitioner of their intent to contact and
provide a form to be returned if he/she does not want the
patient to be approached.
Applicants are required to send a covering letter (detailing the
purposes of the study and who is funding the study), copies of
the study protocol (including the approach letter to participants)
and two copies of the Ethics Committees approvals to the
Director of the Tasmanian Cancer Registry.
Tasmanian Cancer Registry | 65
Published data Annual reports from the Registry provide data on cancer
numbers and incidence and mortality. Additional information is
provided on selected cancer sites. It should be recognised that
active follow-up is necessary to complete registrations for up to
30% of cases each year, which results in a two-year interval
from year of diagnosis to date of publication of incidence data.
Considerable time is spent on matching, classifying and
validating cancer cases notified to the Registry. In addition the
Tasmanian Cancer Registry supplies data to the National
Cancer Statistics Clearing House (NCSCH) and to the
International Association of Cancer Registries (IACR).

Appendix F: Incidence and mortality summary tables 2005 Appendix F: Incidence and mortality summary tables 2005 Table 3: Incidence summary table 2005 Table 3: Incidence summary table 2005
ICD-10 ICD-10 Site Site Males Females Total *N CR ASRW
1960 ASRW2000
ASRA 2001
N CR ASRW 1960
ASRW2000
ASRA 2001
N
C00 Lip 15 6.3 4.5 4.8 5.7 6 2.4 1.0 1.2 1.9 21 C01, C02 Tongue 7 2.9 1.8 2.0 2.8 3 1.2 0.7 0.7 0.9 10 C03 Gum 0 0.0 0.0 0.0 0.0 1 0.4 0.3 0.3 0.3 1 C04 Floor of mouth 3 1.3 0.9 1.0 1.1 3 1.2 0.7 0.8 1.0 6 C05, C06 Other mouth 4 1.7 1.0 1.1 1.5 3 1.2 0.6 0.7 1.0 7 C07, C08 Salivary glands 4 1.7 1.2 1.3 1.6 4 1.6 1.2 1.2 1.4 8 C09, C10 Oropharynx 10 4.2 2.6 2.9 3.8 3 1.2 0.6 0.7 1.0 13 C11 Nasopharynx 2 0.8 0.6 0.6 0.7 1 0.4 0.1 0.1 0.3 3 C12, C13 Hypopharynx 2 0.8 0.5 0.6 0.7 0 0.0 0.0 0.0 0.0 2 C14 Other oral 3 1.3 0.6 0.8 1.3 0 0.0 0.0 0.0 0.0 3 C15 Oesophagus 29 12.1 6.8 8.0 11.4 11 4.5 2.2 2.5 3.6 40 C16 Stomach 43 18.0 10.4 11.8 16.7 18 7.3 3.1 3.7 5.6 61 C17 Small intestine 2 0.8 0.6 0.6 0.7 6 2.4 1.4 1.5 1.9 8 C18 Colon 107 44.7 25.3 29.4 42.8 118 48.0 22.0 26.0 38.3 225 C19 - C21 Rectum 91 38.0 20.8 24.5 36.1 60 24.4 13.5 15.1 20.5 151 C18 - C21 Colorectal** 198 82.7 46.2 53.9 78.8 178 72.4 35.5 41.1 58.8 376 C22 Liver 10 4.2 2.5 2.8 3.8 12 4.9 1.7 2.2 3.7 22 C23, C24 Gallbladder 8 3.3 1.8 2.1 3.0 13 5.3 1.9 2.3 3.9 21 C25 Pancreas 22 9.2 5.6 6.1 9.0 17 6.9 3.0 3.3 5.2 39 C30, C31 Nasal cavities 7 2.9 1.7 1.9 2.7 2 0.8 0.5 0.5 0.7 9 C32 Larynx 13 5.4 3.6 3.9 4.7 4 1.6 1.1 1.1 1.4 17 C33, C34 Lung 158 66.0 36.5 42.1 61.7 109 44.3 23.7 26.7 36.7 267 C37, C38 Thymus etc 0 0.0 0.0 0.0 0.0 1 0.4 0.4 0.4 0.5 1 C40, C41 Bone 6 2.5 1.6 1.9 2.4 1 0.4 0.3 0.3 0.3 7 C43 Melanoma of skin 148 61.8 42.0 46.5 59.1 137 55.7 39.2 43.0 51.3 285 C45 Mesothelioma 12 5.0 3.2 3.4 4.3 2 0.8 0.5 0.6 0.8 14 C47, C49 Connective tissue 9 3.8 2.1 2.6 3.5 6 2.4 1.0 1.2 1.8 15 C50 Breast 3 1.3 0.6 0.8 1.4 323 131.4 84.2 90.7 114.0 326 C53 Cervix - - - - - 24 9.8 7.2 7.9 9.0 24 C54, C55 Uterus - - - - - 46 18.7 11.3 12.6 16.3 46 C51, C52, C57 Vulva etc - - - - - 12 4.9 2.6 2.9 3.9 12 C56 Ovary - - - - - 23 9.4 4.9 5.5 7.8 23 C61 Prostate 485 202.5 117.8 131.4 183.1 - - - - - 485 C62 Testis 13 5.4 5.7 6.4 6.2 - - - - - 13 C60, C63 Penis etc 3 1.3 0.8 0.9 1.0 - - - - - 3 C64 Kidney 38 15.9 9.9 11.3 15.1 25 10.2 6.4 7.2 9.2 63 C67 Bladder 51 21.3 11.7 13.6 20.4 19 7.7 3.7 4.2 6.2 70 C65, C66, C68 Renal pelvis etc 3 1.3 0.8 0.8 1.1 3 1.2 0.5 0.7 1.0 6 C69 Eye 4 1.7 1.0 1.1 1.5 1 0.4 0.4 0.5 0.5 5 C71 Brain 19 7.9 4.9 5.5 7.2 18 7.3 5.5 5.7 6.4 37 C70, C72 Central nervous system 1 0.4 0.4 0.5 0.5 1 0.4 0.1 0.1 0.2 2 C73 Thyroid 5 2.1 1.4 1.6 2.1 20 8.1 6.1 6.8 7.9 25 C74, C75 Other endocrine 2 0.8 0.7 0.8 0.9 0 0.0 0.0 0.0 0.0 2 C81 - C85 All lymphomas 43 18.0 11.3 12.8 17.3 53 21.6 13.7 15.0 19.0 96 C90 Multiple myeloma 20 8.4 4.8 5.4 8.0 12 4.9 2.2 2.7 3.8 32 C91 - C95 All leukaemia 46 19.2 14.4 14.7 18.2 28 11.4 6.7 7.4 9.5 74 C26, C39, C76 Other & ill-defined sites 5 2.1 1.0 1.3 2.0 4 1.6 1.4 1.3 1.5 9 C80 Unspecified site 34 14.2 6.9 8.7 14.8 55 22.4 10.1 11.7 17.5 89 C00 - C96 All cancers (excluding
NMSCs)*** 1,508 629.8 376.4 425.1 589.4 1,229 500.0 292.2 324.0 424.4 2,737
* N = Number CR = Crude Rate Rates are expressed per 100,000 population and age-standardised to the World Standard Population (ASRW) 1960 and 2000, and to the Australian Standard Population (ASRA) 2001.
** Includes cases listed separately as “Colon” and “Rectum” ***Also includes some selected cancers not shown in table above
66 | Tasmanian Cancer Registry

Tasmanian Cancer Registry | 67
Table 4: Mortality summary table 2005
ICD-10 Site Males Females Total
*N CR ASRW
1960
ASRW2000
ASRA 2001
N CR ASRW 1960
ASRW2000
ASRA 2001
N
C00 Lip 0 0.0 0.0 0.0 0.0 0 0.0 0.0 0.0 0.0 0 C01, C02 Tongue 5 2.1 1.4 1.6 1.9 0 0.0 0.0 0.0 0.0 5 C03 Gum 0 0.0 0.0 0.0 0.0 0 0.0 0.0 0.0 0.0 0 C04 Floor of mouth 1 0.4 0.3 0.3 0.4 0 0.0 0.0 0.0 0.0 1 C05, C06 Other mouth 1 0.4 0.3 0.3 0.4 0 0.0 0.0 0.0 0.0 1 C07, C08 Salivary glands 1 0.4 0.2 0.3 0.4 1 0.4 0.2 0.3 0.3 2 C09, C10 Oropharynx 3 1.3 0.7 0.8 1.1 0 0.0 0.0 0.0 0.0 3 C11 Nasopharynx 1 0.4 0.3 0.3 0.4 1 0.4 0.3 0.3 0.4 2 C12, C13 Hypopharynx 1 0.4 0.3 0.3 0.3 0 0.0 0.0 0.0 0.0 1 C14 Other oral 1 0.4 0.3 0.3 0.3 0 0.0 0.0 0.0 0.0 1 C15 Oesophagus 18 7.5 4.4 4.9 7.1 13 5.3 1.9 2.4 3.9 31 C16 Stomach 23 9.6 5.2 6.1 8.7 15 6.1 2.6 3.1 4.8 38 C17 Small intestine 2 0.8 0.4 0.5 0.7 2 0.8 0.2 0.3 0.6 4 C18 Colon 49 20.5 11.6 13.4 19.7 36 14.6 7.1 8.2 11.7 85 C19 - C21 Rectum 36 15.0 8.0 9.7 14.4 21 8.5 3.5 4.2 6.5 57 C18 - C21 Colorectal** 85 35.5 19.6 23.1 34.1 57 23.2 10.6 12.4 18.2 142 C22 Liver 9 3.8 2.0 2.4 3.7 12 4.9 1.7 2.2 3.7 21 C23, C24 Gallbladder 2 0.8 0.5 0.6 0.7 10 4.1 1.3 1.7 2.9 12 C25 Pancreas 21 8.8 5.0 5.7 8.7 20 8.1 3.2 3.8 6.0 41 C30, C31 Nasal cavities 4 1.7 1.1 1.1 1.5 0 0.0 0.0 0.0 0.0 4 C32 Larynx 3 1.3 0.7 0.8 1.2 1 0.4 0.2 0.3 0.4 4 C33, C34 Lung 151 63.1 33.6 39.6 59.2 90 36.6 17.8 20.6 29.7 241 C37, C38 Thymus etc 0 0.0 0.0 0.0 0.0 1 0.4 0.3 0.3 0.4 1 C40, C41 Bone 1 0.4 0.2 0.3 0.4 2 0.8 0.6 0.6 0.7 3 C43 Melanoma of skin 28 11.7 6.8 7.7 11.0 9 3.7 1.9 2.2 3.2 37 C45 Mesothelioma 9 3.8 2.0 2.4 3.6 1 0.4 0.3 0.3 0.4 10 C47, C49 Connective tissue 2 0.8 0.4 0.5 0.7 3 1.2 0.4 0.5 0.8 5 C50 Breast 1 0.4 0.2 0.3 0.6 83 33.8 19.3 21.6 28.5 84 C53 Cervix - - - - - 11 4.5 2.9 3.2 4.1 11 C54, C55 Uterus - - - - - 9 3.7 1.9 2.2 3.1 9 C51, C52, C57 Vulva etc - - - - - 6 2.4 1.0 1.2 1.9 6 C56 Ovary - - - - - 15 6.1 3.1 3.5 5.1 15 C61 Prostate 62 25.9 12.1 15.5 25.6 - - - - - 62 C62 Testis 1 0.4 0.5 0.5 0.4 - - - - - 1 C60, C63 Penis etc 0 0.0 0.0 0.0 0.0 - - - - - 0 C64 Kidney 16 6.7 3.1 4.0 6.3 8 3.3 1.5 1.7 2.5 24 C67 Bladder 20 8.4 4.1 5.1 8.3 8 3.3 1.3 1.7 2.7 28 C65, C66, C68 Renal pelvis etc 1 0.4 0.3 0.3 0.4 2 0.8 0.2 0.3 0.5 3 C69 Eye 0 0.0 0.0 0.0 0.0 0 0.0 0.0 0.0 0.0 0 C71 Brain 16 6.7 4.9 5.5 6.5 10 4.1 3.1 3.0 3.4 26 C70, C72 Central nervous system 1 0.4 0.3 0.3 0.4 0 0.0 0.0 0.0 0.0 1 C73 Thyroid 0 0.0 0.0 0.0 0.0 1 0.4 0.1 0.1 0.2 1 C74, C75 Other endocrine 0 0.0 0.0 0.0 0.0 1 0.4 0.2 0.3 0.3 1 C81 - C85 All lymphomas 14 5.8 2.8 3.7 5.5 16 6.5 2.4 3.0 5.0 30 C90 Multiple myeloma 11 4.6 2.5 3.0 4.4 10 4.1 1.6 2.0 3.2 21 C91 - C95 All leukaemia 15 6.3 4.0 4.4 5.8 16 6.5 2.8 3.3 4.9 31 C26, C39, C76 Other & ill-defined sites 3 1.3 0.6 0.7 1.2 1 0.4 0.1 0.2 0.3 4 C80 Unspecified site 31 12.9 6.1 7.8 13.4 41 16.7 8.2 9.0 13.0 72 C00 - C96 All cancers (excluding
NMSCs)*** 568 237.2 128.4 152.1 227.2 483 196.5 94.0 108.5 157.2 1,051
* N = Number CR = Crude Rate Rates are expressed per 100,000 population and age-standardised to the World Standard Population (ASRW) 1960 and 2000, and to the Australian Standard Population (ASRA) 2001.
** Includes cases listed separately as “Colon” and “Rectum” ***Also includes some selected cancers not shown in table above