CANCER in Missouri - Missouri Department of Health...
44
CANCER in Missouri: TRENDS IN DISPARITIES BETWEEN AFRICAN AMERICANS AND WHITES September 2008 Missouri Department of Health and Senior Services
Transcript of CANCER in Missouri - Missouri Department of Health...

1
CANCER in Missouri:TRENDS IN DISPARITIES BETWEEN AFRICAN AMERICANS AND WHITES
September 2008
Missouri Department of Health and Senior Services
2
Table of Contents Introduction ..................................................................................................................... 3 African Americans in Missouri ......................................................................................... 3 What is Cancer? .............................................................................................................. 5 Overall Cancer Incidence Trends .................................................................................... 7 Lung Cancer Incidence Trends ..................................................................................... 10 Colorectal Cancer Incidence Trends ............................................................................. 13 Breast Cancer Incidence Trends ................................................................................... 17 Prostate Cancer Incidence Trends ................................................................................ 19 Overall Cancer Mortality Trends .................................................................................... 21 Lung Cancer Mortality Trends ....................................................................................... 24 Colorectal Cancer Mortality Trends ............................................................................... 27 Breast Cancer Mortality Trends ..................................................................................... 30 Prostate Cancer Mortality Trends .................................................................................. 31 Possible Reasons for Changes in Cancer Incidence .................................................... 32 Possible Reasons for Changes in Cancer Mortality ...................................................... 34 Opportunities and Challenges ....................................................................................... 36 Local Intervention Implementation ................................................................................ 38 Methods Used and Sources of Statistics ....................................................................... 41 References .................................................................................................................... 42
Acknowledgment This publication was developed by the Section of Epidemiology for Public Health Practice in the Missouri Department of Health and Senior Services. A summary of this report will be published by Missouri Medicine, Missouri State Medical Association, in 2009. Primary authors: Mario Schootman, Ph.D., Alvin J. Siteman Cancer Center at Washington University School of Medicine and Barnes-Jewish Hospital in St. Louis and Shumei Yun, M.D., Ph.D., Division of Community and Public Health, Missouri Department of Health and Senior Services (at the time of the writing of this report). For more information, please contact Dr. Schootman at [email protected]. This publication was supported by Grant/Cooperative Agreement Number U55/CCU721904-01 from the Centers for Disease Control and Prevention (CDC). Its contents are solely the responsibility of the authors and do not necessarily represent the official views of the CDC. August, 2008. This publication can be reproduced in part or its entirety; however, please cite the original source of the information. AN EQUAL OPPORTUNITY/AFFIRMATIVE ACTION EMPLOYER. Services provided on a nondiscriminatory basis.

3
Introduction Eliminating health disparities is a key goal of the Missouri cancer control plan developed by the Missouri Cancer Consortium and national organizations and agencies including the American Cancer Society, the National Cancer Institute, and the U.S. Department of Health and Human Services. Monitoring trends in cancer incidence (new cancers) and mortality (deaths) over time is key toward reducing disparities. Information provided by cancer incidence and mortality data is useful for cancer prevention programs, clinicians, and policy makers and to help the public better understand the impact of cancer among Missourians. The purpose of this report is to provide information about trends in cancer incidence and mortality over time with special emphasis on disparities between African Americans and whites in Missouri. In addition to the overall incidence and mortality rates, this report also focuses on the four most common cancers: lung, colorectal, prostate, and breast. Missouri’s cancer mortality rates are also compared to the 2010 goals set by the Healthy People 2010 initiative of the U.S. Department of Health and Human Services, which monitors mortality rates for the United States.
African Americans in Missouri According to the U.S. Census Bureau, 662,003 persons in Missouri identified themselves as being African American (alone or in combination with one or more other races) in 2005, which is 11.8 percent of the state’s population. The map shows that African Americans are concentrated in 15 of the 115 counties in Missouri, primarily in the St. Louis, Kansas City, and Columbia areas. Map. Percent African Americans of the total population by county, Missouri 2005.
4
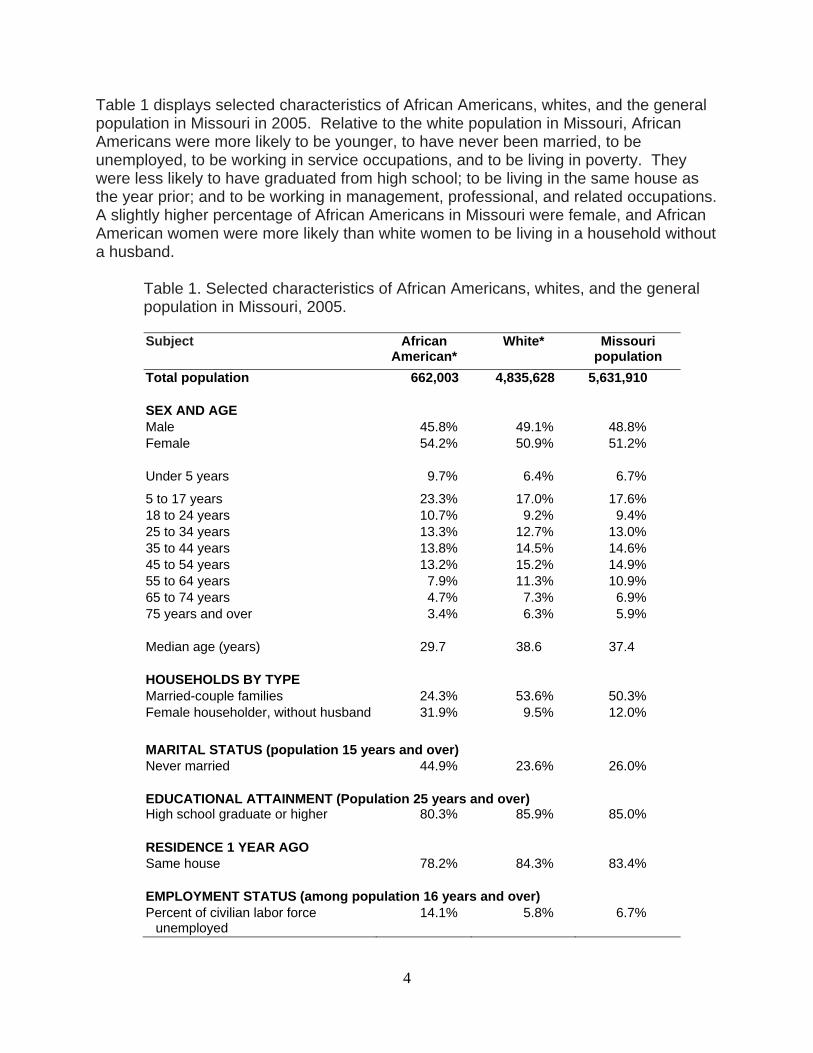
Table 1 displays selected characteristics of African Americans, whites, and the general population in Missouri in 2005. Relative to the white population in Missouri, African Americans were more likely to be younger, to have never been married, to be unemployed, to be working in service occupations, and to be living in poverty. They were less likely to have graduated from high school; to be living in the same house as the year prior; and to be working in management, professional, and related occupations. A slightly higher percentage of African Americans in Missouri were female, and African American women were more likely than white women to be living in a household without a husband.
Table 1. Selected characteristics of African Americans, whites, and the general population in Missouri, 2005. Subject African
American* White* Missouri
population Total population 662,003 4,835,628 5,631,910 SEX AND AGE Male 45.8% 49.1% 48.8% Female 54.2% 50.9% 51.2%
Under 5 years 9.7% 6.4% 6.7%
5 to 17 years 23.3% 17.0% 17.6% 18 to 24 years 10.7% 9.2% 9.4% 25 to 34 years 13.3% 12.7% 13.0% 35 to 44 years 13.8% 14.5% 14.6% 45 to 54 years 13.2% 15.2% 14.9% 55 to 64 years 7.9% 11.3% 10.9% 65 to 74 years 4.7% 7.3% 6.9% 75 years and over 3.4% 6.3% 5.9%
Median age (years) 29.7 38.6 37.4
HOUSEHOLDS BY TYPE Married-couple families 24.3% 53.6% 50.3% Female householder, without husband 31.9% 9.5% 12.0%
MARITAL STATUS (population 15 years and over) Never married 44.9% 23.6% 26.0%
EDUCATIONAL ATTAINMENT (Population 25 years and over)High school graduate or higher 80.3% 85.9% 85.0%
RESIDENCE 1 YEAR AGO Same house 78.2% 84.3% 83.4%
EMPLOYMENT STATUS (among population 16 years and over) Percent of civilian labor force
unemployed 14.1% 5.8% 6.7%

5
Table 1. Selected characteristics of African Americans, whites, and the general population in Missouri, 2005. (continued) Subject African
American* White* Missouri
population
OCCUPATION Management, professional, and
related occupations 23.1% 32.9% 32.0%
Construction, extraction, maintenance, and repair occupations
5.9% 10.7% 10.2%
Service occupations 28.4% 14.6% 16.1% INCOME IN 2005 Median household income (dollars) 28,742 44,021 41,974
POVERTY RATES All families 24.5% 8.1% 10.0% * alone or in combination with one or more other races
What is Cancer?
Cancer is a group of diseases characterized by the uncontrolled growth and spread of abnormal cells. If the spread is not controlled, it could result in death. Most types of cancer cells form a lump or mass called a tumor and are named after the part of the body where the tumor originates. Most lung cancer starts in the lining of the bronchi, although it can also start in other parts of the lung. Lung cancer often takes many years to develop. It develops from areas of pre-cancerous changes in the lung that can’t be seen on an x-ray. It does not cause symptoms until the tumor becomes large enough to show up on an x-ray. Lung cancer is a life-threatening disease because it often spreads to other parts of the body before it is found. Cancer of the colon or rectum (colorectal cancer) can start in any of the four sections of the colon or in the rectum. In most cases, colorectal cancers develop slowly over a period of several years. Most of these cancers begin as a polyp, which is a growth of tissue that starts in the lining and grows into the center of the colon or rectum. A type of polyp known as an adenoma can become cancerous, and removing these polyps early may prevent cancer. Prostate cancer occurs only in males because the prostate gland is unique to men. The gland is located just below the bladder and in front of the rectum and is about the size of a walnut. The tube that carries urine runs through the prostate. The prostate contains cells that make some of the fluid (semen) that protects and nourishes the sperm. Although there are several cell types in the prostate, nearly all prostate cancers start in the gland cells. Most of the time, prostate cancer grows slowly. Autopsy studies show

6
that many men who died of other diseases also had prostate cancer that never caused a problem during their lives. Breast cancer occurs mostly in women, but it can be diagnosed in men as well. Breast cancer is a malignant (cancerous) tumor that starts from cells in the breast. There are many types of breast cancer, though some of them are very rare. Invasive (infiltrating) ductal carcinoma is the most common breast cancer. It starts in a milk passage or duct, breaks through the wall of the duct, and invades the tissue of the breast. From there it can spread to other parts of the body. This type of malignancy accounts for about 80 percent of invasive breast cancers.

7
Overall Cancer Incidence Trends
Figure 1. Trends in observed and predicted age-adjusted cancer incidence rates by race, Missouri 1996-2003.
0
100
200
300
400
500
600
1996 1997 1998 1999 2000 2001 2002 2003Year of diagnosis
Rat
e (p
er 1
00,0
00
popu
latio
n)
Observed white rate Predicted white rateObserved African American rate Predicted African American rate
During 1996-2003, cancer was diagnosed in 219,450 Missourians for an average of 27,431 new cancers per year (2,459 African Americans and 24,730 whites). During this time period, overall age-adjusted cancer incidence declined 5 percent from an age-adjusted rate of 488.1 per 100,000 Missourians in 1996 to 453.3 per 100,000 Missourians in 2003. The four most frequently occurring cancers in 1996 (lung and bronchus; colon and rectum; breast; and prostate) remained the top four newly diagnosed cancers in 2003. The age-adjusted cancer incidence rate in Missouri declined 0.8 percent per year during 1996-2003. The rate declined faster among African Americans than whites in Missouri, decreasing 2.2 percent and 0.7 percent per year, respectively. During 1996-2003, cancer incidence among African Americans in Missouri decreased 14 percent while the decline among white Missourians was much lower at 5 percent. As a result of the steeper decline among African Americans, the difference relative to whites also declined over time. In 1996, the cancer incidence rate among African American Missourians was 18 percent higher than in white Missourians. This was reduced to 6 percent by 2003. If the declines observed during 1996-2003 continued after 2003, it is expected that overall cancer incidence disparities, regardless of the type of cancer, will have disappeared by the year 2006.

8
Figure 2. Trends in observed and predicted age-adjusted cancer incidence rates among males by race, Missouri 1996-2003.
0100200300400500600700800
1996 1997 1998 1999 2000 2001 2002 2003Year of diagnosis
Rat
e (p
er 1
00,0
00
popu
latio
n)
Observed white rate Predicted white rateObserved African American rate Predicted African American rate
During 1996-2003, cancer was diagnosed in 111,536 Missouri males for an average of 13,942 per year (1,268 African Americans and 12,556 whites). During this time period, the cancer incidence rate among males in Missouri declined an average of 1.2 percent per year. The rate declined faster among African American males than white males, decreasing 2.9 percent and 1.0 percent per year, respectively. As a result of the steeper decline among African Americans, the racial disparity also has declined over time in Missouri. In 1996, the cancer incidence rate among African American males was 31.9 percent higher than in white males in Missouri. This rate was reduced by about half to 15.7 percent in 2003. During 1996-2003, overall cancer incidence among African American males declined by 18.4 percent while it declined 7.0 percent among white males in Missouri. If the declines seen during 1996-2003 continue after 2003, it is expected that cancer incidence disparities among males in Missouri will disappear by the year 2012.

9
Figure 3. Trends in observed and predicted age-adjusted cancer incidence rates among females by race, Missouri 1996-2003.
0
100
200
300
400
500
1996 1997 1998 1999 2000 2001 2002 2003
Year of diagnosis
Rat
e (p
er 1
00,0
00
popu
latio
n)
Observed white rate Predicted white rateObserved African American rate Predicted African American rate
During 1996-2003, cancer was diagnosed in 107,911 Missouri females for an average of 13,489 cancers per year (1,191 African Americans and 12,173 whites). During this time period, the overall cancer incidence rate among females in Missouri declined 0.6 percent per year. The rate declined faster among African American females than white females in Missouri, decreasing 1.6 percent and 0.5 percent per year, respectively. While the rate among African American females was 5.6 percent higher than white females in 1996 in Missouri, this was reversed by 2003 when African American females had an incidence rate 2.4 percent lower than that of white females. Racial disparities in overall cancer incidence have in effect disappeared among Missouri females.

10
Lung Cancer Incidence Trends
Figure 4. Trends in observed and predicted age-adjusted incidence rates for lung cancer by race, Missouri 1996-2003.
0
20
40
60
80
100
120
1996 1997 1998 1999 2000 2001 2002 2003Year of diagnosis
Rat
e (p
er 1
00,0
00 p
opul
atio
n)
Observed white rate Predicted white rateObserved African American rate Predicted African American rate
During 1996-2003, lung cancer was diagnosed in 37,551 Missourians for an average of 4,694 new lung cancers per year (436 African Americans and 4,230 whites). During this time period, the age-adjusted lung cancer incidence rate in Missouri, regardless of race, remained unchanged. Age-adjusted incidence rates for lung cancer during 1996-2003 declined an estimated 2.2 percent per year among African Americans and 0.7 percent among whites in Missouri (although the decline among whites was not statistically different from a stable rate). By the year 2003, age-adjusted incidence rates had declined 4.6 percent for whites and 14.6 percent for African Americans in Missouri since 1996. As a result, the racial disparity in the age-adjusted incidence rates between African Americans and whites in Missouri decreased over time. In 1996, the age-adjusted lung cancer incidence rate was 25.9 percent higher among African Americans than whites. By 2003, the disparity was reduced by about half with an age-adjusted lung cancer incidence rate among African Americans at 12.8 percent higher than whites.
11
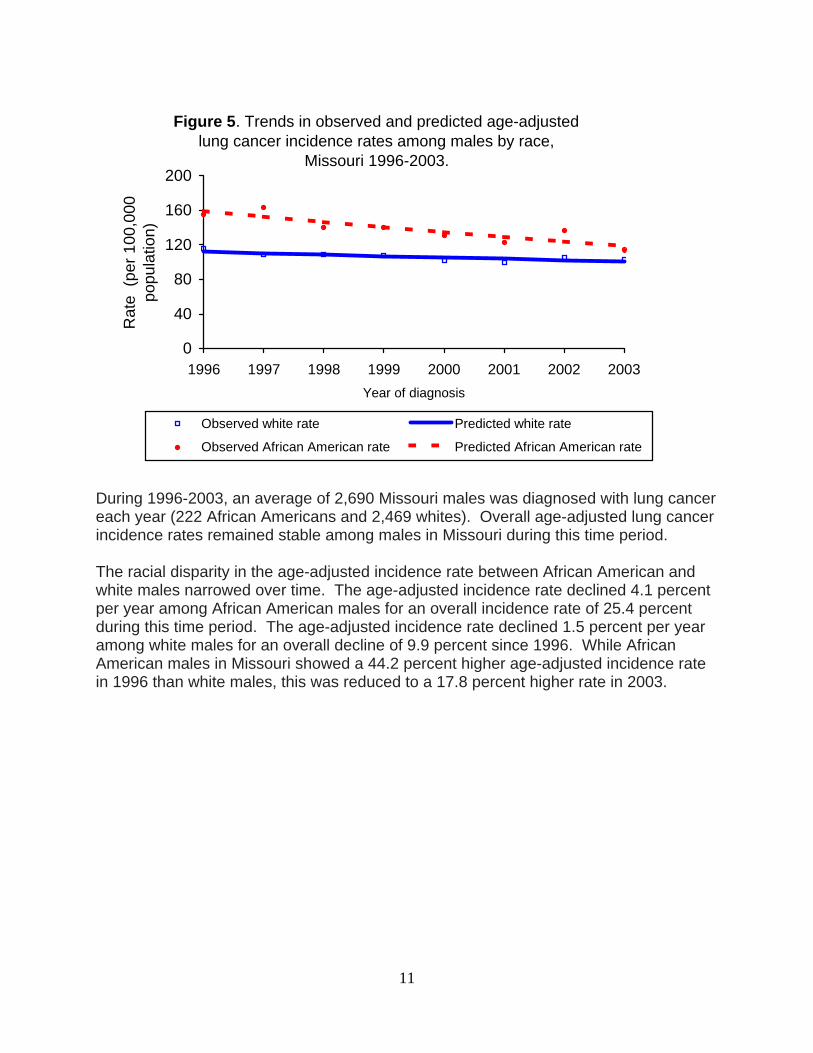
Figure 5. Trends in observed and predicted age-adjusted lung cancer incidence rates among males by race,
Missouri 1996-2003.
0
40
80
120
160
200
1996 1997 1998 1999 2000 2001 2002 2003Year of diagnosis
Rat
e (p
er 1
00,0
00
popu
latio
n)
Observed white rate Predicted white rate
Observed African American rate Predicted African American rate
During 1996-2003, an average of 2,690 Missouri males was diagnosed with lung cancer each year (222 African Americans and 2,469 whites). Overall age-adjusted lung cancer incidence rates remained stable among males in Missouri during this time period. The racial disparity in the age-adjusted incidence rate between African American and white males narrowed over time. The age-adjusted incidence rate declined 4.1 percent per year among African American males for an overall incidence rate of 25.4 percent during this time period. The age-adjusted incidence rate declined 1.5 percent per year among white males for an overall decline of 9.9 percent since 1996. While African American males in Missouri showed a 44.2 percent higher age-adjusted incidence rate in 1996 than white males, this was reduced to a 17.8 percent higher rate in 2003.
12
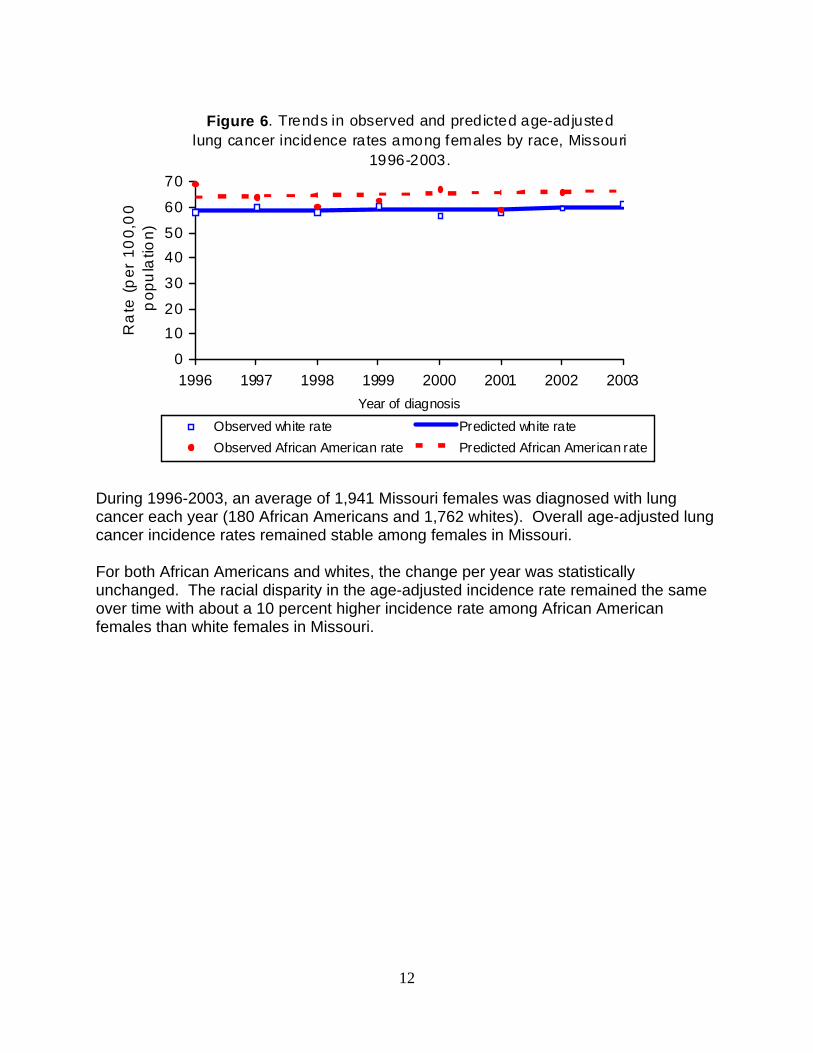
Figure 6. Trends in observed and predicted age-adjusted lung cancer incidence rates among females by race, Missouri
1996-2003.
0
1020
30
4050
60
70
1996 1997 1998 1999 2000 2001 2002 2003Year of diagnosis
Ra
te (
per
10
0,0
0p
opu
latio
n)
Observed white rate Predicted white rateObserved African American rate Predicted African American rate
During 1996-2003, an average of 1,941 Missouri females was diagnosed with lung cancer each year (180 African Americans and 1,762 whites). Overall age-adjusted lung cancer incidence rates remained stable among females in Missouri. For both African Americans and whites, the change per year was statistically unchanged. The racial disparity in the age-adjusted incidence rate remained the same over time with about a 10 percent higher incidence rate among African American females than white females in Missouri.

13
Colorectal Cancer Incidence Trends
Figure 7. Trends in observed and predicted age-adjusted colorectal cancer incidence rates by race, Missouri 1996-2003.
0
20
40
60
80
100
1996 1997 1998 1999 2000 2001 2002 2003Year of diagnosis
Rat
e (p
er 1
00,0
00
popu
latio
n)
Observed white rate Predicted white rate
Observed African American rate Predicted African American rate
During 1996-2003, colorectal cancer was diagnosed in 27,282 Missourians for an average of 3,410 new cancers per year (314 African Americans and 3,071 whites). During this time period, overall colorectal cancer incidence remained stable. However, incidence declined 5.3 percent per year during 2001-2003. Age-adjusted colorectal cancer incidence rates declined during 1996-2003 an estimated 1.6 percent per year among African Americans, which was statistically equivalent to no change over time. While there was no change in incidence among whites during 1996-2001, the age-adjusted incidence rate declined 5.8 percent per year during 2001-2003. By 2003, the age-adjusted incidence rates had declined 10.9 percent for whites and 10.7 percent for African Americans in Missouri since 1996. In 1996, the age-adjusted colorectal cancer incidence rate was 25.7 percent higher among African Americans than whites. No change in disparities was observed in 2003 relative to 1996; the age-adjusted colorectal cancer incidence was 25.9 percent higher for African Americans than for whites. However, since 2001, disparities between African Americans and whites in colorectal cancer incidence have been increasing. If this trend continues, the disparity between African Americans and whites in colorectal cancer incidence will increase over time in Missouri.

14
Figure 8. Trends in observed and predicted age-adjusted colorectal cancer incidence rates by race among males,
Missouri 1996-2003.
0
20
40
60
80
100
1996 1997 1998 1999 2000 2001 2002 2003Year of diagnosis
Rat
e (p
er 1
00,0
00
popu
latio
n)
Observed white rate Predicted white rate
Observed African American rate Predicted African American rate
During 1996-2003, the Missouri Cancer Registry reported 13,713 new colorectal cancers among males in Missouri (12,432 white males and 1171 African American males). This represents an average of 1,554 white males and 146 African American males per year. During this time period, overall age-adjusted incidence rates for colorectal cancer declined 1.4 percent per year among males in Missouri, but this was statistically equivalent to no change. Prior to 2001, the racial disparity in the age-adjusted incidence rate narrowed over time among males. However, the racial disparity appeared to increase after 2001. The age-adjusted incidence rate remained unchanged during 1996-2001 among white males. It declined 5.9 percent per year during 2001-2003, although statistically this was equivalent to no change. Since 1996, the age-adjusted incidence rate has declined 11.2 percent among white males. There was an overall decline of 14.2 percent in the incidence rate during this time period among African American males. In 1996, the age-adjusted colorectal cancer incidence rate was 24.5 percent higher among African Americans males than white males. No change in the disparity rate was observed in 2003 compared to 1996 – the age-adjusted colorectal cancer incidence was 27.7 percent higher for African American males than for white males.

15
Figure 9. Trends in observed and predicted age-adjusted colorectal cancer incidence rates by race among females,
Missouri 1996-2003.
0
20
40
60
80
100
1996 1997 1998 1999 2000 2001 2002 2003Year of diagnosis
Rat
e (p
er 1
00,0
00
popu
latio
n)
Observed white rate Predicted white rateObserved African American rate Predicted African American rate
During 1996-2003, the Missouri Cancer Registry reported 13,569 new colorectal cancer cases among females in Missouri (12,136 white females and 1,338 African American females). This represents an average of 1,554 white females and 146 African American females per year. Among white females in Missouri, the age-adjusted incidence rate declined by 1.5 percent per year during 1996-2003, which was statistically equivalent to no change over time. By 2003, the overall decline in the incidence rate was 9.9 percent since 1996. The annual decline was 1.1 percent among African American females, which also was statistically equivalent to no change over time. Overall, the age-adjusted incidence rate declined 7.6 percent during this time period for African American females. As a result of the somewhat similar declines over time between African American and white females, the racial disparity in the age-adjusted incidence rate remained the same. In 1996, the age-adjusted colorectal cancer incidence rate was 24.5 percent higher among African American females than white females. By 2003, the age-adjusted colorectal cancer incidence was 20.2 percent higher for African American females than for white females. As a result, little change in disparity rates was observed during 1996-2003.

16
Figure 10. Trends in observed and predicted age-adjusted distant colorectal cancer rates by race, Missouri 1996-2003.
0
5
10
15
20
25
30
1996 1997 1998 1999 2000 2001 2002 2003Year of diagnosis
Rat
e (p
er 1
00,0
00
popu
latio
n)
Observed white rate Predicted white rateObserved African American rate Predicted African American rate
During the 1996-2003 time period, 17.3 percent of the 27,282 colorectal cancer cases in Missouri were diagnosed at distant stage. This stage is the least likely to be curable. During this time, the age-adjusted rate declined 1.6 percent per year. Of the colorectal cancer cases diagnosed at distant stage, 4,135 were among whites and 554 were among African Americans. The rate of distant colorectal cancer declined 1.4 percent per year among whites during this time period. Although the rate of distant colorectal cancer declined 3.1 percent per year among African Americans during 1996-2003, this was statistically the same as no change. This may have been due to the relatively few distant colorectal cancers among African Americans (an average of about 69 per year). During the entire time period of 1996-2003, the overall decline in the rate of distant colorectal cancer was 19.7 percent among African Americans and 9.4 percent among whites. In 1996, the rate of distant colorectal cancer was 67.1 percent higher among African Americans than whites. By 2003, the disparity between African Americans and whites had declined to 48.2 percent higher for African Americans than whites.
17
Breast Cancer Incidence Trends
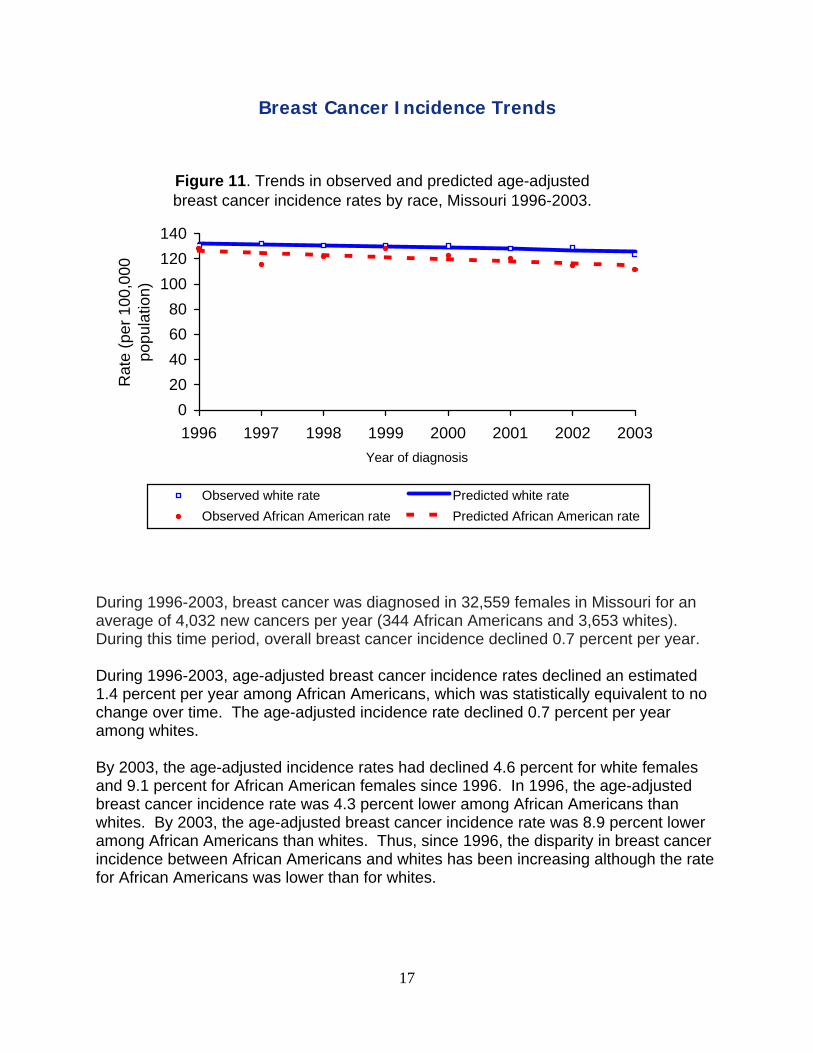
Figure 11. Trends in observed and predicted age-adjusted breast cancer incidence rates by race, Missouri 1996-2003.
020406080
100120140
1996 1997 1998 1999 2000 2001 2002 2003Year of diagnosis
Rat
e (p
er 1
00,0
00
popu
latio
n)
Observed white rate Predicted white rateObserved African American rate Predicted African American rate
During 1996-2003, breast cancer was diagnosed in 32,559 females in Missouri for an average of 4,032 new cancers per year (344 African Americans and 3,653 whites). During this time period, overall breast cancer incidence declined 0.7 percent per year. During 1996-2003, age-adjusted breast cancer incidence rates declined an estimated 1.4 percent per year among African Americans, which was statistically equivalent to no change over time. The age-adjusted incidence rate declined 0.7 percent per year among whites. By 2003, the age-adjusted incidence rates had declined 4.6 percent for white females and 9.1 percent for African American females since 1996. In 1996, the age-adjusted breast cancer incidence rate was 4.3 percent lower among African Americans than whites. By 2003, the age-adjusted breast cancer incidence rate was 8.9 percent lower among African Americans than whites. Thus, since 1996, the disparity in breast cancer incidence between African Americans and whites has been increasing although the rate for African Americans was lower than for whites.

18
Figure 12. Trends in observed and predicted age-adjusted localized breast cancer incidence rates by race, Missouri 1996-
2003.
0
20
40
60
80
100
1996 1997 1998 1999 2000 2001 2002 2003Year of diagnosis
Rat
e (p
er 1
00,0
00
popu
latio
n)
Observed white rate Predicted white rateObserved African American rate Predicted African American rate
During the 1996-2003 time period, 59.7 percent of the 32,559 breast cancers in Missouri were diagnosed at the localized stage. This stage is the most likely to be curable. During 1996-1998, the age-adjusted localized rate remained stable. Starting in 1998, the age-adjusted localized rate declined 1.4 percent per year. During 1996-2003, breast cancer was diagnosed at the localized stage in 17,861 whites and 1,440 African Americans. The rate of localized breast cancer remained nearly stable during 1996-1998, but declined 1.2 percent per year starting in 1998 among whites. The age-adjusted rate of localized breast cancer remained stable during 1996-2003 among African Americans. In 1996, the rate of localized breast cancer was 15.0 percent lower among African Americans than among whites. By 2003, the disparity had increased to a rate 19.3 percent lower for African Americans than for whites.

19
Prostate Cancer Incidence Trends
During 1996-2003, prostate cancer was diagnosed in 28,532 Missouri men for an average of 3,567 new cancers per year (396 African Americans and 3,138 whites). During this time period, the overall age-adjusted incidence rate in Missouri, regardless of race, remained unchanged. Age-adjusted incidence rates for prostate cancer declined an estimated 3.5 percent per year among African American men and remained stable among white men in Missouri from 1996 to 2003. By 2003, age-adjusted incidence rates had declined 9.1 percent among white men and 21.8 percent among African American men since 1996. As a result, disparities in age-adjusted incidence rates between African American men and white men in Missouri declined over time. In 1996, the age-adjusted prostate cancer incidence rate was 74.4 percent higher among African American men than white men. By 2003, this difference was reduced to an age-adjusted rate of 50.0 percent higher for African American men.
Figure 13. Trends in observed and predicted age-adjusted incidence rates for prostate cancer among males by race,
Missouri 1996-2003.
0
50
100
150
200
250
300
1996 1997 1998 1999 2000 2001 2002 2003
Year of diagnosis
Rat
e (p
er 1
00,0
00
popu
latio
n)
Observed white rate Predicted white rateObserved African American rate Predicted African American rate
20
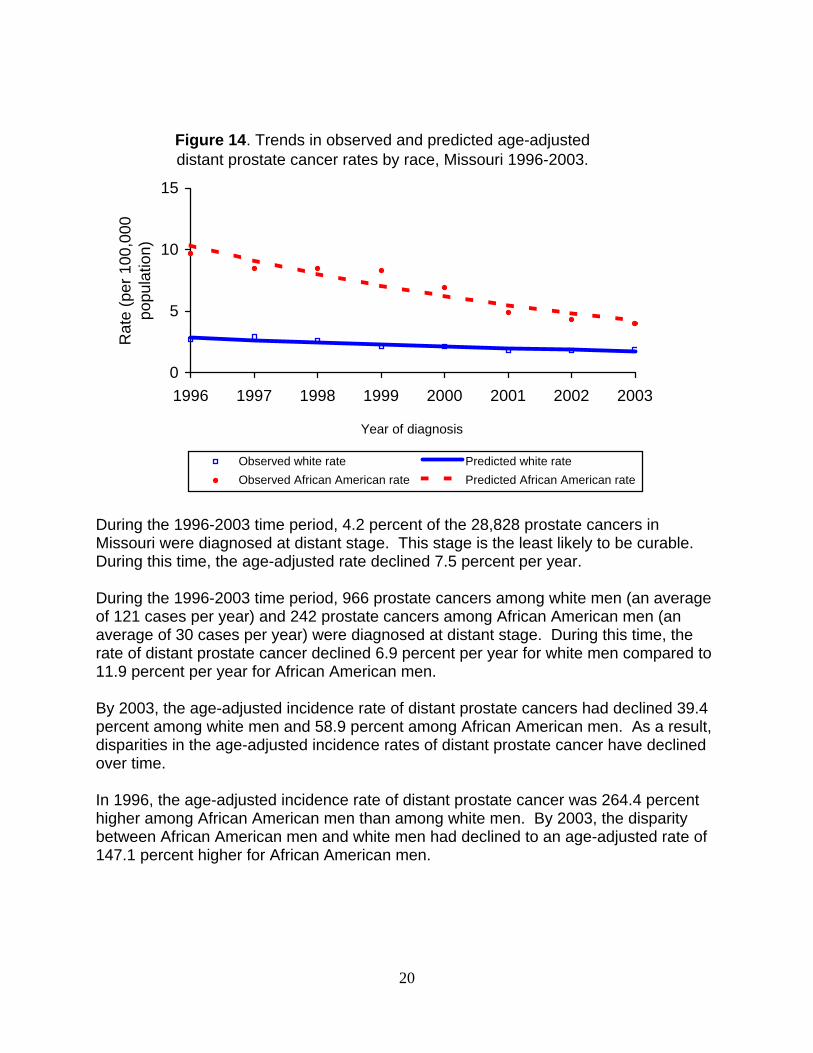
Figure 14. Trends in observed and predicted age-adjusted distant prostate cancer rates by race, Missouri 1996-2003.
0
5
10
15
1996 1997 1998 1999 2000 2001 2002 2003
Year of diagnosis
Rat
e (p
er 1
00,0
00
popu
latio
n)
Observed white rate Predicted white rateObserved African American rate Predicted African American rate
During the 1996-2003 time period, 4.2 percent of the 28,828 prostate cancers in Missouri were diagnosed at distant stage. This stage is the least likely to be curable. During this time, the age-adjusted rate declined 7.5 percent per year. During the 1996-2003 time period, 966 prostate cancers among white men (an average of 121 cases per year) and 242 prostate cancers among African American men (an average of 30 cases per year) were diagnosed at distant stage. During this time, the rate of distant prostate cancer declined 6.9 percent per year for white men compared to 11.9 percent per year for African American men. By 2003, the age-adjusted incidence rate of distant prostate cancers had declined 39.4 percent among white men and 58.9 percent among African American men. As a result, disparities in the age-adjusted incidence rates of distant prostate cancer have declined over time. In 1996, the age-adjusted incidence rate of distant prostate cancer was 264.4 percent higher among African American men than among white men. By 2003, the disparity between African American men and white men had declined to an age-adjusted rate of 147.1 percent higher for African American men.

21
Overall Cancer Mortality Trends
Figure 15. Trends in observed and predicted age-adjusted cancer mortality rates by race, Missouri 1990-2005.
0
50
100
150
200
250
300
350
1990 1991 1992 1993 1994 1995 1996 1997 1998 1999 2000 2001 2002 2003 2004 2005
Year of death
Rat
e (p
er 1
00,0
00
popu
latio
n)
Observed white rate Predicted white rateObserved African American rate Predicted African American rateHealthy People 2010 target (159.9 per 100,000)
During 1990-2005, a total of 194,304 Missourians died from cancer for an average of 12,144 deaths per year (1,236 African Americans and 10,848 whites). During this time period, the overall cancer mortality rate declined 10.5 percent from an age-adjusted rate of 218.9 per 100,000 Missourians in 1990 to 197.1 per 100,000 Missourians in 2005. The cancer mortality rate in Missouri during 1990-2005 declined 0.7 percent per year. During this time period, the mortality rate declined faster among African Americans than among whites in Missouri, 1.5 percent and 0.8 percent per year, respectively. There has been an overall decline in the cancer mortality rate among African Americans in Missouri, at 20.5 percent, while the decline among white Missourians was much lower, at 8.0 percent, during this time period. As a result of the steeper decline in cancer mortality rates among African Americans, the racial disparity also has declined over time. In 1990, the African American mortality rate was 48.1 percent higher than the white mortality rate. By 2005, the African American cancer mortality rate had dropped to 28.2 percent higher than the rate for white Missourians. If the declines observed during 1990-2005 continued at the same rate, it is expected that disparities in cancer mortality rates will not disappear for decades. In addition, the national goal of 159.9 deaths per 100,000 population by the year 2010 is unlikely to be achieved in Missouri for both African Americans and whites. This goal will only be reached decades later.
22
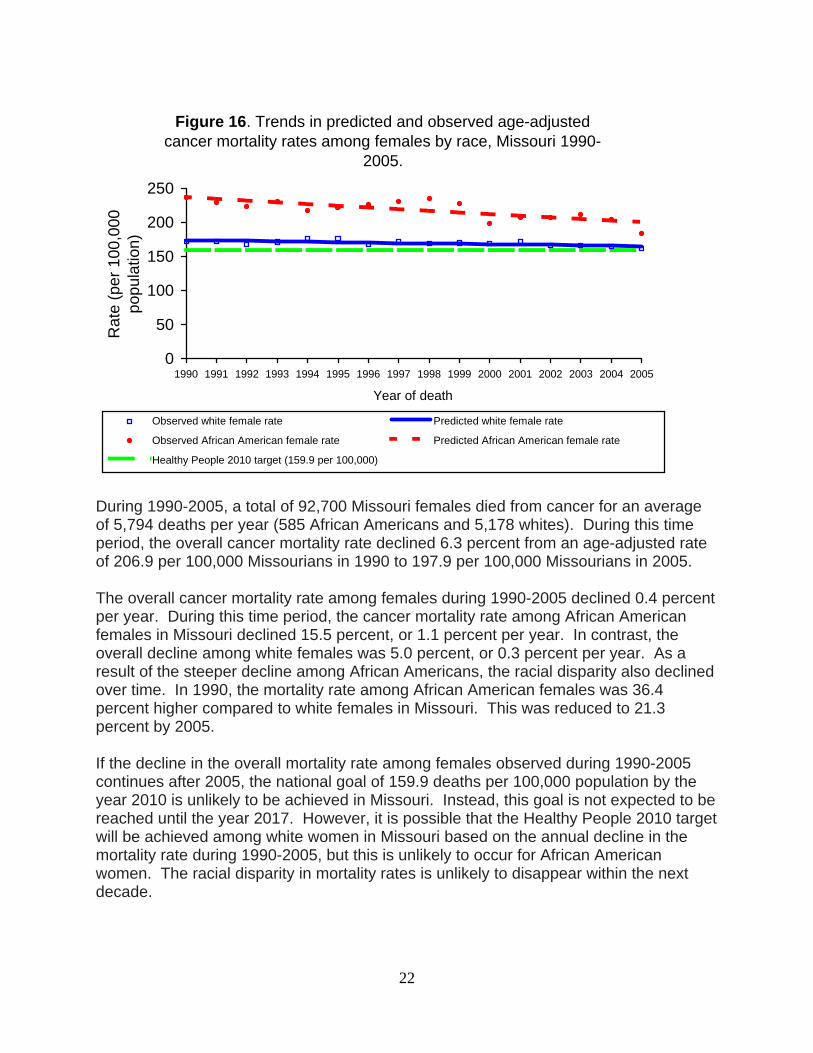
Figure 16. Trends in predicted and observed age-adjusted cancer mortality rates among females by race, Missouri 1990-
2005.
0
50
100
150
200
250
1990 1991 1992 1993 1994 1995 1996 1997 1998 1999 2000 2001 2002 2003 2004 2005
Year of death
Rat
e (p
er 1
00,0
00
popu
latio
n)
Observed white female rate Predicted white female rate
Observed African American female rate Predicted African American female rate
Healthy People 2010 target (159.9 per 100,000)
During 1990-2005, a total of 92,700 Missouri females died from cancer for an average of 5,794 deaths per year (585 African Americans and 5,178 whites). During this time period, the overall cancer mortality rate declined 6.3 percent from an age-adjusted rate of 206.9 per 100,000 Missourians in 1990 to 197.9 per 100,000 Missourians in 2005. The overall cancer mortality rate among females during 1990-2005 declined 0.4 percent per year. During this time period, the cancer mortality rate among African American females in Missouri declined 15.5 percent, or 1.1 percent per year. In contrast, the overall decline among white females was 5.0 percent, or 0.3 percent per year. As a result of the steeper decline among African Americans, the racial disparity also declined over time. In 1990, the mortality rate among African American females was 36.4 percent higher compared to white females in Missouri. This was reduced to 21.3 percent by 2005. If the decline in the overall mortality rate among females observed during 1990-2005 continues after 2005, the national goal of 159.9 deaths per 100,000 population by the year 2010 is unlikely to be achieved in Missouri. Instead, this goal is not expected to be reached until the year 2017. However, it is possible that the Healthy People 2010 target will be achieved among white women in Missouri based on the annual decline in the mortality rate during 1990-2005, but this is unlikely to occur for African American women. The racial disparity in mortality rates is unlikely to disappear within the next decade.

23
Figure 17. Trends in observed and predicted age-adjusted cancer mortality rates among males by race, Missouri 1990-
2005.
0
100
200
300
400
500
1990 1991 1992 1993 1994 1995 1996 1997 1998 1999 2000 2001 2002 2003 2004 2005
Year of death
Rat
e (p
er 1
00,0
00
popu
latio
n)
Observed white male rate Predicted white male rateObserved African American male rate Predicted African American male rateHealthy People 2010 target (159.9 per 100,000)
During 1990-2005, a total of 101,604 Missouri males died from cancer for an average of 6,350 deaths per year (651 African Americans and 5,670 whites). During this time period, the overall cancer mortality rate among males in Missouri declined 16.2 percent from an age-adjusted rate of 249.4 per 1000,000 Missourians in 1990 to 237.3 per 100,000 Missourians in 2005. The overall cancer mortality rate among males in Missouri declined 1.2 percent per year during 1990-2005. The cancer mortality rate decreased faster among African American males than among white males in Missouri, 1.8 percent and 1.1 percent per year, respectively. As a result of the steeper decline among African Americans, the racial disparity also declined over time. In 1990, the mortality rate among African American males was 54.9 percent higher than white males in Missouri. By 2005, this was reduced to a mortality rate 37.9 percent higher among African Americans. It is unlikely that the Healthy People 2010 target of 159.9 deaths per 100,000 population will be achieved among African American and white men in Missouri based on the annual decline in mortality rate during 1990-2005. Instead, this goal is expected to be reached decades later. Moreover, the racial disparity in mortality rates is unlikely to disappear within the next decade.
24
Lung Cancer Mortality Trends
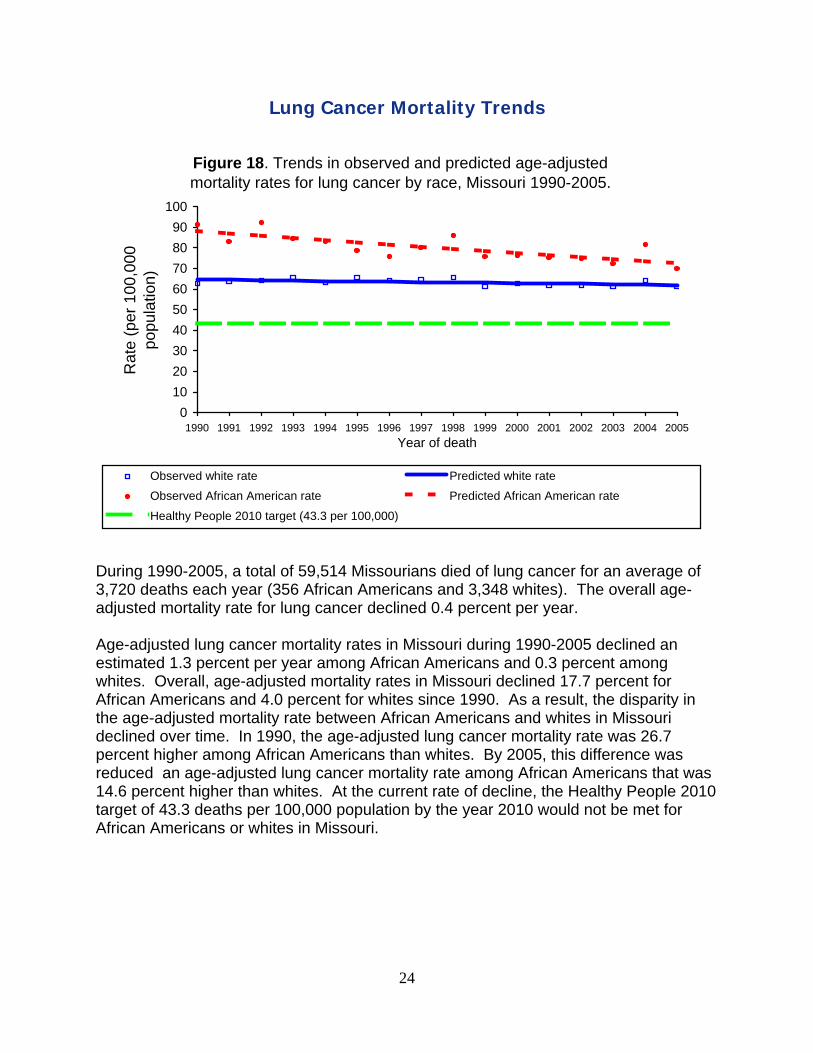
Figure 18. Trends in observed and predicted age-adjusted mortality rates for lung cancer by race, Missouri 1990-2005.
0102030405060708090
100
1990 1991 1992 1993 1994 1995 1996 1997 1998 1999 2000 2001 2002 2003 2004 2005Year of death
Rat
e (p
er 1
00,0
00
popu
latio
n)
Observed white rate Predicted white rate
Observed African American rate Predicted African American rate
Healthy People 2010 target (43.3 per 100,000)
During 1990-2005, a total of 59,514 Missourians died of lung cancer for an average of 3,720 deaths each year (356 African Americans and 3,348 whites). The overall age-adjusted mortality rate for lung cancer declined 0.4 percent per year. Age-adjusted lung cancer mortality rates in Missouri during 1990-2005 declined an estimated 1.3 percent per year among African Americans and 0.3 percent among whites. Overall, age-adjusted mortality rates in Missouri declined 17.7 percent for African Americans and 4.0 percent for whites since 1990. As a result, the disparity in the age-adjusted mortality rate between African Americans and whites in Missouri declined over time. In 1990, the age-adjusted lung cancer mortality rate was 26.7 percent higher among African Americans than whites. By 2005, this difference was reduced an age-adjusted lung cancer mortality rate among African Americans that was 14.6 percent higher than whites. At the current rate of decline, the Healthy People 2010 target of 43.3 deaths per 100,000 population by the year 2010 would not be met for African Americans or whites in Missouri.

25
Figure 19. Trends in observed and predicted age-adjusted mortality rates for lung cancer among males by race, Missouri 1990-2005.
0
40
80
120
160
200
1990 1991 1992 1993 1994 1995 1996 1997 1998 1999 2000 2001 2002 2003 2004 2005Year of death
Rat
e (p
er 1
00,0
00
popu
latio
n)
Observed white rate Predicted white rate
Observed African American rate Predicted African American rate
Healthy People 2010 target (43.3 per 100,000)
During 1990-2005, a total of 36,375 Missouri males died of lung cancer for an average of 2,273 deaths each year (219 African Americans and 2,045 whites). The age-adjusted lung cancer mortality rates declined 1.4 percent per year among males in Missouri during this time period. The racial disparity in the age-adjusted mortality rate narrowed over time among males. The age-adjusted mortality rate declined 2.1 percent per year among African American males for an overall decline in rate of 27.0 percent during this time period. The age-adjusted mortality rate declined 1.3 percent per year among white males for an overall decline of 18.4 percent. In 1990, the age-adjusted mortality rate was 30.6 percent higher among African American males when compared to white males. However, this was reduced to a 22.3 percent higher rate in African Americans in 2005. At the current rate of decline, the age-adjusted mortality rate for white males and for African American males would clearly not reach the Healthy People 2010 target of 43.3 deaths per 100,000 population.

26
Figure 20. Trends in observed and predicted age-adjusted mortality rates for lung cancer among females by race,
Missouri 1990-2005.
0
10
20
30
40
50
60
1990 1991 1992 1993 1994 1995 1996 1997 1998 1999 2000 2001 2002 2003 2004 2005Year of death
Rat
e (p
er 1
00,0
00
popu
latio
n)
Observed white rate Predicted white rateObserved African American rate Predicted African American rateHealthy People 2010 target (43.3 per 100,000)
During 1990-2005, a total of 23,139 Missouri females died of lung cancer for an average of 1,446 deaths each year (137 African Americans and 1,303 whites). Among whites, the age-adjusted mortality rate increased by 2.7 percent per year during 1990-1997 and remained constant during 1997-2005. The age-adjusted mortality rate was constant during the entire period of 1990-2005 among African American females. As a result, the racial disparity in the age-adjusted mortality rate decreased over time among females in Missouri during 1990-1997, but remained stable beginning in 1997. In 1990, African American females had a 26.9 percent higher age-adjusted mortality rate, but this rate had decreased to 11.5 percent by 2005. While the age-adjusted lung cancer mortality rate for white women was below the Healthy People 2010 target of 43.3 per 100,000 population during 1990-1997, it was slightly higher than the target rate starting in 1997 at about 46 per 100,000 population. Because the lung cancer mortality rate did not decline over time since 1990, the age-adjusted mortality rate for African American females is unlikely to reach the Healthy People 2010 target.

27
Colorectal Cancer Mortality Trends
Figure 21. Trends in observed and predicted age-adjusted mortality rates for colorectal cancer by race, Missouri 1990-2005.
05
10152025303540
1990 1991 1992 1993 1994 1995 1996 1997 1998 1999 2000 2001 2002 2003 2004 2005
Year of death
Rat
e (p
er 1
00,0
00
popu
latio
n)
Observed white rate Predicted white rateObserved African American rate Predicted African American rateHealthy People 2010 target (13.9 per 100,000)
During 1990-2005, a total of 20,654 Missourians died of colorectal cancer for an average of 1,291 deaths each year (132 African Americans and 1,153 whites). Overall age-adjusted colorectal cancer mortality rates during 1990-2005 declined 1.8 percent per year. During this time period, age-adjusted colorectal cancer mortality rates declined an estimated 1.7 percent per year among African Americans and 1.8 percent per year among whites in Missouri. Overall, age-adjusted mortality rates declined 22.4 percent for African Americans and 23.2 percent for whites since 1990. As a result of the similar declines over time, the mortality rate among African Americans remained about 42 percent higher than among whites in Missouri during the entire time period. Thus, the racial disparity remained the same over time. At the rate of decline seen during 1990-2005, the Healthy People 2010 target of 13.9 per 100,000 population would not be reached for African Americans and whites in Missouri by 2010.

28
Figure 22. Trends in observed and predicted age-adjusted mortality rates for colorectal cancer among males by race,
Missouri 1990-2005.
0
10
20
30
40
50
60
1990 1991 1992 1993 1994 1995 1996 1997 1998 1999 2000 2001 2002 2003 2004 2005
Year of death
Rat
e (p
er 1
00,0
00
popu
latio
n)
Observed white male rate Predicted white male rateObserved African American male rate Predicted African American male rateHealthy People 2010 target (13.9 per 100,000)
During 1990-2005, a total of 10,076 Missouri males died of colorectal cancer for an average of 630 deaths each year (63 African Americans and 564 whites). Overall age-adjusted mortality rates for colorectal cancer during 1990-2005 declined 2.1 percent per year among males in Missouri. The racial disparity in age-adjusted mortality rate narrowed over time among males. The age-adjusted mortality rate declined 3.1 percent per year among African American males for an overall decline of 37.2 percent during this time period. In contrast, the age-adjusted mortality rate declined 2.0 percent per year among white males for an overall decline of 25.7 percent since 1990. While African American males in Missouri showed a 56 percent higher age-adjusted mortality rate in 1990 relative to white males, this was reduced to a 32 percent higher rate by 2005. At the rates of decline seen during 1990-2005, the age-adjusted mortality rate for white and African American males clearly would not reach the Healthy People 2010 target of 13.9 per 100,000 population by the year 2010. Disparities would not disappear until at least the year 2020.

29
Figure 23. Trends in predicted and observed age-adjusted mortality rates for colorectal cancer among females by race,
Missouri 1990-2005.
0
10
20
30
1990 1991 1992 1993 1994 1995 1996 1997 1998 1999 2000 2001 2002 2003 2004 2005
Year of death
Rat
e (p
er 1
00,0
00
popu
latio
n)
Observed white female rate Predicted white female rate
Observed African American female rate Predicted African American female rate
Healthy People 2010 target (13.9 per 100,000)
During 1990-2005, a total of 10,578 Missouri females died of colorectal cancer for an average of 661 deaths each year (68 African Americans and 590 whites). Among white females in Missouri, the age-adjusted mortality rate declined by 1.8 percent per year during 1990-2005 for an overall decline of 23.3 percent since 1990. In contrast, the decline was only 0.7 percent per year among African American females, which was statistically unchanged from a rate that was constant over time. Overall, the age-adjusted mortality rate declined 9.9 percent during this time period. The racial disparity in the age-adjusted mortality rate increased over time among females in Missouri. In 1990, African American females had a 31.0 percent higher age-adjusted mortality rate than white females, which increased to a 54.4 percent higher rate in 2005. At the rate of decline of 1.8 percent per year, the age-adjusted mortality rate for white females in Missouri might reach the Healthy People 2010 target of 13.9 per 100,000 population. However, at the 0.7 percent per year rate of decline, the age-adjusted mortality rate for African American females clearly would not reach the Healthy People 2010.

30
Breast Cancer Mortality Trends
Figure 24. Trends in predicted and observed age-adjusted mortality rates for breast cancer among females by race, Missouri
1990-2005.
0
10
20
30
40
50
1990 1991 1992 1993 1994 1995 1996 1997 1998 1999 2000 2001 2002 2003 2004 2005
Year of death
Rat
e (p
er 1
00,0
00
popu
latio
n)
Observed white female rate Predicted white female rate
Observed African American female rate Predicted African American female rate
Healthy People 2010 target (21.3 per 100,000)
During 1990-2005, a total of 14,722 Missouri females died of breast cancer for an average of 920 deaths each year (102 African Americans and 813 whites). Overall, the age-adjusted breast cancer mortality rate declined 1.5 percent per year during this time period. Among white females in Missouri, the age-adjusted mortality rate declined by 1.6 percent per year during 1990-2005 for an overall decline of 21.3 percent since 1990. In contrast, the decline was only 0.7 percent per year among African American females, which was statistically unchanged from a rate that was constant over time. The age-adjusted mortality rate declined 10.3 percent during this time period among African American females. As a result, the racial disparity in the age-adjusted mortality rate increased over time among females in Missouri. In 1990, African American females had a 27.9 percent higher rate than white females. By 2005, that rate had increased to 45.8 percent. At the 1.6 percent rate of decline per year, the age-adjusted mortality rate for white females in Missouri would not reach the Healthy People 2010 target of 21.3 per 100,000 population until the year 2014. Because there was no rate of decline observed in the age-adjusted mortality rate for African American females in Missouri, the Healthy People 2010 target for that population clearly would not be reached.

31
Prostate Cancer Mortality Trends
Figure 25. Trends in observed and predicted age-adjusted prostate cancer mortality rates among males by race, Missouri
1990-2005.
0
10
20
30
40
50
60
70
80
90
1990 1991 1992 1993 1994 1995 1996 1997 1998 1999 2000 2001 2002 2003 2004 2005Year of death
Rat
e (p
er 1
00,0
00
popu
latio
n)
Observed white rate Predicted white rate
Observed African American rate Predicted African American rate
Healthy People 2010 target (28.8 per 100,000)
During 1990-2005, a total of 10,484 Missouri men died of prostate cancer for an average of 655 deaths each year (94 African Americans and 559 whites). The overall mortality rate during 1990-1992 remained stable. Beginning in 1992, the overall age-adjusted mortality rates for prostate cancer declined 4.1 percent per year. Changes in prostate cancer mortality rates were different between African American and white Missourians during 1990-2005. Beginning in 1992, age-adjusted prostate cancer mortality rates declined an estimated 4.1 percent per year among whites in Missouri. In contrast, the mortality rates for African Americans did not begin to decline until five years later in 1997. The rates then declined 6.3 percent per year. Since 1990, the overall age-adjusted mortality rates declined 32.1 percent for whites and 36.1 African American Missourians. The disparity in the age-adjusted mortality rate between African Americans and whites in Missouri declined only slightly over time. In 1990, the age-adjusted prostate cancer mortality rate was 129.3 percent higher among African Americans than whites. By 2005, that rate was reduced to 115.9 percent higher for African American males than for white males. The Healthy People 2010 target of 28.8 prostate cancer deaths per 100,000 population was met in 1998 for whites in Missouri. However, at the rate of decline since 1997, the Healthy People 2010 target would not be met for African Americans in Missouri until 2015.

32
Possible Reasons for Changes in Cancer Incidence Although race, in and of itself, is not a relevant biologic variable, racial differences in the incidence and mortality of many cancers have been reported in Missouri as well as throughout the United States, including those described in this report. Cancer incidence and mortality rates vary considerably between African American and white Missourians. Despite a more rapid decline in incidence rates among African Americans than among whites in Missouri during the 1990s, African Americans had a 5.5 percent higher incidence rate in 2003 and 24.1 percent higher mortality rate than whites in 2005 for all types of cancer combined. If the incidence of cancer continued to decline after 2003, it is expected that overall cancer incidence disparities in Missouri, regardless of the type of cancer, will have disappeared by the year 2006. Despite the overall narrowing of racial disparities in cancer incidence over time, racial differences increased for some types of cancer; remained stable during 1996-2003 for some types of cancer; and decreased for other types of cancer. The decline in racial disparities in overall cancer incidence over time is the result of decreased differences between African American and white males. Those differences were primarily the result of declines in lung cancer and prostate cancer incidence. For African American females in Missouri, the overall cancer incidence rate was very similar to that of whites in 2003, suggesting that no racial disparities existed among females in Missouri. Several hypotheses could possibly explain the decline in the racial disparity in lung cancer incidence, including tobacco use and occupational exposure. The age at the start of tobacco use, duration of smoking, and number of cigarettes smoked have all been reported to correlate closely with the risk of developing lung cancer. In Missouri, the current smoking prevalence among African Americans and whites is very similar. Historically, trends in smoking behavior among African American men are similar to those observed among white men (1). However, African Americans typically start smoking earlier than whites and also find it more difficult to stop smoking. Although African Americans smoke more than the general population, their overall tobacco exposure is less. The smoking behavior of lower-income smokers is characterized by the smoking of fewer cigarettes but with more vigor. This involves increasing both the number of inhalations per cigarette and the depth of each inhalation. It is apparent that tobacco consumption alone does not account for the higher incidence of lung cancer among African Americans. Current research shows that the risk for developing lung cancer is 80 percent higher in African Americans than whites when taking into account cumulative tar exposure in individuals who had ever smoked. In addition, African American nonsmokers are eight times more likely to develop lung cancer than their white counterparts. Occupational exposures also may play a role in the disproportionate incidence of lung cancer in African Americans. Minorities are more likely to be employed in industries where they are exposed to occupational respiratory hazards that predispose them to lung cancer such as asbestos, radon, and industrial pollutants. When smoking history

33
is taken into account, African American men were at increased risk of lung cancer when employed as farm workers, auto mechanics, painters, furnace operators, and garbage collectors. It may be that occupational exposures to carcinogens have been reduced over time, thereby reducing the disparities in lung cancer incidence between African American and white men in Missouri. For prostate cancer, it is likely that the changes observed during 1996-2003 reflect changes in prostate cancer screening prior to this time period. During the early 1990s there was a large increase in prostate cancer screening with the development of PSA testing nationwide (2, 3). As a result, overall prostate cancer incidence increased dramatically. After the introduction of PSA testing, the rate of localized prostate cancer increased first with a subsequent reduction in the rate of distant prostate cancer (3). It is possible that prostate cancer screening in African Americans started later than among whites and identified a larger pool of existing prostate cancers. It is estimated that as much as 42 percent of the risk of prostate cancer may be accounted for by genetic influences (4). However, genetic influences cannot explain the rapid changes in prostate cancer incidence over time. The decline in racial disparities in overall cancer incidence over time could have been even larger except that disparities for colorectal cancer actually increased over time starting in 2001, especially among males. At least two possible explanations may have played a role: 1) increased screening among whites compared to African Americans may have resulted in the removal of polyps, thereby preventing the development of colorectal cancer; and 2) changes in lifestyle that increase the risk of colorectal cancer development may have declined more among whites than among African Americans. However, if increased screening among whites was responsible for the increasing disparities in colorectal cancer incidence, then a higher rate of decline in distant colon cancer would be expected among whites when compared to African Americans. That was not the case. In fact, the rate of distant colorectal cancer declined 1.4 percent per year among African Americans while it remained stable among whites. A second reason for the increasing disparities in colorectal cancer incidence between African Americans and whites is that changes in lifestyle that increase the risk of colorectal cancer development may have declined more among whites than among African Americans. Lifestyle factors that increase the risk of colorectal cancer development include a lack of physical activity, obesity, and diabetes, among others. Because colorectal cancer takes several years to develop and data about these risk factors is not available for Missouri for this earlier time period, it is unclear if the reasons for the increasing disparities can be determined. During 1996-2003, overall breast cancer incidence declined 0.7 percent per year. During this time period, age-adjusted breast cancer incidence rates declined 0.7 percent per year among whites, while the rate remained stable among African Americans. Changes in reproductive factors, the use of menopausal hormone replacement therapy, mammographic screening, environmental exposures, and diet have all been proposed to explain the trend. The discontinuation of hormone-replacement therapy could have

34
caused a decreased incidence of breast cancer by direct hormonal effects on the growth of occult breast cancers during 2003. Among white women, the rate of localized breast cancer remained about stable during 1996-1998, but declined 1.2 percent per year beginning in 1998. The age-adjusted rate of localized breast cancer among African Americans remained stable during 1996-2003. Changes in the use of breast cancer screening and diagnostic follow-up after abnormal screening results may have played a role in the diagnosis of localized breast cancer for whites and African Americans. Although racial disparities increased over time for breast and colorectal cancer incidence, they decreased in lung and prostate cancer incidence. These changes help explain why it is expected that overall cancer incidence disparities in Missouri will have disappeared by 2006.
Possible Reasons for Changes in Cancer Mortality Racial disparities in cancer mortality narrowed during 1990-2005 in Missouri. However, the age-adjusted cancer mortality rate among African Americans was 28.2 percent higher than among whites in 2005. If the declines observed during 1990-2005 continued at the same rate, it is expected that disparities in cancer mortality rates will not disappear for decades. In addition, the national goal of 159.9 deaths per 100,000 population by the year 2010 is unlikely to be achieved in Missouri for both African Americans and whites. This goal will only be reached decades later. Although overall cancer mortality rates declined over time for both males and females, racial disparities decreased faster among males than among females. Differences in racial disparities were observed for different types of cancer. For males, racial disparities declined over time for lung, colorectal cancer, and prostate cancer mortality. In contrast, racial disparities remained the same for female lung cancer mortality and actually increased for colorectal and breast cancer mortality for females. Several hypotheses have been put forth to explain the disparities in lung cancer mortality, including treatment differences, adverse socioeconomic conditions, and factors that adversely affect prognosis. The differences in lung cancer survival rates are likely related to disparities in the receipt of appropriate treatment. There is no evidence that lung cancer’s response to appropriate therapy differs among African Americans and whites when taking into account the stage at diagnosis and other diseases present at the time of diagnosis (comorbidities) (5, 6). The reasons why African Americans do not receive equal treatment stems from differences in the rate of referral to specialists, acceptance of therapy, and availability of treatment (7-10). Even when African American patients with lung cancer are referred and offered therapy, they are less likely to accept the proposed treatment (8). African Americans were more likely to decline the recommended therapy because of differences in understanding the risks of surgery, distrust of the health-care system, or the belief that an operation leads to spreading of
35
the cancer (metastasis) (8). These factors possibly impaired patient-physician communication. Since comparable outcomes between African Americans and whites are seen in groups who receive comparable treatments for lung cancer (11), factors related to the receipt of treatment may play a role in the differences in lung cancer mortality, including lower incomes and lack of health insurance among some African Americans (12). Socioeconomic status, which is influenced by income and health insurance, impacts the health outcomes of African Americans by limiting their accessibility to the health-care system and quality care. Lack of insurance and low income are important contributors to disparities between African Americans and whites in several aspects of health care (13). The presence of adverse socioeconomic conditions also contributes to the disproportionate rates of late-stage disease and negative prognosticators at the time of diagnosis for lung cancer. For example, studies have shown that African Americans were more likely than whites to present with a poor performance status or substantial weight loss and were more likely to be unmarried, disabled, unemployed, or a recipient of Medicaid. These circumstances often lead to worse outcomes following lung cancer diagnosis. The presence of adverse symptoms accounted for 43 percent of the disproportionate survival in African Americans when controlling for the stage of cancer at diagnosis (14). A cause for serious concern is the increase in disparities for colorectal cancer mortality among females in Missouri. There could be four reasons why African American females have a higher mortality rate than whites for this type of cancer: 1) African Americans are treated less aggressively than whites although survival is the same when the same treatment is received (15); 2) African Americans have worse tumors at the time of diagnosis; 3) African Americans are less likely to engage in lifestyles that reduce the risk of dying after colorectal cancer diagnosis (16); and 4) African Americans may have certain characteristics (e.g., a greater percent of body fat) (16) at the time of diagnosis that increase the risk of dying from colorectal cancer. Another serious concern is the increase in disparities over time for breast cancer mortality among females in Missouri. Studies suggest that disparities are related to patient-, provider-, and health system-level factors (17). Lack of insurance, fear of testing, delay in seeking care, and unfavorable tumor characteristics all contribute to disparities at the patient level. At the provider level, insufficient screening, poor follow-up of abnormal screening tests, and nonadherence to guideline-based treatments add to disparities. High copayment requirements, lack of a usual source of care, fragmentation of care, and uneven distribution of screening and treatment resources exacerbate disparities at the health system level. For prostate cancer, it is difficult to determine specific reasons for the differences in the magnitude and start date of the declines in mortality rates between African Americans and whites in Missouri. Screening to detect prostate cancer at an early, more treatable

36
stage is likely to have played a role, but widespread androgen deprivation therapy after diagnosis also likely contributed to a decline in overall prostate cancer mortality rates (18, 19). One possible explanation for the later decline in mortality rates among African Americans is the later adoption of prostate cancer screening in conjunction with androgen deprivation therapy. While racial disparities have declined overtime for lung, colorectal, and prostate cancer mortality, racial disparities remained for female lung cancer mortality and actually increased for colorectal and breast cancer morality in females. Although cancer mortality disparity rates decreased overall during 1990-2005, these factors help explain why mortality disparities will not disappear for decades.
Opportunities and Challenges Disparities in cancer incidence and mortality in Missouri have decreased over time for some cancers, increased for other cancers, and remained the same for still other types of cancer. While many reasons for these disparities are still unknown, there are a number of opportunities to implement interventions that have proven effective throughout the United States in further reducing cancer-related disparities. Unfortunately, the gap between research and practice in many areas of public health and health care is large, well documented, and troubling. Discrepancies between evidence-based, efficacious interventions and what actually occurs in practice are frequently large. These gaps occur across prevention and disease management behaviors and settings and population groups. On average, just over half of recommended health-care practices are implemented, and the situation may be even worse for prevention and health behavior change interventions (20). Disparities could be reduced further in Missouri by taking advantage of interventions that are evidence-based and have been proven to be effective as reviewed by the U.S. Preventive Services Task Force (21), the Task Force on Community Preventive Services (22), and the National Comprehensive Cancer Network. Focusing on equal access to such interventions among African Americans and whites should help reduce disparities in cancer that still exist in Missouri. The U.S. Preventive Services Task Force conducts systematic reviews of evidence on the effectiveness of clinical and provider counseling services and makes recommendations for clinical practitioners. The Task Force on Community Preventive Services conducts evidence-based reviews and reports recommendations on the effectiveness of community interventions related to cancer prevention and control, including interventions for tobacco use. The National Comprehensive Cancer Network is an alliance of the world’s leading cancer centers that work together to develop treatment guidelines for cancer. The following are examples of recommendations from each of these three organizations: For lung cancer, the U.S. Preventive Services Task Force strongly recommends that clinicians screen all adults for tobacco use and provide tobacco cessation interventions to those who use tobacco products. The Task Force on Community Preventive
37
Services focuses on ways to reduce tobacco use, such as increasing the unit price for tobacco products. For colorectal cancer, the U.S. Preventive Services Task Force recommends that clinicians 1) screen men and women 50 years of age or older for colorectal cancer; and 2) screen all adult patients for obesity and offer intensive counseling and behavioral interventions to promote sustained weight loss for obese adults. The Task Force on Community Preventive Services recommends client-oriented interventions to increase colorectal cancer screening such as client reminder systems and reducing structural barriers. For breast cancer, the U.S. Preventive Services Task Force recommends that women age 40 and older receive a mammography, with or without clinical breast examination (CBE), every one to two years. The Task Force on Community Preventive Services showed that client reminders are effective in increasing population rates of breast cancer screening by mammography. For prostate cancer, the U.S. Preventive Services Task Force recommends that the evidence is insufficient to recommend for or against routine screening for prostate cancer using prostate specific antigen (PSA) testing or digital rectal examination (DRE). Because the evidence for prostate cancer screening is insufficient, public health agencies face significant challenges in determining what actions to take to address prostate cancer. Given this uncertainty, the principal public health approach is to support informed decision making about screening. The Centers for Disease Control and Prevention (CDC) and related organizations are attempting to provide men with current information about the benefits and risks of prostate cancer screening so that each man can make his own decision, given his own values and preferences. The CDC has developed educational materials about prostate cancer screening, which are designed to promote discussion between patients and physicians and to help men age 50 years or older make informed decisions about prostate cancer screening. More information about the U.S. Preventive Services Task Force can be found on the Internet at http://www.ahrq.gov/clinic/uspstfix.htm. More information about the Task Force on Community Preventive Services can be found on the Internet at www.thecommunityguide.org. The National Comprehensive Cancer Network is an alliance of 21 of the world’s leading cancer centers, working together to develop treatment guidelines for most cancers. The organization gives clinicians tools and knowledge that can help guide decision-making in the management of cancer. The National Comprehensive Cancer Network Clinical Practice Guidelines in Oncology are the recognized standard for clinical policy in the oncology community. These guidelines are updated continually and are based upon the evaluation of scientific data integrated with expert judgment by multidisciplinary panels of expert physicians from National Comprehensive Cancer Network Member Institutions. The NCCN guidelines have become the most widely used in oncology

38
practice. Treatment recommendations are specific and are being implemented through performance measurement. More information about the National Comprehensive Cancer Network Clinical Practice Guidelines in Oncology can be found on the Internet at www.nccn.org. Collaborative efforts are important in further reducing disparities by implementing recommendations made by the Task Force on Community Preventive Services, the U.S. Preventive Services Task Force, and the National Comprehensive Cancer Network Clinical Practice Guidelines in Oncology. State and local health departments, primary care associations, medical and community-based organizations, large employers, and health-care companies should work together toward common and mutually beneficial goals to improve cancer prevention and care in underserved communities, thereby reducing disparities.
Local Intervention Implementation Clearly, evidence-based strategies need to be implemented in an attempt to reduce cancer disparities. The integration of complementary preventive and community services will eventually lead to greater health gains than either approach by itself. The implementation of evidence-based interventions should recognize that health and behavior are influenced at multiple levels, ranging from the individual to families to larger systems, groups, and populations. Individual-level interventions involve one-to-one interactions between a patient and a provider, often within a clinic. Clinical services can also extend to the family. Social, family, and community interventions are oriented toward social groups and primarily target behavior change at, for example, workplaces, schools, or places of worship. Community-level interventions that influence living and working conditions include strategies that target specific communities defined by geography, race, or gender. The highest stage of community-level interventions generally involves large geographic communities and includes broad changes, especially at the policy level. At this level, policy interventions may restrict or support behavior through laws and regulations. The relative balance and prioritization of such strategies and interventions should be based on a clear understanding of what can be achieved, which consists of the extent to which each intervention can affect cancer incidence and mortality as well as its cost-effectiveness. However, qualitative factors should also be considered to ensure successful local implementation. Resources are available for local implementation of evidence-based strategies. They include the Putting Prevention into Practice Program, the Cancer Control P.L.A.N.E.T., and Intervention MICA. The Agency for Healthcare Research and Quality (AHRQ) has developed a resource to help implement clinical preventive services in health-care organizations and systems. A Step by Step Guide to Delivering Clinical Preventive Services is an interactive tool that
39
includes activities, exercises, and questionnaires to help implement a system for delivering preventive care. It encourages clinicians and communities to work together, which has the potential to do a better job of preventing disease and promoting health than either group could do alone. The Putting Prevention into Practice Program provides technical assistance and support to help primary care clinicians (doctors, nurse practitioners, physician assistants) and public health entities form effective community partnerships to address the health challenges of poor nutrition, physical inactivity, tobacco use, asthma, diabetes, and obesity. More information about these resources can be found on the Internet at http://www.ahrq.gov/clinic/ppipix.htm.
A second resource, the Cancer Control P.L.A.N.E.T., provides access to data and resources that can help planners, program staff, and researchers design, implement ,and evaluate evidence-based cancer control programs. It provides access to Web-based resources that can assist in:
• Identifying potential partner organizations that may already be working with certain populations. Find potential practice partners working with community-based programs by accessing contact information for ACS's Regional Cancer Control Planners, CDC's Comprehensive Cancer Control Network, Commission on Cancer’s state liaisons, and NCI's Cancer Information Service, as well as local researchers funded by ACS, AHRQ, CDC, and NCI.
• Accessing and downloading evidence-based programs and products. Adapt and adopt interventions to address objectives by accessing an inventory of programs developed from scientific studies that have been shown to be effective. Many of these programs can be downloaded or ordered free of cost.
• Finding guidelines for planning and evaluation. Review resources and guidelines for planning, implementing, and evaluating comprehensive cancer control programs, and access tools for putting prevention into practice.
More information about Cancer Control P.L.A.N.E.T. can be found on the Internet at http://cancercontrolplanet.cancer.gov/index.html. A third resource to help implement evidence-based strategies locally is the Intervention MICA (Missouri Information for Community Assessment). This resource was used to obtain the data for this report. Intervention MICA is an interactive, evidence-based public health intervention planning tool. It provides information, tools and resources for intervention design, implementation, and evaluation. In addition, Intervention MICA:
40
• Provides users with an increased understanding of evidence-based public health processes.
• Describes effective intervention practices to improve community health. • Offers interventions to create changes in individuals as well as interpersonal
relationships, organizations, environments, and policies that influence health. • Summarizes existing interventions to create changes in known determinants of
health problems. • Encourages users to consider multiple strategies and settings for intervention. • Ensures that all materials are accessible to multiple audiences (e.g., lay-friendly
language and visual cues). • Links users to other resources and websites supporting evidence-based
intervention planning.
More information about Intervention MICA can be found on the Internet at http://www.dhss.mo.gov/InterventionMICA/index.html.
41
Methods Used and Sources of Statistics New Cancer Cases (incidence) The number of new Missouri cancer cases during 1996-2003 was obtained from the Missouri Cancer Registry (MCR) using the Missouri Information for Community Assessment (MICA) website (http://www.dhss.mo.gov/CancerMICA/index.html). The Missouri Cancer Registry is a collaboration between the Missouri Department of Health and Senior Services and the University of Missouri-Columbia. MCR data include more than 95 percent of all incident cases of cancer. All incident cases with a behavior code of 3 (invasive, primary site only) in the International Classification of Diseases for Oncology, 2nd edition (ICD-O-2), with the exception of basal and squamous cell carcinomas of the skin and those on the skin of the genital organs, were considered reportable. Incidence Rates Incidence rates are defined as the number of Missourians per 100,000 who are diagnosed with cancer during a given time period. For this publication, incidence rates were calculated using data on cancer cases collected by the Missouri Cancer Registry with population data collected by the U.S. Census Bureau. Incidence rates in this publication are age-adjusted to the 2000 U.S. standard population to allow comparisons over time and by race. These rates should only be compared to other statistics that are age-adjusted to the U.S. 2000 standard population. Cancer Deaths (mortality) Cancer mortality data are from the Bureau of Health Informatics and obtained using the MICA website. Mortality data are compiled from death records filed with DHSS’ Bureau of Vital Records and the Bureau of Health Informatics, according to Missouri statute. Missouri cooperates with other states and countries in the exchange of death records to include deaths occurring to Missouri residents while traveling outside the state. Death record data include 100 percent of all cancer deaths among Missouri residents during the study period. Due to changes in ICD coding starting in 1999, the number of cancer deaths has changed over time, which could have affected mortality rates. Mortality Rates Mortality rates, or death rates, are defined as the number of people per 100,000 dying of a disease during a given year. For this publication, mortality rates were calculated using data on cancer deaths collected by the DHSS’ Bureau of Vital Records and the Bureau of Health Informatics with population data collected by the U.S. Census Bureau. Mortality rates in this publication are age-adjusted to the 2000 U.S. standard population to allow comparisons over time and by race. These rates should only be compared to other statistics that are age-adjusted to the U.S. 2000 standard population. Statistical Analysis Annual percent change (APC) (23) was used to describe the trends in cancer incidence and mortality, with statistical significance assessed with the use of a two-sided P = .05. Long-term trends are better described by joinpoint analysis (JPA), a model of joined

42
lines (straight lines on a log scale). JPA chooses a model of line segments, such that each is joined at points called a “joinpoint.” Each joinpoint denotes a statistically significant change in trend. For JPA, the overall statistical significance level was set to P = .05, with a maximum of three joinpoints and four line segments allowed for cancer mortality analysis and two joinpoints and three line segments for cancer incidence analysis. An APC was used to describe the trend for each line segment. On the figures, lines represent predicted trends and symbols represent observed rates.

43
References
1. Shopland DR. Tobacco use and its contribution to early cancer mortality with a
special emphasis on cigarette smoking. Environ Health Perspect. 1995;103:131-42.
2. Merrill RM, Brawley OW. Prostate cancer incidence and mortality rates among white and black men. Epidemiology. 1997;8:126-31.
3. Gann PH. Interpreting recent trends in prostate cancer incidence and mortality. Epidemiology. 1997;8:117-20.
4. Hsing AW, Chokkalingam AP. Prostate cancer epidemiology. Front Biosci. 2006;11:1388-413.
5. Shavers VL, Brown ML. Racial and Ethnic Disparities in the Receipt of Cancer Treatment. J. Natl. Cancer Inst. 2002;94:334-357.
6. Akerley WL, 3rd, Moritz TE, Ryan LS, Henderson WG, Zacharski LR. Racial comparison of outcomes of male Department of Veterans Affairs patients with lung and colon cancer. Arch Intern Med. 1993;153:1681-8.
7. Earle CC, Neumann PJ, Gelber RD, Weinstein MC, Weeks JC. Impact of Referral Patterns on the Use of Chemotherapy for Lung Cancer. J Clin Oncol 2002;20:1786-1792.
8. McCann J, Artinian V, Duhaime L, Lewis JW, Jr., Kvale PA, DiGiovine B. Evaluation of the Causes for Racial Disparity in Surgical Treatment of Early Stage Lung Cancer. Chest 2005;128:3440-3446.
9. Margolis ML, Christie JD, Silvestri GA, Kaiser L, Santiago S, Hansen-Flaschen J. Racial Differences Pertaining to a Belief about Lung Cancer Surgery: Results of a Multicenter Survey. Ann Intern Med 2003;139:558-563.
10. Cooper LA, Roter DL, Johnson RL, Ford DE, Steinwachs DM, Powe NR. Patient-Centered Communication, Ratings of Care, and Concordance of Patient and Physician Race. Ann Intern Med 2003;139:907-915.
11. Mulligan CR, Meram AD, Proctor CD, Wu H, Zhu K, Marrogi AJ. Unlimited Access to Care: Effect on Racial Disparity and Prognostic Factors in Lung Cancer. Cancer Epidemiol Biomarkers Prev 2006;15:25-31.
12. Greenwald HP, Polissar NL, Borgatta EF, McCorkle R, Goodman G. Social factors, treatment, and survival in early-stage non-small cell lung cancer. Am J Public Health. 1998;88:1681-4.
13. Schwartz KL, Crossley-May H, Vigneau FD, Brown K, Banerjee M. Race, socioeconomic status and stage at diagnosis for five common malignancies. Cancer Causes and Control 2003;14:761-766.
14. Tammemagi C, Neslund-Dudas C, Simoff M, Kvale P. Lung carcinoma symptoms - An independent predictor of survival and an important mediator of African-American disparity in survival. Cancer 2004;101:1655-1663.
15. Dignam JJ, Colangelo L, Tian W, Jones J, Smith R, Wickerham DL, et al. Outcomes Among African-Americans and Caucasians in Colon Cancer Adjuvant Therapy Trials: Findings From the National Surgical Adjuvant Breast and Bowel Project. J. Natl. Cancer Inst. 1999;91:1933-1940.

44
16. Doyle C, Kushi LH, Byers T, Courneya KS, Demark-Wahnefried W, Grant B, et al. Nutrition and Physical Activity During and After Cancer Treatment: An American Cancer Society Guide for Informed Choices. CA Cancer J Clin 2006;56:323-353.
17. Blackman DJ, Masi CM. Racial and Ethnic Disparities in Breast Cancer Mortality: Are We Doing Enough to Address the Root Causes? J Clin Oncol 2006;24:2170-2178.
18. Hsing AW, Chang L, Nomura AM, Isaacs WB, Armenian HK. A glimpse into the future. Epidemiol Rev. 2001;23:2.
19. Boyle P, Severi G, Giles GG. The epidemiology of prostate cancer. Urol Clin North Am. 2003;30:209-17.
20. McGlynn EA, Asch SM, Adams J, Keesey J, Hicks J, DeCristofaro A, et al. The Quality of Health Care Delivered to Adults in the United States. N Engl J Med 2003;348:2635-2645.
21. Agency for Healthcare Research and Quality. Guide to Clinical Preventive Services. Rockville, MD: Agency for Healthcare Research and Quality, 2006.
22. Zaza S, Briss P, Harris K. The Guide to Community Preventive Services. What Works to Promote Health? New York, NY: Oxford University Press, 2005.
23. Ries LAG, Wingo PA, Miller DS, Howe HL, Weir HK, Rosenberg HM, et al. The annual report to the nation on the status of cancer, 1973-1997, with a special section on colorectal cancer. Cancer 2000;88:2398-2424.