Canal Water Distribution and Its Impact on Farmers' Inncome Along a Distributary
13
1 CANAL WATER DISTRIBUTION AND ITS IMPACT ON INCOME OF FARMERS ALONG A DISTRIBUTARY. MUHAMMAD TOUSIF BHATTI E-mail.[email protected] ABSTRACT Quantification of inequity in water distribution along selected watercourses of Thaman distributary, near Kasur, Pakistan, was carried out. Two watercourses were selected each at head middle and tail reaches of the distributary. Discharges were measured at head, middle and tail ends of the watercourses during Rabi season 2004, to find out the inter- relation of water distribution and crop production. The farmers in the command areas of selected watercourses were also interviewed. The results revealed that inequity of water distribution was present at all watercourses as average Delivery Performance Ratio (DPR) accounted for 0.87, 0.68 and 0.43 at head, middle and tail ends, respectively. Gini coefficient for the distributary was calculated to be 0.591. Furthermore the economic data confirmed the decrease in income of the farmers with increase in distance along the watercourses as well as along the distributary. Key Words: Water, distribution, inequity, DPR, Gini coefficient, crop yield, farmers‟ income. INTRODUCTION AND BACKGROUND Water needs to be equally distributed at various levels of the irrigation system for sustainable irrigated agriculture. Increased crop yield and income of the farmers is influenced by many factors like land holding, farm operations, fertilizers, pesticides,
-
Upload
muhammad-tousif-bhatti -
Category
Documents
-
view
218 -
download
0
Transcript of Canal Water Distribution and Its Impact on Farmers' Inncome Along a Distributary

8/8/2019 Canal Water Distribution and Its Impact on Farmers' Inncome Along a Distributary
http://slidepdf.com/reader/full/canal-water-distribution-and-its-impact-on-farmers-inncome-along-a-distributary 1/131
CANAL WATER DISTRIBUTION AND ITS IMPACT ON INCOME OF
FARMERS ALONG A DISTRIBUTARY.
MUHAMMAD TOUSIF BHATTI
ABSTRACT
Quantification of inequity in water distribution along selected watercourses of Thaman
distributary, near Kasur, Pakistan, was carried out. Two watercourses were selected each
at head middle and tail reaches of the distributary. Discharges were measured at head,
middle and tail ends of the watercourses during Rabi season 2004, to find out the inter-
relation of water distribution and crop production. The farmers in the command areas of
selected watercourses were also interviewed. The results revealed that inequity of water
distribution was present at all watercourses as average Delivery Performance Ratio
(DPR) accounted for 0.87, 0.68 and 0.43 at head, middle and tail ends, respectively. Gini
coefficient for the distributary was calculated to be 0.591. Furthermore the economic data
confirmed the decrease in income of the farmers with increase in distance along the
watercourses as well as along the distributary.
Key Words: Water, distribution, inequity, DPR, Gini coefficient, crop yield, farmers‟
income.
INTRODUCTION AND BACKGROUND
Water needs to be equally distributed at various levels of the irrigation system for
sustainable irrigated agriculture. Increased crop yield and income of the farmers is
influenced by many factors like land holding, farm operations, fertilizers, pesticides,

8/8/2019 Canal Water Distribution and Its Impact on Farmers' Inncome Along a Distributary
http://slidepdf.com/reader/full/canal-water-distribution-and-its-impact-on-farmers-inncome-along-a-distributary 2/132
natural hazards and government interventions but water is the most influencing factor,
particularly in arid and semi-arid climates. In evaluating the performance of gravity
irrigation systems numerous studies have been conducted by many researchers at
primary, secondary and tertiary levels of the irrigation system [ Bhutta 1990, Chambers
1998, Sarfaraz 1998, Hussain 2003, Latif 2003]. The results of these studies have
confirmed that inequity in water distribution is a global problem and threat for irrigated
agriculture, especially in country like Pakistan, where the overall economy is based on
irrigated agriculture. Farmers being the biggest stake holders of the agriculture industry
suffered the most by this problem, especially the tail-enders.
The literature lacks the direct socio-economic impact of inequity in water
distribution. The present paper focuses on the socio-economic condition of the farmers
who are deprived of their promised water share that has direct impact on their income at
different locations of the irrigation system.
Economy of Pakistan depends on agriculture which contributes 24 percent of
Gross domestic Product (GDP). Apart from producing food, it provides raw material for
agro- based industry. Out of about 22.16 million hectares (Mha) of country‟s total
culturable land, 17 Mha are irrigated with a culturable waste of about 9.30 Mha
(MINFAL 200). Approximately 10 million hectare-meters (Mhm) of irrigation water is
diverted annually to the canal system. The overall irrigation efficiency is estimated below
40 percent with maximum losses occurring in tertiary irrigation channels i.e.
watercourses (Kemper and Clyma 1980).
THORATICAL CONSIDERATIONS

8/8/2019 Canal Water Distribution and Its Impact on Farmers' Inncome Along a Distributary
http://slidepdf.com/reader/full/canal-water-distribution-and-its-impact-on-farmers-inncome-along-a-distributary 3/133
Among the different irrigation performance indicators available in the literature
Bos et al. (1994) introduced delivery performance ratio (DPR) as the simplest, and yet
probably the most important hydraulic performance indicator, defined as:
D P R = Actual Discharge / Target Discharge ……………... (1)
This measure enables a manager to determine the extent to which water is delivered as
planned at any moment in time and at any location in the system. In fact, the delivery
performance ratio can generally be considered to be the ratio of actual discharge
delivered to the required discharge (designed) as: DPR= Qa /Qr. It may also be used as
deliverable or scheduled water in order to assess, not only the performance of overall
system, but also the contribution of the structural and management components of the
system to the performance, as presented by Molden and Gates (1990).
Gini (1912) developed “the Gini coefficient” to measure the degree of
concentration (inequality) of a variable in a distribution of its elements. The Gini
coefficient is based on Lorenz curve (Lorenz 1905). It compares the Lorenz curve
(Figure 1) of a ranked empirical distribution with line of perfect equality. This line
assumes that each element has the same contribution to the total summation of the values
of a variable. The Gini coefficient ranges between zero when there is no concentration
(perfect equality), and one when there is total concentration (perfect inequality).

8/8/2019 Canal Water Distribution and Its Impact on Farmers' Inncome Along a Distributary
http://slidepdf.com/reader/full/canal-water-distribution-and-its-impact-on-farmers-inncome-along-a-distributary 4/134
Figure 1: Lorenz Curve.
The area of concentration between Lorenz curve and the line of perfect equality,
expresses a proportion of the area enclosed by the triangle defined by the line of perfect
equality and the line of perfect inequality. The closer to one the coefficient is, the more
unequal the distribution will be. The Gini Coefficient can be calculated as.
Gini Coefficient =
n
i 1
[{(δXi + 1) - δXi} × {(δYi + 1) +δ Yi}] -1 …………………
Where
δ X, δY = Cumulative percentages of X and Y variables in fractions.
(In the present study X is the distance in meters along the distributary and Y
is discharge in cusecs)
n = Total number of elements (observations).
i = Index ranging from 1, 2, 3, …………..n
2

8/8/2019 Canal Water Distribution and Its Impact on Farmers' Inncome Along a Distributary
http://slidepdf.com/reader/full/canal-water-distribution-and-its-impact-on-farmers-inncome-along-a-distributary 5/135
THE STUDY AREA
This study was undertaken in the command area of Thaman distributary that
off-takes at RD 1549/L from Lower Main Branch Canal near district Kasur in Punjab
province of Pakistan as shown in Figure 2.
Figure 2: Map of the Study Area.

8/8/2019 Canal Water Distribution and Its Impact on Farmers' Inncome Along a Distributary
http://slidepdf.com/reader/full/canal-water-distribution-and-its-impact-on-farmers-inncome-along-a-distributary 6/136
M B Lower Canal
T a i l
H e a d
M i d d l e
The total discharge of the distributary is 7.70 cumecs with total command area
of 31846.5 hectares. A total of 50 outlets originate from the distributary along its length
of 30.85 km. Time and finance constraints did not permit to incorporate all the 50 outlets
for field measurements under the present study, therefore an optimum sample number of
outlets were selected for detailed analysis. For this purpose the distributary was divided
into three reaches (hereafter called as head, middle and tail reaches respectively) and two
watercourses were selected in all the three reaches, hence a total of 6 watercourses were
incorporated under the present study as shown in Figure 3.
Figure 3: Schematic diagram of Thaman distributary indicating selected watercourses.
DATA COLLECTION
The physical measurements of discharge actually flowing through the sampled outlets
were performed for one complete warabandi1
cycle for all the selected watercourses.
Calibrated current-meter was used for discharge measurement at head, middle and tail of
the watercourses. For locating the measurement points, lengths of selected watercourses
were approximated from Chakbandi2 maps as well as by „Pacing‟ method1 in the field,
1Warabandi is a local term defined as allocation of water share on the basis of time and area.
2 Local term used for scaled irrigation plan.
RD 25309/L
RD 39500/L
RD 61794/L
RD 91790/L
RD 54147/L
RD 85200/L

8/8/2019 Canal Water Distribution and Its Impact on Farmers' Inncome Along a Distributary
http://slidepdf.com/reader/full/canal-water-distribution-and-its-impact-on-farmers-inncome-along-a-distributary 7/137
where number of „paces‟ were counted and multiplied with the average length of one
pace to get the distance. Finally three sites one each at head, middle and tail of the
selected watercourses with regular cross-sections and having minimum turbulence, were
chosen to measure the discharge. The first measuring point at the head was chosen just
downstream the outlets. Here again due to financial constraints the measurements of
discharges could not be performed for all the warabandi cycles during the Rabi season
2004. It was assumed that the DPR will follow similar pattern for all the Warabandi
cycles in sampled outlets. Data regarding the authorized and measured discharges along
with the command areas of the watercourses is presented in Table 1.
Table 1: Command areas and measured discharges of selected watercourses.
Sr No
Location on
distributary Command
area
(hectares)
Authorized
discharge
(cumec)
Location
on W/C
Distance
from
the
outlet
(m)
Measured
discharge
(cumec)
1
Head
H 1 0.0345
184.5 0.0368 M 1750 0.0297
T 3100 0.0212H 1 0.0218
2 127.9 0.0255 M 1000 0.0187
T 1890 0.0110
Middle
H 1 0.0323
3 112.1 0.0224 M 750 0.0238
T 1500 0.0119
H 1 0.0224
4 162.3 0.0323 M 1400 0.0178
T 2800 0.0116
Tail
H 1 0.01875 110.9 0.0212 M 700 0.0122
T 1400 0.0093
H 1 0.0108
6 113.3 0.0195 M 750 0.0088
T 1500 0.0048
1Pacing is a crude method of distance measurement but other methods were difficult to use in the field
conditions of the study area.

8/8/2019 Canal Water Distribution and Its Impact on Farmers' Inncome Along a Distributary
http://slidepdf.com/reader/full/canal-water-distribution-and-its-impact-on-farmers-inncome-along-a-distributary 8/138
For economic investigation farmers were interviewed and questionnaires were filled for
collecting detailed information about the input costs and income calculations after the
crop harvest. Irrigation scheduling data such as warabandi schedules and sanctioned
outlet discharges were collected from secondary sources such as the Irrigation
Department and the Farmers Organizations.
RESULTS AND DISCUSSION
Equity of Canal Water Supply
Gini Coefficient and Delivery Performance Ratio (DPR) at head, middle and tail ends
were calculated for the selected watercourses and the results are summarized in Table 1.
The DPR values at head reaches of the watercourses were closer to 1 for head and middle
reaches of the distributary but it decreased to 0.71 at the tail end of the distributary even
at head of the watercourses. The DPR decreased to 0.51 to 0.77 at middle of the
watercourses. The situation of water supply further deteriorates at the tail ends of
watercourses where the DPR reduced to 0.35 to 0.51. These results clearly show that
farm locations have significant impact on canal water supply. The tail end farmers suffer
the most as they receive only 35 to 51 percent of their authorized (sanctioned) water
supply.
The results obtained from Gini coefficient values are in agreement with those obtained
from DPR. The highest value of Gini coefficient is 0.65 for watercourse No. 4. In spite
of good equity conditions at the head end, the watercourse assumed the high Gini
coefficient value due to the largest difference of DPR values between head and tail ends
of the watercourse as shown in the last column of Table 2 which is 0.63.

8/8/2019 Canal Water Distribution and Its Impact on Farmers' Inncome Along a Distributary
http://slidepdf.com/reader/full/canal-water-distribution-and-its-impact-on-farmers-inncome-along-a-distributary 9/139
Table 2: Delivery Performance Ratios and Gini coefficient values for selected watercourses atThaman distributary.
Watercourse No.Location on
distributary
Distancealong
distributary
GiniCoefficient
Delivery Performance
Ratio
Watercourse location
Head Middle Tail
Maximum
difference
with respect
to head
1Head
25309/L 0.55 0.94 0.81 0.58 0.36
2 39500/L 0.58 0.86 0.72 0.43 0.43
Average 0.57 0.9 0.77 0.51
3Middle
54147/L 0.58 0.98 0.8 0.52 0.46
4 61794/L 0.65 1 0.74 0.37 0.63
Average 0.62 0.99 0.77 0.45
5Tail
85200/L 0.59 0.88 0.57 0.44 0.44
6 91790/L 0.60 0.54 0.45 0.26 0.28
Average 0.60 0.71 0.51 0.35
Overall Average 0.59 .87 0.68 0.43
Use of Canal-water and Groundwater
Canal water supply is decreasing along the distributary as well as watercourses as
discussed in the previous section. To meet the crop water requirements, the farmers use
groundwater except the head-end farmers located at head and middle reaches of the
distributary. The use of groundwater progressively increases downstream the
watercourses as well as along the distributary (Table 3). It is clear from the table that the
tail end farmers use 40 to 70 percent of their crop water needs from groundwater.
8/8/2019 Canal Water Distribution and Its Impact on Farmers' Inncome Along a Distributary
http://slidepdf.com/reader/full/canal-water-distribution-and-its-impact-on-farmers-inncome-along-a-distributary 10/1310
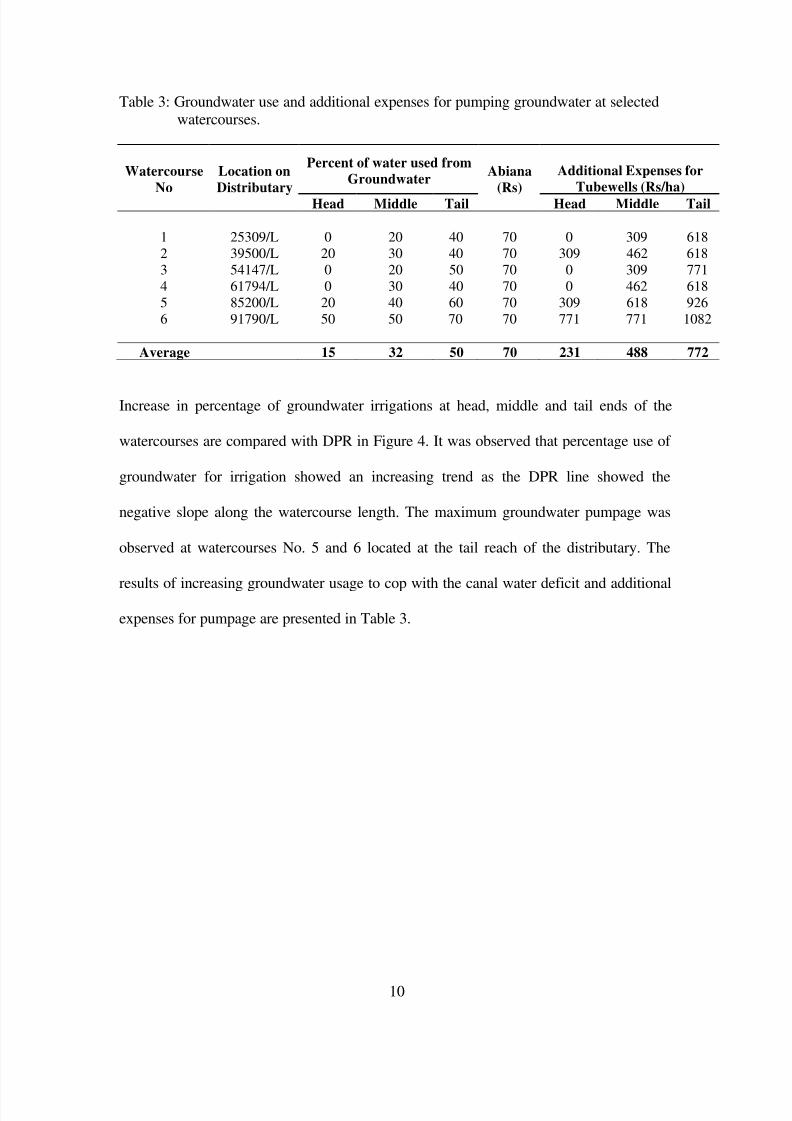
Table 3: Groundwater use and additional expenses for pumping groundwater at selectedwatercourses.
Watercourse
No
Location on
Distributary
Percent of water used from
GroundwaterAbiana
(Rs)
Additional Expenses for
Tubewells (Rs/ha)
Head Middle Tail Head Middle Tail
1 25309/L 0 20 40 70 0 309 618
2 39500/L 20 30 40 70 309 462 618
3 54147/L 0 20 50 70 0 309 771
4 61794/L 0 30 40 70 0 462 618
5 85200/L 20 40 60 70 309 618 926
6 91790/L 50 50 70 70 771 771 1082
Average 15 32 50 70 231 488 772
Increase in percentage of groundwater irrigations at head, middle and tail ends of the
watercourses are compared with DPR in Figure 4. It was observed that percentage use of
groundwater for irrigation showed an increasing trend as the DPR line showed the
negative slope along the watercourse length. The maximum groundwater pumpage was
observed at watercourses No. 5 and 6 located at the tail reach of the distributary. The
results of increasing groundwater usage to cop with the canal water deficit and additional
expenses for pumpage are presented in Table 3.

8/8/2019 Canal Water Distribution and Its Impact on Farmers' Inncome Along a Distributary
http://slidepdf.com/reader/full/canal-water-distribution-and-its-impact-on-farmers-inncome-along-a-distributary 11/1311
0
0.1
0.2
0.3
0.4
0.5
0.6
0.7
0.8
0.9
1
Head M id dle Tail
Lo cation at waterco urse
0
10
20
30
40
50
60
70
80
90
100
watercourse No.1 watercourse No.2 watercourse No.3
0
0.1
0.2
0.3
0.4
0.5
0.6
0.7
0.8
0.9
1
Head M id dle Tail
Loc ation at watercourse
0
10
20
30
40
50
60
70
80
90
100
watercourse No.4 watercourse No.5 watercourse No.6
Figure 4: Delivery Performance Ratios and use of ground water along selected
watercourses.
Income of Farmers
Net income per hectare decreased from head to tail of the watercourses. The difference in
net incomes with respect to the tail end farms was calculated. The results are summarized
in Table 4. The largest difference was found in head and middle reach watercourses due
to the greater differences in head and tail end DPR values at these watercourses.
Groundwater usa e % .

8/8/2019 Canal Water Distribution and Its Impact on Farmers' Inncome Along a Distributary
http://slidepdf.com/reader/full/canal-water-distribution-and-its-impact-on-farmers-inncome-along-a-distributary 12/1312
Table 4: Comparison of net incomes at head, middle and tail ends of watercourses.
Watercourse NoNet Income in rupees per hectare at
Head Middle Tail
110517 8250
7459(41)* (11)
210147 8522
8114(25) (5)
38875 8657
7553(17) (15)
49354 7857
7810(20) (1)
58452 7872
7563(12) (4)
67101 7101
6175(15) (15)
Difference in net income with respect to the tail end farms in percent.
CONCLUSIONS
Water scheduling aiming at equal water supply among all the shareholders plays a vital
role in crop production on profitable and sustainable basis. Spatial variations in water
availability transforming into the curse of water diminishing at tails of the irrigation
system is the factor that create a gap of yield and income between farmers located at
different locations of the irrigation system. The farmers at tail ends of the watercourses
are receiving 35 to 45 percent less water resulting in 15 to 41 percent decrease in income
per hectare in comparison with the head-end farmers. Where this situation glamorize the
lust of land holdings near the outlets, it also give birth the rivalry among the farmers at
the command area of the same outlet.
The evidences of inequity of water distribution and resulting yield and income gaps
gleaned from this study pose different aspects for the attention of irrigation planners. The
policies should be aimed at reduction of water losses by rehabilitation of watercourses
and more importantly designing improved water schedules on the basis of precise
estimation of available water resources.

8/8/2019 Canal Water Distribution and Its Impact on Farmers' Inncome Along a Distributary
http://slidepdf.com/reader/full/canal-water-distribution-and-its-impact-on-farmers-inncome-along-a-distributary 13/13
REFERENCES
Bos, M. G., D. H. Murray-Rust, D. J. Merrey, H. G. Johnson, and W. B. Snellen. 1994.
Methodologies for assessing performance of irrigation and drainage management. Irrigation and
Drainage Systems 7 :231-261.
Bhutta, M. N. 1990. Effect of varying discharges on the equity of water distribution in the irrigationsystem. PhD dissertation, Center of Excellence in Water Resources Engineering, Lahore.
Corey, G.L. and Clima, W. 1973 Improving farm water management in Pakistan, Publication No.
CSU Field Report No 1 L-12.
Chambers, Robert; Saxena, N. C.; and Shah, Tushaar. 1987. To the hands of the poor: Water an
dtrees, Delhi, India: Oxford IBH Publishing Co.
Gini, C. "Variabilitá e mutabilita." 1912. Reprinted in Memorie di metodologia statistica (Ed. E.
Pizetti and T. Salvemini.) Rome: Libreria Eredi Virgilio Veschi, 1955.
Hussain, I., Sakthivadivel, R., Amarasingh, U., Mudassar, M., and Molden, D. 2003. Land and
water productivity of wheat in western Indo-Gangetic plains of India and Pakistan. Research ReportNo. 65 .International water Management Institute, Colombo, Sri Lanka.
Kemper, W.D., Clyma, W., Skogerboe, G.V. and Trout, T.J. 1980 Watercourses improvement
research in Pakistan, Water Management Technical Report No. 56, Colorado State University, Fort
Collins, USA.
Latif, M., and Pomee, M. S. 2003. Impacts of Institutional Reforms on Irrigated Agriculture in
Pakistan, Irrigation and Drainage Systems 17; 195-212. Kluwer Academic Publishers, the
Neterlands.
Lorenz, M. O. 1905. "Methods for Measuring the Concentration of Wealth." Amer. Stat. Assoc. 9,
209-219.
MINFAL 2002. Agriculture Statistics of Pakistan, 2000-2001. Ministry of Food, Agriculture and
Livestock, Government of Pakistan.
Molden, J., and T. Gates. 1990. Performance measurements for evaluation of irrigation delivery
systems. J. Irrig. Drain. Eng. Am. Soc. Civil Eng. 116: 804 – 823.
Sarfaraz, M., Kawij, I., and Brouwar M. 1998. Assesmsnt of water distribution at watercourse and
minor level of Bahdurwah Minor. Report No. 55. International Water Management Institute,
Pakistan.