
Canadian Provincial Socio-Economic Differences; where, how much and why Presentation by Prof. Dr....
33
Canadian Provincial Socio-Economic Differences; where, how much and why Presentation by Prof. Dr. Alfred Hecht* Viessmann European Research Centre at Laurier Waterloo, Ontario, Canada At the Hochschule Hof Hof, Germany November 27, 2008 *A hearty thank you goes to the Dr. Hans Vießmann-Stiftung and the Fachhochschule "Fördergesellschaft“ for their financial help in bearing the cost for this Canada Day
-
Upload
katherine-rich -
Category
Documents
-
view
220 -
download
1
Transcript of Canadian Provincial Socio-Economic Differences; where, how much and why Presentation by Prof. Dr....

Canadian Provincial Socio-Economic Differences; where, how much and why
Presentation by
Prof. Dr. Alfred Hecht*Viessmann European Research Centre at Laurier
Waterloo, Ontario, Canada
At the
Hochschule HofHof, Germany
November 27, 2008
*A hearty thank you goes to the Dr. Hans Vießmann-Stiftung and the Fachhochschule "Fördergesellschaft“
for their financial help in bearing the cost for this Canada Day

Abstract
One of the most contentious issue for many countries is the variation in socio-economic conditions that exits in different parts of the country. What is where and why can create major conflicts. Canada is no exception. The federal governments has a mandate to remove differences between people no matter where they live. In Canada this is attempted through regional transfer payments, through regionalization of federal jobs, through regulations and laws and through regional incentive payments. Still, substantial variations exist in Canada, at the provincial and territorial levels. Differences are found in all areas of the broader socio-economic, civic, political, ethnic, linguistic and natural resource endowments, so mention just a few. People do respond to these by moving from have not regions to have regions in Canada, by electing different governments and or by advocating different governmental policies. The overarching research questions in this presentation is: What are some of the major regional differences in Canada, what are its possible causes and how big or troubling are they to the country.

The first law in Geography, and its overarching cause for regional differences
Source: Wikipedia, “First Law of Geography”, see http://en.wikipedia.org/wiki/First_law_of_geography
• "Everything is related to everything else, but near things are more related than distant things."
TOBLER, W. R. (1970). "A computer movie simulating urban growth in the Detroit region". Economic Geography, 46(2): 234-240.
• Here an example of interaction between Moscow and its peripheries, e.g. Kaliningrad,
Hecht, Alfred, “The Kaliningrad Oblast of the Russian Federation: It’s Development Prospects on the Conceptual Baltic Main Street”, GeoINova, Numero 12, 2006, pp 297-323.
• Holds true for human, commercial, political and communication interactions

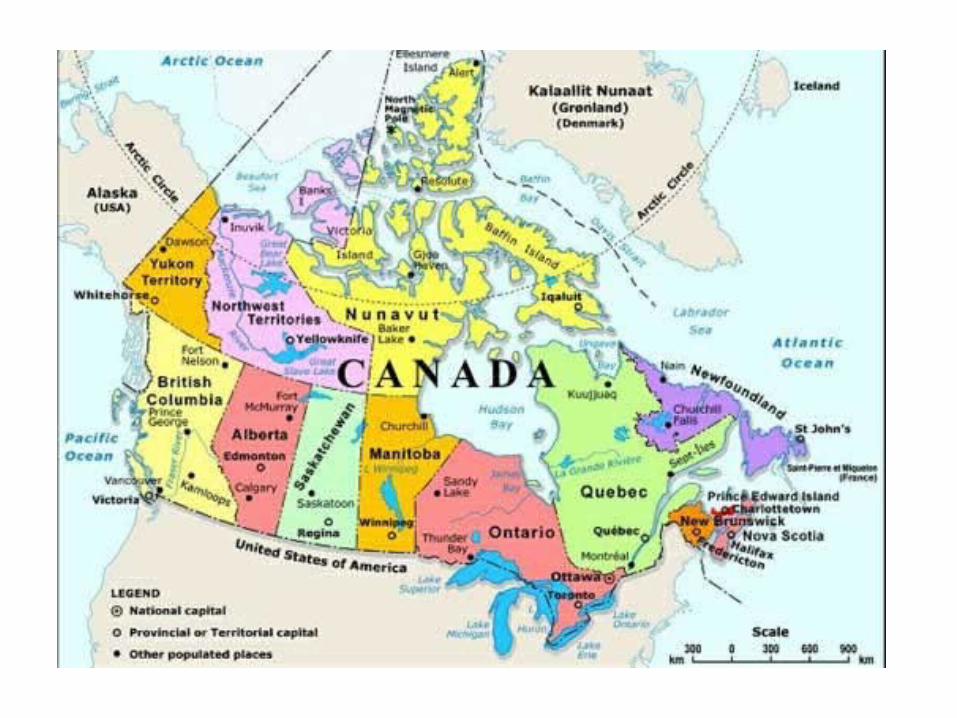
Canadian Provinces and Territories Source: http://www.th.gov.bc.ca/drivebc_supp/canada_map.jpg

Canadian Provincial and Territorial Population, 2008Source: Statistics Canada, "The Daily", October 29, 2008
http://www.statcan.ca/Daily/English/080929/d080929b.htm#tab4ftnote
01-Jul-08 % of Total
Canada 33,311,389 100
Newfoundland and Labrador 507,895 1.52
Prince Edward Island 139,818 0.42
Nova Scotia 938,310 2.82
New Brunswick 747,302 2.24
Quebec 7,750,504 23.27
Ontario 12,928,996 38.81
Manitoba 1,207,959 3.63
Saskatchewan 1,015,985 3.05
Alberta 3,585,142 10.76
British Columbia 4,381,603 13.15
Yukon 33,144 0.10
Northwest Territories 43,283 0.13
Nunavut 31,448 0.09

Canadian Population Growth ComponentsSource: Statistics Canada, "The Daily", October 29, 2008
http://www.statcan.ca/Daily/English/080929/d080929b.htm#tab4ftnote
April 1 to % of
for the 3 month period of April 1 to June 30, 2008 30-Jun-08 Total
Total growth 125,840 100
Natural increase 34,241 27.21
Births 93,071
Deaths 58,830
Net international migration 91,599 72.79
Immigration 69,228
Emigration 8,472
Net non-permanent residents 30,843
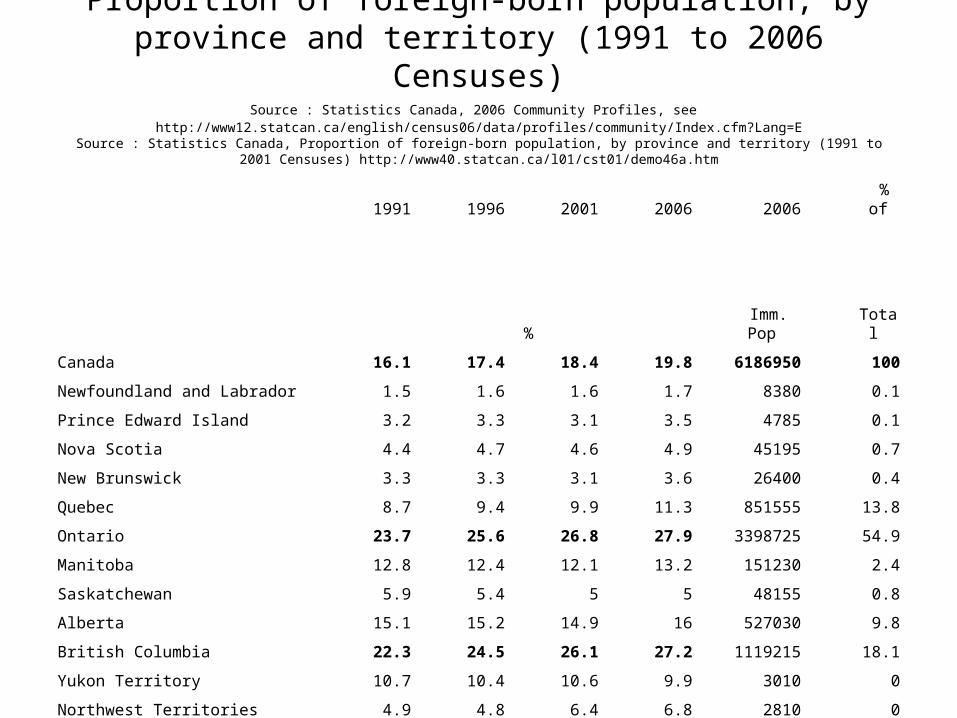
Proportion of foreign-born population, by province and territory (1991 to 2006 Censuses)
Source : Statistics Canada, 2006 Community Profiles, see http://www12.statcan.ca/english/census06/data/profiles/community/Index.cfm?Lang=E
Source : Statistics Canada, Proportion of foreign-born population, by province and territory (1991 to 2001 Censuses) http://www40.statcan.ca/l01/cst01/demo46a.htm
1991 1996 2001 2006 2006 % of
% Imm. Pop Total
Canada 16.1 17.4 18.4 19.8 6186950 100
Newfoundland and Labrador 1.5 1.6 1.6 1.7 8380 0.1
Prince Edward Island 3.2 3.3 3.1 3.5 4785 0.1
Nova Scotia 4.4 4.7 4.6 4.9 45195 0.7
New Brunswick 3.3 3.3 3.1 3.6 26400 0.4
Quebec 8.7 9.4 9.9 11.3 851555 13.8
Ontario 23.7 25.6 26.8 27.9 3398725 54.9
Manitoba 12.8 12.4 12.1 13.2 151230 2.4
Saskatchewan 5.9 5.4 5 5 48155 0.8
Alberta 15.1 15.2 14.9 16 527030 9.8
British Columbia 22.3 24.5 26.1 27.2 1119215 18.1
Yukon Territory 10.7 10.4 10.6 9.9 3010 0
Northwest Territories 4.9 4.8 6.4 6.8 2810 0
Nunavut … … 1.7 1.5 450 0

Canadian Population, Immigration, Emigration, 2008 Source Statistics Canada, "The Daily", October 29, 2008, http://www.statcan.ca/Daily/English/080929/d080929b.htm#tab4ftnote
and Source: Statistics Canada, "Components of population growth, by province and territory“http://www40.statcan.ca/l01/cst01/demo33c.htm
July 1, 2007 to June 30, 2008
01-Jul-08 % Immig. % Emigr. % E/I
Canada 33,311,389 100 249,603 100.00 45,049 18
Newfoundland and Labrador 507,895 1.52 598 0.24 287 42
Prince Edward Island 139,818 0.42 1,281 0.51 65 5
Nova Scotia 938,310 2.82 2,660 1.07 669 25
New Brunswick 747,302 2.24 1,803 0.72 484 27
Quebec 7,750,504 23.27 46,055 18.45 6,968 15
Ontario 12,928,996 38.81 114,981 46.07 21,818 19
Manitoba 1,207,959 3.63 10,741 4.30 1,842 19
Saskatchewan 1,015,985 3.05 4,300 1.72 528 12
Alberta 3,585,142 10.76 23,806 9.54 5,369 22
British Columbia 4,381,603 13.15 43,114 17.27 6,954 14
Yukon 33,144 0.10 101 0.04 20 20
Northwest Territories 43,283 0.13 131 0.05 25 19
Nunavut 31,448 0.09 32 0.01 20 63

Doctorates (PhD) In Canada by Place of Birth and Place of Education
Source: “Doctorate Education in Canada: Findings from the Survey of Earned Doctorates, 2005/2006 by Darren King, by Darren King, Judy Eisl-Culkin and Louise Desjardins see
http://www.statcan.ca/english/research/81-595-MIE/81-595-MIE2008069.htm

Proportion of foreign educated doctorate degree holders by field of study
Source: “Doctorate Education in Canada: Findings from the Survey of Earned Doctorates, 2005/2006 by Darren King, by Darren King, Judy Eisl-Culkin and Louise Desjardins see
http://www.statcan.ca/english/research/81-595-MIE/81-595-MIE2008069.htm

Source of Canadian (PhD) doctorate holders Source: “Doctorate Education in Canada: Findings from the Survey of Earned Doctorates, 2005/2006
by Darren King, by Darren King, Judy Eisl-Culkin and Louise Desjardins see http://www.statcan.ca/english/research/81-595-MIE/81-595-MIE2008069.htm

Pathways of foreign-born PhD graduatesSource: “Doctorate Education in Canada: Findings from the Survey of Earned Doctorates, 2005/2006
by Darren King, by Darren King, Judy Eisl-Culkin and Louise Desjardins see http://www.statcan.ca/english/research/81-595-MIE/81-595-MIE2008069.htm

Proportion of PhDs in the population, aged 15 and older Source: “Doctorate Education in Canada: Findings from the Survey of Earned Doctorates, 2005/2006
by Darren King, by Darren King, Judy Eisl-Culkin and Louise Desjardins see http://www.statcan.ca/english/research/81-595-MIE/81-595-MIE2008069.htm

Canada in the International Student Assessment (PISA) Ranking, 2006Source: http://www.pisa.oecd.org/dataoecd/15/13/39725224.pdf
A surprising high ranking of Canadian Students in this international test
Even in the reading score Canadian scored high despite having a large number of immigrant students
Or is Canada’s high score the result off immigrant children? (PISA says ‘no’)
Between school variation contributed on average 33.0% of total variation (In Germany it was 64.2%, Canada 17.9%)
Most of Canadian variation came from within school variation, 79.3%, in Germany it was 50.8%, OECD average was 68.1
Rank
Mathematic Score
Chinese Taipei 549 1
Canada 527 7
Germany 504 20
Kyrgyzstan (last) 311 57
Reading Score
Korea 556 1
Canada 527 4
Germany 495 18
Kyrgyzstan (last) 285 57
Science scale
Finland 563 1
Canada 534 3
Germany 516 13
Kyrgyzstan (last) 322 57

Canadian Provincial Unemployemt Rates, October 10, 2008
02468
101214
1 NL PEI NS NB Q O MB Sa AB BC
%

Provincial Labour Participation Rates, for peple 15 years and older
Source: Statistics Canada, The Daily, "Labour Force Survey", October 10, 2008
01020304050607080
Provinces
In %
NL PEI NS NB Q O MB SA AB BC

Canadian Median Age by Provinces and Territories, 2006Source: Source: Statistics Canada; "2006 Community Profiles" see
http://www12.statcan.ca/english/census06/data/profiles/community/Index.cfm?Lang=E
Median Age decreases as one goes from east to west (except BC)
The high age in the east is in part due to the westward migration of the young
Another reason is the homeward movement of the elderly from the central and western Canada
It is especially low in the north
The prairies are surprisingly low even though they have many old farmers
Median Age
Canada 39.5
Newfoundland and Labrador 41.7
Prince Edward Island 40.8
Nova Scotia 41.8
New Brunswick 41.5
Quebec 41
Ontario 39
Manitoba 38.1
Saskatchewan 38.7
Alberta 36
British Columbia 40.8
Yukon Territory 38.4
Northwest Territories 31.2
Nunavut 23.1

Major inter-provincial migrations between 1996 and 2001

Canadian Population with Aboriginal Identity, by Provinces and Teritories, 2006
0
50,000
100,000
150,000
200,000
250,000
300,000
1 2 3 4 5 6 7 8 9 10 11 12 13NL PEI NS NB Q O MB S AB BC Y NWT Nvt
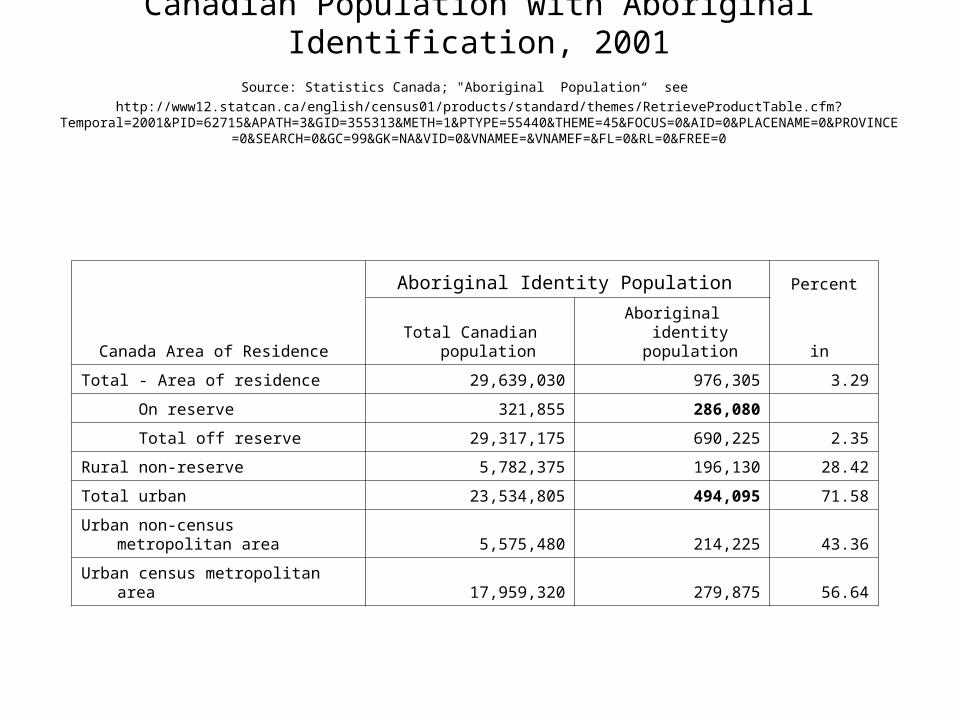
Canadian Population with Aboriginal Identification, 2001 Source: Statistics Canada; "Aboriginal Population“ see
http://www12.statcan.ca/english/census01/products/standard/themes/RetrieveProductTable.cfm?Temporal=2001&PID=62715&APATH=3&GID=355313&METH=1&PTYPE=55440&THEME=45&FOCUS=0&AID=0&PLACENAME=0&PROVIN
CE=0&SEARCH=0&GC=99&GK=NA&VID=0&VNAMEE=&VNAMEF=&FL=0&RL=0&FREE=0
Canada Area of Residence
Aboriginal Identity Population Percent
Total Canadian populationAboriginal identity
population in
Total - Area of residence 29,639,030 976,305 3.29
On reserve 321,855 286,080
Total off reserve 29,317,175 690,225 2.35
Rural non-reserve 5,782,375 196,130 28.42
Total urban 23,534,805 494,095 71.58
Urban non-census metropolitan area 5,575,480 214,225 43.36
Urban census metropolitan area 17,959,320 279,875 56.64

Canada's Mother Tongues
0.00
20.00
40.00
60.00
80.00
%
English French E & F Other

Weekly Income with Ontario at 100 %, October 2008
0.00
20.00
40.00
60.00
80.00
100.00
120.00
140.00
Provinces and Territories
%NL
PEI
NS
NB
Q
O
MB
Sa
AB
BC
Y
NWT
Nvt
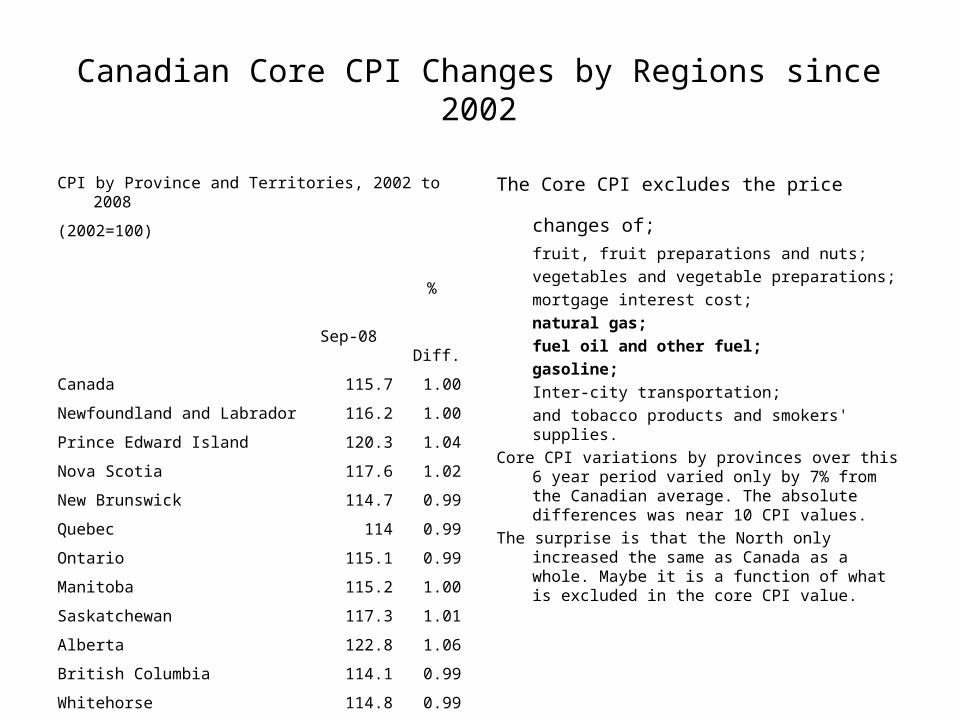
Canadian Core CPI Changes by Regions since 2002
The Core CPI excludes the price changes of; fruit, fruit preparations and nuts;
vegetables and vegetable preparations;
mortgage interest cost;
natural gas;
fuel oil and other fuel;
gasoline;
Inter-city transportation;
and tobacco products and smokers' supplies.
Core CPI variations by provinces over this 6 year period varied only by 7% from the Canadian average. The absolute differences was near 10 CPI values.
The surprise is that the North only increased the same as Canada as a whole. Maybe it is a function of what is excluded in the core CPI value.
CPI by Province and Territories, 2002 to 2008
(2002=100) %
Sep-08 Diff.
Canada 115.7 1.00
Newfoundland and Labrador 116.2 1.00
Prince Edward Island 120.3 1.04
Nova Scotia 117.6 1.02
New Brunswick 114.7 0.99
Quebec 114 0.99
Ontario 115.1 0.99
Manitoba 115.2 1.00
Saskatchewan 117.3 1.01
Alberta 122.8 1.06
British Columbia 114.1 0.99
Whitehorse 114.8 0.99
Yellowknife 117.2 1.01
Iqaluit (Dec. 2002=100) 111.9 0.97

Consumer Prices vary Substantially by Provinces, 2007-2008Source: Statistics Canada; The Daily,” Latest Release from the Consumer Price Index”, October 24, 2008 see
http://www.statcan.ca/english/Subjects/Cpi/cpi-en.htm
The CPI index includes all consumption costs
Variation in the cost of living increase varies substantially between provinces
Some of the poorer and smaller provinces had the highest increases
Period covers the large increase in Oil prices
Decrease in Natural gas prices in Alberta was the major decline in Alberta
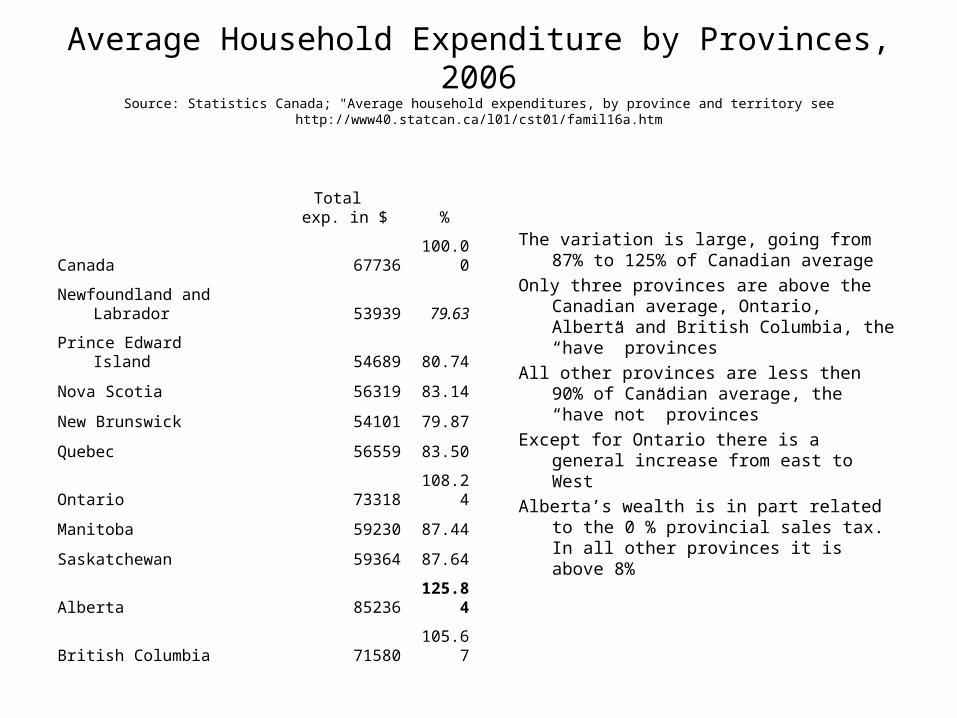
Average Household Expenditure by Provinces, 2006Source: Statistics Canada; "Average household expenditures, by province and territory see
http://www40.statcan.ca/l01/cst01/famil16a.htm
The variation is large, going from 87% to 125% of Canadian average
Only three provinces are above the Canadian average, Ontario, Alberta and British Columbia, the “have” provinces
All other provinces are less then 90% of Canadian average, the “have not” provinces
Except for Ontario there is a general increase from east to West
Alberta’s wealth is in part related to the 0 % provincial sales tax. In all other provinces it is above 8%
Total exp. in $ %
Canada 67736 100.00
Newfoundland and Labrador 53939 79.63
Prince Edward Island 54689 80.74
Nova Scotia 56319 83.14
New Brunswick 54101 79.87
Quebec 56559 83.50
Ontario 73318 108.24
Manitoba 59230 87.44
Saskatchewan 59364 87.64
Alberta 85236 125.84
British Columbia 71580 105.67

Canadian Household Expenditures in Selective CMAs, 2006
Source: Statistics Canada; "Average household expenditures, by selected metropolitan area”, seehttp://www40.statcan.ca/l01/cst01/famil10h.htm
Only the six selected CMAs in the provinces of Ontario, Alberta and BC are above the Canadian average
The range goes from just under 80% to over 143% of the Canadian average
The variation in expenditure is greater between Canada’s CMAs then between the provinces themselves
Except for Calgary the population size seems to influence be expenditure pattern. The r value is -.54.
The fact that Calgary is far higher then Edmonton a test to the fact that the absence of the sales tax in Alberta does not explain all the differences why Calgary is so much higher. It must be the wealth from the headquarters of the oil industry there
Total in $ %
Canada 67736 100.00
St. John's 66432 98.07
Charlottetown 57729 85.23
Halifax 65439 96.61
Saint John 53683 79.25
Québec 55702 82.23
Montréal 58712 86.68
Ottawa 78463 115.84
Toronto 81046 119.65
Winnipeg 63871 94.29
Regina 66040 97.50
Saskatoon 64739 95.58
Calgary 97483 143.92
Edmonton 78194 115.44
Vancouver 76348 112.71
Victoria 71457 105.49

Canadian and Provinces Sales Taxes as % of Purchase 2008Source: PST Rates, see
http://www.taxtips.ca/pst/pstrates.htm
The VAT or Provincial Sales Tax varies between 0 and 13 %
The poorer provinces have the higher rate
The riches, Alberta has a 0% rate
It effects the standard of living in that a high rate reduces purchases
Frequently includes service charges
The Federal rate is the same across the country
Provincial Federal
Newfoundland and Labrador 13 5
Prince Edward Island 10 5
Nova Scotia 13 5
New Brunswick 13 5
Quebec 8 5
Ontario 8 5
Manitoba 7 5
Saskatchewan 5 5
Alberta 0 5
British Columbia 7 5

Canadian Federal Government Transfer Payments, 2008/09
Source: Federal Department of Finance "Federal Transfers to Provinces and Territories" see http://www.fin.gc.ca/access/fedprove.html
Population ($ millions) $/Person Rank
Newfoundland and Labrador 507,895 1,625 3199 6
Prince Edward Island 139,818 517 3698 4
Nova Scotia 938,310 2,964 3159 8
New Brunswick 747,302 2,659 3558 5
Quebec 7,750,504 19,972 2577 9
Ontario 12,928,996 21,760 1683 11
Manitoba 1,207,959 3,843 3181 7
Saskatchewan 1,015,985 1,610 1585 13
Alberta 3,585,142 6,148 1715 10
British Columbia 4,381,603 7,237 1652 12
Yukon 33,144 615 18555 3
Northwest Territories 43,283 882 20378 2
Nunavut 31,448 994 31608 1

2008 Canadian Election Results by Province, % Votes and Seats
Source: “2008 Canadian Election Results”, see http://www.sfu.ca/~aheard/elections/results.html
Cons. Lib. Total
Prov. % Votes MPs % Votes MPs MPs
Nfld 16.5 0 46.6 6 7
PEI 36.2 1 47.7 3 4
NS 26.1 3 29.8 5 11
NB 39.4 6 32.4 3 10
Que 21.7 10 23.7 14 75
Ont 39.2 51 33.8 38 106
Man 48.8 9 19.1 1 14
Sask 53.7 13 14.9 1 14
Alta 64.6 27 11.4 0 28
BC 44.4 22 19.3 5 36
NWT 37.1 0 13.4 0 1
NU 34.7 1 30.6 0 1
Yuk 32.8 0 45.3 1 1
Total 37.6 143 26.2 77 308
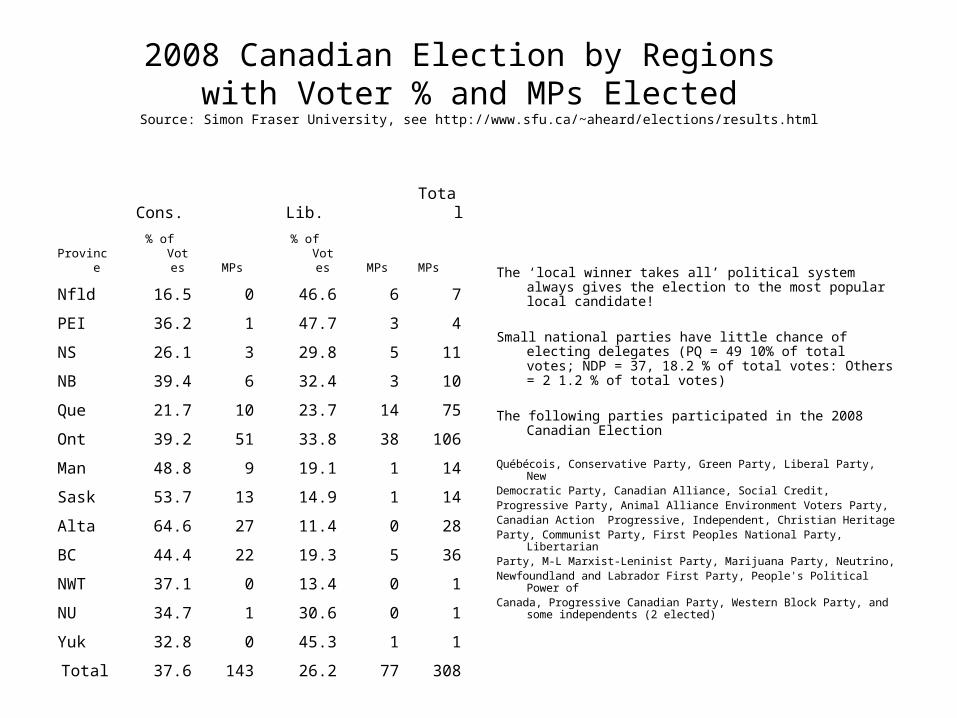
2008 Canadian Election by Regions with Voter % and MPs Elected
Source: Simon Fraser University, see http://www.sfu.ca/~aheard/elections/results.html
The ‘local winner takes all’ political system always gives the election to the most popular local candidate!
Small national parties have little chance of electing delegates (PQ = 49 10% of total votes; NDP = 37, 18.2 % of total votes: Others = 2 1.2 % of total votes)
The following parties participated in the 2008 Canadian Election
Québécois, Conservative Party, Green Party, Liberal Party, NewDemocratic Party, Canadian Alliance, Social Credit, Progressive Party, Animal Alliance Environment Voters Party,Canadian Action Progressive, Independent, Christian HeritageParty, Communist Party, First Peoples National Party, LibertarianParty, M-L Marxist-Leninist Party, Marijuana Party, Neutrino, Newfoundland and Labrador First Party, People's Political Power ofCanada, Progressive Canadian Party, Western Block Party, and
some independents (2 elected)
Cons. Lib. Total
Province % of Votes MPs % of Votes MPs MPs
Nfld 16.5 0 46.6 6 7
PEI 36.2 1 47.7 3 4
NS 26.1 3 29.8 5 11
NB 39.4 6 32.4 3 10
Que 21.7 10 23.7 14 75
Ont 39.2 51 33.8 38 106
Man 48.8 9 19.1 1 14
Sask 53.7 13 14.9 1 14
Alta 64.6 27 11.4 0 28
BC 44.4 22 19.3 5 36
NWT 37.1 0 13.4 0 1
NU 34.7 1 30.6 0 1
Yuk 32.8 0 45.3 1 1
Total 37.6 143 26.2 77 308

Canadian Provincial Homocide Rates, 2007per 100,000 persons
05
10152025
1NL PEI NC NB Q O MA S AB BC Y NT Nvt

Thank You For Listening