Canadian Preferred Shares Report
29
Market Recap and Commentary Over the past few months all eyes have been fixated on newly elected President Donald Trump and how his unexpected victory has boosted North American equity markets. Indeed, some of the broad plans he laid out during his campaign, such as a reduction in corporate taxes and a pull-back in financial regulations, could prove to be a huge positive for the U.S. economy (and by extension ours) if implemented. The Trump Rally which ensued following the election has extended to the Canadian preferred share market as market participants slowly adjust their interest rate forecasts upward. Since the election on November 8 th the S&P/TSX has gained 5.1% while the S&P/TSX Preferred Share Index has seen a 7.3% return over that same period. To be precise, the key catalyst for the Canadian preferred share market has been a rising 5-Year Government of Canada bond yield (“5YR GoC”), which gapped up from 0.67% in the days leading up to the election to 0.96% shortly after the election. This marks a significant contrast from the all-time low for the 5YR GoC of 0.49% reached on February 10, 2016. As a reminder, over 65% of the Canadian preferred share market consists of fixed-reset preferred shares, which have a strong positive correlation to the 5YR GoC due to the fact that their dividend rates adjust at a spread over that yield every five years. The upward movement in yields has given fixed- reset preferred shares a price return of 5.7% year-to-date while floating rate preferred shares, which also benefit from rising rates, have seen a 9.3% gain year-to-date. Even though perpetual preferred shares tend to trade much like long-dated corporate bonds (i.e. negative correlation to interest rates) they have kept their heads above water with a year-to-date gain of 3.0%. In this low interest rate environment many investors have been looking towards perpetual preferred shares as a replacement for some of their corporate bond exposure. As it stands, perpetual preferred shares are enjoying a yield spread of 237 basis points over the FTSE TMX BBB Corporate Bond Index and have a negative spread of only 77 basis points versus the FTSE TMX High Yield Composite Bond Index. Canadian Preferred Shares Report February 2017 Preferred Share Returns a Index Performance Preferred Share Type YTD Average Yield Retractable 1.2% 5.7% Perpetual 3.0% 5.3% Fixed-Reset 5.7% 5.0% Floating Rate 9.3% 3.9% Index Name Total Return S&P/TSX Preferred Share Index 6.2% FTSE TMX Corporate Bond Index 0.8% S&P/TSX Composite 1.5% Source: Bloomberg and FTSE TMX Global Debt Capital Markets; a - As of February 28, 2017; Inside This Issue 2 Market Outlook 3 DBRS Rating Changes New Issues 4 Reset & Exchange Options 5 Upcoming Resets Interest Rate Outlook 6 Yield Tables Retractable Preferred Shares 7 Perpetual Preferred Shares 13 Fixed-Reset Preferred Shares 19 Floating Rate Preferred Shares 22 $US-Pay Preferred Shares 23 Structured Preferred Shares 25 Index of Preferred Shares 29 Disclosures & Disclaimers CHRISTOPHER ANTONY Investment Strategy Group Source: Bloomberg; Note: S&P/TSX and S&P/TSX Preferred Share Indices normalized to 100
Transcript of Canadian Preferred Shares Report

Market Recap and Commentary Over the past few months all eyes have been fixated on newly elected President Donald Trump and how his unexpected victory has boosted North American equity markets. Indeed, some of the broad plans he laid out during his campaign, such as a reduction in corporate taxes and a pull-back in financial regulations, could prove to be a huge positive for the U.S. economy (and by extension ours) if implemented. The Trump Rally which ensued following the election has extended to the Canadian preferred share market as market participants slowly adjust their interest rate forecasts upward. Since the election on November 8th the S&P/TSX has gained 5.1% while the S&P/TSX Preferred Share Index has seen a 7.3% return over that same period. To be precise, the key catalyst for the Canadian preferred share market has been a rising 5-Year Government of Canada bond yield (“5YR GoC”), which gapped up from 0.67% in the days leading up to the election to 0.96% shortly after the election. This marks a significant contrast from the all-time low for the 5YR GoC of 0.49% reached on February 10, 2016. As a reminder, over 65% of the Canadian preferred share market consists of fixed-reset preferred shares, which have a strong positive correlation to the 5YR GoC due to the fact that their dividend rates adjust at a spread over that yield every five years. The upward movement in yields has given fixed-reset preferred shares a price return of 5.7% year-to-date while floating rate preferred shares, which also benefit from rising rates, have seen a 9.3% gain year-to-date. Even though perpetual preferred shares tend to trade much like long-dated corporate bonds (i.e. negative correlation to interest rates) they have kept their heads above water with a year-to-date gain of 3.0%. In this low interest rate environment many investors have been looking towards perpetual preferred shares as a replacement for some of their corporate bond exposure. As it stands, perpetual preferred shares are enjoying a yield spread of 237 basis points over the FTSE TMX BBB Corporate Bond Index and have a negative spread of only 77 basis points versus the FTSE TMX High Yield Composite Bond Index.
Canadian Preferred Shares Report February 2017
Preferred Share Returnsa Index Performance Preferred Share Type YTD Average Yield
Retractable 1.2% 5.7% Perpetual 3.0% 5.3% Fixed-Reset 5.7% 5.0% Floating Rate 9.3% 3.9% Index Name Total Return S&P/TSX Preferred Share Index 6.2% FTSE TMX Corporate Bond Index 0.8% S&P/TSX Composite 1.5% Source: Bloomberg and FTSE TMX Global Debt Capital Markets; a - As of February 28, 2017;
Inside This Issue 2 Market Outlook
3 DBRS Rating Changes
New Issues
4 Reset & Exchange Options
5 Upcoming Resets
Interest Rate Outlook
6 Yield Tables
Retractable Preferred Shares
7 Perpetual Preferred Shares
13 Fixed-Reset Preferred Shares
19 Floating Rate Preferred Shares
22 $US-Pay Preferred Shares
23 Structured Preferred Shares
25 Index of Preferred Shares
29 Disclosures & Disclaimers
CHRISTOPHER ANTONY Investment Strategy Group
Source: Bloomberg; Note: S&P/TSX and S&P/TSX Preferred Share Indices normalized to 100

Investment Strategy Group | Canadian Preferred Shares Report
2
Fund products, particularly exchange-traded funds (“ETFs”), continue to be a vital part of the Canadian preferred share market. Over the first two months of 2017 Canadian preferred share ETFs have seen roughly $410 million of net inflows. Dynamic Funds, which already manages a fairly large preferred share Mutual Fund (Dynamic Preferred Yield Class Mutual Fund), launched the Dynamic iShares Active Preferred Share ETF (ticker: DXP) in early January, which has already seen $54 million of net inflows. Of the passively managed preferred share ETFs the BMO Laddered Preferred Share Index ETF (ticker: ZPR) has been the biggest beneficiary of net inflows, seeing nearly $229 so far this year. The RBC Canadian Preferred Share ETF (ticker: RPF), which was launched this past September, has been seeing the most funds come its way versus its actively managed peers, with $109 million of net inflows year-to-date.
After nearly $1.5 billion of new supply coming to market in the first two weeks of November, issuers hit the pause button on new issuance until late-January. In the past few weeks we’ve seen four issuers come to market: Brookfield Office Properties, Brookfield Renewable Partners, Brookfield Infrastructure Partners and AltaGas. It is important to note that the preferred shares that were issued by Brookfield Renewable and Brookfield Infrastructure have distributions that contain a combination of dividend, income and return of capital; therefore not as tax efficient as regular preferred shares. Given the somewhat improved sentiment in the Canadian preferred share space and high demand from both retail and institutional clients for attractive preferred shares, issuers have been able to raise capital much more cost effectively than prior months. Investors are reminded to always do their homework before buying new issues. Often preferred shares from the same or a similar issuer can be found in the secondary market trading at similar yields for a lower price than the new issue.
One major event in the Canadian preferred share space that recently passed us by was TransAlta’s offer to shareholders of their five existing issues to exchange those preferred shares for one new preferred share. At face value the deal looked attractive to most investors given that this new preferred share would have had a significantly higher coupon and reset spread with a much larger market cap that would have served to improve liquidity. In addition, the deal would have effectively taken $300 million off of TransAlta’s balance sheet giving them an improved credit profile. However, the deal was met with considerable backlash from many investors when they looked closer and saw that the $300 million in savings would have come from the book value of their existing shares, which in some cases would be cut nearly in half. Ultimately, TransAlta took the deal off the table before the voting date, however if the deal had gone to vote and had been approved by shareholders it may have sparked some other issuers to find similar ways to reduce their preferred share liabilities at levels below par value.
Market Outlook With 2016 behind us we can now look at how some of the major factors impacting the Canadian preferred share market are expected to move going forward. ETFs will continue to play a key role in the preferred share space and investors are showing preference for getting exposure to fixed-reset preferred shares. Market participants have generally been embracing the presence of ETFs in the Canadian preferred share space as they provide enhanced liquidity in a market notoriously known to be largely illiquid.
Issuers are continuing to leverage the preferred share market as a means for raising capital, particularly in the high-demand fixed-reset space. However, with such a high demand for fixed-reset preferred shares, issuers will be able to continue issuing shares with lower dividend rates and reset spreads compared to those offered in early 2016. While the market did see an excess of issuance from the Canadian banks in 2015 and 2016 this was mostly done in order to meet rising regulatory capital requirements stemming from the Basel III accords. With the banks now in-line with those requirements, new issuance in the near term is expected to be more subdued.
The Canadian preferred share market will continue to be shaped by the movement and outlook for interest rates. The recent increases in consumer and business confidence south of the border has resulted in many analysts raising their growth outlook for the U.S. economy. This could have a spillover effect in to Canada barring any negative headwinds from the Trump administration’s protectionist policies. Looking inwards, the Canadian energy patch is expected to provide a boost to Canada’s top-line with expectations for a significant pickup in capital investments in 2017 and 2018. With this as a backdrop, interest rates should continue creeping higher. CIBC Economics currently forecasts the 5YR GoC to be relatively flat in 2017 however they see an improvement in 2018 with an end of year forecast of 1.65%. This represents an increase of 53 basis points from current levels. Despite the

Investment Strategy Group | Canadian Preferred Shares Report
3
sentiment currently being positive, we continue to recommend investors remain defensive in their preferred share positioning given that downside risks remain should U.S. and Canadian fiscal and monetary policy not progress as expected.
Exhibit 1: Recent DBRS Rating Changes
Issuer Symbols Action Rating Trend Date
Allbanc Split Corp. II Series 2 Preferred Shares Upgraded Pfd-2 -- Feb 23, 2017
AltaGas Ltd. All Preferreds Under Review Pfd-3 -- Jan 26, 2017
Big Bank Big Oil Split Corp. All Preferreds Discontinued Discontinued -- Jan 5, 2017
5Banc Split Inc. Series 1 Preferred Shares Discontinued Discontinued -- Dec 20, 2016
Life & Banc Split Corp. All Preferreds Upgraded Pfd-3 -- Nov 24, 2016
Veresen Inc. All Preferreds Under Review Pfd-3 -- Nov 18, 2016
Big 8 Split Inc. Series 1 Preferred Shares Upgraded Pfd-2 -- Nov 14, 2016 Source: DBRS
Exhibit 2: New Issuance Since October 2016
Price Annual Annual Current Next Call Series Symbol Type Rating 28-Feb-17 Div % Div $a Yield Price Date Terms of Reset Brookfield Asset Management Inc. 46 BAM.PF.I Fixed-Reset Pfd-2L $25.80 4.80% $1.20 4.65% $25.00 31-Mar-2022 5YR GoC Yld +3.85% (min. 4.80%) TransCanada Corporation 15 TRP.PR.K Fixed-Reset Pfd-2L * $25.73 4.90% $1.23 4.76% $25.00 31-May-2022 5YR GoC Yld +3.85% (min. 4.90%) Manulife Financial Corporation 23 MFC.PR.R Fixed-Reset Pfd-2 $25.60 4.85% $1.21 4.74% $25.00 19-Mar-2022 5YR GoC Yld +3.83% Enbridge Inc. 17 ENB.PF.I Fixed-Reset NR $25.94 5.15% $1.29 4.96% $25.00 1-Mar-2022 5YR GoC Yld +4.14% (min. 5.15%) ECN Capital Corp. A ECN.PR.A Fixed-Reset Pfd-3L $24.90 6.50% $1.63 6.53% $25.00 31-Dec-2021 5YR GoC Yld +5.44% (min. 6.50%) Brookfield Infrastructure Partners L.P. 7 BIP.PR.D Fixed-Reset NR $24.90 5.00% $1.25 5.02% $25.00 31-Mar-2022 5YR GoC Yld +3.78% (min. 5.00%) Brookfield Renewable Partners L.P. 11 BEP.PR.K Fixed-Reset Pfd-3H $24.83 5.00% $1.25 5.03% $25.00 30-Apr-2022 5YR GoC Yld +3.82% (min. 5.00%) Brookfield Office Properties Inc. EE BPO.PR.E Fixed-Reset Pfd-3 $24.95 5.10% $1.28 5.11% $25.00 31-Mar-2022 5YR GoC Yld +3.96% (min. 5.10%) AltaGas Ltd. K ALA.PR.K Fixed-Reset Pfd-3 * $25.04 5.00% $1.25 4.99% $25.00 31-Mar-2022 5YR GoC Yld +3.80% (min. 5.00%) Bank of Montreal 40 -- Fixed-Reset Pfd-2 $25.00 4.50% $1.13 4.50% $25.00 25-May-2022 5YR GoC Yld +3.33%
Source: Bloomberg; a – Bank of Montreal, Series 40 preferred share not yet trading as of pricing date

Investment Strategy Group | Canadian Preferred Shares Report
4
Resets & Exchange Options Since that last our Canadian Preferred Share Report in November there have been only three fixed-reset exchange and conversion options for investors to consider. Recall that every five years on its reset date fixed-reset preferred share investors have the option to convert into a floating rate preferred share from the same issuer. Of the three exchange and conversion options over the past three months only one had enough shareholders elect in favour of converting to the floating rate preferred to meet the minimum threshold for it to be issued. Given a widening spread between the 5YR GoC and 90-Day T-Bill the vast majority of investors elected to stay in their fixed-reset preferred and lock in a fixed dividend rate for another five years.
Between now and the end of June investors will face 12 fixed-reset conversion options. If rates remain near current levels over that time period these fixed-reset preferred shares will on average see a reduction in dividend rates of 30 basis points to 100 basis points, which is a stark contrast to the +200 basis point reduction most fixed-reset preferreds saw in 2015 and 2016 when interest rates were much lower. The current spread between the 5YR GoC and 90-Day T-Bill is at a sizeable premium to its five year average, which should work to influence investors away from converting to a floating rate instrument. While a sharp rise in the 90-Day T-Bill yield is not out of the question beyond the next year or so, it would have to rise at a much faster pace in order for the income on floating rate preferreds to outstrip the income provide by its corresponding
fixed-reset preferred. We would like to remind investors that once converted to a floating rate issue shareholders do have the option to switch back to the fixed-reset preferred share on the subsequent reset date.
1. Always check a prospectus to ensure this option is available
Exhibit 3: Past Conversions
Series Symbol
DBRS Rating Reset Spread1 Reset Date
Dividend Rate
Exchangeable Into
Share Allocation Among: Price
Series Symbol
Price
Floating Rate Terms 28-Feb-17 Previous New 28-Feb-17 Fixed-Rate Floating Rate AK BCE.PR.K $17.50 Pfd-3 1.88% 31-Dec-16 4.15% 2.954% AL BCE.PR.L $17.40 90-Day T-Bill Yld +1.88% 91% 9% 5 MFC.PR.G $23.28 Pfd-2 2.90% 19-Dec-16 4.40% 3.891% 6 -- -- 90-Day T-Bill Yld +2.90% 90% 10%
2R SLF.PR.I $23.10 Pfd-2 2.73% 31-Dec-16 4.25% 3.806% 13QR -- -- 90-Day T-Bill Yld +2.73% 93% 7%
90-Day T-Bill Yield vs. 5YR GoC Yield
Source: Bloomberg
Source: Bloomberg, Company reports; a – Over the 5YR GoC Yield;

Investment Strategy Group | Canadian Preferred Shares Report
5
Exhibit 4: Preferred Shares With Reset Dates Over The Next Six Months
Current: Potential New:a DBRS Price Annual Annual Next Call Annual Annual Series Symbol Rating 28-Feb-17 Div % Div $ Price Date Yield to Terms of Reset Div % Div $
Manulife Financial Corp. 7 MFC.PR.H Pfd-2 $23.66 4.60% $1.15 $ 25.00 19-Mar-2017 6.86% 5YR GoC Yld +3.13% 4.28% $1.07 BCE Inc. AO BCE.PR.O Pfd-3 $23.25 4.55% $1.14 $ 25.00 31-Mar-2017 8.73% 5YR GoC Yld +3.09% 4.24% $1.06 Brookfield Asset Management Inc. 26 BAM.PR.T Pfd-2L $18.99 4.50% $1.13 $ 25.00 31-Mar-2017 33.11% 5YR GoC Yld +2.31% 3.46% $0.87 Brookfield Office Properties Inc. P BPO.PR.P Pfd-3 $20.31 5.15% $1.29 $ 25.00 31-Mar-2017 24.66% 5YR GoC Yld +3.00% 4.15% $1.04 Fairfax Financial Holdings Limited K FFH.PR.K Pfd-3 $22.15 5.00% $1.25 $ 25.00 31-Mar-2017 14.26% 5YR GoC Yld +3.51% 4.66% $1.17 Canadian Utilities Limited Y CU.PR.C Pfd-2H $22.00 4.00% $1.00 $ 25.00 1-Jun-2017 14.77% 5YR GoC Yld +2.40% 3.55% $0.89 Enbridge Inc. B ENB.PR.B Pfd-3H $18.06 4.00% $1.00 $ 25.00 1-Jun-2017 39.80% 5YR GoC Yld +2.40% 3.55% $0.89 Brookfield Asset Management Inc. 28 BAM.PR.X Pfd-2L $16.10 4.60% $1.15 $ 25.00 30-Jun-2017 58.82% 5YR GoC Yld +1.80% 2.95% $0.74 Canaccord Genuity Group Inc. C CF.PR.C Pfd-3L $17.53 5.75% $1.44 $ 25.00 30-Jun-2017 46.68% 5YR GoC Yld +4.03% 5.18% $1.30 TransAlta Corporation C TA.PR.F Pfd-3 $16.85 4.60% $1.15 $ 25.00 30-Jun-2017 50.05% 5YR GoC Yld +3.10% 4.25% $1.06 Industrial Alliance Insurance and Financial Services Inc. G IAG.PR.G Pfd-2H $23.20 4.30% $1.08 $ 25.00 30-Jun-2017 8.90% 5YR GoC Yld +2.85% 4.00% $1.00 RioCan REIT C REI.PR.C Pfd-3H $24.89 4.70% $1.18 $ 25.00 30-Jun-2017 2.78% 5YR GoC Yld +3.18% 4.33% $1.08 Bombardier Inc. 3 BBD.PR.D NR $9.29 3.13% $0.78 $ 25.00 1-Aug-2017 173.31% ≥80% of 5YR GoC Yld -- --
Source: Bloomberg, CIBC Wood Gundy; a – Assuming 5YR GoC yield at the time of reset is 1.15%
Exhibit 5: Quarterly 5YR GoC Yield
Source: Bloomberg; CIBC Economics; Note: Dashed line is CIBC Economics forecasted level

CIBC Wood GundyRetractable Preferred Shares PRIOR_CLOSE_MID
Shares O/S Price Dividend
Preferred Share Issue Symbol (millions) Par 28-Feb-17 Yield Dividend Dates Annual Price Yield to Yield Spread
Cash Retractables - Cumulative
Brookfield Investments Corp. 4.70%, Series A BRN.PR.A 6.0 Pfd-2L $25.00 $25.27 4.65% Mar 31/Jun 30/Sep 30/Dec 31 1.18$ Anytime $25.00 NA NA NA
Canadian General Inv. 3.75%, Series 4 CGI.PR.D 3.0 Pfd-1L $25.00 $25.11 3.73% Mar 15/Jun 15/Sep 15/Dec 15 0.94$ 15-Jun-2018 $26.00 6.30% 0.65% 5.65%
15-Jun-2019 $25.75 4.74% 0.79% 3.95%
15-Jun-2020 $25.50 4.14% 0.90% 3.23%
15-Jun-2021 $25.25 3.82% 1.04% 2.78%
15-Jun-2022 $25.00 3.63% 1.16% 2.47%
15-Jun-2023 *** $25.00 3.65% 1.31% 2.34%
Dundee Corp. 5.00%, Series 4* DC.PR.E 4.3 NR $25.00 $24.27 7.73% Mar 31/Jun 30/Sep 30/Dec 31 1.88$ Anytime *** $25.75 NA NA NA
30-Jun-2017 *** $25.50 8.90% NA NA
30-Jun-2018 *** $25.25 11.67% 0.65% 11.01%
30-Jun-2019 *** $25.00 9.53% 0.80% 8.74%
DREAM Unlimited Corp. 7.00%, Series 1* DRM.PR.A 5.1 NR $7.16 $7.27 6.89% Mar 31/Jun 30/Sep 30/Dec 31 0.50$ Anytime *** $7.16 NA NA NA
Soft Retractables - Cumulative
Birchliff Energy Ltd. 7.00%, Series C BIR.PR.C 2.0 NR $25.00 $25.55 6.85% Mar 31/Jun 30/Sep 30/Dec 31 1.75$ 30-Jun-2018 $25.75 8.35% 0.65% 7.70%
30-Jun-2019 $25.50 7.33% 0.80% 6.53%
30-Jun-2020 $25.00 6.66% 0.91% 5.75%
30-Jun-2020 *** $25.00 6.66% 0.91% 5.75%
Brookfield Office Properties Inc. 5.00%, Series J BPO.PR.J 7.0 Pfd-3 $25.00 $25.37 4.93% Mar 31/Jun 30/Sep 30/Dec 31 1.25$ Anytime *** $25.00 NA NA NA
Brookfield Office Properties Inc. 5.20%, Series K BPO.PR.K 5.0 Pfd-3 $25.00 $25.39 5.12% Mar 31/Jun 30/Sep 30/Dec 31 1.30$ Anytime *** $25.00 NA NA NANotes:*** = Retraction Date* Cash retractable can be converted to common shares in certain circumstances by dividing the applicable redemption price by the greater of $2 or the 95% average weighted trading price of the common sharesCanadian government bond equivalents and spreads are calculated by interpolating a standard Canadian Government Bond Yield Curve.For redemption / retraction dates within one year, total return is displayed in lieu of yield to redemption / retraction.Redemption dates that have passed are not displayed. If the first redemption date has passed, most preferred shares are callable at anytime at prices that may differ from the table.Rating DBRS: /*+ Review for Possible Upgrade , /*- Review for Possible Downgrade, /* Review with Direction UncertainPLEASE LOOK TO THE ISSUE'S PROSPECTUS FOR FULL DETAILS.Price Date = Feb-28-2017
Call / Retraction*** Can Govt - Equivalent
DateRating DBRS
Source: Bloomberg, Financial Post DataGroup Retractables ‐ 6

CIBC Wood GundyPerpetual Preferred Shares PRIOR_CLOSE_MID
Shares O/S Price
Preferred Share Issue Symbol (millions) Par 28-Feb-17 Yield Dividend Dates Annual Price Yield to Yield Spread
Cumulative
Atlantic Power Preferred Equity Ltd 4.85%, Series 1 AZP.PR.A 5.0 NR $25.00 $14.69 8.25% Mar 31/Jun 30/Sep 30/Dec 31 1.21$ Anytime $25.00 NA NA NA
Bombardier Inc. 6.25%, Series 4 BBD.PR.C 9.4 NR $25.00 $17.80 8.78% Jan 31/Apr 30/Jul 31/Oct 31 1.56$ Anytime $25.00 NA NA NA
Brookfield Asset Management Inc. 4.75%, Series 17 BAM.PR.M 8.0 Pfd-2L $25.00 $22.79 5.21% Mar 31/Jun 30/Sep 30/Dec 31 1.19$ Anytime $25.00 NA NA NA
Brookfield Asset Management Inc. 4.75%, Series 18 BAM.PR.N 8.0 Pfd-2L $25.00 $22.80 5.21% Mar 31/Jun 30/Sep 30/Dec 31 1.19$ Anytime $25.00 NA NA NA
Brookfield Asset Management Inc. 4.85%, Series 36 BAM.PF.C 8.0 Pfd-2L $25.00 $22.99 5.27% Mar 31/Jun 30/Sep 30/Dec 31 1.21$ 31-Mar-2018 $26.00 17.48% 0.61% 16.87%
31-Mar-2019 $25.75 10.98% 0.77% 10.21%
31-Mar-2020 $25.50 8.74% 0.87% 7.87%
31-Mar-2021 $25.25 7.61% 1.02% 6.59%
31-Mar-2022 $25.00 6.94% 1.12% 5.81%
Brookfield Asset Management Inc. 4.90%, Series 37 BAM.PF.D 8.0 Pfd-2L $25.00 $23.28 5.26% Mar 31/Jun 30/Sep 30/Dec 31 1.23$ 30-Sep-2018 $26.00 12.69% 0.69% 12.00%
30-Sep-2019 $25.75 9.34% 0.82% 8.53%
30-Sep-2020 $25.50 7.89% 0.95% 6.94%
30-Sep-2021 $25.25 7.08% 1.07% 6.01%
30-Sep-2022 $25.00 6.56% 1.21% 5.36%
Brookfield Renewable Power Preferred Equity 5.00%, Series 5 BRF.PR.E 4.1 Pfd-3H $25.00 $21.51 5.81% Jan 31/Apr 30/Jul 31/Oct 31 1.25$ 30-Apr-2018 $26.00 22.48% 0.62% 21.85%
30-Apr-2019 $25.75 14.03% 0.78% 13.26%
30-Apr-2020 $25.50 10.98% 0.88% 10.10%
30-Apr-2021 $25.25 9.42% 1.03% 8.39%
30-Apr-2022 $25.00 8.47% 1.14% 7.33%
Brookfield Renewable Power Preferred Equity 5.00%, Series 6 BRF.PR.F 7.0 Pfd-3H $25.00 $21.36 5.85% Jan 31/Apr 30/Jul 31/Oct 31 1.25$ 31-Jul-2018 $26.00 19.93% 0.67% 19.27%
31-Jul-2019 $25.75 13.44% 0.80% 12.64%
31-Jul-2020 $25.50 10.80% 0.92% 9.88%
31-Jul-2021 $25.25 9.37% 1.05% 8.32%
31-Jul-2022 $25.00 8.48% 1.18% 7.30%
Canadian Utilities Ltd. 4.90%, Series AA CU.PR.D 6.0 Pfd-2H $25.00 $24.27 5.05% Mar 1/Jun 1/Sep 1/Dec 1 1.23$ 1-Sep-2017 $26.00 9.66% NA NA
1-Sep-2018 $25.75 8.93% 0.68% 8.25%
1-Sep-2019 $25.50 6.94% 0.81% 6.13%
1-Sep-2020 $25.25 6.10% 0.93% 5.17%
1-Sep-2021 $25.00 5.65% 1.06% 4.59%
Canadian Utilities Ltd. 4.90%, Series BB CU.PR.E 6.0 Pfd-2H $25.00 $24.06 5.09% Mar 1/Jun 1/Sep 1/Dec 1 1.23$ 1-Sep-2017 $26.00 10.61% NA NA
1-Sep-2018 $25.75 9.54% 0.68% 8.86%
1-Sep-2019 $25.50 7.31% 0.81% 6.50%
1-Sep-2020 $25.25 6.38% 0.93% 5.44%
1-Sep-2021 $25.00 5.86% 1.06% 4.80%
Call Can Govt - EquivalentRating DBRS Date
Dividend
Source: Bloomberg, FP Infomart Perpetuals ‐ 7

CIBC Wood GundyPerpetual Preferred Shares PRIOR_CLOSE_MID
Shares O/S Price
Preferred Share Issue Symbol (millions) Par 28-Feb-17 Yield Dividend Dates Annual Price Yield to Yield Spread
Call Can Govt - EquivalentRating DBRS Date
Dividend
Canadian Utilities Ltd. 4.50%, Series CC CU.PR.F 7.0 Pfd-2H $25.00 $22.25 5.06% Mar 1/Jun 1/Sep 1/Dec 1 1.13$ 1-Jun-2018 $26.00 17.50% 0.64% 16.86%
1-Jun-2019 $25.75 11.32% 0.78% 10.54%
1-Jun-2020 $25.50 8.99% 0.89% 8.10%
1-Jun-2021 $25.25 7.78% 1.03% 6.74%
1-Jun-2022 $25.00 7.03% 1.16% 5.87%
Canadian Utilities Ltd. 4.50%, Series DD CU.PR.G 9.0 Pfd-2H $25.00 $22.14 5.08% Mar 1/Jun 1/Sep 1/Dec 1 1.13$ 1-Sep-2018 $26.00 15.68% 0.68% 15.00%
1-Sep-2019 $25.75 10.87% 0.81% 10.06%
1-Sep-2020 $25.50 8.84% 0.93% 7.91%
1-Sep-2021 $25.25 7.73% 1.06% 6.67%
1-Sep-2022 $25.00 7.03% 1.20% 5.84%
CU Inc. 4.60%, Series 1 CIU.PR.A 4.6 Pfd-2H $25.00 $22.45 5.12% Mar 1/Jun 1/Sep 1/Dec 1 1.15$ Anytime $25.00 NA NA NA
Emera Inc. 4.50%, Series E EMA.PR.E 5.0 NR $25.00 $22.20 5.07% Feb 15/May 15/Aug 15/Nov 15 1.13$ 15-Aug-2018 $26.00 15.92% 0.67% 15.25%
15-Aug-2019 $25.75 10.94% 0.80% 10.13%
15-Aug-2020 $25.50 8.87% 0.93% 7.94%
15-Aug-2021 $25.25 7.74% 1.06% 6.68%
15-Aug-2022 $25.00 7.03% 1.19% 5.85%
Enbridge Inc. 5.50%, Series A ENB.PR.A 5.0 Pfd-3H $25.00 $25.38 5.42% Mar 1/Jun 1/Sep 1/Dec 1 1.38$ Anytime $25.00 NA NA NA
Fortis Inc. 4.90%, Series F FTS.PR.F 5.0 Pfd-3H $25.00 $23.85 5.14% Mar 1/Jun 1/Sep 1/Dec 1 1.23$ Anytime $25.00 NA NA NA
Fortis Inc. 4.75%, Series J FTS.PR.J 8.0 Pfd-3H $25.00 $23.00 5.16% Mar 1/Jun 1/Sep 1/Dec 1 1.19$ 1-Dec-2017 $26.00 16.92% NA NA
1-Dec-2018 $25.75 12.27% 0.72% 11.54%
1-Dec-2019 $25.50 9.24% 0.83% 8.41%
1-Dec-2020 $25.25 7.85% 0.97% 6.87%
1-Dec-2021 $25.00 7.05% 1.08% 5.97%
George Weston Ltd. 5.80%, Series I WN.PR.A 9.4 Pfd-3 $25.00 $25.90 5.60% Mar 15/Jun 15/Sep 15/Dec 15 1.45$ Anytime $25.00 NA NA NA
George Weston Ltd. 4.75%, Series V WN.PR.E 8.0 Pfd-3 $25.00 $23.26 5.11% Jan 1/Apr 1/Jul 1/Oct 1 1.19$ Anytime $25.00 NA NA NA
George Weston Ltd. 5.20%, Series III WN.PR.C 8.0 Pfd-3 $25.00 $24.94 5.21% Jan 1/Apr 1/Jul 1/Oct 1 1.30$ Anytime $25.00 NA NA NA
George Weston Ltd. 5.20%, Series IV WN.PR.D 8.0 Pfd-3 $25.00 $24.99 5.20% Jan 1/Apr 1/Jul 1/Oct 1 1.30$ Anytime $25.00 NA NA NA
Innergex Renewable Power 5.75%, Series C INE.PR.C 2.0 NR $25.00 $22.20 6.48% Jan 15/Apr 15/Jul 15/Oct 15 1.44$ 15-Jan-2018 $26.00 23.59% NA NA
15-Jan-2019 $25.75 14.58% 0.75% 13.84%
15-Jan-2020 $25.50 11.28% 0.84% 10.43%
15-Jan-2021 $25.25 9.70% 0.99% 8.71%
15-Jan-2022 $25.00 8.79% 1.10% 7.69%
Loblaw Companies Ltd. 5.30%, Series B L.PR.B 9.0 Pfd-3 $25.00 $25.55 5.19% Mar 31/Jun 30/Sep 30/Dec 31 1.33$ 30-Jun-2020 $26.00 5.96% 0.91% 5.06%
30-Jun-2021 $25.75 5.58% 1.04% 4.54%
30-Jun-2022 $25.50 5.35% 1.17% 4.18%
30-Jun-2023 $25.25 5.19% 1.32% 3.88%
30-Jun-2024 $25.00 5.09% 1.42% 3.66%
Source: Bloomberg, FP Infomart Perpetuals ‐ 8

CIBC Wood GundyPerpetual Preferred Shares PRIOR_CLOSE_MID
Shares O/S Price
Preferred Share Issue Symbol (millions) Par 28-Feb-17 Yield Dividend Dates Annual Price Yield to Yield Spread
Call Can Govt - EquivalentRating DBRS Date
Dividend
Westcoast Energy Inc. 5.50%, Series 7 W.PR.H 6.0 Pfd-2L $25.00 $25.10 5.48% Jan 15/Apr 15/Jul 15/Oct 15 1.38$ Anytime $25.00 NA NA NA
Westcoast Energy Inc. 5.60%, Series 8 W.PR.J 6.0 Pfd-2L $25.00 $25.25 5.54% Jan 15/Apr 15/Jul 15/Oct 15 1.40$ Anytime $25.00 NA NA NA
Non-Cumulative
Bank of Montreal 5.25%, Series 14 BMO.PR.K 10.0 Pfd-2H $25.00 $25.41 5.17% Feb 25/May 25/Aug 25/Nov 25 1.31$ Anytime $25.00 NA NA NA
Bank of Montreal 5.80%, Series 15 BMO.PR.L 10.0 Pfd-2H $25.00 $25.43 5.70% Feb 25/May 25/Aug 25/Nov 25 1.45$ Anytime $25.25 NA NA NA
25-May-2017 $25.00 -0.30% NA NA
Bank of Montreal 5.00%, Series 35 - NVCC BMO.PR.Z 6.0 Pfd-2 $25.00 $25.45 4.91% Feb 25/May 25/Aug 25/Nov 25 1.25$ 25-Aug-2020 $26.00 5.50% 0.93% 4.57%
24-Aug-2021 $25.75 5.17% 1.06% 4.11%
23-Aug-2022 $25.50 4.96% 1.19% 3.77%
22-Aug-2023 $25.25 4.82% 1.33% 3.49%
20-Aug-2024 $25.00 4.73% 1.44% 3.29%
Bank of Nova Scotia 5.60%, Series 17 BNS.PR.O 9.2 Pfd-2H $25.00 $25.32 5.53% Jan 28/Apr 28/Jul 28/Oct 28 1.40$ Anytime $25.25 NA NA NA
26-Apr-2017 $25.00 0.07% NA NA
Co-operators General Insurance Co. 5.00%, Series C CCS.PR.C 4.0 Pfd-2L $25.00 $23.95 5.22% Mar 31/Jun 30/Sep 30/Dec 31 1.25$ Anytime $25.00 NA NA NA
E-L Financial Corp. 4.75%, Series 2 ELF.PR.G 4.0 NR $25.00 $22.80 5.21% Jan 17/Apr 17/Jul 17/Oct 17 1.19$ Anytime $25.00 NA NA NA
E-L Financial Corp. 5.30%, Series 1 ELF.PR.F 4.0 NR $25.00 $24.45 5.42% Jan 17/Apr 17/Jul 17/Oct 17 1.33$ Anytime $25.00 NA NA NA
E-L Financial Corp. 5.50%, Series 3 ELF.PR.H 4.0 NR $25.00 $25.10 5.48% Jan 17/Apr 17/Jul 17/Oct 17 1.38$ 17-Apr-2017 $26.00 4.94% NA NA
17-Apr-2018 $25.75 8.33% 0.62% 7.72%
17-Apr-2019 $25.50 6.53% 0.77% 5.76%
17-Apr-2020 $25.25 5.89% 0.87% 5.02%
17-Apr-2021 $25.00 5.58% 1.02% 4.56%
Great-West Lifeco Inc. 5.40%, Series P GWO.PR.P 10.0 Pfd-2H $25.00 $25.65 5.26% Mar 31/Jun 30/Sep 30/Dec 31 1.35$ 31-Mar-2017 $26.00 2.66% NA NA
31-Mar-2018 $25.75 6.49% 0.61% 5.88%
31-Mar-2019 $25.50 5.46% 0.77% 4.69%
31-Mar-2020 $25.25 5.11% 0.87% 4.24%
31-Mar-2021 $25.00 4.95% 1.02% 3.93%
Great-West Lifeco Inc. 4.50%, Series I GWO.PR.I 12.0 Pfd-2H $25.00 $22.65 4.97% Mar 31/Jun 30/Sep 30/Dec 31 1.13$ Anytime $25.00 NA NA NA
Great-West Lifeco Inc. 4.85%, Series H GWO.PR.H 12.0 Pfd-2H $25.00 $23.98 5.06% Mar 31/Jun 30/Sep 30/Dec 31 1.21$ Anytime $25.00 NA NA NA
Great-West Lifeco Inc. 5.90%, Series F GWO.PR.F 7.7 Pfd-2H $25.00 $26.09 5.65% Mar 31/Jun 30/Sep 30/Dec 31 1.48$ Anytime $25.00 NA NA NA
Great-West Lifeco Inc. 5.20%, Series G GWO.PR.G 12.0 Pfd-2H $25.00 $25.19 5.16% Mar 31/Jun 30/Sep 30/Dec 31 1.30$ Anytime $25.00 NA NA NA
Great-West Lifeco Inc. 5.20%, Series S GWO.PR.S 8.0 Pfd-2H $25.00 $25.53 5.14% Mar 31/Jun 30/Sep 30/Dec 31 1.31$ 30-Jun-2019 $26.00 6.29% 0.79% 5.50%
30-Jun-2020 $25.75 5.67% 0.91% 4.76%
30-Jun-2021 $25.50 5.35% 1.04% 4.30%
30-Jun-2022 $25.25 5.15% 1.17% 3.98%
30-Jun-2023 $25.00 5.02% 1.32% 3.71%
Source: Bloomberg, FP Infomart Perpetuals ‐ 9

CIBC Wood GundyPerpetual Preferred Shares PRIOR_CLOSE_MID
Shares O/S Price
Preferred Share Issue Symbol (millions) Par 28-Feb-17 Yield Dividend Dates Annual Price Yield to Yield Spread
Call Can Govt - EquivalentRating DBRS Date
Dividend
Great-West Lifeco Inc. 5.65%, Series L GWO.PR.L 6.8 Pfd-2H $25.00 $26.12 5.41% Mar 31/Jun 30/Sep 30/Dec 31 1.41$ Anytime $25.50 NA NA NA
31-Dec-2017 $25.25 2.08% NA NA
31-Dec-2018 $25.00 3.66% 0.74% 2.92%
Great-West Lifeco Inc. 5.80%, Series M GWO.PR.M 6.0 Pfd-2H $25.00 $26.46 5.48% Mar 31/Jun 30/Sep 30/Dec 31 1.45$ Anytime $25.75 NA NA NA
31-Mar-2017 $25.50 -2.28% NA NA
31-Mar-2018 $25.25 2.17% 0.61% 1.56%
31-Mar-2019 $25.00 3.38% 0.77% 2.61%
Great-West Lifeco Inc. 5.15%, Series Q GWO.PR.Q 8.0 Pfd-2H $25.00 $25.07 5.14% Mar 31/Jun 30/Sep 30/Dec 31 1.29$ 30-Sep-2017 $26.00 7.55% NA NA
30-Sep-2018 $25.75 7.37% 0.69% 6.67%
30-Sep-2019 $25.50 6.13% 0.82% 5.31%
30-Sep-2020 $25.25 5.59% 0.95% 4.65%
30-Sep-2021 $25.00 5.30% 1.07% 4.23%
Great-West Lifeco Inc. 4.80%, Series R GWO.PR.R 8.0 Pfd-2H $25.00 $23.99 5.00% Mar 31/Jun 30/Sep 30/Dec 31 1.20$ 31-Dec-2017 $26.00 13.38% NA NA
31-Dec-2018 $25.75 9.24% 0.74% 8.50%
31-Dec-2019 $25.50 7.36% 0.84% 6.52%
31-Dec-2020 $25.25 6.48% 0.98% 5.49%
31-Dec-2021 $25.00 5.97% 1.09% 4.87%
HSBC Bank Canada 5.00%, Series D HSB.PR.D 7.0 Pfd-2 $25.00 $25.32 4.94% Mar 31/Jun 30/Sep 30/Dec 31 1.25$ Anytime $25.00 NA NA NA
HSBC Bank Canada 5.10%, Series C HSB.PR.C 7.0 Pfd-2 $25.00 $25.45 5.01% Mar 31/Jun 30/Sep 30/Dec 31 1.28$ Anytime $25.00 NA NA NA
IGM Financial Inc. 5.90%, Series B IGM.PR.B 6.0 Pfd-2H $25.00 $25.90 5.69% Jan 31/Apr 30/Jul 31/Oct 31 1.48$ Anytime $25.50 NA NA NA
31-Dec-2017 $25.25 2.70% NA NA
31-Dec-2018 $25.00 4.14% 0.74% 3.40%
Industrial Alliance Insurance & Financial 4.60%, Series B IAG.PR.A 5.0 Pfd-2H $25.00 $22.99 5.00% Mar 31/Jun 30/Sep 30/Dec 31 1.15$ Anytime $25.00 NA NA NA
Manulife Financial Corp. 4.50%, Series 3 MFC.PR.C 12.0 Pfd-2 $25.00 $22.35 5.03% Mar 19/Jun 19/Sep 19/Dec 19 1.13$ Anytime $25.00 NA NA NA
Manulife Financial Corp. 4.65%, Series 2 MFC.PR.B 14.0 Pfd-2 $25.00 $23.16 5.02% Mar 19/Jun 19/Sep 19/Dec 19 1.16$ Anytime $25.00 NA NA NA
Power Corp of Canada 5.00%, Series D POW.PR.D 10.0 Pfd-2 $25.00 $24.35 5.13% Jan 15/Apr 15/Jul 15/Oct 15 1.25$ Anytime $25.00 NA NA NA
Power Corp of Canada 5.35%, Series B POW.PR.B 8.0 Pfd-2 $25.00 $25.31 5.28% Jan 15/Apr 15/Jul 15/Oct 15 1.34$ Anytime $25.00 NA NA NA
Power Corp of Canada 5.60%, Series A POW.PR.A 6.0 Pfd-2 $25.00 $25.64 5.46% Jan 15/Apr 15/Jul 15/Oct 15 1.40$ Anytime $25.00 NA NA NA
Power Corp of Canada 5.80%, Series C POW.PR.C 6.0 Pfd-2 $25.00 $25.90 5.60% Jan 15/Apr 15/Jul 15/Oct 15 1.45$ Anytime $25.00 NA NA NA
Power Corp of Canada 5.60%, Series G POW.PR.G 8.0 Pfd-2 $25.00 $26.25 5.33% Jan 15/Apr 15/Jul 15/Oct 15 1.40$ 15-Apr-2017 $26.00 0.36% NA NA
15-Apr-2018 $25.75 4.30% 0.62% 3.69%
15-Apr-2019 $25.50 4.39% 0.77% 3.61%
15-Apr-2020 $25.25 4.43% 0.87% 3.55%
15-Apr-2021 $25.00 4.46% 1.02% 3.44%
Power Financial Corp. 5.25%, Series E PWF.PR.F 8.0 Pfd-2H $25.00 $25.00 5.25% Jan 31/Apr 30/Jul 31/Oct 31 1.31$ Anytime $25.00 NA NA NA
Power Financial Corp. 5.50%, Series D PWF.PR.E 6.0 Pfd-2H $25.00 $25.35 5.42% Jan 31/Apr 30/Jul 31/Oct 31 1.38$ Anytime $25.00 NA NA NA
Power Financial Corp. 5.75%, Series H PWF.PR.H 6.0 Pfd-2H $25.00 $25.66 5.60% Jan 31/Apr 30/Jul 31/Oct 31 1.44$ Anytime $25.00 NA NA NA
Source: Bloomberg, FP Infomart Perpetuals ‐ 10

CIBC Wood GundyPerpetual Preferred Shares PRIOR_CLOSE_MID
Shares O/S Price
Preferred Share Issue Symbol (millions) Par 28-Feb-17 Yield Dividend Dates Annual Price Yield to Yield Spread
Call Can Govt - EquivalentRating DBRS Date
Dividend
Power Financial Corp. 5.90%, Series F PWF.PR.G 6.0 Pfd-2H $25.00 $26.00 5.67% Jan 31/Apr 30/Jul 31/Oct 31 1.48$ Anytime $25.00 NA NA NA
Power Financial Corp. 6.00%, Series I PWF.PR.I 8.0 Pfd-2H $25.00 $26.22 5.72% Jan 31/Apr 30/Jul 31/Oct 31 1.50$ Anytime $25.00 NA NA NA
Power Financial Corp. 4.95%, Series K PWF.PR.K 10.0 Pfd-2H $25.00 $23.93 5.17% Jan 31/Apr 30/Jul 31/Oct 31 1.24$ Anytime $25.00 NA NA NA
Power Financial Corp. 5.10%, Series L PWF.PR.L 8.0 Pfd-2H $25.00 $24.44 5.22% Jan 31/Apr 30/Jul 31/Oct 31 1.28$ Anytime $25.00 NA NA NA
Power Financial Corp. 5.50%, Series R PWF.PR.R 10.0 Pfd-2H $25.00 $25.42 5.41% Jan 31/Apr 30/Jul 31/Oct 31 1.38$ 30-Apr-2017 $26.00 3.60% NA NA
30-Apr-2018 $25.75 6.91% 0.62% 6.29%
30-Apr-2019 $25.50 5.78% 0.78% 5.00%
30-Apr-2020 $25.25 5.38% 0.88% 4.50%
30-Apr-2021 $25.00 5.18% 1.03% 4.15%
Power Financial Corp. 5.80%, Series O PWF.PR.O 6.0 Pfd-2H $25.00 $26.15 5.54% Jan 31/Apr 30/Jul 31/Oct 31 1.45$ Anytime $25.50 NA NA NA
31-Oct-2017 $25.25 0.71% NA NA
31-Oct-2018 $25.00 3.26% 0.71% 2.55%
Power Financial Corp. 4.80%, Series S PWF.PR.S 12.0 Pfd-2H $25.00 $23.73 5.06% Jan 31/Apr 30/Jul 31/Oct 31 1.20$ 30-Apr-2018 $26.00 13.20% 0.62% 12.57%
30-Apr-2019 $25.75 8.89% 0.78% 8.11%
30-Apr-2020 $25.50 7.33% 0.88% 6.45%
30-Apr-2021 $25.25 6.53% 1.03% 5.50%
30-Apr-2022 $25.00 6.05% 1.14% 4.91%
Royal Bank of Canada 4.45%, Series AA RY.PR.A 12.0 Pfd-2H $25.00 $25.10 4.43% Feb 24/May 24/Aug 24/Nov 24 1.11$ Anytime $25.00 NA NA NA
Royal Bank of Canada 4.45%, Series AF RY.PR.F 8.0 Pfd-2H $25.00 $25.13 4.43% Feb 24/May 24/Aug 24/Nov 24 1.11$ Anytime $25.00 NA NA NA
Royal Bank of Canada 4.50%, Series AD RY.PR.D 10.0 Pfd-2H $25.00 $25.19 4.47% Feb 24/May 24/Aug 24/Nov 24 1.13$ Anytime $25.00 NA NA NA
Royal Bank of Canada 4.50%, Series AE RY.PR.E 10.0 Pfd-2H $25.00 $25.16 4.47% Feb 24/May 24/Aug 24/Nov 24 1.13$ Anytime $25.00 NA NA NA
Royal Bank of Canada 4.50%, Series AG RY.PR.G 10.0 Pfd-2H $25.00 $25.15 4.47% Feb 24/May 24/Aug 24/Nov 24 1.13$ Anytime $25.00 NA NA NA
Royal Bank of Canada 4.60%, Series AC RY.PR.C 8.0 Pfd-2 $25.00 $25.23 4.56% Feb 24/May 24/Aug 24/Nov 24 1.15$ Anytime $25.00 NA NA NA
Royal Bank of Canada 4.70%, Series AB RY.PR.B 12.0 Pfd-2H $25.00 $25.30 4.64% Feb 24/May 24/Aug 24/Nov 24 1.18$ Anytime $25.00 NA NA NA
Royal Bank of Canada 4.90%, Series BH - NVCC RY.PR.N 6.0 Pfd-2 $25.00 $25.18 4.86% Feb 24/May 24/Aug 24/Nov 24 1.23$ 24-Nov-2020 $26.00 5.68% 0.97% 4.71%
24-Nov-2021 $25.75 5.31% 1.08% 4.23%
24-Nov-2022 $25.50 5.08% 1.23% 3.85%
24-Nov-2023 $25.25 4.92% 1.36% 3.56%
24-Nov-2024 $25.00 4.80% 1.47% 3.33%
Royal Bank of Canada 4.90%, Series BI - NVCC RY.PR.O 6.0 Pfd-2 $25.00 $25.05 4.89% Feb 24/May 24/Aug 24/Nov 24 1.23$ 24-Nov-2020 $26.00 5.84% 0.97% 4.87%
24-Nov-2021 $25.75 5.44% 1.08% 4.35%
24-Nov-2022 $25.50 5.18% 1.23% 3.95%
24-Nov-2023 $25.25 5.01% 1.36% 3.65%
24-Nov-2024 $25.00 4.88% 1.47% 3.41%
Source: Bloomberg, FP Infomart Perpetuals ‐ 11

CIBC Wood GundyPerpetual Preferred Shares PRIOR_CLOSE_MID
Shares O/S Price
Preferred Share Issue Symbol (millions) Par 28-Feb-17 Yield Dividend Dates Annual Price Yield to Yield Spread
Call Can Govt - EquivalentRating DBRS Date
Dividend
Royal Bank of Canada 5.25%, Series BJ - NVCC RY.PR.P 6.0 Pfd-2 $25.00 $25.93 5.06% Feb 24/May 24/Aug 24/Nov 24 1.31$ 24-Feb-2021 $26.00 5.15% 1.01% 4.14%
24-Feb-2022 $25.75 4.96% 1.11% 3.85%
24-Feb-2023 $25.50 4.84% 1.27% 3.57%
24-Feb-2024 $25.25 4.76% 1.39% 3.37%
24-Feb-2025 $25.00 4.70% 1.50% 3.21%
Royal Bank of Canada 4.90%, Series W RY.PR.W 12.0 NR $25.00 $25.06 4.89% Feb 24/May 24/Aug 24/Nov 24 1.23$ Anytime $25.00 NA NA NA
Sun Life Financial Inc. 4.45%, Series 3 SLF.PR.C 10.0 Pfd-2 $25.00 $22.61 4.92% Mar 31/Jun 30/Sep 30/Dec 31 1.11$ Anytime $25.00 NA NA NA
Sun Life Financial Inc. 4.45%, Series 4 SLF.PR.D 12.0 Pfd-2 $25.00 $22.58 4.93% Mar 31/Jun 30/Sep 30/Dec 31 1.11$ Anytime $25.00 NA NA NA
Sun Life Financial Inc. 4.50%, Series 5 SLF.PR.E 10.0 Pfd-2 $25.00 $22.65 4.97% Mar 31/Jun 30/Sep 30/Dec 31 1.13$ Anytime $25.00 NA NA NA
Sun Life Financial Inc. 4.75%, Series 1 SLF.PR.A 16.0 Pfd-2 $25.00 $24.09 4.93% Mar 31/Jun 30/Sep 30/Dec 31 1.19$ Anytime $25.00 NA NA NA
Sun Life Financial Inc. 4.80%, Series 2 SLF.PR.B 13.0 Pfd-2 $25.00 $24.25 4.95% Mar 31/Jun 30/Sep 30/Dec 31 1.20$ Anytime $25.00 NA NA NA
The Toronto-Dominion Bank 4.90%, Series 11 - NVCC TD.PF.F 6.0 Pfd-2 $25.00 $25.15 4.87% Jan 31/Apr 30/Jul 31/Oct 31 1.23$ 31-Oct-2020 $26.00 5.83% 0.96% 4.87%
31-Oct-2021 $25.75 5.43% 1.08% 4.35%
31-Oct-2022 $25.50 5.17% 1.22% 3.95%
31-Oct-2023 $25.25 5.00% 1.35% 3.64%
31-Oct-2024 $25.00 4.87% 1.46% 3.41%
Preferred Securities 1
Brookfield Renewable Partners L.P. 5.59%, Series 5 BEP.PR.E 2.9 Pfd-3H $25.00 $22.18 6.30% Jan 31/Apr 30/Jul 31/Oct 31 1.40$ 30-Apr-2018 $26.00 20.31% 0.62% 19.68%
30-Apr-2019 $25.75 13.14% 0.78% 12.36%
30-Apr-2020 $25.50 10.55% 0.88% 9.67%
30-Apr-2021 $25.25 9.22% 1.03% 8.20%
30-Apr-2022 $25.00 8.42% 1.14% 7.28%Notes:Canadian government bond equivalents and spreads are calculated by interpolating a standard Canadian Government Bond Yield Curve.For redemption / retraction dates within one year, total return is displayed in lieu of yield to redemption / retraction.Redemption dates that have passed are not displayed. If the first redemption date has passed, most preferred shares are callable at anytime at prices that may differ from the table.Rating DBRS: /*+ Review for Possible Upgrade , /*- Review for Possible Downgrade, /* Review with Direction UncertainPLEASE LOOK TO THE ISSUE'S PROSPECTUS FOR FULL DETAILS.Price Date = Feb-28-20171 - Distribution may consist of a combination of dividend, income and return of capital and therefore may not be entirely eligible for the dividend tax credit. Please consult a tax professional for further information.
Source: Bloomberg, FP Infomart Perpetuals ‐ 12

CIBC Wood GundyFixed-Reset Preferred Shares
Shares O/S Price
Preferred Share Issue Symbol (millions) Par 28-Feb-17 Yield Dividend Dates Annual Date Price Yield to Yield Spread
Cumulative
Aimia Inc. 6.25%, Series 3 AIM.PR.C 6.0 Pfd-3L $25.00 $17.62 8.87% Mar 31/Jun 30/Sep 30/Dec 31 $1.56 31-Mar-2019 $25.00 25.69% 0.77% 24.92% 5YR GoC Yld +4.20%
Aimia Inc. 4.50%, Series 1 AIM.PR.A 4.0 Pfd-3L $25.00 $14.72 7.64% Mar 31/Jun 30/Sep 30/Dec 31 $1.13 31-Mar-2020 $25.00 24.17% 0.87% 23.31% 5YR GoC Yld +3.75%
Algonquin Power & Utilities Corp. 4.50%, Series A AQN.PR.A 4.8 Pfd-3L $25.00 $21.70 5.18% Mar 31/Jun 30/Sep 30/Dec 31 $1.13 31-Dec-2018 $25.00 13.22% 0.74% 12.48% 5YR GoC Yld +2.94%
Algonquin Power & Utilities Corp. 5.00%, Series D AQN.PR.D 4.0 Pfd-3L $25.00 $23.98 5.21% Mar 31/Jun 30/Sep 30/Dec 31 $1.25 31-Mar-2019 $25.00 7.59% 0.77% 6.82% 5YR GoC Yld +3.28%
AltaGas Ltd. 4.75%, Series G ALA.PR.G 8.0 Pfd-3 * $25.00 $22.93 5.18% Mar 31/Jun 30/Sep 30/Dec 31 $1.19 30-Sep-2019 $25.00 8.72% 0.82% 7.91% 5YR GoC Yld +3.06%
AltaGas Ltd. 3.38%, Series A ALA.PR.A 5.5 Pfd-3 * $25.00 $19.42 4.35% Mar 31/Jun 30/Sep 30/Dec 31 $0.85 30-Sep-2020 $25.00 11.24% 0.95% 10.29% 5YR GoC Yld +2.66%
AltaGas Ltd. 5.00%, Series E ALA.PR.E 8.0 Pfd-3 * $25.00 $23.99 5.21% Mar 31/Jun 30/Sep 30/Dec 31 $1.25 31-Dec-2018 $25.00 7.90% 0.74% 7.16% 5YR GoC Yld +3.17%
AltaGas Ltd. 5.25%, Series I ALA.PR.I 8.0 Pfd-3 * $25.00 $25.80 5.09% Mar 31/Jun 30/Sep 30/Dec 31 $1.31 31-Dec-2020 $25.00 4.59% 0.98% 3.61% 5YR GoC Yld +4.19% (min. 5.25%)
AltaGas Ltd. 5.00%, Series K ALA.PR.K 12.0 Pfd-3 * $25.00 $25.04 4.99% Mar 31/Jun 30/Sep 30/Dec 31 $1.25 31-Mar-2022 $25.00 4.99% 1.13% 3.87% 5YR GoC Yld +3.80% (min. 5.00%)
Atlantic Power Preferred Equity Ltd. 5.57%, Series 2 AZP.PR.B 2.3 NR $25.00 $17.35 8.03% Mar 31/Jun 30/Sep 30/Dec 31 $1.39 31-Dec-2019 $25.00 20.55% 0.84% 19.71% 5YR GoC Yld +4.18%
BCE Inc. 3.152%, Series Z BCE.PR.Z 1.2 Pfd-3 $25.00 $16.90 4.66% Mar 1/Jun 1/Sep 1/Dec 1 $0.79 1-Dec-2017 $25.00 51.43% NA NA ≥80% of 5YR GoC Yld
BCE Inc. 3.019%, Series T BCE.PR.T 4.4 Pfd-3 $25.00 $16.85 4.48% Feb 1/May 1/Aug 1/Nov 1 $0.75 1-Nov-2021 $25.00 12.39% 1.08% 11.32% ≥80% of 5YR GoC Yld
BCE Inc. 3.45%, Series AA BCE.PR.A 10.1 Pfd-3 $25.00 $16.99 5.08% Mar 1/Jun 1/Sep 1/Dec 1 $0.86 1-Sep-2017 $25.00 49.69% NA NA ≥80% of 5YR GoC Yld
BCE Inc. 3.55%, Series AC BCE.PR.C 5.1 Pfd-3 $25.00 $17.50 5.07% Mar 1/Jun 1/Sep 1/Dec 1 $0.89 1-Mar-2018 $25.00 42.02% 0.59% 41.42% ≥80% of 5YR GoC Yld
BCE Inc. 2.954%, Series AK BCE.PR.K 22.7 Pfd-3 $25.00 $17.50 4.22% Mar 31/Jun 30/Sep 30/Dec 31 $0.74 31-Dec-2021 $25.00 10.98% 1.09% 9.88% 5YR GoC Yld +1.88%
BCE Inc. 2.75%, Series AI BCE.PR.I 5.9 Pfd-3 $25.00 $16.61 4.14% Feb 1/May 1/Aug 1/Nov 1 $0.69 1-Aug-2021 $25.00 12.90% 1.05% 11.85% ≥80% of 5YR GoC Yld
BCE Inc. 4.25%, Series AQ BCE.PR.Q 9.2 Pfd-3 $25.00 $23.03 4.61% Mar 31/Jun 30/Sep 30/Dec 30 $1.06 30-Sep-2018 $25.00 9.45% 0.69% 8.76% 5YR GoC Yld +2.64%
BCE Inc. 4.13%, Series R BCE.PR.R 8.0 Pfd-3 $25.00 $18.98 5.44% Mar 1/Jun 1/Sep 1/Dec 1 $1.03 1-Dec-2020 $25.00 12.25% 0.97% 11.28% ≥80% of 5YR GoC Yld
BCE Inc. 2.80%, Series AG BCE.PR.G 5.0 Pfd-3 $25.00 $16.57 4.22% Feb 1/May 1/Aug 1/Nov 1 $0.70 1-May-2021 $25.00 13.61% 1.03% 12.58% ≥80% of 5YR GoC Yld
BCE Inc. 3.11%, Series AF BCE.PR.F 6.7 Pfd-3 $25.00 $16.85 4.61% Feb 1/May 1/Aug 1/Nov 1 $0.78 1-Feb-2020 $25.00 17.79% 0.85% 16.94% ≥80% of 5YR GoC Yld
BCE Inc. 4.55%, Series AO BCE.PR.O 4.6 Pfd-3 $25.00 $23.25 4.89% Mar 31/Jun 30/Sep 30/Dec 31 $1.14 31-Mar-2017 $25.00 8.73% NA NA 5YR GoC Yld +3.09%
BCE Inc. 2.764%, Series AM BCE.PR.M 9.5 Pfd-3 $25.00 $17.98 3.84% Mar 31/Jun 30/Sep 30/Dec 31 $0.69 31-Mar-2021 $25.00 11.40% 1.02% 10.38% 5YR GoC Yld +2.09%
Birchcliff Energy Ltd. 8.00%, Series A BIR.PR.A 2.0 NR $25.00 $25.87 7.73% Mar 31/Jun 30/Sep 30/Dec 31 $2.00 30-Sep-2017 $25.00 2.42% NA NA 5YR GOC Yld +6.83%
Bombardier Inc. 3.134%, Series 3 BBD.PR.D 2.3 NR $25.00 $9.29 8.43% Jan 31/Apr 30/Jul 31/Oct 31 $0.78 1-Aug-2017 $25.00 173.31% NA NA ≥80% of 5YR GoC Yld
Brookfield Asset Management Inc. 2.75%, Series 9 BAM.PR.G 5.5 Pfd-2L $25.00 $16.55 4.15% Feb 1/May 1/Aug 1/Nov 1 $0.69 1-Nov-2021 $25.00 12.48% 1.08% 11.40% ≥80% of 5YR GoC Yld
Brookfield Asset Management Inc. 4.20%, Series 34 BAM.PF.B 10.0 Pfd-2L $25.00 $21.99 4.77% Mar 31/Jun 30/Sep 30/Dec 31 $1.05 31-Mar-2019 $25.00 11.16% 0.77% 10.39% 5YR GoC Yld +2.63%
Brookfield Asset Management Inc. 4.40%, Series 38 BAM.PF.E 8.0 Pfd-2L $25.00 $22.57 4.87% Mar 31/Jun 30/Sep 30/Dec 31 $1.10 31-Mar-2020 $25.00 8.29% 0.87% 7.42% 5YR GoC Yld +2.55%
Brookfield Asset Management Inc. 4.50%, Series 26 BAM.PR.T 10.0 Pfd-2L $25.00 $18.99 5.92% Mar 31/Jun 30/Sep 30/Dec 31 $1.13 31-Mar-2017 $25.00 33.11% NA NA 5YR GoC Yld +2.31%
Brookfield Asset Management Inc. 4.50%, Series 32 BAM.PF.A 12.0 Pfd-2L $25.00 $23.38 4.81% Mar 31/Jun 30/Sep 30/Dec 31 $1.13 30-Sep-2018 $25.00 9.50% 0.69% 8.80% 5YR GoC Yld +2.90%
Brookfield Asset Management Inc. 4.50%, Series 40 BAM.PF.F 12.0 Pfd-2L $25.00 $23.51 4.79% Mar 31/Jun 30/Sep 30/Dec 31 $1.13 30-Sep-2019 $25.00 7.39% 0.82% 6.57% 5YR GoC Yld +2.86%
Brookfield Asset Management Inc. 4.60%, Series 28 BAM.PR.X 9.4 Pfd-2L $25.00 $16.10 7.14% Mar 31/Jun 30/Sep 30/Dec 31 $1.15 30-Jun-2017 $25.00 58.82% NA NA 5YR GoC Yld +1.80%
Brookfield Asset Management Inc. 4.80%, Series 30 BAM.PR.Z 10.0 Pfd-2L $25.00 $22.67 5.29% Mar 31/Jun 30/Sep 30/Dec 31 $1.20 31-Dec-2017 $25.00 15.57% NA NA 5YR GoC Yld +2.96%
Brookfield Asset Management Inc. 3.014%, Series 24 BAM.PR.R 9.5 Pfd-2L $25.00 $19.24 3.92% Mar 31/Jun 30/Sep 30/Dec 31 $0.75 30-Jun-2021 $25.00 9.75% 1.04% 8.71% 5YR GoC Yld +2.30%
Brookfield Asset Management Inc. 4.50%, Series 42 BAM.PF.G 12.0 Pfd-2L $25.00 $24.09 4.67% Mar 31/Jun 30/Sep 30/Dec 31 $1.13 30-Jun-2020 $25.00 5.97% 0.91% 5.06% 5YR GoC Yld +2.84%
Brookfield Asset Management Inc. 5.00%, Series 44 BAM.PF.H 10.0 Pfd-2L $25.00 $26.41 4.73% Mar 31/Jun 30/Sep 30/Dec 31 $1.25 31-Dec-2020 $25.00 3.66% 0.98% 2.67% 5YR GoC Yld +4.17% (min. 5%)
Brookfield Asset Management Inc. 4.80%, Series 46 BAM.PF.I 12.0 Pfd-2L $25.00 $25.80 4.65% Mar 31/Jun 30/Sep 30/Dec 31 $1.20 31-Mar-2022 $25.00 4.40% 1.13% 3.27% 5YR GoC Yld +3.85% (min. 4.80%)
Brookfield Infrastructure Partners L.P. 4.50%, Series 1 BIP.PR.A 5.0 NR $25.00 $22.72 4.95% Mar 31/Jun 30/Sep 30/Dec 31 $1.13 30-Jun-2020 $25.00 7.50% 0.91% 6.59% 5YR GoC Yld +3.56%
Brookfield Office Properties Inc. 4.75%, Series AA BPO.PR.A 12.0 Pfd-3 $25.00 $22.04 5.39% Mar 31/Jun 30/Sep 30/Dec 31 $1.19 31-Dec-2019 $25.00 9.93% 0.84% 9.10% 5YR GoC Yld +3.15%
Brookfield Office Properties Inc. 6.00%, Series CC BPO.PR.C 8.0 Pfd-3 $25.00 $26.64 5.63% Mar 31/Jun 30/Sep 30/Dec 31 $1.50 30-Jun-2021 $25.00 4.59% 1.04% 3.54% 5YR GoC Yld +5.18% (min. 6.00%)
Brookfield Office Properties Inc. 5.10%, Series EE BPO.PR.E 11.0 Pfd-3 $25.00 $24.95 5.11% Mar 31/Jun 30/Sep 30/Dec 31 $1.28 31-Mar-2022 $25.00 5.19% 1.12% 4.07% 5YR GoC Yld +3.96% (min. 5.10%)
Rating DBRS Terms of ResetCan Govt - EquivalentCall / ResetDividend
Source: Bloomberg, FP Infomart Fixed‐Resets ‐ 13

CIBC Wood GundyFixed-Reset Preferred Shares
Shares O/S Price
Preferred Share Issue Symbol (millions) Par 28-Feb-17 Yield Dividend Dates Annual Date Price Yield to Yield SpreadRating DBRS Terms of Reset
Can Govt - EquivalentCall / ResetDividend
Brookfield Office Properties Inc. 4.60%, Series T BPO.PR.T 10.0 Pfd-3 $25.00 $21.75 5.29% Mar 31/Jun 30/Sep 30/Dec 31 $1.15 31-Dec-2018 $25.00 13.20% 0.74% 12.47% 5YR GoC Yld +3.16%
Brookfield Office Properties Inc. 4.155%, Series R BPO.PR.R 8.9 Pfd-3 $25.00 $21.76 4.77% Mar 31/Jun 30/Sep 30/Dec 31 $1.04 30-Sep-2021 $25.00 7.73% 1.07% 6.66% 5YR GoC Yld +3.48%
Brookfield Office Properties Inc. 5.15%, Series P BPO.PR.P 12.0 Pfd-3 $25.00 $20.31 6.34% Mar 31/Jun 30/Sep 30/Dec 31 $1.29 31-Mar-2017 $25.00 24.66% NA NA 5YR GoC Yld +3.00%
Brookfield Office Properties Inc. 3.782%, Series N BPO.PR.N 11.0 Pfd-3 $25.00 $19.66 4.81% Mar 31/Jun 30/Sep 30/Dec 31 $0.95 30-Jun-2021 $25.00 10.12% 1.04% 9.08% 5YR GoC Yld +3.07%
Brookfield Renewable Power 4.40%, Series 3 BRF.PR.C 10.0 Pfd-3H $25.00 $22.20 4.95% Jan 31/Apr 30/Jul 31/Oct 31 $1.10 31-Jul-2019 $25.00 9.85% 0.80% 9.05% 5YR GoC Yld +2.94%
Brookfield Renewable Power 3.355%, Series 1 BRF.PR.A 5.5 Pfd-3H $25.00 $19.74 4.25% Jan 31/Apr 30/Jul 31/Oct 31 $0.84 30-Apr-2020 $25.00 11.49% 0.88% 10.61% 5YR GoC Yld +2.62%
Canaccord Genuity Group Inc. 3.885%, Series A CF.PR.A 4.5 Pfd-3L $25.00 $14.79 6.57% Mar 31/Jun 30/Sep 30/Dec 31 $0.97 30-Sep-2021 $25.00 17.15% 1.07% 16.08% 5YR GoC Yld +3.21%
Canaccord Genuity Group Inc. 5.75%, Series C CF.PR.C 4.0 Pfd-3L $25.00 $17.53 8.20% Mar 31/Jun 30/Sep 30/Dec 31 $1.44 30-Jun-2017 $25.00 46.68% NA NA 5YR GoC Yld +4.03%
Canadian Utilities Ltd. 4.00%, Series Y CU.PR.C 13.0 Pfd-2H $25.00 $22.00 4.55% Mar 1/Jun 1/Sep 1/Dec 1 $1.00 1-Jun-2017 $25.00 14.77% NA NA 5YR GoC Yld +2.40%
Canadian Utilities Ltd. 4.50%, Series FF CU.PR.I 10.0 Pfd-2H $25.00 $26.61 4.23% Mar 1/Jun 1/Sep 1/Dec 1 $1.13 1-Dec-2020 $25.00 2.69% 0.97% 1.72% 5YR GoC Yld +3.69% (min. 4.5%)
Capital Power Corp. 4.50%, Series 5 CPX.PR.E 8.0 Pfd-3L $25.00 $19.52 5.76% Mar 31/Jun 30/Sep 30/Dec 31 $1.13 30-Jun-2018 $25.00 25.08% 0.65% 24.43% 5YR GoC Yld +3.15%
Capital Power Corp. 3.06%, Series 1 CPX.PR.A 5.0 Pfd-3L $25.00 $15.26 5.01% Mar 31/Jun 30/Sep 30/Dec 31 $0.77 31-Dec-2020 $25.00 17.40% 0.98% 16.41% 5YR GoC Yld +2.17%
Capital Power Corp. 4.60%, Series 3 CPX.PR.C 6.0 Pfd-3L $25.00 $20.00 5.75% Mar 31/Jun 30/Sep 30/Dec 31 $1.15 31-Dec-2018 $25.00 18.21% 0.74% 17.47% 5YR GoC Yld +3.23%
Capital Power Corp. 6.00%, Series 7 CPX.PR.G 8.0 Pfd-3L $25.00 $25.97 5.78% Mar 31/Jun 30/Sep 30/Dec 31 $1.50 31-Dec-2021 $25.00 5.33% 1.09% 4.24% 5YR GoC Yld +5.26% (min. 6.00%)
Capstone Infrastructure Corp. 3.271%, Series A CSE.PR.A 3.0 NR $25.00 $11.90 6.87% Jan 31/Apr 30/Jul 31/Oct 31 $0.82 31-Jul-2021 $25.00 22.35% 1.05% 21.30% 5YR GoC Yld +2.71%
CU Inc. 2.24%, Series 4 CIU.PR.C 3.0 Pfd-2H $25.00 $14.95 3.75% Mar 1/Jun 1/Sep 1/Dec 1 $0.56 1-Jun-2021 $25.00 15.29% 1.03% 14.26% 5YR GoC Yld +1.36%
Dundee Corp. 5.688%, Series 2 DC.PR.B 3.5 NR $25.00 $16.41 8.67% Mar 31/Jun 30/Sep 30/Dec 31 $1.42 30-Sep-2019 $25.00 24.58% 0.82% 23.77% 5YR GoC Yld +4.10%
ECN Capital Corp. 6.50%, Series A ECN.PR.A 4.0 Pfd-3L $25.00 $24.90 6.53% Mar 31/Jun 30/Sep 30/Dec 31 $1.63 31-Dec-2021 $25.00 7.00% 1.09% 5.90% 5YR GoC Yld +5.44% (min. 6.50%)
Element Financial Corp. 6.40%, Series E EFN.PR.E 5.0 Pfd-3H $25.00 $25.15 6.36% Jan 17/Apr 17/Jul 17/Oct 17 $1.60 30-Sep-2019 $25.00 6.48% 0.82% 5.67% 5YR GoC Yld +4.72%
Element Financial Corp. 6.50%, Series C EFN.PR.C 5.1 Pfd-3H $25.00 $25.40 6.40% Mar 31/Jun 30/Sep 30/Dec 31 $1.63 31-Mar-2019 $25.00 6.25% 0.77% 5.48% 5YR GoC Yld +4.81%
Element Financial Corp. 6.60%, Series A EFN.PR.A 4.0 Pfd-3H $25.00 $25.30 6.52% Mar 31/Jun 30/Sep 30/Dec 31 $1.65 31-Dec-2018 $25.00 6.56% 0.74% 5.82% 5YR GoC Yld +4.71%
Element Financial Corp. 6.50%, Series G EFN.PR.G 6.9 Pfd-3H $25.00 $25.86 6.28% Mar 31/Jun 30/Sep 30/Dec 31 $1.63 30-Sep-2020 $25.00 5.78% 0.95% 4.83% 5YR GoC Yld +5.34%
Emera Inc. 4.10%, Series C EMA.PR.C 10.0 NR $25.00 $22.49 4.56% Feb 15/May 15/Aug 15/Nov 15 $1.03 15-Aug-2018 $25.00 11.85% 0.67% 11.17% 5YR GoC Yld +2.65%
Emera Inc. 4.25%, Series F EMA.PR.F 8.0 NR $25.00 $22.37 4.75% Feb 15/May 15/Aug 15/Nov 15 $1.06 15-Feb-2020 $25.00 8.38% 0.85% 7.53% 5YR GoC Yld +2.63%
Emera Inc. 2.555%, Series A EMA.PR.A 3.9 NR $25.00 $16.34 3.91% Feb 15/May 15/Aug 15/Nov 15 $0.64 15-Aug-2020 $25.00 15.80% 0.93% 14.87% 5YR GoC Yld +1.84%
Enbridge Inc. 4.00%, Series 3 ENB.PR.Y 24.0 Pfd-3H $25.00 $18.98 5.27% Mar 1/Jun 1/Sep 1/Dec 1 $1.00 1-Sep-2019 $25.00 15.89% 0.81% 15.08% 5YR GOC Yld +2.38%
Enbridge Inc. 4.00%, Series B ENB.PR.B 20.0 Pfd-3H $25.00 $18.06 5.54% Mar 1/Jun 1/Sep 1/Dec 1 $1.00 1-Jun-2017 $25.00 39.80% NA NA 5YR GoC Yld +2.40%
Enbridge Inc. 4.00%, Series D ENB.PR.D 18.0 Pfd-3H $25.00 $18.33 5.46% Mar 1/Jun 1/Sep 1/Dec 1 $1.00 1-Mar-2018 $25.00 37.37% 0.59% 36.77% 5YR GoC Yld +2.37%
Enbridge Inc. 4.00%, Series F ENB.PR.F 20.0 Pfd-3H $25.00 $19.20 5.21% Mar 1/Jun 1/Sep 1/Dec 1 $1.00 1-Jun-2018 $25.00 26.51% 0.64% 25.87% 5YR GoC Yld +2.51%
Enbridge Inc. 4.00%, Series H ENB.PR.H 14.0 Pfd-3H $25.00 $17.30 5.78% Mar 1/Jun 1/Sep 1/Dec 1 $1.00 1-Sep-2018 $25.00 30.43% 0.68% 29.75% 5YR GoC Yld +2.12%
Enbridge Inc. 4.00%, Series N ENB.PR.N 18.0 Pfd-3H $25.00 $19.56 5.11% Mar 1/Jun 1/Sep 1/Dec 1 $1.00 1-Dec-2018 $25.00 18.95% 0.72% 18.23% 5YR GoC Yld +2.65%
Enbridge Inc. 4.00%, Series P ENB.PR.P 16.0 Pfd-3H $25.00 $19.16 5.22% Mar 1/Jun 1/Sep 1/Dec 1 $1.00 1-Mar-2019 $25.00 18.25% 0.76% 17.49% 5YR GoC Yld +2.50%
Enbridge Inc. 4.00%, Series R ENB.PR.T 16.0 Pfd-3H $25.00 $19.19 5.21% Mar 1/Jun 1/Sep 1/Dec 1 $1.00 1-Jun-2019 $25.00 16.63% 0.78% 15.85% 5YR GoC Yld +2.50%
Enbridge Inc. 4.40%, Series 11 ENB.PF.C 20.0 Pfd-3H $25.00 $20.47 5.37% Mar 1/Jun 1/Sep 1/Dec 1 $1.10 1-Mar-2020 $25.00 11.67% 0.86% 10.81% 5YR GoC Yld +2.64%
Enbridge Inc. 4.40%, Series 13 ENB.PF.E 14.0 Pfd-3H $25.00 $20.43 5.38% Mar 1/Jun 1/Sep 1/Dec 1 $1.10 1-Jun-2020 $25.00 11.21% 0.89% 10.31% 5YR GoC Yld +2.66%
Enbridge Inc. 4.40%, Series 15 ENB.PF.G 11.0 Pfd-3H $25.00 $20.38 5.40% Mar 1/Jun 1/Sep 1/Dec 1 $1.10 1-Sep-2020 $25.00 10.83% 0.93% 9.90% 5YR GoC Yld +2.68%
Enbridge Inc. 4.40%, Series 7 ENB.PR.J 10.0 Pfd-3H $25.00 $20.07 5.48% Mar 1/Jun 1/Sep 1/Dec 1 $1.10 1-Mar-2019 $25.00 16.18% 0.76% 15.42% 5YR GoC Yld +2.57%
Enbridge Inc. 4.40%, Series 9 ENB.PF.A 11.0 Pfd-3H $25.00 $20.35 5.41% Mar 1/Jun 1/Sep 1/Dec 1 $1.10 1-Dec-2019 $25.00 12.52% 0.83% 11.69% 5YR GoC Yld +2.66%
Enbridge Inc. 5.15%, Series 17 ENB.PF.I 30.0 NR $25.00 $25.94 4.96% Mar 1/Jun 1/Sep 1/Dec 1 $1.29 1-Mar-2022 $25.00 4.32% 1.11% 3.21% 5YR GoC Yld +4.14% (min. 5.15%)
Fairfax Financial Holdings Ltd. 2.91%, Series E FFH.PR.E 4.0 Pfd-3 $25.00 $16.10 4.52% Mar 31/Jun 30/Sep 30/Dec 31 $0.73 31-Mar-2020 $25.00 18.56% 0.87% 17.69% 5YR GoC Yld +2.16%
Fairfax Financial Holdings Ltd. 3.318%, Series G FFH.PR.G 7.4 Pfd-3 $25.00 $18.17 4.57% Mar 31/Jun 30/Sep 30/Dec 31 $0.83 30-Sep-2020 $25.00 13.22% 0.95% 12.28% 5YR GoC Yld +2.56%
Source: Bloomberg, FP Infomart Fixed‐Resets ‐ 14

CIBC Wood GundyFixed-Reset Preferred Shares
Shares O/S Price
Preferred Share Issue Symbol (millions) Par 28-Feb-17 Yield Dividend Dates Annual Date Price Yield to Yield SpreadRating DBRS Terms of Reset
Can Govt - EquivalentCall / ResetDividend
Fairfax Financial Holdings Ltd. 3.708%, Series I FFH.PR.I 10.5 Pfd-3 $25.00 $19.19 4.83% Mar 31/Jun 30/Sep 30/Dec 31 $0.93 31-Dec-2020 $25.00 11.50% 0.98% 10.52% 5YR GoC Yld +2.85%
Fairfax Financial Holdings Ltd. 5.00%, Series K FFH.PR.K 9.5 Pfd-3 $25.00 $22.15 5.64% Mar 31/Jun 30/Sep 30/Dec 31 $1.25 31-Mar-2017 $25.00 14.26% NA NA 5YR GoC Yld +3.51%
Fairfax Financial Holdings Ltd. 4.578%, Series C FFH.PR.C 6.0 Pfd-3 $25.00 $21.50 5.32% Mar 31/Jun 30/Sep 30/Dec 31 $1.14 31-Dec-2019 $25.00 10.70% 0.84% 9.86% 5YR GoC Yld +3.15%
Fairfax Financial Holdings Ltd. 4.75%, Series M FFH.PR.M 9.2 Pfd-3 $25.00 $23.78 4.99% Mar 31/Jun 30/Sep 30/Dec 31 $1.19 31-Mar-2020 $25.00 6.82% 0.87% 5.95% 5YR GoC Yld +3.98%
First National Financial Corp. 2.79%, Series 1 FN.PR.A 2.9 Pfd-3 $25.00 $14.73 4.74% Mar 31/Jun 30/Sep 30/Dec 31 $0.70 31-Mar-2021 $25.00 17.16% 1.02% 16.14% 5YR GoC Yld +2.07%
Fortis Inc. 3.883%, Series G FTS.PR.G 9.2 Pfd-3H $25.00 $20.16 4.82% Mar 1/Jun 1/Sep 1/Dec 1 $0.97 1-Sep-2018 $25.00 19.97% 0.68% 19.29% 5YR GoC Yld +2.13%
Fortis Inc. 4.00%, Series K FTS.PR.K 10.0 Pfd-3H $25.00 $19.80 5.05% Mar 1/Jun 1/Sep 1/Dec 1 $1.00 1-Mar-2019 $25.00 17.15% 0.76% 16.39% 5YR GOC Yld +2.05%
Fortis Inc. 4.10%, Series M FTS.PR.M 24.0 Pfd-3H $25.00 $22.18 4.62% Mar 1/Jun 1/Sep 1/Dec 1 $1.03 1-Dec-2019 $25.00 9.24% 0.83% 8.40% 5YR GOC Yld +2.48%
Fortis Inc. 2.50%, Series H FTS.PR.H 7.0 Pfd-3H $25.00 $15.70 3.98% Mar 1/Jun 1/Sep 1/Dec 1 $0.63 1-Jun-2020 $25.00 18.20% 0.89% 17.30% 5YR GoC Yld +1.45%
GMP Capital Inc. 3.611%, Series B GMP.PR.B 3.6 Pfd-4H $25.00 $13.80 6.54% Mar 31/Jun 30/Sep 30/Dec 31 $0.90 31-Mar-2021 $25.00 20.22% 1.02% 19.21% 5YR GoC Yld +2.89%
Husky Energy Inc. 2.404%, Series 1 HSE.PR.A 10.4 Pfd-2L $25.00 $16.00 3.76% Mar 31/Jun 30/Sep 30/Dec 31 $0.60 31-Mar-2021 $25.00 14.09% 1.02% 13.08% 5YR GoC Yld +1.73%
Husky Energy Inc. 4.50%, Series 3 HSE.PR.C 10.0 Pfd-2L $25.00 $23.00 4.89% Mar 31/Jun 30/Sep 30/Dec 31 $1.13 31-Dec-2019 $25.00 7.53% 0.84% 6.69% 5YR GoC Yld +3.13%
Husky Energy Inc. 4.50%, Series 5 HSE.PR.E 8.0 Pfd-2L $25.00 $23.74 4.74% Mar 31/Jun 30/Sep 30/Dec 31 $1.13 31-Mar-2020 $25.00 6.18% 0.87% 5.32% 5YR GoC Yld +3.57%
Husky Energy Inc. 4.60%, Series 7 HSE.PR.G 6.0 Pfd-2L $25.00 $24.15 4.76% Mar 31/Jun 30/Sep 30/Dec 31 $1.15 30-Jun-2020 $25.00 5.61% 0.91% 4.70% 5YR GoC Yld +3.52%
Innergex Renewable Energy Inc. 3.608%, Series A INE.PR.A 3.4 NR $25.00 $16.27 5.54% Jan 15/Apr 15/Jul 15/Oct 15 $0.90 15-Jan-2021 $25.00 16.06% 0.99% 15.07% 5YR GoC Yld +2.79%
Northland Power Inc. 5.00%, Series 3 NPI.PR.C 4.8 NR $25.00 $23.00 5.43% Mar 31/Jun 30/Sep 30/Dec 31 $1.25 31-Dec-2017 $25.00 14.13% NA NA 5YR GoC Yld +3.46%
Northland Power Inc. 3.51%, Series 1 NPI.PR.A 4.5 NR $25.00 $18.71 4.69% Mar 31/Jun 30/Sep 30/Dec 31 $0.88 30-Sep-2020 $25.00 12.55% 0.95% 11.61% 5YR GoC Yld +2.80%
Pembina Pipeline Corp. 4.25%, Series 1 PPL.PR.A 10.0 Pfd-3 $25.00 $20.50 5.18% Mar 1/Jun 1/Sep 1/Dec 1 $1.06 1-Dec-2018 $25.00 16.33% 0.72% 15.61% 5YR GoC Yld +2.47%
Pembina Pipeline Corp. 4.50%, Series 7 PPL.PR.G 10.0 Pfd-3 $25.00 $22.04 5.10% Mar 1/Jun 1/Sep 1/Dec 1 $1.13 1-Dec-2019 $25.00 9.46% 0.83% 8.63% 5YR GoC Yld +2.94%
Pembina Pipeline Corp. 4.70%, Series 3 PPL.PR.C 6.0 Pfd-3 $25.00 $21.36 5.50% Mar 1/Jun 1/Sep 1/Dec 1 $1.18 1-Mar-2019 $25.00 13.13% 0.76% 12.37% 5YR GoC Yld +2.60%
Pembina Pipeline Corp. 5.00%, Series 5 PPL.PR.E 10.0 Pfd-3 $25.00 $23.14 5.40% Mar 1/Jun 1/Sep 1/Dec 1 $1.25 1-Jun-2019 $25.00 8.70% 0.78% 7.91% 5YR GoC Yld +3.00%
Pembina Pipeline Corp. 4.75%, Series 9 PPL.PR.I 9.0 Pfd-3 $25.00 $24.87 4.77% Mar 1/Jun 1/Sep 1/Dec 1 $1.19 1-Dec-2020 $25.00 4.91% 0.97% 3.94% 5YR GoC Yld +3.91%
Pembina Pipeline Corp. 5.75%, Series 11 PPL.PR.K 6.8 Pfd-3 $25.00 $26.39 5.45% Mar 1/Jun 1/Sep 1/Dec 1 $1.44 1-Mar-2021 $25.00 4.24% 1.01% 3.23% 5YR GoC Yld +5.00% (min. 5.75%)
Pembina Pipeline Corp. 5.75%, Series 13 PPL.PR.M 10.0 Pfd-3 $25.00 $26.49 5.43% Mar 1/Jun 1/Sep 1/Dec 1 $1.44 1-Jun-2021 $25.00 4.22% 1.03% 3.18% 5YR GoC Yld +4.96% (min. 5.75%)
Shaw Communications Inc. 2.791%, Series A SJR.PR.A 10.0 Pfd-3L $25.00 $16.84 4.14% Mar 31/Jun 30/Sep 30/Dec 31 $0.70 30-Jun-2021 $25.00 12.89% 1.04% 11.85% 5YR GoC Yld +2.00%
TransAlta Corp. 2.709%, Series A TA.PR.D 10.2 Pfd-3 $25.00 $13.11 5.17% Mar 31/Jun 30/Sep 30/Dec 31 $0.68 31-Mar-2021 $25.00 19.94% 1.02% 18.92% 5YR GoC Yld +2.03%
TransAlta Corp. 4.60%, Series C TA.PR.F 11.0 Pfd-3 $25.00 $16.85 6.82% Mar 31/Jun 30/Sep 30/Dec 31 $1.15 30-Jun-2017 $25.00 50.05% NA NA 5YR GoC Yld +3.10%
TransAlta Corp. 5.00%, Series E TA.PR.H 9.0 Pfd-3 $25.00 $18.69 6.69% Mar 31/Jun 30/Sep 30/Dec 31 $1.25 30-Sep-2017 $25.00 37.09% NA NA 5YR GoC Yld +3.65%
TransAlta Corp. 5.30%, Series G TA.PR.J 6.6 Pfd-3 $25.00 $19.99 6.63% Mar 31/Jun 30/Sep 30/Dec 31 $1.33 30-Sep-2019 $25.00 14.56% 0.82% 13.74% 5YR GoC Yld +3.80%
TransCanada Corp. 4.00%, Series 3 TRP.PR.B 8.5 Pfd-2L * $25.00 $14.48 3.72% Mar 31/Jun 30/Sep 30/Dec 31 $0.54 30-Jun-2020 $25.00 19.58% 0.91% 18.67% 5YR GoC Yld +1.28%
TransCanada Corp. 4.00%, Series 7 TRP.PR.D 24.0 Pfd-2L * $25.00 $22.01 4.54% Jan 30/Apr 30/Jul 30/Oct 30 $1.00 30-Apr-2019 $25.00 10.43% 0.78% 9.65% 5YR GoC Yld +2.38%
TransCanada Corp. 4.25%, Series 9 TRP.PR.E 18.0 Pfd-2L * $25.00 $22.74 4.67% Jan 30/Apr 30/Jul 30/Oct 30 $1.06 30-Oct-2019 $25.00 8.22% 0.82% 7.40% 5YR GoC Yld +2.35%
TransCanada Corp. 2.263%, Series 5 TRP.PR.C 12.7 Pfd-2L * $25.00 $16.00 3.54% Jan 30/Apr 30/Jul 30/Oct 30 $0.57 30-Jan-2021 $25.00 14.56% 1.00% 13.57% 5YR GoC Yld +1.54%
TransCanada Corp. 3.266%, Series 1 TRP.PR.A 9.5 Pfd-2L * $25.00 $18.32 4.46% Mar 31/Jun 30/Sep 30/Dec 31 $0.82 31-Dec-2019 $25.00 14.90% 0.84% 14.06% 5YR GoC Yld +1.92%
TransCanada Corp. 3.80%, Series 11 TRP.PR.G 10.0 Pfd-2L * $25.00 $23.05 4.12% Feb 28/May 31/Aug 31/Nov 30 $0.95 30-Nov-2020 $25.00 6.16% 0.97% 5.19% 5YR GoC Yld +2.96%
TransCanada Corp. 5.50%, Series 13 TRP.PR.J 20.0 Pfd-2L * $25.00 $26.48 5.19% Feb 28/May 31/Aug 31/Nov 30 $1.38 31-May-2021 $25.00 3.99% 1.03% 2.95% 5YR GoC Yld +4.69% (min. 5.50%)
TransCanada Corp. 4.90%, Series 15 TRP.PR.K 40.0 Pfd-2L * $25.00 $25.73 4.76% Feb 28/May 31/Aug 31/Nov 30 $1.23 31-May-2022 $25.00 4.28% 1.16% 3.13% 5YR GoC Yld +3.85% (min. 4.90%)
Valener Inc. 4.35%., Series A VNR.PR.A 4.0 Pfd-2L $25.00 $21.46 5.07% Jan 15/Apr 15/Jul 15/Oct 15 $1.09 15-Oct-2017 $25.00 20.29% NA NA 5YR GoC Yld +2.81%
Veresen Inc. 4.40%, Series A VSN.PR.A 8.0 Pfd-3 /*- $25.00 $20.26 5.43% Mar 31/Jun 30/Sep 30/Dec 31 $1.10 30-Sep-2017 $25.00 27.46% NA NA 5YR GoC Yld +2.92%
Veresen Inc. 5.00%, Series C VSN.PR.C 6.0 Pfd-3 /*- $25.00 $22.25 5.62% Mar 31/Jun 30/Sep 30/Dec 31 $1.25 31-Mar-2019 $25.00 11.49% 0.77% 10.72% 5YR GoC Yld +3.01%
Veresen Inc. 5.00%, Series E VSN.PR.E 8.0 Pfd-3 /*- $25.00 $24.24 5.16% Mar 31/Jun 30/Sep 30/Dec 31 $1.25 30-Jun-2020 $25.00 6.31% 0.91% 5.40% 5YR GoC Yld +4.27%
Source: Bloomberg, FP Infomart Fixed‐Resets ‐ 15

CIBC Wood GundyFixed-Reset Preferred Shares
Shares O/S Price
Preferred Share Issue Symbol (millions) Par 28-Feb-17 Yield Dividend Dates Annual Date Price Yield to Yield SpreadRating DBRS Terms of Reset
Can Govt - EquivalentCall / ResetDividend
Westcoast Energy Inc. 5.25%, Series 10 W.PR.K 4.6 Pfd-2L $25.00 $26.12 5.02% Jan 15/Apr 15/Jul 15/Oct 15 $1.31 15-Jan-2021 $25.00 4.18% 0.99% 3.19% 5YR GoC Yld +4.26% (min. 5.25%)
Westcoast Energy Inc. 5.20%, Series 12 W.PR.M 12.0 Pfd-2L $25.00 $26.08 4.98% Jan 15/Apr 15/Jul 15/Oct 15 $1.30 15-Oct-2021 $25.00 4.33% 1.07% 3.25% 5YR GoC Yld +4.52% (min. 5.20%)
Non-Cumulative
Bank of Montreal 3.39%, Series 16 BMO.PR.M 6.3 Pfd-2H $25.00 $24.77 3.42% Feb 25/May 25/Aug 25/Nov 25 $0.85 25-Aug-2018 $25.00 4.07% 0.68% 3.39% 5YR GoC Yld +1.65%
Bank of Montreal 3.90%, Series 25 BMO.PR.Q 11.6 Pfd-2H $25.00 $21.35 2.11% Feb 25/May 25/Aug 25/Nov 25 $0.45 25-Aug-2021 $25.00 5.51% 1.06% 4.45% 5YR GoC Yld +1.15%
Bank of Montreal 4.00%, Series 27 - NVCC BMO.PR.S 20.0 Pfd-2 $25.00 $22.26 4.49% Feb 25/May 25/Aug 25/Nov 25 $1.00 25-May-2019 $25.00 9.54% 0.78% 8.76% 5YR GOC Yld +2.33%
Bank of Montreal 3.90%, Series 29 - NVCC BMO.PR.T 16.0 Pfd-2 $25.00 $21.91 4.45% Feb 25/May 25/Aug 25/Nov 25 $0.98 25-Aug-2019 $25.00 9.58% 0.81% 8.78% 5YR GoC Yld +2.24%
Bank of Montreal 3.80%, Series 31 - NVCC BMO.PR.W 12.0 Pfd-2 $25.00 $21.79 4.36% Feb 25/May 25/Aug 25/Nov 25 $0.95 25-Nov-2019 $25.00 9.19% 0.83% 8.36% 5YR GoC Yld +2.22%
Bank of Montreal 3.80%, Series 33 - NVCC BMO.PR.Y 8.0 Pfd-2 $25.00 $23.96 3.96% Feb 25/May 25/Aug 25/Nov 25 $0.95 25-Aug-2020 $25.00 5.13% 0.93% 4.20% 5YR GoC Yld +2.71%
Bank of Montreal 4.85%, Series 38 - NVCC BMO.PR.B 24.0 Pfd-2 $25.00 $25.98 4.67% Feb 25/May 25/Aug 25/Nov 25 $1.21 25-Feb-2022 $25.00 4.00% 1.11% 2.89% 5YR GoC Yld +4.06%
The Bank of Nova Scotia 3.35%, Series 18 BNS.PR.P 7.5 Pfd-2H $25.00 $24.80 3.38% Jan 28/Apr 28/Jul 28/Oct 28 $0.84 26-Apr-2018 $25.00 4.35% 0.62% 3.73% 5YR GoC Yld +2.05%
The Bank of Nova Scotia 3.61%, Series 20 BNS.PR.Q 8.0 Pfd-2H $25.00 $24.55 3.68% Jan 28/Apr 28/Jul 28/Oct 28 $0.90 26-Oct-2018 $25.00 4.97% 0.71% 4.26% 5YR GoC Yld +1.70%
The Bank of Nova Scotia 3.83%, Series 22 BNS.PR.R 9.4 Pfd-2H $25.00 $24.65 3.88% Jan 28/Apr 28/Jul 28/Oct 28 $0.96 26-Jan-2019 $25.00 4.80% 0.75% 4.05% 5YR GoC Yld +1.88%
The Bank of Nova Scotia 1.82%, Series 30 BNS.PR.Y 6.1 Pfd-2H $25.00 $21.90 2.08% Jan 28/Apr 28/Jul 28/Oct 28 $0.46 26-Apr-2020 $25.00 6.25% 0.88% 5.37% 5YR GoC Yld +1.00%
The Bank of Nova Scotia 2.063%, Series 32 BNS.PR.Z 11.2 Pfd-2H $25.00 $21.78 2.37% Jan 31/Apr 30/Jul 31/Oct 31 $0.52 2-Feb-2021 $25.00 5.81% 1.00% 4.81% 5YR GoC Yld +1.34%
The Bank of Nova Scotia 5.50%, Series 34 - NVCC BNS.PR.E 14.0 Pfd-2 $25.00 $26.95 5.10% Jan 29/Apr 28/Jul 29/Oct 29 $1.38 25-Apr-2021 $25.00 3.60% 1.02% 2.58% 5YR GoC Yld +4.51%
The Bank of Nova Scotia 5.50%, Series 36 - NVCC BNS.PR.G 20.0 Pfd-2 $25.00 $27.04 5.09% Jan 31/Apr 30/July 31/Oct 31 $1.38 25-Jul-2021 $25.00 3.60% 1.05% 2.55% 5YR GoC Yld +4.72%
The Bank of Nova Scotia 4.85%, Series 38 - NVCC BNS.PR.H 20.0 Pfd-2 $25.00 $26.07 4.65% Jan 31/Apr 30/July 31/Oct 31 $1.21 26-Jan-2022 $25.00 3.98% 1.10% 2.88% 5YR GoC Yld +4.19%
Canadian Imperial Bank of Commerce 3.90%, Series 39 - NVCC CM.PR.O 16.0 Pfd-2 $25.00 $22.33 4.37% Jan 28/Apr 28/Jul 28/Oct 28 $0.98 31-Jul-2019 $25.00 9.04% 0.80% 8.24% 5YR GoC Yld +2.32%
Canadian Imperial Bank of Commerce 3.75%, Series 41 - NVCC CM.PR.P 12.0 Pfd-2 $25.00 $21.79 4.30% Jan 28/Apr 28/Jul 28/Oct 28 $0.94 31-Jan-2020 $25.00 8.94% 0.85% 8.09% 5YR GoC Yld +2.24%
Canadian Imperial Bank of Commerce 3.60%, Series 43 - NVCC CM.PR.Q 12.0 Pfd-2 $25.00 $23.70 3.80% Jan 28/Apr 28/Jul 28/Oct 28 $0.90 31-Jul-2020 $25.00 5.39% 0.92% 4.47% 5YR GoC Yld +2.79%
Canadian Western Bank 4.40%, Series 5 - NVCC CWB.PR.B 5.0 Pfd-3 $25.00 $21.26 5.17% Jan 31/Apr 30/Jul 31/Oct 31 $1.10 30-Apr-2019 $25.00 12.61% 0.78% 11.83% 5YR GoC Yld +2.76%
Canadian Western Bank 6.25%, Series 7 - NVCC CWB.PR.C 5.6 Pfd-3 $25.00 $27.45 5.69% Jan 31/Apr 30/Jul 31/Oct 31 $1.56 31-Jul-2021 $25.00 3.95% 1.05% 2.90% 5YR GoC Yld +5.47%
Empire Life Insurance Company 5.75%, Series 1 EML.PR.A 6.0 Pfd-2 $25.00 $26.63 5.40% Jan 17/Apr 17/Jul 17/Oct 17 $1.44 17-Apr-2021 $25.00 4.21% 1.02% 3.19% 5YR GoC Yld +4.99%
Equitable Group Inc. 6.35%, Series 3 EQB.PR.C 3.0 NR $25.00 $25.30 6.27% Mar 31/Jun 30/Sep 30/Dec 31 $1.59 30-Sep-2019 $25.00 6.30% 0.82% 5.49% 5YR GoC Yld +4.78%
Great-West Lifeco Inc. 2.176%, Series N GWO.PR.N 8.5 Pfd-2H $25.00 $15.38 3.54% Mar 31/Jun 30/Sep 30/Dec 31 $0.54 31-Dec-2020 $25.00 15.92% 0.98% 14.93% 5YR GoC Yld +1.30%
Industrial Alliance Insurance and Financial 4.30%, Series G IAG.PR.G 10.0 Pfd-2H $25.00 $23.20 4.63% Mar 31/Jun 30/Sep 30/Dec 31 $1.08 30-Jun-2017 $25.00 8.90% NA NA 5YR GoC Yld +2.85%
Intact Financial Corp. 4.20%, Series 1 IFC.PR.A 10.0 Pfd-2 $25.00 $18.58 5.65% Mar 31/Jun 30/Sep 30/Dec 31 $1.05 31-Dec-2017 $25.00 40.20% NA NA 5YR GoC Yld +1.72%
Intact Financial Corp. 3.332%, Series 3 IFC.PR.C 8.4 Pfd-2 $25.00 $21.61 3.85% Mar 31/Jun 30/Sep 30/Dec 31 $0.83 30-Sep-2021 $25.00 6.96% 1.07% 5.89% 5YR GoC Yld +2.66%
Laurentian Bank of Canada 4.00%, Series 11 LB.PR.F 4.0 Pfd-3H $25.00 $24.65 4.06% Mar 15/Jun 15/Sep 15/Dec 15 $1.00 15-Dec-2017 $25.00 5.48% NA NA 5YR GoC Yld +2.60%
Laurentian Bank of Canada 4.30%, Series 13 - NVCC LB.PR.H 5.0 Pfd-3 $25.00 $22.76 4.72% Mar 15/Jun 15/Sep 15/Dec 15 $1.08 15-Jun-2019 $25.00 9.14% 0.79% 8.36% 5YR GoC Yld +2.55%
Laurentian Bank of Canada 5.85%, Series 15 - NVCC LB.PR.J 5.0 Pfd-3 $25.00 $26.62 5.49% Mar 15/Jun 15/Sep 15/Dec 15 $1.46 15-Jun-2021 $25.00 4.51% 1.04% 3.47% 5YR GoC Yld +5.13%
Manulife Financial Corp. 2.178%, Series 3 MFC.PR.F 6.3 Pfd-2 $25.00 $15.05 3.62% Mar 19/Jun 19/Sep 19/Dec 19 $0.54 19-Jun-2021 $25.00 14.84% 1.04% 13.80% 5YR GoC Yld +1.41%
Manulife Financial Corp. 3.891%, Series 5 MFC.PR.G 8.0 Pfd-2 $25.00 $23.28 4.18% Mar 19/Jun 19/Sep 19/Dec 19 $0.97 19-Dec-2021 $25.00 5.49% 1.09% 4.40% 5YR GoC Yld +2.90%
Manulife Financial Corp. 4.60%, Series 7 MFC.PR.H 10.0 Pfd-2 $25.00 $23.66 4.86% Mar 19/Jun 19/Sep 19/Dec 19 $1.15 19-Mar-2017 $25.00 6.86% NA NA 5YR GoC Yld +3.13%
Manulife Financial Corp. 4.40%, Series 9 MFC.PR.I 10.0 Pfd-2 $25.00 $22.88 4.81% Mar 19/Jun 19/Sep 19/Dec 19 $1.10 19-Sep-2017 $25.00 11.67% NA NA 5YR GoC Yld +2.86%
Manulife Financial Corp. 4.00%, Series 11 MFC.PR.J 8.0 Pfd-2 $25.00 $22.67 4.41% Mar 19/Jun 19/Sep 19/Dec 19 $1.00 19-Mar-2018 $25.00 13.51% 0.60% 12.90% 5YR GoC Yld +2.61%
Manulife Financial Corp. 3.80%, Series 13 MFC.PR.K 8.0 Pfd-2 $25.00 $21.03 4.52% Mar 19/Jun 19/Sep 19/Dec 19 $0.95 19-Sep-2018 $25.00 15.40% 0.69% 14.71% 5YR GOC Yld +2.22%
Manulife Financial Corp. 3.90%, Series 15 MFC.PR.L 8.0 Pfd-2 $25.00 $21.15 4.61% Mar 19/Jun 19/Sep 19/Dec 19 $0.98 19-Jun-2019 $25.00 11.54% 0.79% 10.75% 5YR GOC Yld +2.16%
Manulife Financial Corp. 3.90%, Series 17 MFC.PR.M 14.0 Pfd-2 $25.00 $21.94 4.44% Mar 19/Jun 19/Sep 19/Dec 19 $0.98 19-Dec-2019 $25.00 8.81% 0.84% 7.98% 5YR GoC Yld +2.36%
Manulife Financial Corp. 3.80%, Series 19 MFC.PR.N 10.0 Pfd-2 $25.00 $22.01 4.32% Mar 19/Jun 19/Sep 19/Dec 19 $0.95 19-Mar-2020 $25.00 8.21% 0.86% 7.35% 5YR GoC Yld +2.30%
Source: Bloomberg, FP Infomart Fixed‐Resets ‐ 16

CIBC Wood GundyFixed-Reset Preferred Shares
Shares O/S Price
Preferred Share Issue Symbol (millions) Par 28-Feb-17 Yield Dividend Dates Annual Date Price Yield to Yield SpreadRating DBRS Terms of Reset
Can Govt - EquivalentCall / ResetDividend
Manulife Financial Corp. 5.60%, Series 21 MFC.PR.O 17.0 Pfd-2 $25.00 $26.73 5.24% Mar 19/Jun 19/Sep 19/Dec 19 $1.40 19-Jun-2021 $25.00 3.78% 1.04% 2.74% 5YR GoC Yld +4.97%
Manulife Financial Corp. 4.85%, Series 23 MFC.PR.R 19.0 Pfd-2 $25.00 $25.60 4.74% Mar 19/Jun 19/Sep 19/Dec 19 $1.21 19-Mar-2022 $25.00 4.27% 1.12% 3.15% 5YR GoC Yld +3.83%
National Bank of Canada 3.80%, Series 28 NA.PR.Q 8.0 Pfd-2 $25.00 $24.40 3.89% Feb 15/May 15/Aug 15/Nov 15 $0.95 15-Nov-2017 $25.00 5.37% NA NA 5YR GoC Yld +2.43%
National Bank of Canada 4.10%, Series 30 - NVCC NA.PR.S 14.0 Pfd-2L $25.00 $22.35 4.59% Feb 15/May 15/Aug 15/Nov 15 $1.03 15-May-2019 $25.00 9.58% 0.78% 8.80% 5YR GoC Yld +2.40%
National Bank of Canada 3.90%, Series 32 - NVCC NA.PR.W 12.0 Pfd-2L $25.00 $21.55 4.52% Feb 15/May 15/Aug 15/Nov 15 $0.98 15-Feb-2020 $25.00 9.37% 0.85% 8.52% 5YR GoC Yld +2.25%
National Bank of Canada 5.60%, Series 34 - NVCC NA.PR.X 16.0 Pfd-2L $25.00 $26.72 5.24% Feb 15/May 15/Aug 15/Nov 15 $1.40 15-May-2021 $25.00 3.88% 1.03% 2.85% 5YR GoC Yld +4.90%
National Bank of Canada 5.60%, Series 36 - NVCC NA.PR.A 16.0 Pfd-2L $25.00 $26.52 5.09% Feb 15/May 15/Aug 15/Nov 15 $1.35 15-Aug-2021 $25.00 3.96% 1.06% 2.91% 5YR GoC Yld +4.66%
Power Financial Corp. 2.306%, Series P PWF.PR.P 9.0 Pfd-2H $25.00 $15.55 3.71% Jan 31/Apr 30/Jul 31/Oct 31 $0.58 31-Jan-2021 $25.00 15.41% 1.00% 14.42% 5YR GoC Yld +1.60%
Power Financial Corp. 4.20%, Series T PWF.PR.T 8.0 Pfd-2H $25.00 $22.38 4.69% Jan 31/Apr 30/Jul 31/Oct 31 $1.05 31-Jan-2019 $25.00 10.53% 0.75% 9.77% 5YR GoC Yld +2.37%
Royal Bank of Canada 3.90%, Series BB - NVCC RY.PR.H 20.0 Pfd-2 $25.00 $21.92 4.45% Feb 24/May 24/Aug 24/Nov 24 $0.98 24-Aug-2019 $25.00 9.57% 0.81% 8.77% 5YR GoC Yld +2.26%
Royal Bank of Canada 3.52%, Series AJ RY.PR.I 13.6 Pfd-2H $25.00 $24.51 3.59% Feb 24/May 24/Aug 24/Nov 24 $0.88 24-Feb-2019 $25.00 4.60% 0.76% 3.84% 5YR GoC Yld +1.93%
Royal Bank of Canada 4.26%, Series AL RY.PR.L 12.0 Pfd-2H $25.00 $25.22 4.22% Feb 24/May 24/Aug 24/Nov 24 $1.07 24-Feb-2019 $25.00 3.84% 0.76% 3.08% 5YR GoC Yld +2.67%
Royal Bank of Canada 4.00%, Series AZ - NVCC RY.PR.Z 20.0 Pfd-2 $25.00 $21.89 4.57% Feb 24/May 24/Aug 24/Nov 24 $1.00 24-May-2019 $25.00 10.36% 0.78% 9.57% 5YR GoC Yld +2.21%
Royal Bank of Canada 3.60%, Series BD - NVCC RY.PR.J 20.0 Pfd-2 $25.00 $23.06 3.90% Feb 24/May 24/Aug 24/Nov 24 $0.90 24-May-2020 $25.00 6.30% 0.89% 5.41% 5YR GoC Yld +2.74%
Royal Bank of Canada 3.60%, Series BF - NVCC RY.PR.M 21.0 Pfd-2 $25.00 $23.01 3.91% Feb 24/May 24/Aug 24/Nov 24 $0.90 24-Nov-2020 $25.00 6.02% 0.97% 5.05% 5YR GoC Yld +2.62%
Royal Bank of Canada 5.50%, Series BK - NVCC RY.PR.Q 22.0 Pfd-2 $25.00 $26.97 5.10% Feb 24/May 24/Aug 24/Nov 24 $1.38 24-May-2021 $25.00 3.51% 1.03% 2.48% 5YR GoC Yld +4.53%
Royal Bank of Canada 5.50%, Series BM - NVCC RY.PR.R 23.0 Pfd-2 $25.00 $27.06 5.08% Feb 24/May 24/Aug 24/Nov 24 $1.38 24-Aug-2021 $25.00 3.53% 1.06% 2.47% 5YR GoC Yld +4.80%
Sun Life Financial Inc. 2.275%, Series 8R SLF.PR.G 5.2 Pfd-2 $25.00 $16.35 3.48% Mar 31/Jun 30/Sep 30/Dec 31 $0.57 30-Jun-2020 $25.00 16.04% 0.91% 15.14% 5YR GoC Yld +1.41%
Sun Life Financial Inc. 2.842%, Series 10R SLF.PR.H 6.9 Pfd-2 $25.00 $19.50 3.64% Mar 31/Jun 30/Sep 30/Dec 31 $0.71 30-Sep-2021 $25.00 8.87% 1.07% 7.80% 5YR GoC Yld +2.17%
Sun Life Financial Inc. 3.806%, Series 12R SLF.PR.I 12.0 Pfd-2 $25.00 $23.10 4.12% Mar 31/Jun 30/Sep 30/Dec 31 $0.95 31-Dec-2021 $25.00 5.78% 1.09% 4.68% 5YR GoC Yld +2.73%
The Toronto-Dominion Bank 3.90%, Series 1 - NVCC TD.PF.A 20.0 Pfd-2 $25.00 $21.96 4.44% Jan 31/Apr 30/Jul 31/Oct 31 $0.98 31-Oct-2019 $25.00 9.24% 0.82% 8.42% 5YR GoC Yld +2.24%
The Toronto-Dominion Bank 3.80%, Series 3 - NVCC TD.PF.B 20.0 Pfd-2 $25.00 $21.85 4.35% Jan 31/Apr 30/Jul 31/Oct 31 $0.95 31-Jul-2019 $25.00 9.88% 0.80% 9.08% 5YR GoC Yld +2.27%
The Toronto-Dominion Bank 3.75%, Series 5 - NVCC TD.PF.C 20.0 Pfd-2 $25.00 $21.73 4.31% Jan 31/Apr 30/Jul 31/Oct 31 $0.94 31-Jan-2020 $25.00 9.03% 0.85% 8.18% 5YR GoC Yld +2.25%
The Toronto-Dominion Bank 3.371%, Series S TD.PR.S 5.4 Pfd-2H $25.00 $24.70 3.41% Jan 31/Apr 30/Jul 31/Oct 31 $0.84 31-Jul-2018 $25.00 4.47% 0.67% 3.80% 5YR GoC Yld +1.60%
The Toronto-Dominion Bank 3.5595%, Series Y TD.PR.Y 5.5 Pfd-2H $25.00 $24.76 3.59% Jan 31/Apr 30/Jul 31/Oct 31 $0.89 31-Oct-2018 $25.00 4.35% 0.71% 3.64% 5YR GoC Yld +1.68%
The Toronto-Dominion Bank 3.60%, Series 7 - NVCC TD.PF.D 14.0 Pfd-2 $25.00 $23.52 3.83% Jan 31/Apr 30/Jul 31/Oct 31 $0.90 31-Jul-2020 $25.00 5.62% 0.92% 4.70% 5YR GoC Yld +2.79%
The Toronto-Dominion Bank 3.70%, Series 9 - NVCC TD.PF.E 8.0 Pfd-2 $25.00 $24.17 3.83% Jan 31/Apr 30/Jul 31/Oct 31 $0.93 31-Oct-2020 $25.00 4.79% 0.96% 3.83% 5YR GoC Yld +2.87%
The Toronto-Dominion Bank 5.60%, Series 12 - NVCC TD.PF.G 28.0 Pfd-2 $25.00 $27.08 5.08% Jan 31/Apr 30/Jul 31/Oct 31 $1.38 30-Apr-2021 $25.00 3.47% 1.03% 2.44% 5YR GoC Yld +4.66%
The Toronto-Dominion Bank 4.85%, Series 14 - NVCC TD.PF.H 40.0 Pfd-2 $25.00 $26.00 4.66% Jan 31/Apr 30/Jul 31/Oct 31 $1.21 31-Oct-2021 $25.00 4.01% 1.08% 2.93% 5YR GoC Yld +4.12%
Source: Bloomberg, FP Infomart Fixed‐Resets ‐ 17

CIBC Wood GundyFixed-Reset Preferred Shares
Shares O/S Price
Preferred Share Issue Symbol (millions) Par 28-Feb-17 Yield Dividend Dates Annual Date Price Yield to Yield SpreadRating DBRS Terms of Reset
Can Govt - EquivalentCall / ResetDividend
Preferred Securities 1
Artis REIT 5.25%, Series A AX.PR.A 3.5 Pfd-3L $25.00 $21.60 6.08% Mar 31/Jun 30/Sep 30/Dec 31 $1.31 30-Sep-2017 $25.00 20.29% NA NA 5YR GoC Yld +4.06%
Artis REIT 4.75%, Series E AX.PR.E 4.0 Pfd-3L $25.00 $18.36 6.47% Mar 31/Jun 30/Sep 30/Dec 31 $1.19 30-Sep-2018 $25.00 26.51% 0.69% 25.82% 5YR GoC Yld +3.30%
Artis REIT 5.00%, Series G AX.PR.G 3.2 Pfd-3L $25.00 $18.75 6.67% Jan 31/Apr 30/Jul 31/Oct 31 $1.25 31-Jul-2019 $25.00 18.26% 0.80% 17.46% 5YR GoC Yld +3.13%
RioCan REIT 4.70%, Series C REI.PR.C 6.0 Pfd-3H $25.00 $24.89 4.72% Mar 31/Jun 30/Sep 30/Dec 31 $1.18 30-Jun-2017 $25.00 2.78% NA NA 5YR GoC Yld +3.18%
Brookfield Infrastructure Partners L.P. 5.50%, Series 3 BIP.PR.B 5.0 NR $25.00 $25.84 5.32% Mar 31/Jun 30/Sep 30/Dec 31 $1.38 31-Dec-2020 $25.00 4.42% 0.98% 3.43% 5YR GoC Yld +4.53% (min. 5.50%)
Brookfield Infrastructure Partners L.P. 5.35%, Series 5 BIP.PR.C 10.0 NR $25.00 $25.65 5.21% Mar 31/Jun 30/Sep 30/Dec 31 $1.34 30-Sep-2021 $25.00 4.62% 1.07% 3.55% 5YR GoC Yld +4.64% (min. 5.35%)
Brookfield Infrastructure Partners L.P. 5.00%, Series 7 BIP.PR.D 12.0 NR $25.00 $24.90 5.02% Mar 31/Jun 30/Sep 30/Dec 31 $1.25 31-Mar-2022 $25.00 5.20% 1.12% 4.08% 5YR GoC Yld +3.78% (min. 5.00%)
Brookfield Renewable Partners L.P. 5.50%, Series 7 BEP.PR.G 7.0 Pfd-3H $25.00 $25.85 5.32% Jan 31/Apr 30/Jul 31/Oct 31 $1.38 31-Jan-2021 $25.00 4.68% 1.00% 3.68% 5YR GoC Yld +4.47% (min. 5.50%)
Brookfield Renewable Partners L.P. 5.75%, Series 9 BEP.PR.I 8.0 Pfd-3H $25.00 $25.82 5.57% Jan 31/Apr 30/Jul 31/Oct 31 $1.44 31-Jul-2021 $25.00 5.04% 1.05% 3.99% 5YR GoC Yld +5.01% (min. 5.75%)
Brookfield Renewable Partners L.P. 5.00%, Series 11 BEP.PR.K 10.0 Pfd-3H $25.00 $24.83 5.03% Jan 31/Apr 30/Jul 31/Oct 31 $1.25 30-Apr-2022 $25.00 5.25% 1.14% 4.11% 5YR GoC Yld +3.82% (min. 5.00%)Notes:Canadian government bond equivalents and spreads are calculated by interpolating a standard Canadian Government Bond Yield Curve.For redemption / retraction dates within one year, total return is displayed in lieu of yield to redemption / retraction.Redemption dates that have passed are not displayed. If the first redemption date has passed, most preferred shares are callable at anytime at prices that may differ from the table.Rating DBRS: /*+ Review for Possible Upgrade , /*- Review for Possible Downgrade, /* Review with Direction UncertainPLEASE LOOK TO THE ISSUE'S PROSPECTUS FOR FULL DETAILS.** Non-Viability Contingent Capital (NVCC)Price Date = Feb-28-20171 - Distribution may consist of a combination of dividend, income and return of capital and therefore may not be entirely eligible for the dividend tax credit. Please consult a tax professional for further information.
Source: Bloomberg, FP Infomart Fixed‐Resets ‐ 18

CIBC Wood GundyFloating-Rate Preferred Shares PRIOR_CLOSE_MID
Shares O/S Price Dividend
Preferred Share Issue Symbol (millions) Par 28-Feb-17 Yield Dividend Dates Annual** Date Price Floating Rate Terms
Cumulative
Aimia Inc., Series 2 AIM.PR.B 2.9 Pfd-3L $25.00 $13.50 7.85% Mar 31/Jun 30/Sep 30/Dec 31 $1.06 31-Mar-2020 * $25.00 3M GoC T-Bill Yld +3.75%
AltaGas Ltd., Series B ALA.PR.B 2.5 Pfd-3 * $25.00 $18.25 4.32% Mar 31/Jun 30/Sep 30/Dec 31 $0.79 01-Apr-2020 * $25.00 3M GoC T-Bill Yld +2.66%
Atlantic Power Preferred Equity Ltd., Series 3 AZP.PR.C 1.7 NR $25.00 $16.18 7.22% Mar 31/Jun 30/Sep 30/Dec 31 $1.17 31-Dec-2019 * $25.00 3M GoC T-Bill Yld +4.18%
BCE Inc., Series AB BCE.PR.B 9.9 Pfd-3 $25.00 $17.01 3.97% Monthly -12 $0.68 Anytime $25.50 Floor (50% of Prime)/Ceiling (100% of Prime)
BCE Inc., Series S BCE.PR.S 3.6 Pfd-3 $25.00 $17.02 3.97% Monthly -12 $0.68 Anytime $25.50 Floor (50% of Prime)/Ceiling (100% of Prime)
BCE Inc., Series Y BCE.PR.Y 8.8 Pfd-3 $25.00 $17.02 3.97% Monthly -12 $0.68 Anytime $25.50 Floor (50% of Prime)/Ceiling (100% of Prime)
BCE Inc., Series AE BCE.PR.E 9.3 Pfd-3 $25.00 $16.96 3.98% Monthly -12 $0.68 Anytime $25.50 Floor (50% of Prime)/Ceiling (100% of Prime)
BCE Inc., Series AH BCE.PR.H 9.0 Pfd-3 $25.00 $17.00 3.97% Monthly -12 $0.68 Anytime $25.50 Floor (50% of Prime)/Ceiling (100% of Prime)
BCE Inc., Series AJ BCE.PR.J 8.1 Pfd-3 $25.00 $17.00 3.97% Monthly -12 $0.68 Anytime $25.50 Floor (50% of Prime)/Ceiling (100% of Prime)
BCE Inc., Series AD BCE.PR.D 14.9 Pfd-3 $25.00 $17.01 3.97% Monthly -12 $0.68 Anytime $25.50 Floor (50% of Prime)/Ceiling (100% of Prime)
BCE Inc., Series AL BCE.PR.L 2.3 Pfd-3 $25.00 $17.40 3.41% Mar 31/Jun 30/Sep 30/Dec 31 $0.59 Anytime $25.50 3M GoC T-Bill Yld +1.88%
BCE Inc., Series AN BCE.PR.N 2.0 Pfd-3 $25.00 $16.50 3.91% Mar 31/Jun 30/Sept 30/Dec 31 $0.65 Anytime $25.00 3M GoC T-Bill Yld +2.09%
Bombardier Inc., Series 2 BBD.PR.B 9.7 NR $25.00 $9.09 7.43% Monthly -15 $0.68 Anytime $25.50 Floor (50% of Prime)/Ceiling (100% of Prime)
Brookfield Office Properties Inc., Series V BPO.PR.X 1.8 Pfd-3 $25.00 $11.50 4.11% Feb 14/May 14/Aug 14/Nov 14 $0.47 Anytime $25.00 70% of Prime x $25.00
Brookfield Office Properties Inc., Series W BPO.PR.W 3.8 Pfd-3 $25.00 $12.90 3.66% Feb 14/May 14/Aug 14/Nov 14 $0.47 Anytime $25.00 70% of Prime x $25.00
Brookfield Office Properties Inc., Series Y BPO.PR.Y 2.8 Pfd-3 $25.00 $12.90 3.66% Feb 14/May 14/Aug 14/Nov 14 $0.47 Anytime $25.00 70% of Prime x $25.00
Brookfield Office Properties Inc., Series S BPO.PR.S 1.1 Pfd-3 $25.00 $20.50 4.84% Mar 31/Jun 30/Sep 30/Dec 31 $0.99 30-Sep-2021 * $25.00 3M GoC T-Bill Yld +3.48%
Brookfield Asset Mgmt. Inc., Series 13 BAM.PR.K 10.0 Pfd-2L $25.00 $12.29 3.84% Mar 31/Jun 30/Sep 30/Dec 31 $0.47 Anytime $25.00 70% of Prime x $25.00
Brookfield Asset Mgmt. Inc., Series 2 BAM.PR.B 9.8 Pfd-2L $25.00 $12.37 3.82% Mar 31/Jun 30/Sep 30/Dec 31 $0.47 Anytime $25.00 70% of Prime x $25.00
Brookfield Asset Mgmt. Inc., Series 4 BAM.PR.C 4.0 Pfd-2L $25.00 $12.40 3.81% Mar 31/Jun 30/Sep 30/Dec 31 $0.47 Anytime $25.00 70% of Prime x $25.00
Brookfield Asset Mgmt. Inc., Series 8 BAM.PR.E 2.5 Pfd-2L $25.00 $17.20 3.92% Monthly -12 $0.68 Anytime $25.50 Floor (50% of Prime)/Ceiling (100% of Prime)
Brookfield Asset Mgmt. Inc., Series 25 BAM.PR.S 1.5 Pfd-2L $25.00 $18.90 3.69% Mar 31/Jun 30/Sep 30/Dec 31 $0.70 Anytime $25.00 3M GoC T-Bill Yld +2.30%
Brookfield Renewable Power, Series 2 BRF.PR.B 4.5 Pfd-3H $25.00 $18.64 4.17% Jan 31/Apr 30/July 31/Oct 31 $0.78 30-Apr-2020 * $25.00 3M GoC T-Bill Yld +2.62%
Dundee Corp., Series 3 DC.PR.D 1.7 NR $25.00 $14.00 8.20% Mar 31/Jun 30/Sep 30/Dec 31 $1.15 30-Sep-2019 * $25.00 3M GoC T-Bill Yld +4.10%
Emera Inc, Series B EMA.PR.B 2.1 NR $25.00 $14.87 3.92% Feb 15/May 15/Aug 15/Nov 15 $0.58 15-Aug-2020 * $25.00 3M GoC T-Bill Yld +1.84%
Fairfax Financial Holdings Ltd., Series D FFH.PR.D 4.0 Pfd-3 $25.00 $20.19 4.51% Mar 31/Jun 30/Sep 30/Dec 31 $0.91 31-Dec-2019 * $25.00 3M GoC T-Bill Yld +3.15%
Fairfax Financial Holdings Ltd., Series F FFH.PR.F 3.6 Pfd-3 $25.00 $15.10 4.39% Mar 31/Jun 30/Sep 30/Dec 31 $0.66 31-Mar-2020 * $25.00 3M GoC T-Bill Yld +2.16%
Fairfax Financial Holdings Ltd., Series H FFH.PR.H 2.6 Pfd-3 $25.00 $17.75 4.30% Mar 31/Jun 30/Sep 30/Dec 31 $0.76 01-Apr-2020 * $25.00 3M GoC T-Bill Yld +2.56%
Fairfax Financial Holdings Ltd., Series J FFH.PR.J 1.5 Pfd-3 $25.00 $18.20 4.59% Mar 31/Jun 30/Sep 30/Dec 31 $0.84 31-Dec-2020 * $25.00 3M GoC T-Bill Yld +2.85%
First National Financial Corp., Series 2 FN.PR.B 1.1 NR $25.00 $14.25 4.49% Mar 31/Jun 30/Sept 30/Dec 31 $0.64 01-Jan-2021 * $25.00 3M GoC T-Bill Yld +2.07%
Fortis Inc. Series I FTS.PR.I 3.0 Pfd-3H $25.00 $14.25 3.40% Mar 1/Jun 1/Sep 1/Dec 1 $0.49 30-Jun-2020 * $25.00 3M GoC T-Bill Yld +1.45%
Rating DBRS
Call
Source: Bloomberg, FP Infomart Floating‐Rates ‐ 19

CIBC Wood GundyFloating-Rate Preferred Shares PRIOR_CLOSE_MID
Shares O/S Price Dividend
Preferred Share Issue Symbol (millions) Par 28-Feb-17 Yield Dividend Dates Annual** Date Price Floating Rate TermsRating DBRS
Call
GMP Capital Inc., Series C GMP.PR.C 1.0 Pfd-4H $25.00 $13.04 6.48% Mar 31/Jun 30/Sept 30/Dec 31 $0.85 01-Jul-2020 * $25.00 3M GoC T-Bill Yld +2.89%
Husky Energy Inc., Series 2 HSE.PR.B 1.6 Pfd-2L $25.00 $15.20 3.65% Mar 31/Jun 30/Sept 30/Dec 31 $0.56 01-Jul-2020 * $25.00 3M GoC T-Bill Yld +1.73%
Intact Financial Corp., Series 4 IFC.PR.D 1.6 Pfd-2 $25.00 $21.70 3.63% Mar 31/Jun 30/Sep 30/Dec 31 $0.79 30-Sep-2021 * $25.00 3M GoC T-Bill Yld +2.66%
Northland Power Inc., Series 2 NPI.PR.B 1.5 NR $25.00 $18.53 4.44% Mar 31/Jun 30/Sep 30/Dec 31 $0.82 01-Jul-2020 * $25.00 3M GoC T-Bill Yld +2.80%
Power Corp of Canada 1st Pfd 1986 Ser POW.PR.F 0.4 Pfd-2 $50.00 $34.75 2.72% Jan 15/Apr 15/Jul 15/Oct 15 $0.95 Anytime $50.00 70% of Prime x $50.00
Power Financial Corp., Series A PWF.PR.A 4.0 Pfd-2H $25.00 $15.00 3.15% Feb 15/May 15/Aug 15/Nov 15 $0.47 Anytime $25.00 70% of Prime x $25.00
Shaw Communications Inc., Series B SJR.PR.B 2.0 Pfd-3L $25.00 $16.66 3.74% Mar 31/Jun 30/Sep 30/Dec 31 $0.62 Anytime $25.50 3M GoC T-Bill Yld +2.00%
Thomson Reuters Corp., Series II TRI.PR.B 6.0 Pfd-3H $25.00 $13.95 3.39% Mar 31/Jun 30/Sep 30/Dec 31 $0.47 Anytime $25.00 70% of Prime x $25.00
TransAlta Corp., Series B TA.PR.E 1.8 NR $25.00 $12.95 4.86% Mar 31/Jun 30/Sept 30/Dec 31 $0.63 Anytime $25.00 3M GoC T-Bill Yld +2.03%
TransCanada Corp., Series 2 TRP.PR.F 12.5 Pfd-2L * $25.00 $17.75 3.39% Mar 31/Jun 30/Sep 30/Dec 31 $0.60 31-Dec-2019 * $25.00 3M GoC T-Bill Yld +1.92%
TransCanada Corp., Series 4 TRP.PR.H 5.5 Pfd-2L * $25.00 $13.10 3.38% Mar 31/Jun 30/Sep 30/Dec 31 $0.44 30-Jun-2020 * $25.00 3M GoC T-Bill Yld +1.28%
TransCanada Corp., Series 6 TRP.PR.I 1.3 Pfd-2L * $25.00 $14.75 3.44% Jan 30/Apr 30/Jul 30/Oct 30 $0.51 30-Jan-2021 * $25.00 3M GoC T-Bill Yld +1.54%
Non-Cumulative
Bank of Montreal, Series 17 BMO.PR.R 5.7 Pfd-2H $25.00 $23.99 2.23% Feb 25/May 25/Aug 25/Nov 25 $0.54 25-Aug-2018 * $25.00 3M GoC T-Bill Yld +1.65%
Bank of Montreal, Series 26 BMO.PR.A 2.2 Pfd-2H $25.00 $20.82 1.97% Feb 25/May 25/Aug 25/Nov 25 $0.41 25-Aug-2021 * $25.00 3M GoC T-Bill Yld +1.15%
Bank of Nova Scotia, Series 19 BNS.PR.A 6.3 Pfd-2H $25.00 $24.26 2.62% Jan 28/Apr 28/Jul 28/Oct 28 $0.64 26-Apr-2018 * $25.00 3M GoC T-Bill Yld +2.05%
Bank of Nova Scotia, Series 21 BNS.PR.B 6.0 Pfd-2H $25.00 $23.82 2.30% Jan 28/Apr 28/Jul 28/Oct 28 $0.55 26-Oct-2018 * $25.00 3M GoC T-Bill Yld +1.70%
Bank of Nova Scotia, Series 23 BNS.PR.C 2.6 Pfd-2H $25.00 $23.91 2.48% Jan 28/Apr 28/Jul 28/Oct 28 $0.59 26-Jan-2019 * $25.00 3M GoC T-Bill Yld +1.88%
Bank of Nova Scotia, Series 31 BNS.PR.D 4.5 Pfd-2H $25.00 $21.36 1.74% Jan 31/Apr 30/July 31/Oct 31 $0.37 26-Apr-2020 * $25.00 3M GoC T-Bill Yld +1.00%
Bank of Nova Scotia, Series 33 BNS.PR.F 5.2 Pfd-2H $25.00 $21.48 2.13% Jan 31/Apr 30/Jul 31/Oct 31 $0.46 02-Feb-2021 * $26.00 3M GoC T-Bill Yld +1.34%
Great-West Lifeco Inc., Series O GWO.PR.O 1.5 NR $25.00 $15.25 2.93% Mar 31/June 30/Sep 30/Dec 31 $0.45 31-Dec-2020 * $25.00 3M GoC T-Bill Yld +1.30%
Manulife Financial Corp., Series 4 MFC.PR.P 1.7 Pfd-2 $25.00 $14.20 3.35% Mar 19/Jun 19/Sep 19/Dec 19 $0.48 19-Jun-2021 * $25.00 3M GoC T-Bill Yld +1.41%
Royal Bank of Canada, Series AK RY.PR.K 2.4 Pfd-2 $25.00 $23.85 2.54% Feb 24/May 24/Aug 24/Nov 24 $0.61 24-Feb-2019 * $25.00 3M GoC T-Bill Yld +1.93%
Sun Life Financial, Series 9QR SLF.PR.J 6.0 Pfd-2 $25.00 $15.16 3.13% Mar 31/Jun 30/Sep 30/Dec 31 $0.48 30-Jun-2020 * $25.00 3M GoC T-Bill Yld +1.41%
Source: Bloomberg, FP Infomart Floating‐Rates ‐ 20
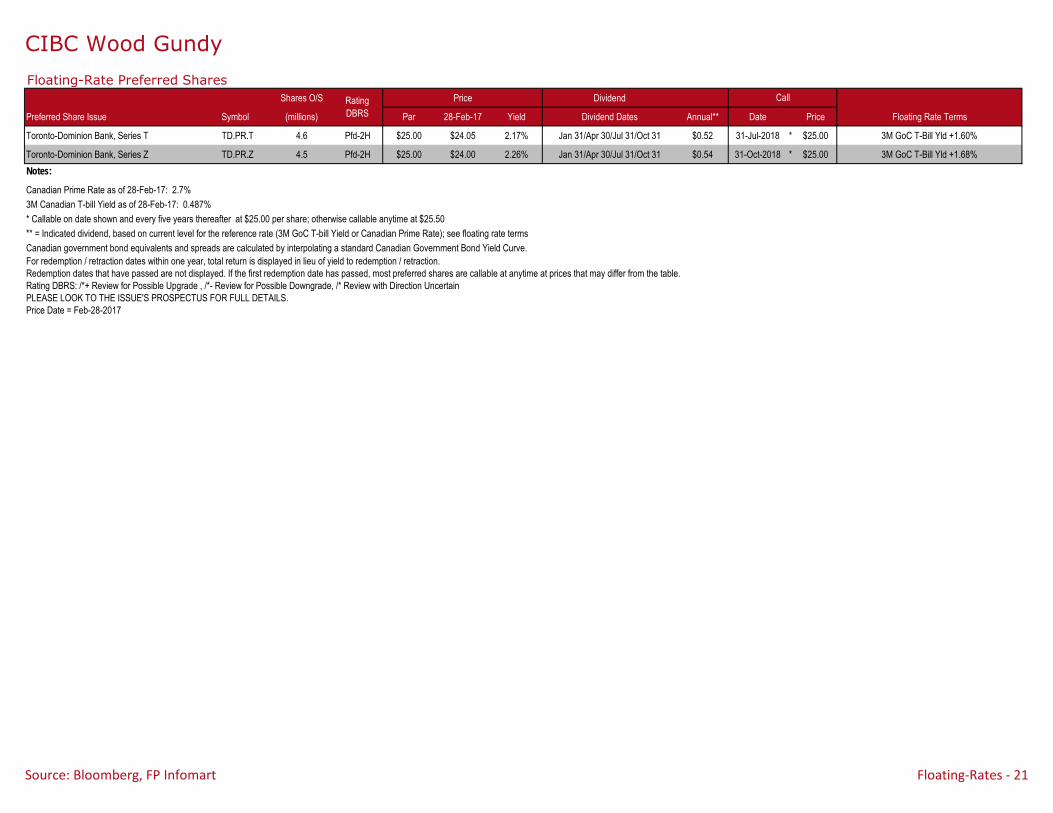
CIBC Wood GundyFloating-Rate Preferred Shares PRIOR_CLOSE_MID
Shares O/S Price Dividend
Preferred Share Issue Symbol (millions) Par 28-Feb-17 Yield Dividend Dates Annual** Date Price Floating Rate TermsRating DBRS
Call
Toronto-Dominion Bank, Series T TD.PR.T 4.6 Pfd-2H $25.00 $24.05 2.17% Jan 31/Apr 30/Jul 31/Oct 31 $0.52 31-Jul-2018 * $25.00 3M GoC T-Bill Yld +1.60%
Toronto-Dominion Bank, Series Z TD.PR.Z 4.5 Pfd-2H $25.00 $24.00 2.26% Jan 31/Apr 30/Jul 31/Oct 31 $0.54 31-Oct-2018 * $25.00 3M GoC T-Bill Yld +1.68%Notes:
Canadian Prime Rate as of 28-Feb-17: 2.7%3M Canadian T-bill Yield as of 28-Feb-17: 0.487%* Callable on date shown and every five years thereafter at $25.00 per share; otherwise callable anytime at $25.50** = Indicated dividend, based on current level for the reference rate (3M GoC T-bill Yield or Canadian Prime Rate); see floating rate termsCanadian government bond equivalents and spreads are calculated by interpolating a standard Canadian Government Bond Yield Curve.For redemption / retraction dates within one year, total return is displayed in lieu of yield to redemption / retraction.Redemption dates that have passed are not displayed. If the first redemption date has passed, most preferred shares are callable at anytime at prices that may differ from the table.Rating DBRS: /*+ Review for Possible Upgrade , /*- Review for Possible Downgrade, /* Review with Direction UncertainPLEASE LOOK TO THE ISSUE'S PROSPECTUS FOR FULL DETAILS.Price Date = Feb-28-2017
Source: Bloomberg, FP Infomart Floating‐Rates ‐ 21

CIBC Wood GundyUS$ Pay Canadian Preferred Shares PRIOR_CLOSE_MID
Shares O/S Price Dividend
Preferred Share Issue Symbol (millions) Par 28-Feb-17 Yield Dividend Dates Annual Date Price Yield to Yield Spread
Fixed Reset
AltaGas Ltd. 4.40%, Series C ALA.PR.U 8.0 Pfd-3 * $25.00 $24.06 4.57% Mar 31/Jun 30/Sep 30/Dec 31 $1.10 30-Sep-2017 $25.00 7.33% NA NA 5YR USG Yld +3.58%
Enbridge Inc. 4.00%, Series J ENB.PR.U 8.0 Pfd-3H $25.00 $22.90 4.37% Mar 1/Jun 1/Sep 1/Dec 1 $1.00 1-Jun-2017 $25.00 10.26% NA NA 5YR USG Yld +3.05%
Enbridge Inc. 4.00%, Series L ENB.PF.U 16.0 Pfd-3H $25.00 $22.91 4.36% Mar 1/Jun 1/Sep 1/Dec 1 $1.00 1-Sep-2017 $25.00 11.31% NA NA 5YR USG Yld +3.15%
Enbridge Inc. 4.00%,, Series 1 ENB.PR.V 16.0 Pfd-3H $25.00 $22.90 4.37% Mar 1/Jun 1/Sep 1/Dec 1 $1.00 1-Jun-2018 $25.00 11.35% 0.95% 10.40% 5YR USG Yld +3.14%
Enbridge Inc. 4.40%, Series 5 ENB.PF.V 8.0 Pfd-3H $25.00 $22.40 4.91% Mar 1/Jun 1/Sep 1/Dec 1 $1.10 1-Mar-2019 $25.00 10.24% 1.26% 8.98% 5YR USG Yld +2.82%
Preferred Securities 1
Artis REIT 5.25%, Series C AX.PR.U 3.0 Pfd-3L $25.00 $23.59 5.56% Mar 31/Jun 30/Sep 30/Dec 31 $1.31 1-Mar-2018 $25.00 12.34% 0.85% 11.50% 5YR USG Yld +4.46%
Soft-Retractables: Cumulative
Brookfield Office Properties Inc. 5.25%, Series G BPO.PR.U 3.4 Pfd-3 $25.00 $25.31 5.19% Mar 31/Jun 30/Sep 30/Dec 31 $1.31 Anytime *** $25.00 NA NA NA
Structured Preferred Shares - With Possible Early Redemption Dates
Brookfield Property Split Corp., Series 1 BPS.PR.U 1.0 NR $25.00 $25.40 5.17% Mar 31/Jun 30/Sep 30/Dec 31 $1.31 Anytime *** $25.00 NA NA NANotes:US government bond equivalents and spreads are calculated by interpolating a standard US Government Bond Yield Curve.For redemption / retraction dates within one year, total return is displayed in lieu of yield to redemption / retraction.Redemption dates that have passed are not displayed. If the first redemption date has passed, most preferred shares are callable at anytime at prices that may differ from the table.Rating DBRS: /*+ Review for Possible Upgrade , /*- Review for Possible Downgrade, /* Review with Direction UncertainPLEASE LOOK TO THE ISSUE'S PROSPECTUS FOR FULL DETAILS.Price Date = Feb-28-20171 - Distribution may consist of a combination dividend, income and return of capital and therefore may not be entirely eligible for the dividend tax credit. Please consult a tax professional for further information.
U.S Govt - EquivalentCall / Retraction***Rating DBRS Terms of Reset
Source: Bloomberg, FP Infomart $US Pay Canadian ‐ 22

CIBC Wood GundyStructured Preferred Shares - With Possible Early Redemption Dates
Shares O/S Price
Preferred Share Issue Symbol (millions) Par 28-Feb-17 Yield Dividend Dates Annual** Date Approx Price * Yield to Yield Spread
AllBanc Split Corp. 4.00%, Series 1 ABK.PR.C 0.6 Pfd-2 $31.64 $31.86 3.97% Mar 10/Jun 10/Sep 10/Dec 10 $1.27 Annual $31.64 NA NA NA
9-Mar-2018 *** $31.64 3.23% 0.60% 2.63%
Partners Value Split Corp. 4.35%, Series 3 PVS.PR.B 7.6 Pfd-2L $25.00 $25.09 4.33% Mar 7/Jun 7/Sep 7/Dec 7 $1.09 Anytime $25.50 NA NA NA
10-Jan-2018 $25.25 4.29% NA NA
10-Jan-2019 *** $25.00 4.12% 0.74% 3.38%
Partners Value Split Corp. 4.85%, Series 5 PVS.PR.C 5.0 Pfd-2L $25.00 $25.14 4.82% Mar 7/Jun 7/Sep 7/Dec 7 $1.21 Anytime $25.25 NA NA NA
10-Dec-2017 *** $25.00 3.10% NA NA
Partners Value Split Corp. 4.50%, Series 6 PVS.PR.D 8.0 Pfd-2L $25.00 $25.10 4.48% Mar 7/Jun 7/Sep 7/Dec 7 $1.13 Anytime $26.00 NA NA NA
8-Oct-2019 $25.50 5.04% 0.82% 4.22%
8-Oct-2020 $25.25 4.62% 0.95% 3.67%
8-Oct-2021 *** $25.00 4.39% 1.07% 3.32%
Brookfield Property Split Corp. 5.75%, Series 2 BPS.PR.A 1.0 NR $25.00 $25.32 5.68% Mar 31/Jun 30/Sep 30/Dec 31 $1.44 Anytime $25.00 NA NA NA
Brookfield Property Split Corp. 5.00%, Series 3 BPS.PR.B 1.0 NR $25.00 $25.27 4.95% Mar 31/Jun 30/Sep 30/Dec 31 $1.25 Anytime $25.00 NA NA NA
Brookfield Property Split Corp. 5.25%, Series 4 BPS.PR.C 1.0 NR $25.00 $25.29 5.14% Mar 31/Jun 30/Sep 30/Dec 31 $1.30 Anytime $25.00 NA NA NA
Big 8 Split Inc. 5.75%, Series 1 BIG.PR.D 1.7 Pfd-2 $10.00 $11.00 4.09% Mar 15/Jun 15/Sep 15/Dec 15 $0.45 Annual $10.00 NA NA NA
15-Dec-2018 *** $10.00 -1.12% 0.73% -1.85%
Global Champions Split Corp., Series 1 GCS.PR.A 2.0 Pfd-2 $25.00 $25.11 3.98% Jan 15/Apr 15/Jul 15/Oct 15 $1.00 Anytime $26.00 NA NA NA
31-Jul-2017 $25.50 3.70% NA NA
31-Jul-2018 $25.25 4.75% 0.67% 4.08%
31-Jul-2019 *** $25.00 4.04% 0.80% 3.24%
Newgrowth Corp. 4.15%, Series 3 NEW.PR.D 1.8 Pfd-2 $32.07 $32.53 4.09% Mar 26/Jun 26/Sep 26/Dec 26 $1.33 Annual $32.07 NA NA NA
26-Jul-2019 *** $32.07 3.86% 0.80% 3.06%
R SPLIT III Corp. 4.25%, Series 1 RBS.PR.B 0.4 Pfd-2 $13.60 $13.76 4.20% Feb 28/May 31/Aug 31/Nov 30 $0.58 Annual $13.60 NA NA NA
31-May-2017 *** $13.60 -0.10% NA NANotes:* = Approximate redemption / retraction values; ** = Dividends are subject to change on a monthly basis; *** = Mandatory Redemption, Approximate redemption / retraction valuesAnnual* = Possible early redemption dates are on a annual basis back from the mandatory redemption datesCanadian government bond equivalents and spreads are calculated by interpolating a standard Canadian Government Bond Yield Curve.For redemption / retraction dates within one year, total return is displayed in lieu of yield to redemption / retraction.Redemption dates that have passed are not displayed. If the first redemption date has passed, most preferred shares are callable at anytime at prices that may differ from the table.Rating DBRS: /*+ Review for Possible Upgrade , /*- Review for Possible Downgrade, /* Review with Direction UncertainPLEASE LOOK TO THE ISSUE'S PROSPECTUS FOR FULL DETAILS.Price Date = Feb-28-2017
Possible Early Redemption / Mandatory*** Can Govt - EquivalentRating DBRS
Dividend
Source: Bloomberg, FP Infomart Structured Preferred Shares ‐ Possible Early Redemption Dates ‐ 23

CIBC Wood GundyStructured Preferred Shares - With No Early Redemption Dates
Shares O/S Price
Preferred Share Issue Symbol (millions) Par 28-Feb-17 Yield Dividend Dates Annual** Dates Approx Price * Yield to Yield Spread
Brompton Lifeco Split Corp. 5.75% LCS.PR.A 3.1 Pfd-4H $10.00 $10.22 5.63% Feb 15/May 15/Aug 15/Nov 15 $0.58 29-Apr-2019 $10.00 4.80% 0.78% 4.02%
Brompton Split Banc Corp. 4.50% SBC.PR.A 7.4 Pfd-3H $10.00 $10.18 4.42% Jan 15/Apr 15/Jul 15/Oct 15 $0.45 29-Nov-2017 $10.00 2.08% NA NA
Canadian Banc Corp. BK.PR.A 12.8 Pfd-3H $10.00 $10.33 4.84% Monthly -10 $0.50 1-Dec-2018 $10.00 3.02% 0.72% 2.30%
Canadian Life Companies Split Corp. 6.25% LFE.PR.B 7.8 NR $10.00 $10.38 6.02% Monthly -10 $0.62 1-Dec-2018 $10.00 3.91% 0.72% 3.18%
Dividend 15 Split Corp. 5.25% DFN.PR.A 29.3 Pfd-3 $10.00 $10.28 5.11% Monthly -10 $0.53 1-Dec-2019 $10.00 4.12% 0.83% 3.29%
Dividend 15 Split Corp. II 5.25% DF.PR.A 10.7 Pfd-3L $10.00 $10.20 5.15% Monthly -31 $0.53 1-Dec-2019 $10.00 4.47% 0.83% 3.64%
Dividend Growth Split Corp. 5.25% DGS.PR.A 21.9 Pfd-3 $10.00 $10.23 5.13% Mar 15/Jun 15/Sep 15/Dec 15 $0.53 28-Nov-2019 $10.00 4.29% 0.83% 3.46%
Financial 15 Split Corp. 5.25% FTN.PR.A 22.4 Pfd-4H $10.00 $10.13 5.18% Monthly -10 $0.53 1-Dec-2020 $10.00 4.84% 0.97% 3.86%
Financial 15 Split Corp. II 5.25% FFN.PR.A 8.9 Pfd-4H $10.00 $10.18 5.16% Monthly - 10 $0.53 1-Dec-2019 $10.00 4.51% 0.83% 3.67%
Global Resource Champions Split Corp. 6.25%, Series 1 GRP.PR.A 1.8 Pfd-2L $25.00 $25.75 6.07% Mar 31/Jun 30/Sep 30/Dec 31 $1.56 25-May-2023 $25.00 5.88% 1.30% 4.57%
Life & Banc Split Corp. 4.75% LBS.PR.A 16.4 Pfd-3 $10.00 $10.25 4.63% Jan 15/Apr 15/Jul 15/Oct 15 $0.48 29-Nov-2018 $10.00 3.63% 0.72% 2.91%
M Split Corp. 7.50%, Class I XMF.PR.B 2.8 NR $5.00 $5.40 6.94% Monthly -10 $0.38 1-Dec-2019 $5.00 4.33% 0.83% 3.50%
M Split Corp., Class II XMF.PR.C 2.8 NR $5.00 $2.60 NA Suspended NA 1-Dec-2019 $5.00 NA NA NA
New Commerce Split Corp. 7.50%, Class I YCM.PR.A 2.8 NR $5.00 $5.22 5.75% Monthly -10 $0.30 1-Dec-2019 $5.00 4.24% 0.83% 3.41%
New Commerce Split Corp., Class II YCM.PR.B 2.8 NR $5.00 $5.23 7.17% Monthly -10 $0.38 1-Dec-2019 $5.00 5.62% 0.83% 4.79%
Premium Income Corp 5.75% PIC.PR.A 9.7 NR $15.00 $15.32 5.63% Jan 31/Apr 30/Jul 31/Oct 31 $0.86 1-Nov-2017 $15.00 2.14% NA NA
Prime Dividend Corp., Floating Rate PDV.PR.A 1.4 Pfd-3H $10.00 $10.21 4.90% Monthly -10 $0.50 1-Dec-2018 $10.00 3.69% 0.72% 2.97%
S Split Corp. 5.25% SBN.PR.A 5.7 Pfd-3 $10.00 $11.31 4.64% Monthly -31 $0.53 31-Dec-2021 $10.00 2.37% 1.09% 1.28%
TDb Split Corp. 5.25% XTD.PR.A 3.4 NR $10.00 $10.20 5.15% Monthly -10 $0.53 1-Dec-2019 $10.00 4.43% 0.83% 3.60%
U.S. Financial 15 Split Corp. 5.25% FTU.PR.B 3.1 NR $10.00 $8.50 5.18% Monthly - 10 $0.44 1-Dec-2018 $10.00 14.20% 0.72% 13.48%
World Financial Split Corp. 5.25% WFS.PR.A 2.4 NR $10.00 $10.22 5.14% Mar 31/Jun 30/Sep 30/Dec 31 $0.53 30-Jun-2018 $10.00 4.24% 0.65% 3.59%
* = Approximate redemption values** = Dividends are subject to change on a monthly basisCanadian government bond equivalents and spreads are calculated by interpolating a standard Canadian Government Bond Yield Curve.For redemption dates within one year, total return is displayed in lieu of yield to redemption.Redemption dates that have passed are not displayed. If the first redemption date has passed, most preferred shares are callable at anytime at prices that may differ from the table.Rating DBRS: /*+ Review for Possible Upgrade , /*- Review for Possible Downgrade, /* Review with Direction UncertainPLEASE LOOK TO THE ISSUE'S PROSPECTUS FOR FULL DETAILS.Price Date = Feb-28-2017
Can Govt - EquivalentRedemption / Retraction***Rating DBRS
Dividend
Source: Bloomberg, FP InfomartStructured Preferred Shares ‐
No Early Redemption Dates ‐ 24

Index Of Preferred Shares A Bank of Nova Scotia 3.85%, Series 30 BNS.PR.Y 16 Brookfield Asset Mgmt Inc. 4.75%, Series 18 BAM.PR.N 7
Aimia Inc. 6.50%, Series 1 AIM.PR.A 13 Bank of Nova Scotia, Series 31 BNS.PR.D 20 Brookfield Asset Mgmt Inc. 3.01%, Series 24 BAM.PR.R 13Aimia Inc., Series 2 AIM.PR.B 19 Bank of Nova Scotia 1.84%, Series 32 BNS.PR.Z 16 Brookfield Asset Mgmt Inc., Series 25 BAM.PR.S 19Aimia Inc. 6.25%, Series 3 AIM.PR.C 13 Bank of Nova Scotia, Series 33 BNS.PR.F 20 Brookfield Asset Mgmt Inc. 4.50%, Series 26 BAM.PR.T 13Algonquin Power & Utilities 4.50%, Series A AQN.PR.A 13 Bank of Nova Scotia 5.50%, Series 34 BNS.PR.E 16 Brookfield Asset Mgmt Inc. 4.60%, Series 28 BAM.PR.X 13Algonquin Power & Utilities 5.00%, Series D AQN.PR.D 13 Bank of Nova Scotia 5.50%, Series 36 BNS.PR.G 16 Brookfield Asset Mgmt Inc. 4.80%, Series 30 BAM.PR.Z 13Allbanc Split Corp. 4.00% ABK.PR.C 23 Bank of Nova Scotia 4.85%, Series 38 BNS.PR.H 16 Brookfield Asset Mgmt Inc. 4.50%, Series 32 BAM.PF.A 13AltaGas Ltd. 5.00%, Series A ALA.PR.A 13 BCE Inc. 4.80%, Series AA BCE.PR.A 13 Brookfield Asset Mgmt Inc. 4.20%, Series 34 BAM.PF.B 13AltaGas Ltd., Series B ALA.PR.B 19 BCE Inc., Series AB BCE.PR.B 19 Brookfield Asset Mgmt Inc. 4.85%, Series 36 BAM.PF.C 7AltaGas Ltd. 4.40%, Series C ($US) ALA.PR.U 22 BCE Inc. 5.54% Series AC BCE.PR.C 13 Brookfield Asset Mgmt Inc. 4.90%, Series 37 BAM.PF.D 7AltaGas Ltd. 5.00%, Series E ALA.PR.E 13 BCE Inc., Series AD BCE.PR.D 19 Brookfield Asset Mgmt Inc. 4.40%, Series 38 BAM.PF.E 13AltaGas Ltd. 4.75%, Series G ALA.PR.G 13 BCE Inc., Series AE BCE.PR.E 19 Brookfield Asset Mgmt Inc. 4.50%, Series 40 BAM.PF.F 13AltaGas Ltd. 5.25%, Series I ALA.PR.I 13 BCE Inc. 4.40%, Series AF BCE.PR.F 13 Brookfield Asset Mgmt Inc. 4.50%, Series 42 BAM.PF.G 13AltaGas Ltd. 5.00%, Series K ALA.PR.K 13 BCE Inc. 2.80%, Series AG BCE.PR.G 13 Brookfield Asset Mgmt Inc. 5.00%, Series 44 BAM.PF.H 13Atlantic Power Preferred Equity 4.85%, Series 1 AZP.PR.A 7 BCE Inc., Series AH BCE.PR.H 19 Brookfield Asset Mgmt Inc. 4.80%, Series 46 BAM.PF.I 13Atlantic Power Preferred Equity 7.00%, Series 2 AZP.PR.B 13 BCE Inc. 2.75%, Series AI BCE.PR.I 13 Brookfield Infrastructure Partners L.P. 4.50%, Series 1 BIP.PR.A 13Atlantic Power Preferred Equity, Series 3 AZP.PR.C 19 BCE Inc., Series AJ BCE.PR.J 19 Brookfield Infrastructure Partners L.P. 5.50%, Series 3 BIP.PR.B 18Artis REIT 5.25%, Series A AX.PR.A 18 BCE Inc. 4.15%, Series AK BCE.PR.K 13 Brookfield Infrastructure Partners L.P. 5.35%, Series 5 BIP.PR.C 18Artis REIT 5.25%, Series C ($US) AX.PR.U 22 BCE Inc. Floating Rate, Series AL BCE.PR.L 19 Brookfield Infrastructure Partners L.P. 5.00%, Series 7 BIP.PR.D 18Artis REIT 4.75%, Series E AX.PR.E 18 BCE Inc. 2.76%, Series AM BCE.PR.M 13 Brookfield Investments Corp. 4.70%, Series A BRN.PR.A 6Artis REIT 5.00%, Series G AX.PR.G 18 BCE Inc., Series AN BCE.PR.N 19 Brookfield Office Properties Inc. 4.75%, Series AA BPO.PR.A 13
BCE Inc. 4.55% Series AO BCE.PR.O 13 Brookfield Office Properties Inc. 6.00%, Series CC BPO.PR.C 13 B BCE Inc. 4.25%, Series AQ BCE.PR.Q 13 Brookfield Office Properties Inc. 5.10%, Series EE BPO.PR.E 13
Bank of Montreal 5.25%, Series 14 BMO.PR.K 9 BCE Inc. 4.13%, Series R BCE.PR.R 13 Brookfield Office Properties Inc. 5.25%, Series G ($US) BPO.PR.U 22Bank of Montreal 5.80%, Series 15 BMO.PR.L 9 BCE Inc., Series S BCE.PR.S 19 Brookfield Office Properties Inc. 5.00%, Series J BPO.PR.J 6Bank of Montreal 5.20%, Series 16 BMO.PR.M 16 BCE Inc. 4.502%, Series T BCE.PR.T 13 Brookfield Office Properties Inc. 5.20%, Series K BPO.PR.K 6Bank of Montreal, Series 17 BMO.PR.R 20 BCE Inc., Series Y BCE.PR.Y 19 Brookfield Office Properties Inc. 3.78%, Series N BPO.PR.N 14Bank of Montreal 1.81%, Series 25 BMO.PR.Q 16 BCE Inc. 4.331%, Series Z BCE.PR.Z 13 Brookfield Office Properties Inc. 5.15%, Series P BPO.PR.P 14Bank of Montreal, Series 26 BMO.PR.A 20 Big 8 Split Inc., Series 1 BIG.PR.D 23 Brookfield Office Properties Inc. 5.10%, Series R BPO.PR.R 14Bank of Montreal 4.00%, Series 27 BMO.PR.S 16 Birchcliff Energy Ltd. 8.00%, Series A BIR.PR.A 13 Brookfield Office Properties Inc., Series S BPO.PR.S 19Bank of Montreal 3.90%, Series 29 BMO.PR.T 16 Birchcliff Energy Ltd. 7.00%, Series C BIR.PR.C 6 Brookfield Office Properties Inc. 4.60%, Series T BPO.PR.T 14Bank of Montreal 3.80%, Series 31 BMO.PR.W 16 Bombardier Inc., Series 2 BBD.PR.B 19 Brookfield Office Properties Inc., Series W BPO.PR.W 19Bank of Montreal 3.80%, Series 33 BMO.PR.Y 16 Bombardier Inc. 5.476%, Series 3 BBD.PR.D 13 Brookfield Office Properties Inc., Series V BPO.PR.X 19Bank of Montreal 5.00%, Series 35 BMO.PR.Z 9 Bombardier Inc. 6.25%, Series 4 BBD.PR.C 7 Brookfield Office Properties Inc., Series Y BPO.PR.Y 19Bank of Montreal 4.85%, Series 38 BMO.PR.B 16 Brompton Lifeco Split Corp., 5.25% LCS.PR.A 24 Brookfield Property Split, Series 1 ($US) BPS.PR.U 22Bank of Nova Scotia 5.60%, Series 17 BNS.PR.O 9 Brompton Split Banc Corp., 5.25% SBC.PR.A 24 Brookfield Property Split, Series 2 BPS.PR.A 23Bank of Nova Scotia 5.00%, Series 18 BNS.PR.P 16 Brookfield Asset Mgmt Inc., Series 2 BAM.PR.B 19 Brookfield Property Split, Series 3 BPS.PR.B 23Bank of Nova Scotia, Series 19 BNS.PR.A 20 Brookfield Asset Mgmt Inc., Series 4 BAM.PR.C 19 Brookfield Property Split, Series 4 BPS.PR.C 23Bank of Nova Scotia 5.00%, Series 20 BNS.PR.Q 16 Brookfield Asset Mgmt Inc., Series 8 BAM.PR.E 19 Brookfield Renewable Partners L.P. 5.59%, Series 5 BEP.PR.E 12Bank of Nova Scotia, Series 21 BNS.PR.B 20 Brookfield Asset Mgmt Inc. 4.35%, Series 9 BAM.PR.G 13 Brookfield Renewable Partners L.P. 5.50%, Series 7 BEP.PR.G 18Bank of Nova Scotia 5.00%, Series 22 BNS.PR.R 16 Brookfield Asset Mgmt Inc., Series 13 BAM.PR.K 19 Brookfield Renewable Partners L.P. 5.75%, Series 9 BEP.PR.I 18Bank of Nova Scotia, Series 23 BNS.PR.C 20 Brookfield Asset Mgmt Inc. 4.75%, Series 17 BAM.PR.M 7 Brookfield Renewable Partners L.P. 5.00%, Series 11 BEP.PR.K 18
25 February 2017

Brookfield Renewable Power Equity Inc. 5.25%, Series 1 BRF.PR.A 14 E-L Financial Corp. 5.50%, Series 3 ELF.PR.H 9 First National Financial Corp. 2.79%, Series 1 FN.PR.A 15Brookfield Renewable Power Equity Inc., Series 2 BRF.PR.B 19 Element Financial 6.60%, Series A EFN.PR.A 14 First National Financial Corp., Series 2 FN.PR.B 19Brookfield Renewable Power Equity Inc. 4.40%, Series 3 BRF.PR.C 14 Element Financial 6.50%, Series C EFN.PR.C 14 Fortis Inc. 4.90%, Series F FTS.PR.F 8Brookfield Renewable Power Equity Inc. 5.00%, Series 5 BRF.PR.E 7 Element Financial 6.40%, Series E EFN.PR.E 14 Fortis Inc. 5.25%, Series G FTS.PR.G 15Brookfield Renewable Power Equity Inc. 5.00%, Series 6 BRF.PR.F 7 Element Financial 6.50%, Series G EFN.PR.G 14 Fortis Inc. 4.25%, Series H FTS.PR.H 15
Emera Inc. 4.40%, Series A EMA.PR.A 14 Fortis Inc., Series I FTS.PR.I 19 C Emera Inc., Series B EMA.PR.B 19 Fortis Inc. 4.75%, Series J FTS.PR.J 8
Canaccord Financial 5.50%, Series A CF.PR.A 14 Emera Inc. 4.10%, Series C EMA.PR.C 14 Fortis Inc. 4.00%, Series K FTS.PR.K 15Canaccord Financial 5.75%, Series C CF.PR.C 14 Emera Inc. 4.50%, Series E EMA.PR.E 8 Fortis Inc. 4.10%, Series M FTS.PR.M 15Canadian Banc Recovery Corp. BK.PR.A 24 Emera Inc. 4.25%, Series F EMA.PR.F 14Canadian General Investments, Ltd. 3.75%, Series 4 CGI.PR.D 6 Empire Life Insurance 5.75%, Series 1 EML.PR.A 16 GCanadian Life Companies Split Corp. 6.25% LFE.PR.B 24 Enbridge Inc. 5.50%, Series A ENB.PR.A 8 George Weston Ltd. 5.80%, Series I WN.PR.A 8Canadian Utilities Ltd. 4.90%, Series AA CU.PR.D 7 Enbridge Inc. 4.00%, Series B ENB.PR.B 14 George Weston Ltd. 5.20%, Series III WN.PR.C 8Canadian Utilities Ltd. 4.90%, Series BB CU.PR.E 7 Enbridge Inc. 4.00%, Series D ENB.PR.D 14 George Weston Ltd. 5.20%, Series IV WN.PR.D 8Canadian Utilities Ltd. 4.50%, Series CC CU.PR.F 8 Enbridge Inc. 4.00%, Series F ENB.PR.F 14 George Weston Ltd. 4.75%, Series V WN.PR.E 8Canadian Utilities Ltd. 4.50%, Series DD CU.PR.G 8 Enbridge Inc. 4.00%, Series H ENB.PR.H 14 Global Champions Split Corp. 4.00%, Series 1 GCS.PR.A 23Canadian Utilities Ltd. 4.50%, Series FF CU.PR.I 14 Enbridge Inc. 4.00%, Series L ($US) ENB.PF.U 22 Global Resource Champion Split Corp. 6.25%, Series 1 GRP.PR.A 24Canadian Utilities Ltd. 4.00%, Series Y CU.PR.C 14 Enbridge Inc. 4.00%, Series J ($US) ENB.PR.U 22 GMP Capital 3.61%, Series B GMP.PR.B 15Canadian Western Bank 4.40%, Series 5 CWB.PR.B 16 Enbridge Inc. 4.00%, Series N ENB.PR.N 14 GMP Capital, Series C GMP.PR.C 19Canadian Western Bank 6.25%, Series 7 CWB.PR.C 16 Enbridge Inc. 4.00%, Series P ENB.PR.P 14 Great-West Lifeco Inc. 5.90%, Series F GWO.PR.F 9Capital Power Corp. 3.06%, Series 1 CPX.PR.A 14 Enbridge Inc. 4.00%, Series R ENB.PR.T 14 Great-West Lifeco Inc. 5.20%, Series G GWO.PR.G 9Capital Power Corp. 4.60%, Series 3 CPX.PR.C 14 Enbridge Inc. 4.00%, Series 1 ($US) ENB.PR.V 22 Great-West Lifeco Inc. 4.85%, Series H GWO.PR.H 9Capital Power Corp. 4.50%, Series 5 CPX.PR.E 14 Enbridge Inc. 4.00%, Series 3 ENB.PR.Y 14 Great-West Lifeco Inc. 4.50%, Series I GWO.PR.I 9Capital Power Corp. 6.00%, Series 7 CPX.PR.G 14 Enbridge Inc. 4.40%, Series 5 ($US) ENB.PF.V 22 Great-West Lifeco Inc. 5.65%, Series L GWO.PR.L 10Capstone Infrastructure Corp. 3.27%, Series A CSE.PR.A 14 Enbridge Inc. 4.40%, Series 7 ENB.PR.J 14 Great-West Lifeco Inc. 5.80%, Series M GWO.PR.M 10CIBC 3.90%, Series 39 CM.PR.O 16 Enbridge Inc. 4.40%, Series 9 ENB.PF.A 14 Great-West Lifeco Inc. 2.18%, Series N GWO.PR.N 16CIBC 3.75%, Series 41 CM.PR.P 16 Enbridge Inc. 4.40%, Series 11 ENB.PF.C 14 Great-West Lifeco Inc., Series O GWO.PR.O 20CIBC 3.60%, Series 43 CM.PR.Q 16 Enbridge Inc. 4.40%, Series 13 ENB.PF.E 14 Great-West Lifeco Inc. 5.40%, Series P GWO.PR.P 9Co-operators General Insurance Co. 5.00%, Series C CCS.PR.C 9 Enbridge Inc. 4.40%, Series 15 ENB.PF.G 14 Great-West Lifeco Inc. 5.15%, Series Q GWO.PR.Q 10CU Inc. 4.60%, Series 1 CIU.PR.A 8 Enbridge Inc. 5.15%, Series 17 ENB.PF.I 14 Great-West Lifeco Inc. 4.80%, Series R GWO.PR.R 10CU Inc. 2.24%, Series 4 CIU.PR.C 14 Equitable Group Inc. 7.25%, Series 1 EQB.PR.C 16 Great-West Lifeco Inc. 5.25%, Series S GWO.PR.S 9
D F HDividend 15 Split Corp. 5.25% DFN.PR.A 24 Fairfax Financial Holdings Ltd. 5.75%, Series C FFH.PR.C 15 HSBC Bank Canada 5.00%, Series D HSB.PR.D 10Dividend 15 Split Corp. II 5.25% DF.PR.A 24 Fairfax Financial Holdings Ltd., Series D FFH.PR.D 19 HSBC Bank Canada 5.10%, Series C HSB.PR.C 10Dividend Growth Split Corp. 5.25% DGS.PR.A 24 Fairfax Financial Holdings Ltd. 4.75%, Series E FFH.PR.E 14 Husky Energy Inc. 2.40%, Series 1 HSE.PR.A 15DREAM UnLtd. Corp. 7.00%, Series 1 DRM.PR.A 6 Fairfax Financial Holdings Ltd., Series F FFH.PR.F 19 Husky Energy Inc., Series 2 HSE.PR.B 20Dundee Corp. 7.50%, Series 5 DC.PR.E 6 Fairfax Financial Holdings Ltd. 5.00%, Series G FFH.PR.G 14 Husky Energy Inc. 4.50%, Series 3 HSE.PR.C 15Dundee Corp. 6.75%, Series 2 DC.PR.B 14 Fairfax Financial Holdings Ltd., Series H FFH.PR.H 19 Husky Energy Inc. 4.50%, Series 5 HSE.PR.E 15Dundee Corp. Floating, Series 3 DC.PR.D 19 Fairfax Financial Holdings Ltd. 3.71%, Series I FFH.PR.I 15 Husky Energy Inc. 4.60%, Series 7 HSE.PR.G 15
Fairfax Financial Holdings Ltd., Series J FFH.PR.J 19 I E Fairfax Financial Holdings Ltd. 5.00%, Series K FFH.PR.K 15 IGM Financial Inc. 5.90%, Series B IGM.PR.B 10
ECN Capital Corp. 6.50%, Series A ECN.PR.A 14 Fairfax Financial Holdings Ltd. 4.75%, Series M FFH.PR.M 15 Industrial Alliance 4.60%, Series B IAG.PR.A 10E-L Financial Corp. 5.30%, Series 1 ELF.PR.F 9 Financial 15 Split Corp. 5.25% FTN.PR.A 24 Industrial Alliance Insurance & Financial 4.30%, Series G IAG.PR.G 16E-L Financial Corp. 4.75%, Series 2 ELF.PR.G 9 Financial 15 Split Corp. II 5.25% FFN.PR.A 24 Innergex Renewable Energy Inc. 3.61%, Series A INE.PR.A 15
26 February 2017

Innergex Renewable Energy Inc. 5.75%, Series C INE.PR.C 8 P Royal Bank of Canada 4.45%, Series AF RY.PR.F 11Intact Financial Corp. 4.20%, Series 1 IFC.PR.A 16 Partners Value Split, Series 3 PVS.PR.B 23 Royal Bank of Canada 4.50%, Series AG RY.PR.G 11Intact Financial Corp. 4.20%, Series 3 IFC.PR.C 16 Partners Value Split, Series 5 PVS.PR.C 23 Royal Bank of Canada 5.00%, Series AJ RY.PR.I 17Intact Financial Corp., Series 4 IFC.PR.D 20 Partners Value Split, Series 6 PVS.PR.D 23 Royal Bank of Canada, Series AK RY.PR.K 20
L Pembina Pipeline Corp. 4.25%, Series 1 PPL.PR.A 15 Royal Bank of Canada 5.60%, Series AL RY.PR.L 17Laurentian Bank of Canada 4.00%, Series 11 LB.PR.F 16 Pembina Pipeline Corp. 4.70%, Series 3 PPL.PR.C 15 Royal Bank of Canada 4.00%, Series AZ RY.PR.Z 17Laurentian Bank of Canada 4.30%, Series 13 LB.PR.H 16 Pembina Pipeline Corp. 5.00%, Series 5 PPL.PR.E 15 Royal Bank of Canada 3.90%, Series BB RY.PR.H 17Laurentian Bank of Canada 5.85%, Series 15 LB.PR.J 16 Pembina Pipeline Corp. 4.05%, Series 7 PPL.PR.G 15 Royal Bank of Canada 3.60%, Series BD RY.PR.J 17Life & Banc Split Corp. 5.25% LBS.PR.A 24 Pembina Pipeline Corp. 4.75%, Series 9 PPL.PR.I 15 Royal Bank of Canada 3.60%, Series BF RY.PR.M 17Loblaw Companies Ltd. 5.30%, Series B L.PR.B 8 Pembina Pipeline Corp. 5.75%, Series 11 PPL.PR.K 15 Royal Bank of Canada 4.90%, Series BH RY.PR.N 11
Pembina Pipeline Corp. 5.75%, Series 13 PPL.PR.M 15 Royal Bank of Canada 4.90%, Series BI RY.PR.O 11 M Power Corp of Canada 5.60%, Series A POW.PR.A 10 Royal Bank of Canada 5.25%, Series BJ RY.PR.P 12
M Split Corp. 7.50%, Class I XMF.PR.B 24 Power Corp of Canada 5.35%, Series B POW.PR.B 10 Royal Bank of Canada 5.50%, Series BK RY.PR.Q 17M Split Corp. Class II XMF.PR.C 24 Power Corp of Canada 5.80%, Series C POW.PR.C 10 Royal Bank of Canada 5.50%, Series BM RY.PR.R 17Manulife Financial Corp. 4.65%, Series 2 MFC.PR.B 10 Power Corp of Canada 5.00%, Series D POW.PR.D 10 Royal Bank of Canada 4.90%, Series W RY.PR.W 12Manulife Financial Corp. 4.50%, Series 3 MFC.PR.C 10 Power Corp of Canada, Series F POW.PR.F 20Manulife Financial Corp. 2.18%, Series 3 MFC.PR.F 16 Power Corp of Canada 5.60%, Series G POW.PR.G 10 SManulife Financial Corp., Series 4 MFC.PR.P 20 Power Financial Corp., Series A PWF.PR.A 20 S Split Corp. 5.25% SBN.PR.A 24Manulife Financial Corp. 4.40%, Series 5 MFC.PR.G 16 Power Financial Corp 5.50%, Series D PWF.PR.E 10 Shaw Communications 2.79%, Series A SJR.PR.A 15Manulife Financial Corp. 4.60%, Series 7 MFC.PR.H 16 Power Financial Corp 5.25%, Series E PWF.PR.F 10 Shaw Communications, Series B SJR.PR.B 20Manulife Financial Corp. 4.40%, Series 9 MFC.PR.I 16 Power Financial Corp 5.90%, Series F PWF.PR.G 11 Sun Life Financial Inc. 4.75%, Series 1 SLF.PR.A 12Manulife Financial Corp. 4.00%, Series 11 MFC.PR.J 16 Power Financial Corp 5.75%, Series H PWF.PR.H 10 Sun Life Financial Inc. 4.80%, Series 2 SLF.PR.B 12Manulife Financial Corp. 3.80%, Series 13 MFC.PR.K 16 Power Financial Corp 6.00%, Series I PWF.PR.I 11 Sun Life Financial Inc. 4.45%, Series 3 SLF.PR.C 12Manulife Financial Corp. 3.90%, Series 15 MFC.PR.L 16 Power Financial Corp 4.95%, Series K PWF.PR.K 11 Sun Life Financial Inc. 4.45%, Series 4 SLF.PR.D 12Manulife Financial Corp. 3.90%, Series 17 MFC.PR.M 16 Power Financial Corp 5.10%, Series L PWF.PR.L 11 Sun Life Financial Inc. 4.50%, Series 5 SLF.PR.E 12Manulife Financial Corp. 3.80%, Series 19 MFC.PR.N 16 Power Financial Corp 5.80%, Series O PWF.PR.O 11 Sun Life Financial Inc. 4.35%, Series 8R SLF.PR.G 17Manulife Financial Corp. 5.60%, Series 21 MFC.PR.O 17 Power Financial Corp 2.10%, Series P PWF.PR.P 17 Sun Life Financial Inc. 3.90%, Series 10R SLF.PR.H 17Manulife Financial Corp. 4.85%, Series 23 MFC.PR.R 17 Power Financial Corp 5.50%, Series R PWF.PR.R 11 Sun Life Financial Inc. 4.25%, Series 12R SLF.PR.I 17
Power Financial Corp. 4.80%, Series S PWF.PR.S 11 Sun Life Financial Inc., Series 9QR SLF.PR.J 20 N Power Financial Corp. 4.20%, Series T PWF.PR.T 17
National Bank of Canada 3.80%, Series 28 NA.PR.Q 17 Premium Income Corp. 5.75% PIC.PR.A 24 TNational Bank of Canada 4.10%, Series 30 NA.PR.S 17 Prime Dividend Corp. PDV.PR.A 24 TD Bank 3.90%, Series 1 TD.PF.A 17National Bank of Canada 3.90%, Series 32 NA.PR.W 17 TD Bank 3.80%, Series 3 TD.PF.B 17National Bank of Canada 5.60%, Series 34 NA.PR.X 17 R TD Bank 3.75%, Series 5 TD.PF.C 17National Bank of Canada 5.40%, Series 36 NA.PR.A 17 R Split III Corp. Cl B RBS.PR.B 23 TD Bank 3.60%, Series 7 TD.PF.D 17New Commerce Split Corp. 7.50%, Class I YCM.PR.A 24 RioCan Real Estate Investment Trust 4.70%, Series C REI.PR.C 18 TD Bank 3.70%, Series 9 TD.PF.E 17New Commerce Split Corp. Class II YCM.PR.B 24 Royal Bank of Canada 4.45%, Series AA RY.PR.A 11 TD Bank 4.90%, Series 11 TD.PF.F 12Newgrowth Corp. 5.25%, Series 3 NEW.PR.D 23 Royal Bank of Canada 4.70%, Series AB RY.PR.B 11 TD Bank 5.60%, Series 12 TD.PF.G 17Northland Power Inc. 5.25%, Series 1 NPI.PR.A 15 Royal Bank of Canada 4.60%, Series AC RY.PR.C 11 TD Bank 4.85%, Series 14 TD.PF.H 17Northland Power Inc., Series 2 NPI.PR.B 20 Royal Bank of Canada 4.50%, Series AD RY.PR.D 11 TD Bank 5.00%, Series S TD.PR.S 17Northland Power Inc. 5.00%, Series 3 NPI.PR.C 15 Royal Bank of Canada 4.50%, Series AE RY.PR.E 11 TD Bank, Series T TD.PR.T 21
27 February 2017

TD Bank 5.10%, Series Y TD.PR.Y 17TD Bank, Series Z TD.PR.Z 21TDb Split Corp. 5.25% XTD.PR.A 24Thomson Reuters Corp, Series II TRI.PR.B 20TransAlta Corp. 2.71%, Series A TA.PR.D 15TransAlta Corp., Series B TA.PR.E 20TransAlta Corp. 4.60%, Series C TA.PR.F 15TransAlta Corp. 5.00%, Series E TA.PR.H 15TransAlta Corp. 5.30%, Series G TA.PR.J 15TransCanada Corp. 3.266%, Series 1 TRP.PR.A 15TransCanada Corp., Series 2 TRP.PR.F 20TransCanada Corp. 4.00%, Series 3 TRP.PR.B 15TransCanada Corp., Series 4 TRP.PR.H 20TransCanada Corp. 2.26%, Series 5 TRP.PR.C 15TransCanada Corp., Series 6 TRP.PR.I 20TransCanada Corp. 4.00%, Series 7 TRP.PR.D 15TransCanada Corp. 4.25%, Series 9 TRP.PR.E 15TransCanada Corp. 3.80%, Series 11 TRP.PR.G 15TransCanada Corp. 5.50%, Series 13 TRP.PR.J 15TransCanada Corp. 4.90%, Series 15 TRP.PR.K 15
UU.S. Financial 15 Split Corp. 5.25% FTU.PR.B 24
VValener Inc. 4.35% Series A VNR.PR.A 15Veresen Inc. 4.40%, Series A VSN.PR.A 15Veresen Inc. 5.00%, Series C VSN.PR.C 15Veresen Inc. 5.00%, Series E VSN.PR.E 15
WWestcoast Energy Inc. 5.50%, Series 7 W.PR.H 9Westcoast Energy Inc. 5.60%, Series 8 W.PR.J 9Westcoast Energy Inc. 5.60%, Series 10 W.PR.K 16Westcoast Energy Inc. 5.20%, Series 12 W.PR.M 16World Financial Split Corp. 5.25% WFS.PR.A 24
28 February 2017

Investment Strategy Group | Canadian Preferred Shares Report
29
Disclosures And Disclaimers This report is issued and approved for distribution to clients in Canada by registered representatives of CIBC Wood Gundy, a division of CIBC World Markets Inc., Member of the Canadian Investor Protection Fund and Member of the Investment Industry Regulatory Organization of Canada, and by its affiliates via their registered representatives. This report is not authorized for distribution in the United States. This document and any of the products and information contained herein are not intended for the use of private investors in the United Kingdom.
This report is provided for informational purposes only and does not constitute an offer or solicitation to buy or sell any securities discussed herein in any jurisdiction where such offer or solicitation would be prohibited.
The securities mentioned in this report may not be suitable for all types of investors. This report does not take into account the investment objectives, financial situation or specific needs of any particular client of CIBC Wood Gundy. Recipients should consider this report as only a single factor in making an investment decision and should not rely solely on investment recommendations contained herein, if any, as a substitution for the exercise of independent judgment of the merits and risks of investments. CIBC Wood Gundy suggests that, prior to making an investment decision with respect to any security recommended in this report, the recipient should contact one of our client advisers in the recipient’s jurisdiction to discuss the recipient’s particular circumstances. Non-client recipients of this report should consult with an independent financial advisor prior to making any investment decision based on this report or for any necessary explanation of its contents. CIBC Wood Gundy will not treat non-client recipients as its clients by virtue of their receiving this report. Past performance is not a guarantee of future results, and no representation or warranty, express or implied, is made regarding future performance of any security mentioned in this report.
Information, opinions and statistical data contained in this report were obtained or derived from sources believed to be reliable, but CIBC Wood Gundy does not represent that any such information, opinion or statistical data is accurate or complete (with the exception of information contained in the Important Disclosures section of this report provided by CIBC World Markets or individual research analysts), and they should not be relied upon as such. All estimates, opinions and recommendations expressed herein constitute judgments as of the date of this report and are subject to change without notice.
Nothing in this report constitutes legal, accounting or tax advice. Since the levels and bases of taxation can change, any reference in this report to the impact of taxation should not be construed as offering tax advice on the tax consequences of investments. As with any investment having potential tax implications, clients should consult with their own independent tax adviser.
© 2017 CIBC World Markets Inc. All rights reserved. Unauthorized use, distribution, duplication or disclosure without the prior written permission of CIBC World Markets is prohibited by law and may result in prosecution.