
Canadian Forces Clients of Veterans Affairs Canada: “Risk ... · There is great variability among...
54
Canadian Forces Clients of Veterans Affairs Canada: “Risk Factors” for Post-Release Socioeconomic Well-Being Prepared for Veterans Services Branch, Veterans Affairs Canada Protected Status. Not for circulation except by Veterans Affairs Canada. Victor W. Marshall Rebecca A. Matteo University of North Carolina Institute on Aging May 2004 For contact: 720 Airport Road, C.B. 1030 Chapel Hill, North Carolina 27599-1030 USA Telephone: (919) 966-9444 Fax: (919) 966-0510 e-mail: [email protected] [email protected]
Transcript of Canadian Forces Clients of Veterans Affairs Canada: “Risk ... · There is great variability among...
Canadian Forces Clients of Veterans Affairs Canada: “Risk Factors” for Post-Release Socioeconomic Well-Being
Prepared for Veterans Services Branch, Veterans Affairs Canada Protected Status. Not for circulation except by Veterans Affairs Canada. Victor W. Marshall Rebecca A. Matteo University of North Carolina Institute on Aging May 2004 For contact: 720 Airport Road, C.B. 1030 Chapel Hill, North Carolina 27599-1030 USA Telephone: (919) 966-9444 Fax: (919) 966-0510 e-mail: [email protected] [email protected]
1
General Overview There is great variability among Canadian Forces (CF) clients of Veterans Affairs Canada
(VAC) in their employment history, income status and economic security. This report is based
upon a new analysis of the Canadian Forces Survey that was conducted in the fall of 1999 as part
of the Review of Veterans Care Needs Project of Veterans Affairs Canada. We examine the
educational attainment of CF male veterans;1 and, we focus on the role that education plays, in
relation to other risk factors, in shaping socioeconomic status and financial security. The survey
was not longitudinal, but based on data collected at one point in time; therefore, we are not able
to provide causal statements with any great confidence. Nevertheless, this study is able to
provide some insights into the way in which education is associated with socioeconomic status in
CF clients of VAC, including how educational attainment varies by other related factors, such as
demographic characteristics, health status and military experience. The analysis will hopefully
inform policy development that aims to enhance the economic security of CF clients of VAC
now and into the future.
As mentioned, we do not make use of all CF Forces Survey data for this report. We
exclude women, and also VAC clients older than age 65. With additional exclusions due to data
quality control, we were able to analyze data from 1845 VAC clients, of whom 85% were no
longer in the service at the time of the survey (1999). The sample is weighted to account for
stratification variables in sampling process, including: province of residence, type of service and
age.
1 The CF Dataset includes information for only 112 women (5% of sample), which presents methodological complications due to limited variability. Furthermore, we assume that women in the CF are likely to have different career patterns and retirement planning issues than men, which could both alter the findings and limit generalizability.
2
We begin in Section I by describing the educational attainment of CF clients of VAC,
paying attention to differences in educational achievement at time of entry to the service and at
the time of the survey. These differences reflect additional education secured while either in the
CF or after release. We then consider a number of correlates of education and changes in
educational attainment. Section II of the report provides more detail as to continuing education
and training since leaving the CF, and discusses barriers to further education. It is clear that
education is important in the lives of CF clients, many of whom want more of it, and some of
whom find it difficult to obtain. In Section III we provide a description of the socioeconomic
status of CF clients of VAC, and show how this is associated with education and changes in
educational status. Finally, in section IV we provide a more complex, multivariate analysis of
how education and other factors are associated with measures of socioeconomic status and
financial security.2
I. Educational Attainment of VAC Clients
Overall, current level of educational attainment (at the time of survey)3 for VAC clients is a
function of three factors: (1) level of education upon entry into the CF; (2) additional educational
attainment while in the service; (3) and educational attainment since leaving the service for
clients who have retired or been released.4
2 Note: In this report, statistical significance is reported as follows: *** p<.001; ** p<.01; and * p<.05. Additional data and tables can be found in the Appendix Section. 3 Educational attainment is coded as following: “High School Not Completed” includes no formal schooling, some primary schooling, completed primary school, and some secondary or high school; “Completed High School”; “Some Post-Secondary” includes some trade/technical/vocational school or business college, some community college/CEGEP/ nursing school, or some university; “Completed Post-Secondary” includes diploma/certificate from trade/technical/vocational school, business college, or community college/CEGEP/nursing school; “Bachelor’s or Post-Graduate Degree.” 4 Each of these factors will be considered within the report. However, due to data limitations, it is not always possible to understand the timing of additional educational attainment. In such cases, the analysis
3
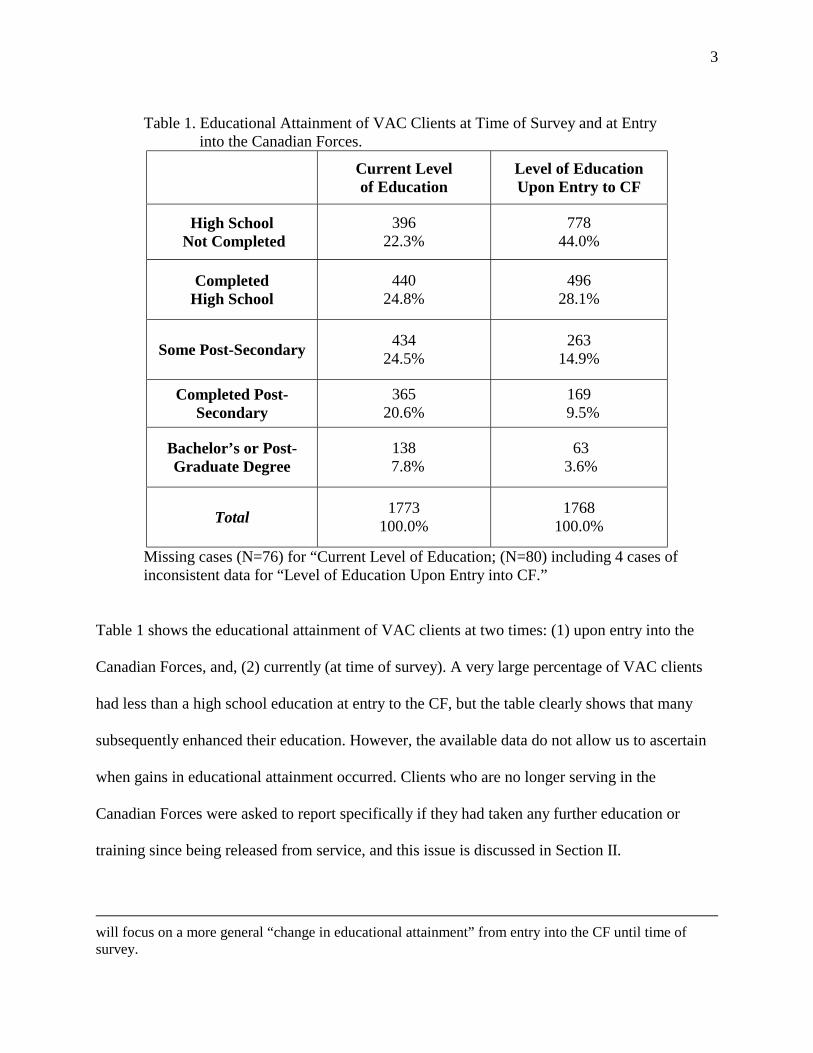
Table 1. Educational Attainment of VAC Clients at Time of Survey and at Entry
into the Canadian Forces. Current Level
of Education Level of Education Upon Entry to CF
High School Not Completed
396 22.3%
778 44.0%
Completed High School
440 24.8%
496 28.1%
Some Post-Secondary 434 24.5%
263 14.9%
Completed Post-Secondary
365 20.6%
169 9.5%
Bachelor’s or Post-Graduate Degree
138 7.8%
63 3.6%
Total 1773 100.0%
1768 100.0%
Missing cases (N=76) for “Current Level of Education; (N=80) including 4 cases of inconsistent data for “Level of Education Upon Entry into CF.”
Table 1 shows the educational attainment of VAC clients at two times: (1) upon entry into the
Canadian Forces, and, (2) currently (at time of survey). A very large percentage of VAC clients
had less than a high school education at entry to the CF, but the table clearly shows that many
subsequently enhanced their education. However, the available data do not allow us to ascertain
when gains in educational attainment occurred. Clients who are no longer serving in the
Canadian Forces were asked to report specifically if they had taken any further education or
training since being released from service, and this issue is discussed in Section II.
will focus on a more general “change in educational attainment” from entry into the CF until time of survey.
4
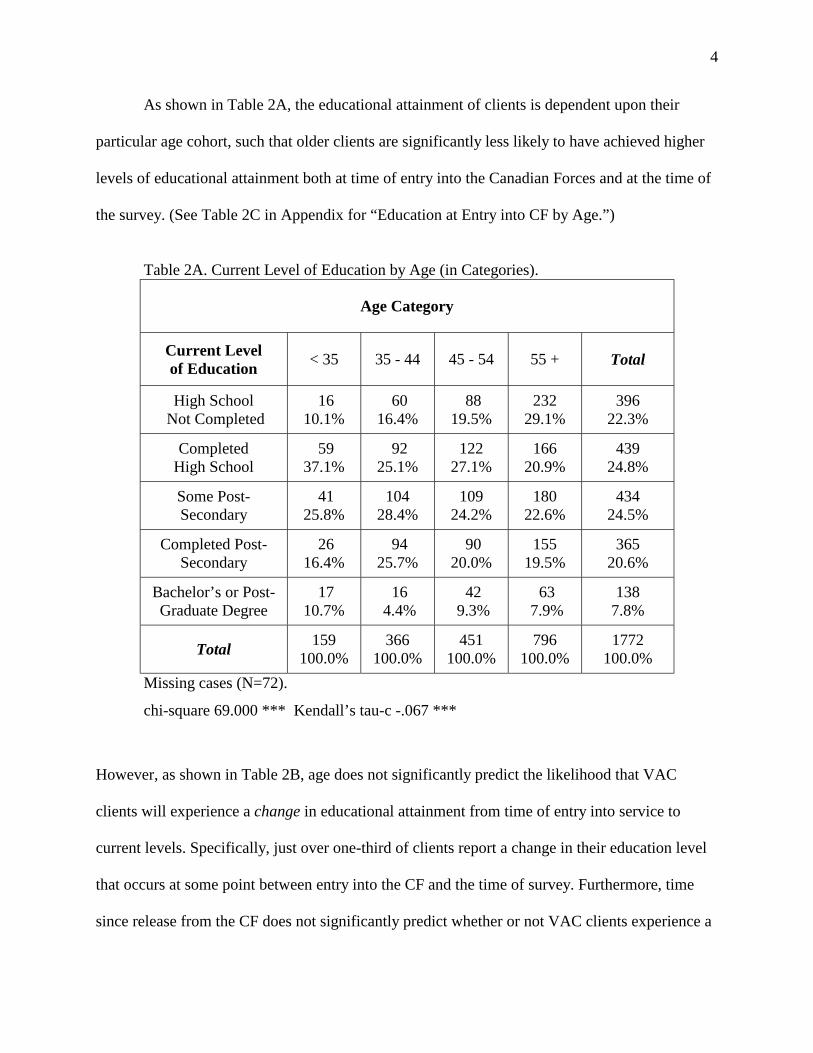
As shown in Table 2A, the educational attainment of clients is dependent upon their
particular age cohort, such that older clients are significantly less likely to have achieved higher
levels of educational attainment both at time of entry into the Canadian Forces and at the time of
the survey. (See Table 2C in Appendix for “Education at Entry into CF by Age.”)
Table 2A. Current Level of Education by Age (in Categories).
Age Category
Current Level of Education < 35 35 - 44 45 - 54 55 + Total
High School Not Completed
16 10.1%
60 16.4%
88 19.5%
232 29.1%
396 22.3%
Completed High School
59 37.1%
92 25.1%
122 27.1%
166 20.9%
439 24.8%
Some Post-Secondary
41 25.8%
104 28.4%
109 24.2%
180 22.6%
434 24.5%
Completed Post-Secondary
26 16.4%
94 25.7%
90 20.0%
155 19.5%
365 20.6%
Bachelor’s or Post-Graduate Degree
17 10.7%
16 4.4%
42 9.3%
63 7.9%
138 7.8%
Total 159 100.0%
366 100.0%
451 100.0%
796 100.0%
1772 100.0%
Missing cases (N=72).
chi-square 69.000 *** Kendall’s tau-c -.067 ***
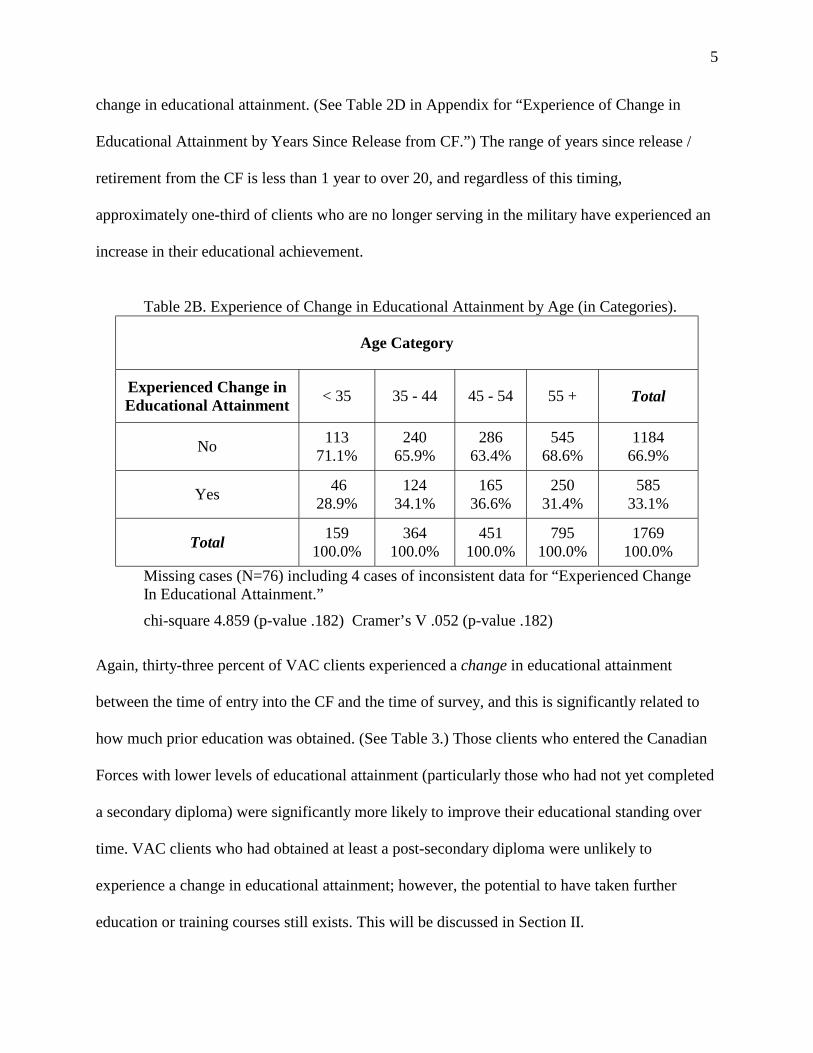
However, as shown in Table 2B, age does not significantly predict the likelihood that VAC
clients will experience a change in educational attainment from time of entry into service to
current levels. Specifically, just over one-third of clients report a change in their education level
that occurs at some point between entry into the CF and the time of survey. Furthermore, time
since release from the CF does not significantly predict whether or not VAC clients experience a
5
change in educational attainment. (See Table 2D in Appendix for “Experience of Change in
Educational Attainment by Years Since Release from CF.”) The range of years since release /
retirement from the CF is less than 1 year to over 20, and regardless of this timing,
approximately one-third of clients who are no longer serving in the military have experienced an
increase in their educational achievement.
Table 2B. Experience of Change in Educational Attainment by Age (in Categories).
Age Category
Experienced Change in Educational Attainment < 35 35 - 44 45 - 54 55 + Total
No 113 71.1%
240 65.9%
286 63.4%
545 68.6%
1184 66.9%
Yes 46 28.9%
124 34.1%
165 36.6%
250 31.4%
585 33.1%
Total 159 100.0%
364 100.0%
451 100.0%
795 100.0%
1769 100.0%
Missing cases (N=76) including 4 cases of inconsistent data for “Experienced Change In Educational Attainment.”
chi-square 4.859 (p-value .182) Cramer’s V .052 (p-value .182)
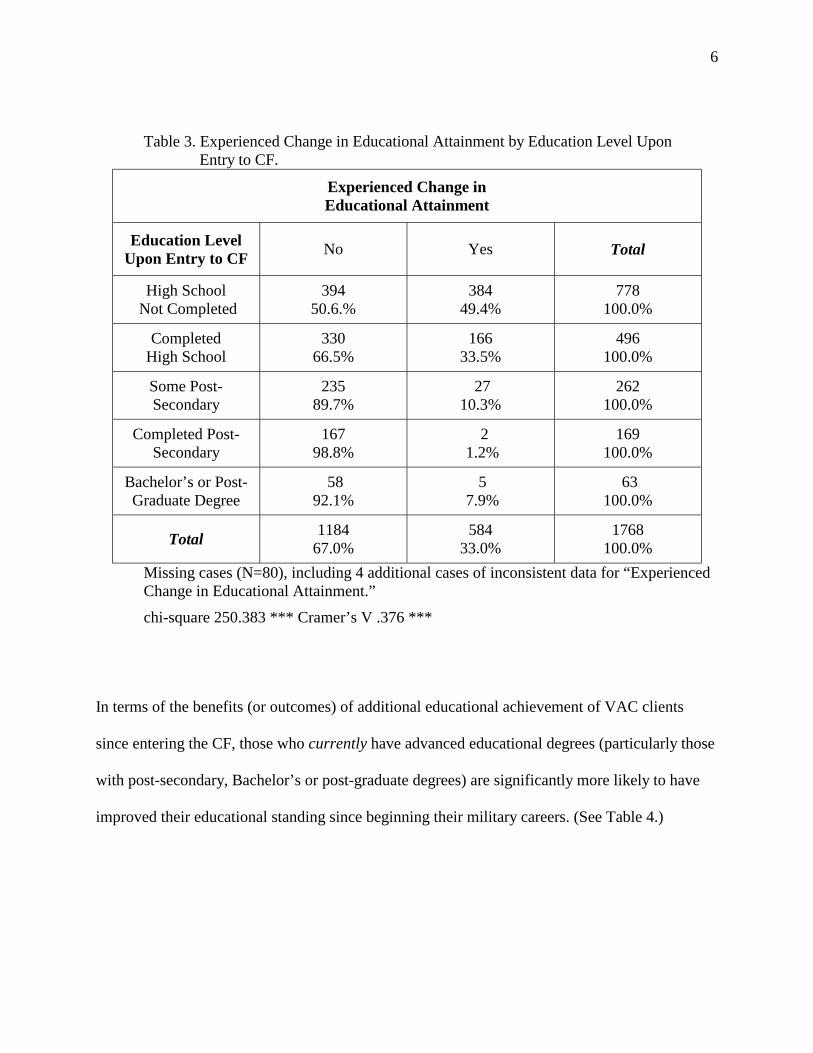
Again, thirty-three percent of VAC clients experienced a change in educational attainment
between the time of entry into the CF and the time of survey, and this is significantly related to
how much prior education was obtained. (See Table 3.) Those clients who entered the Canadian
Forces with lower levels of educational attainment (particularly those who had not yet completed
a secondary diploma) were significantly more likely to improve their educational standing over
time. VAC clients who had obtained at least a post-secondary diploma were unlikely to
experience a change in educational attainment; however, the potential to have taken further
education or training courses still exists. This will be discussed in Section II.
6
Table 3. Experienced Change in Educational Attainment by Education Level Upon Entry to CF.
Experienced Change in Educational Attainment
Education Level Upon Entry to CF No Yes Total
High School Not Completed
394 50.6.%
384 49.4%
778 100.0%
Completed High School
330 66.5%
166 33.5%
496 100.0%
Some Post-Secondary
235 89.7%
27 10.3%
262 100.0%
Completed Post-Secondary
167 98.8%
2 1.2%
169 100.0%
Bachelor’s or Post-Graduate Degree
58 92.1%
5 7.9%
63 100.0%
Total 1184 67.0%
584 33.0%
1768 100.0%
Missing cases (N=80), including 4 additional cases of inconsistent data for “Experienced Change in Educational Attainment.”
chi-square 250.383 *** Cramer’s V .376 ***
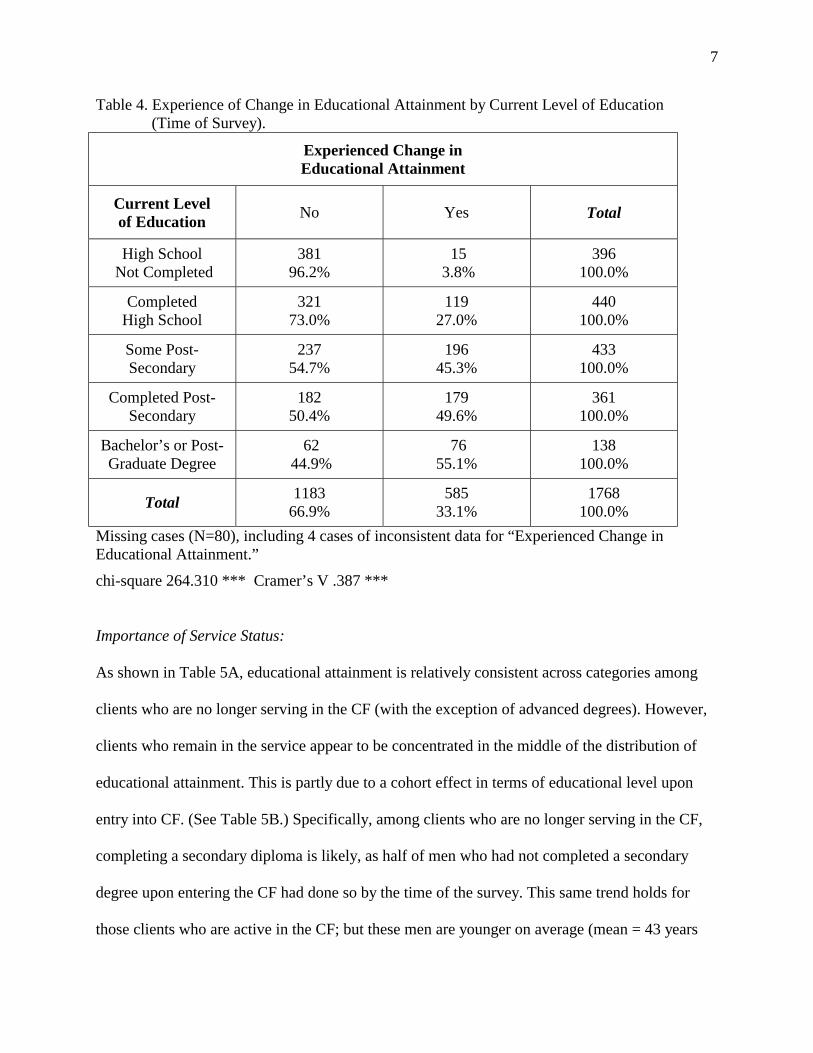
In terms of the benefits (or outcomes) of additional educational achievement of VAC clients
since entering the CF, those who currently have advanced educational degrees (particularly those
with post-secondary, Bachelor’s or post-graduate degrees) are significantly more likely to have
improved their educational standing since beginning their military careers. (See Table 4.)
7
Table 4. Experience of Change in Educational Attainment by Current Level of Education (Time of Survey).
Experienced Change in Educational Attainment
Current Level of Education No Yes Total
High School Not Completed
381 96.2%
15 3.8%
396 100.0%
Completed High School
321 73.0%
119 27.0%
440 100.0%
Some Post-Secondary
237 54.7%
196 45.3%
433 100.0%
Completed Post-Secondary
182 50.4%
179 49.6%
361 100.0%
Bachelor’s or Post-Graduate Degree
62 44.9%
76 55.1%
138 100.0%
Total 1183 66.9%
585 33.1%
1768 100.0%
Missing cases (N=80), including 4 cases of inconsistent data for “Experienced Change in Educational Attainment.”
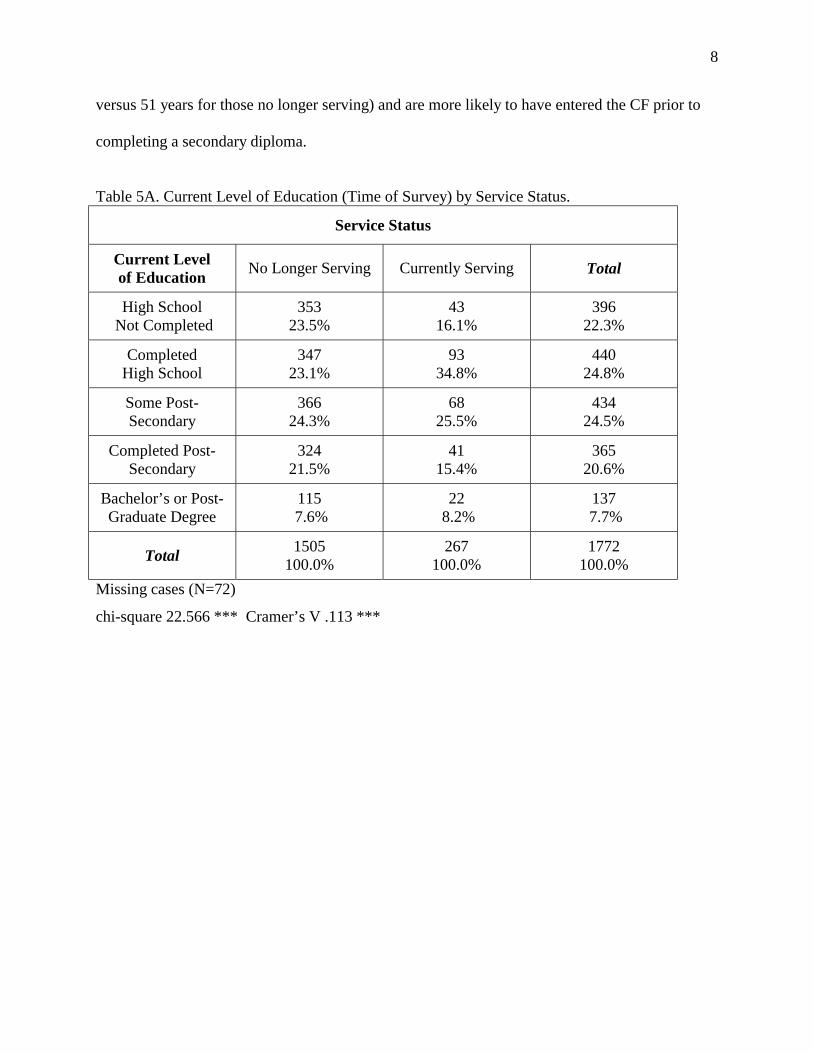
chi-square 264.310 *** Cramer’s V .387 *** Importance of Service Status: As shown in Table 5A, educational attainment is relatively consistent across categories among
clients who are no longer serving in the CF (with the exception of advanced degrees). However,
clients who remain in the service appear to be concentrated in the middle of the distribution of
educational attainment. This is partly due to a cohort effect in terms of educational level upon
entry into CF. (See Table 5B.) Specifically, among clients who are no longer serving in the CF,
completing a secondary diploma is likely, as half of men who had not completed a secondary
degree upon entering the CF had done so by the time of the survey. This same trend holds for
those clients who are active in the CF; but these men are younger on average (mean = 43 years
8
versus 51 years for those no longer serving) and are more likely to have entered the CF prior to
completing a secondary diploma.
Table 5A. Current Level of Education (Time of Survey) by Service Status.
Service Status
Current Level of Education No Longer Serving Currently Serving Total
High School Not Completed
353 23.5%
43 16.1%
396 22.3%
Completed High School
347 23.1%
93 34.8%
440 24.8%
Some Post-Secondary
366 24.3%
68 25.5%
434 24.5%
Completed Post-Secondary
324 21.5%
41 15.4%
365 20.6%
Bachelor’s or Post-Graduate Degree
115 7.6%
22 8.2%
137 7.7%
Total 1505 100.0%
267 100.0%
1772 100.0%
Missing cases (N=72)
chi-square 22.566 *** Cramer’s V .113 ***

9
Table 5B. Education Level Upon Entry to CF by Service Status.
Service Status
Education Level Upon Entry to CF No Longer Serving Currently Serving Total
High School Not Completed
699 46.5%
79 29.5%
778 44.0%
Completed High School
389 25.9%
108 40.3%
497 28.1%
Some Post-Secondary
222 14.8%
41 15.3%
263 14.9%
Completed Post-Secondary
141 9.4%
28 10.4%
169 9.5%
Bachelor’s or Post-Graduate Degree
51 3.4%
12 4.5%
63 3.6%
Total 1502 100.0%
268 100.0%
1770 100.0%
Missing cases (N=76) including 4 cases of inconsistent data for “Level of Education Upon Entry into CF.”
chi-square 32.910 *** Cramer’s V .136 *** Other Military Service Variables of Importance: We examined three other aspects of military service in relation to education.
• Element of Service: In terms of current level of education, VAC clients who report
having ever served in either the Sea or Air elements of the CF have significantly
higher educational attainment than their counterparts who had not. Furthermore, those
clients who have served in the Land element report significantly lower educational
achievement. Clients in both the Sea and Air elements are more likely to have
experienced a change in educational attainment since entering the CF (although this
relationship is only marginally significant for the Air element and significant at

10
p<.001 for the Sea element). This may, in part, be explained by the fact that clients
who have served in the Land element of the CF are significantly younger than those
who have not, thus indicating a cohort effect or limited opportunities for educational
attainment since entering the CF.
• Rank: Clients of higher rank (particularly those who are either General, Flag, or
Senior Officers), have significantly higher levels of educational attainment, both in
terms of current education and education at time of entry into the CF. Furthermore,
more highly ranked officers are significantly more likely to report an increase in
education since entering the CF than their lower-ranked counterparts.
• Deployment: Clients who have been deployed overseas have lower levels of
educational attainment both at time of entry into the CF and in terms of current
educational standing. However, whether or not a client has experienced a change in
educational status is not significantly related to the experience of being deployed.
Importance of Health Status: VAC clients who report being in “good” or “excellent” health have significantly higher
educational attainment than their counterparts who have health that is either “fair” or “poor;” and
this relationship stands for both current levels of education and educational attainment at time of
entry into the CF (See Table 6).

11
Table 6. Current Level of Education (Time of Survey) by Health Status.
Health Status
Current Level of Education Poor / Fair Good / Excellent Total
High School Not Completed
247 26.9%
148 17.5%
395 22.4%
Completed High School
224 24.4%
211 25.0%
435 24.7%
Some Post-Secondary
219 23.8%
213 25.2%
432 24.5%
Completed Post-Secondary
185 20.1%
178 21.1%
363 20.6%
Bachelor’s or Post-Graduate Degree
44 4.8%
94 11.1%
138 7.8%
Total 919 100.0%
844 100.0%
1763 100.0%
Missing cases (N=81)
chi-square 40.418 *** Kendall’s tau-c .138 *** We considered a few other measures of health as it relates to educational attainment:
• Clients who report “having trouble with pain” have lower educational attainment, and
this relationship is linear such that those clients who report the most pain have the
lowest average educational attainment. However, health status (including global
measures and presence of pain) does NOT predict changes in educational attainment
from the point of entry into the CF and current level.5
5 The relationship between health and educational attainment cannot be understood in a causal manner. It is unclear based upon cross-sectional data whether health status at the time of survey has been an ongoing determinant of educational attainment; however, the association between various measures of health and level of education of VAC clients remains an important finding. Furthermore, measures of health status are not significantly associated with level of education upon entry into the CF (with the exception of limited mobility), which lends support to the assumption that health status becomes increasingly important for clients as they age, particularly as a risk factor for socioeconomic well being.

12
• Medical release status is not a significant predictor of educational attainment or
changes in educational achievement from time of entry into the CF to the time of
survey. Although medical release is a marker of compromised health status, it is not
associated with the overall educational attainment of VAC clients.
13
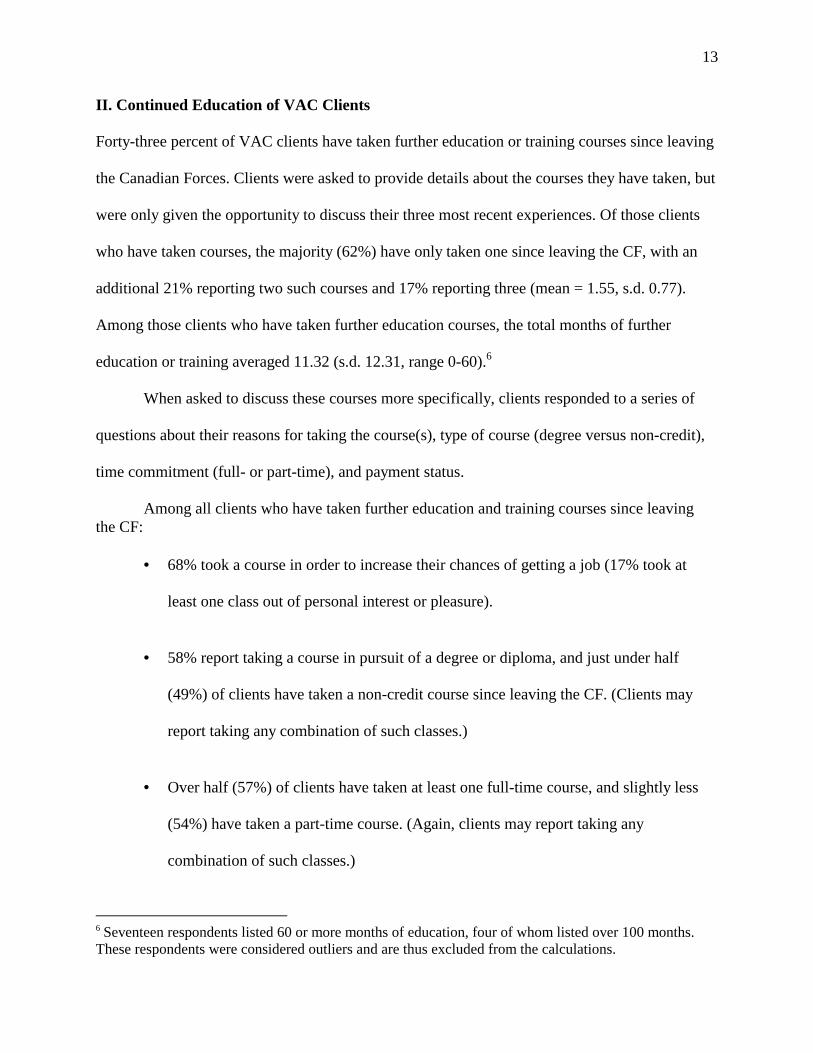
II. Continued Education of VAC Clients Forty-three percent of VAC clients have taken further education or training courses since leaving
the Canadian Forces. Clients were asked to provide details about the courses they have taken, but
were only given the opportunity to discuss their three most recent experiences. Of those clients
who have taken courses, the majority (62%) have only taken one since leaving the CF, with an
additional 21% reporting two such courses and 17% reporting three (mean = 1.55, s.d. 0.77).
Among those clients who have taken further education courses, the total months of further
education or training averaged 11.32 (s.d. 12.31, range 0-60).6
When asked to discuss these courses more specifically, clients responded to a series of
questions about their reasons for taking the course(s), type of course (degree versus non-credit),
time commitment (full- or part-time), and payment status.
Among all clients who have taken further education and training courses since leaving the CF:
• 68% took a course in order to increase their chances of getting a job (17% took at
least one class out of personal interest or pleasure).
• 58% report taking a course in pursuit of a degree or diploma, and just under half
(49%) of clients have taken a non-credit course since leaving the CF. (Clients may
report taking any combination of such classes.)
• Over half (57%) of clients have taken at least one full-time course, and slightly less
(54%) have taken a part-time course. (Again, clients may report taking any
combination of such classes.)
6 Seventeen respondents listed 60 or more months of education, four of whom listed over 100 months. These respondents were considered outliers and are thus excluded from the calculations.
14
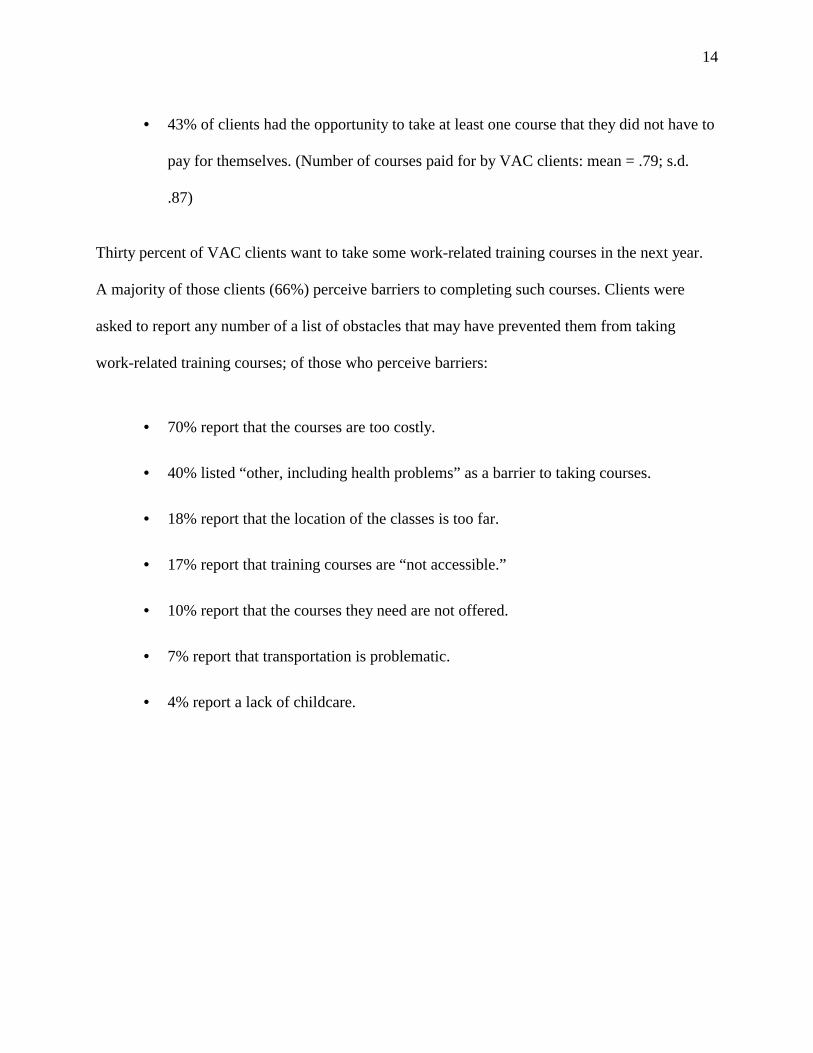
• 43% of clients had the opportunity to take at least one course that they did not have to
pay for themselves. (Number of courses paid for by VAC clients: mean = .79; s.d.
.87)
Thirty percent of VAC clients want to take some work-related training courses in the next year.
A majority of those clients (66%) perceive barriers to completing such courses. Clients were
asked to report any number of a list of obstacles that may have prevented them from taking
work-related training courses; of those who perceive barriers:
• 70% report that the courses are too costly.
• 40% listed “other, including health problems” as a barrier to taking courses.
• 18% report that the location of the classes is too far.
• 17% report that training courses are “not accessible.”
• 10% report that the courses they need are not offered.
• 7% report that transportation is problematic.
• 4% report a lack of childcare.
15
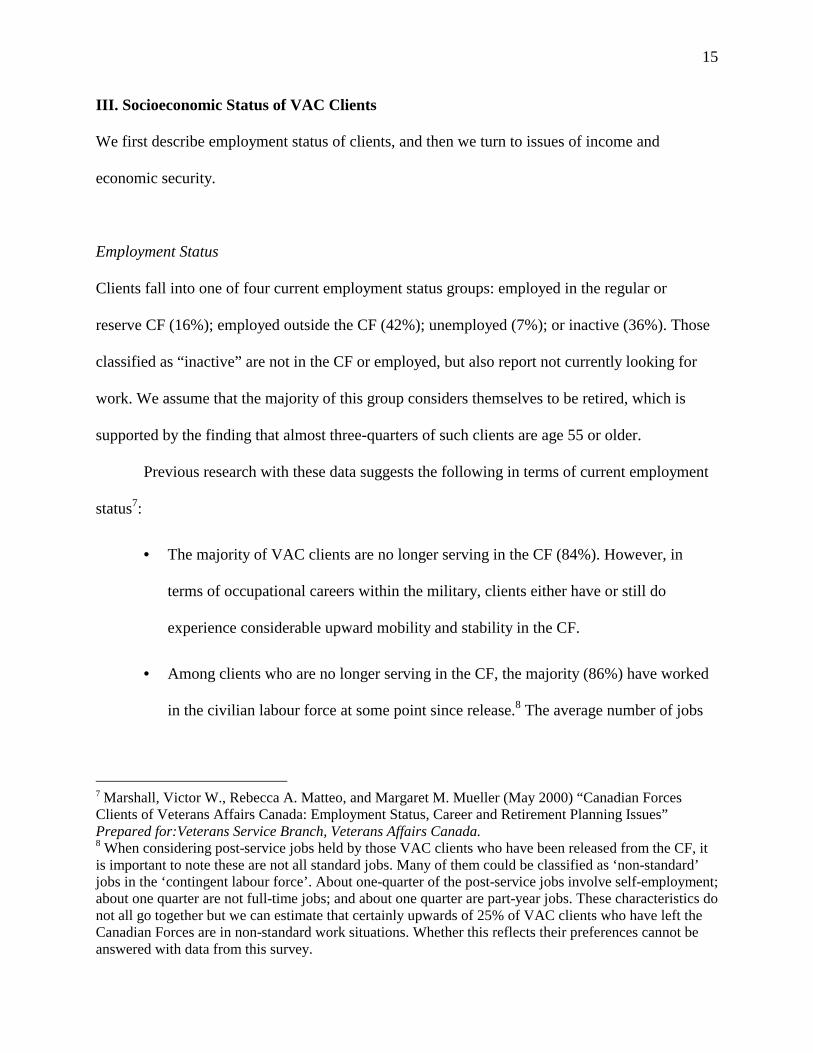
III. Socioeconomic Status of VAC Clients We first describe employment status of clients, and then we turn to issues of income and
economic security.
Employment Status
Clients fall into one of four current employment status groups: employed in the regular or
reserve CF (16%); employed outside the CF (42%); unemployed (7%); or inactive (36%). Those
classified as “inactive” are not in the CF or employed, but also report not currently looking for
work. We assume that the majority of this group considers themselves to be retired, which is
supported by the finding that almost three-quarters of such clients are age 55 or older.
Previous research with these data suggests the following in terms of current employment
status7:
• The majority of VAC clients are no longer serving in the CF (84%). However, in
terms of occupational careers within the military, clients either have or still do
experience considerable upward mobility and stability in the CF.
• Among clients who are no longer serving in the CF, the majority (86%) have worked
in the civilian labour force at some point since release.8 The average number of jobs
7 Marshall, Victor W., Rebecca A. Matteo, and Margaret M. Mueller (May 2000) “Canadian Forces Clients of Veterans Affairs Canada: Employment Status, Career and Retirement Planning Issues” Prepared for:Veterans Service Branch, Veterans Affairs Canada. 8 When considering post-service jobs held by those VAC clients who have been released from the CF, it is important to note these are not all standard jobs. Many of them could be classified as ‘non-standard’ jobs in the ‘contingent labour force’. About one-quarter of the post-service jobs involve self-employment; about one quarter are not full-time jobs; and about one quarter are part-year jobs. These characteristics do not all go together but we can estimate that certainly upwards of 25% of VAC clients who have left the Canadian Forces are in non-standard work situations. Whether this reflects their preferences cannot be answered with data from this survey.
16
held for those clients is 3.34 (s.d., 3.26). Half of all clients report having been
unemployed at some point since release.9
• Among those clients who are unemployed, those who have been released from the CF
within the past year are significantly more likely to be unemployed than clients who
made the transition to civilian life less recently.
Personal Income10 Overall, 17% of clients report an annual income of less than $20,000, and the median income for
all clients is between $30,000 and $40,000.
Previous research with these data suggests the following in terms of personal income11:
• Personal income varies by age. The youngest (< 35) and oldest (55 +) clients are
more likely to fall into the lowest income categories. The non-linear pattern of the
relationship between income and age reflects a complex association between
employment status, health status, and age-related effects of retirement.
9 Age is associated with job change or loss such that older clients (who are no longer serving in the CF) are more likely to have experienced a job disruption in the past year. We found that this pattern is not linear, suggesting period-specific labour market conditions as a contributing factor to client experiences. (Although longitudinal data are needed to specifically address this issue, it is clear that clients who were released from the CF in the early 1990s experienced higher occupational instability. This is a period where the labour market deteriorated as evidenced by higher unemployment rates and lower labour force participation. 10 The non-response rate for personal income was 10.6% compared to 18.6% for household income. (This larger non-response rate for household income is partially due to the number of sole household occupants skipping the question, most likely due to redundancy.) Confining the analysis to personal income allows us to more closely consider the relationship between a client’s income and personal characteristics. 11 Marshall, Victor W., Rebecca A. Matteo, and Margaret M. Mueller (May 2000) “Canadian Forces Clients of Veterans Affairs Canada: Employment Status, Career and Retirement Planning Issues” Prepared for: Veterans Service Branch, Veterans Affairs Canada.
17
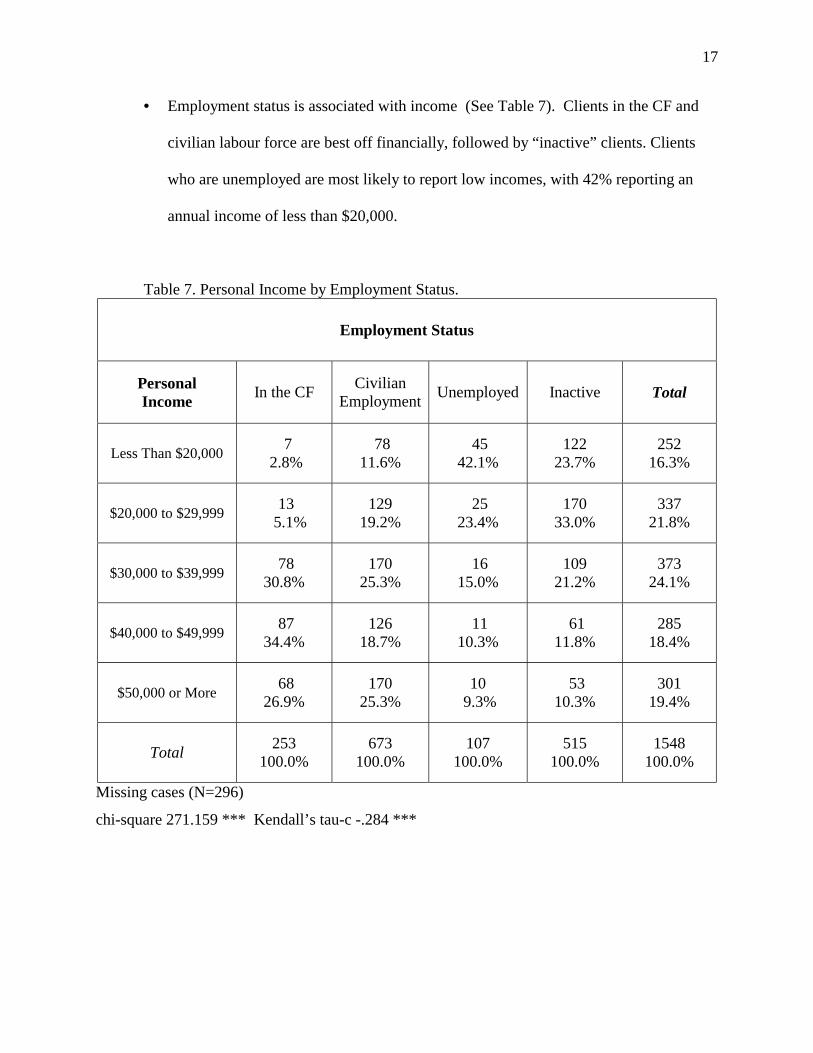
• Employment status is associated with income (See Table 7). Clients in the CF and
civilian labour force are best off financially, followed by “inactive” clients. Clients
who are unemployed are most likely to report low incomes, with 42% reporting an
annual income of less than $20,000.
Table 7. Personal Income by Employment Status.
Employment Status
Personal Income In the CF Civilian
Employment Unemployed Inactive Total
Less Than $20,000 7 2.8%
78 11.6%
45 42.1%
122 23.7%
252 16.3%
$20,000 to $29,999 13 5.1%
129 19.2%
25 23.4%
170 33.0%
337 21.8%
$30,000 to $39,999 78 30.8%
170 25.3%
16 15.0%
109 21.2%
373 24.1%
$40,000 to $49,999 87 34.4%
126 18.7%
11 10.3%
61 11.8%
285 18.4%
$50,000 or More 68 26.9%
170 25.3%
10 9.3%
53 10.3%
301 19.4%
Total 253 100.0%
673 100.0%
107 100.0%
515 100.0%
1548 100.0%
Missing cases (N=296)
chi-square 271.159 *** Kendall’s tau-c -.284 ***

18
Economic Security Clients were asked to consider their perceptions of economic security based upon current levels
of income and investments. These data appear in Table 8. Overall, half of clients feel that their
current level of income and investments satisfies their needs. However, when asked to consider
whether their current financial situation will provide continued satisfaction, only about one-third
of clients responded positively.
Table 8. Perceived Economic Security of VAC Clients.
Present Satisfaction of Current Income & Investments
Continued Satisfaction of Current Income & Investments
No / Don’t Know 49.5% 65.9%
Yes 50.5% 34.1%
Total 100.0% 100.0%
Previous research of this data suggests the following in terms of perceived economic security12:
• Levels of satisfaction with current income and investments seems primarily
dependent upon current income and health status, with current employment status and
measures of work stability adding explanatory power. Interestingly, clients who are
inactive in the civilian labour force report lower levels of income yet greater
satisfaction with this standard. Similarly, clients who have been employed in the
12 Marshall, Victor W., Rebecca A. Matteo, and David Pedlar “Work-related Experience and Financial Security of Veterans Affairs Canada Clients: Contrasting Medical and Non-Medical Discharge” Unpublished manuscript of paper for presentation at Canadian Association on Gerontology Annual Scientific and Educational Meetings, Montreal, Quebec, October 2002.
19
civilian labour force at some point since release do have higher incomes on average,
but this indicator does not significantly predict satisfaction with economic status.
• Client’s post-release employment career directly affects personal income, yet this
relationship does not necessarily lead to a predicable sense of financial security.
• Health is unrelated to personal income once other factors (such as education and
employment history) are taken into account, but continues to influence client’s
perceptions of how adequately prepared they are for meeting their needs. Healthier
clients appear to anticipate that they will remain in good health into the future, which
will in turn allow them to remain active in employment activities that will enhance
economic position.
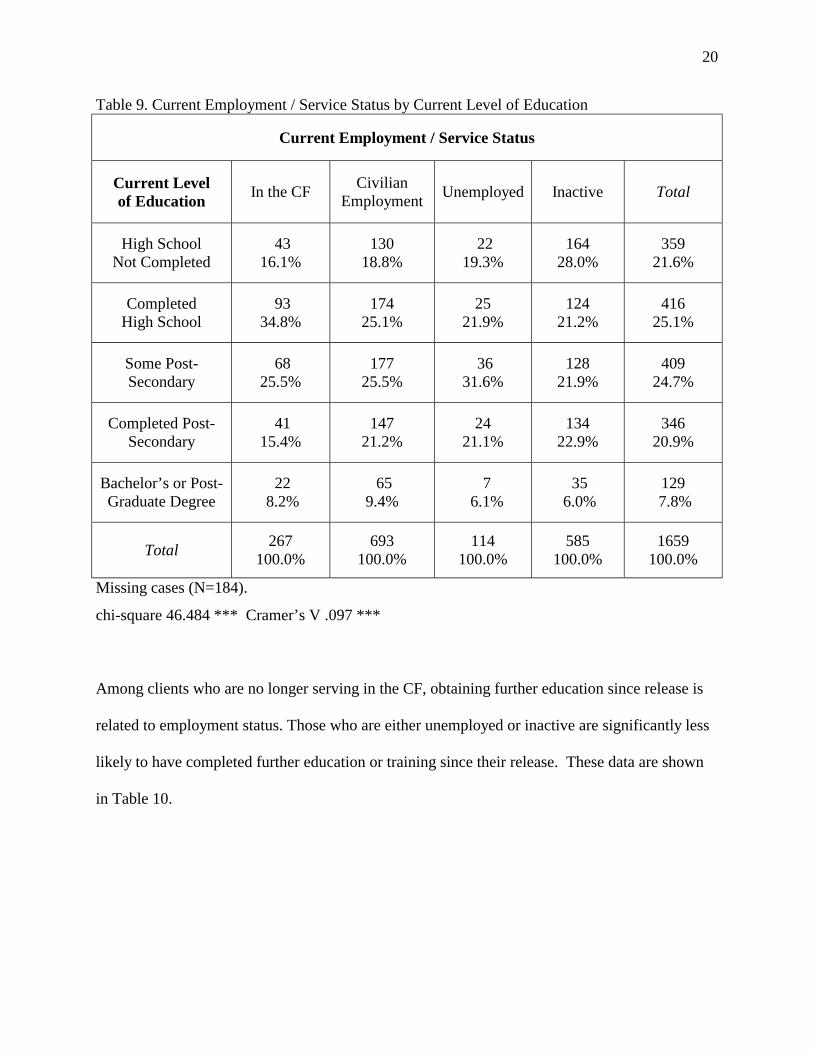
Importance of Educational Attainment Educational attainment is strongly correlated with employment and economic variables. (See
Table 9.) In terms of employment status, clients who are inactive have the lowest level of
educational attainment, on average. As mentioned previously, this reflects a cohort effect as men
who consider themselves to be “retired” are older than their counterparts. In terms of civilian
employment after release from the CF, obtaining an advanced degree limits the risk of
unemployment. Clients who are unemployed are concentrated in the “some post-secondary”
category, perhaps illustrating the benefits of continuing the pursuit of education through a post-
secondary diploma.
20
Table 9. Current Employment / Service Status by Current Level of Education
Current Employment / Service Status
Current Level of Education In the CF Civilian
Employment Unemployed Inactive Total
High School Not Completed
43 16.1%
130 18.8%
22 19.3%
164 28.0%
359 21.6%
Completed High School
93 34.8%
174 25.1%
25 21.9%
124 21.2%
416 25.1%
Some Post-Secondary
68 25.5%
177 25.5%
36 31.6%
128 21.9%
409 24.7%
Completed Post-Secondary
41 15.4%
147 21.2%
24 21.1%
134 22.9%
346 20.9%
Bachelor’s or Post-Graduate Degree
22 8.2%
65 9.4%
7 6.1%
35 6.0%
129 7.8%
Total 267 100.0%
693 100.0%
114 100.0%
585 100.0%
1659 100.0%
Missing cases (N=184).
chi-square 46.484 *** Cramer’s V .097 *** Among clients who are no longer serving in the CF, obtaining further education since release is
related to employment status. Those who are either unemployed or inactive are significantly less
likely to have completed further education or training since their release. These data are shown
in Table 10.

21
Table 10. Current Employment Status by Completion of Further Education Courses
for Clients No Longer Serving in CF.
Completed Further Education or Training (Since Leaving CF)
Current Employment Status No Yes Total
Civilian Employment 359 50.7%
349 49.3%
708 100.0%
Unemployed 64 56.1%
50 43.9%
114 100.0%
Inactive 377 64.2%
210 35.8%
587 100.0%
Total 800 56.8%
609 43.2%
1409 100.0%
Missing cases (N=434).
chi-square 23.920 *** Cramer’s V .130 ***
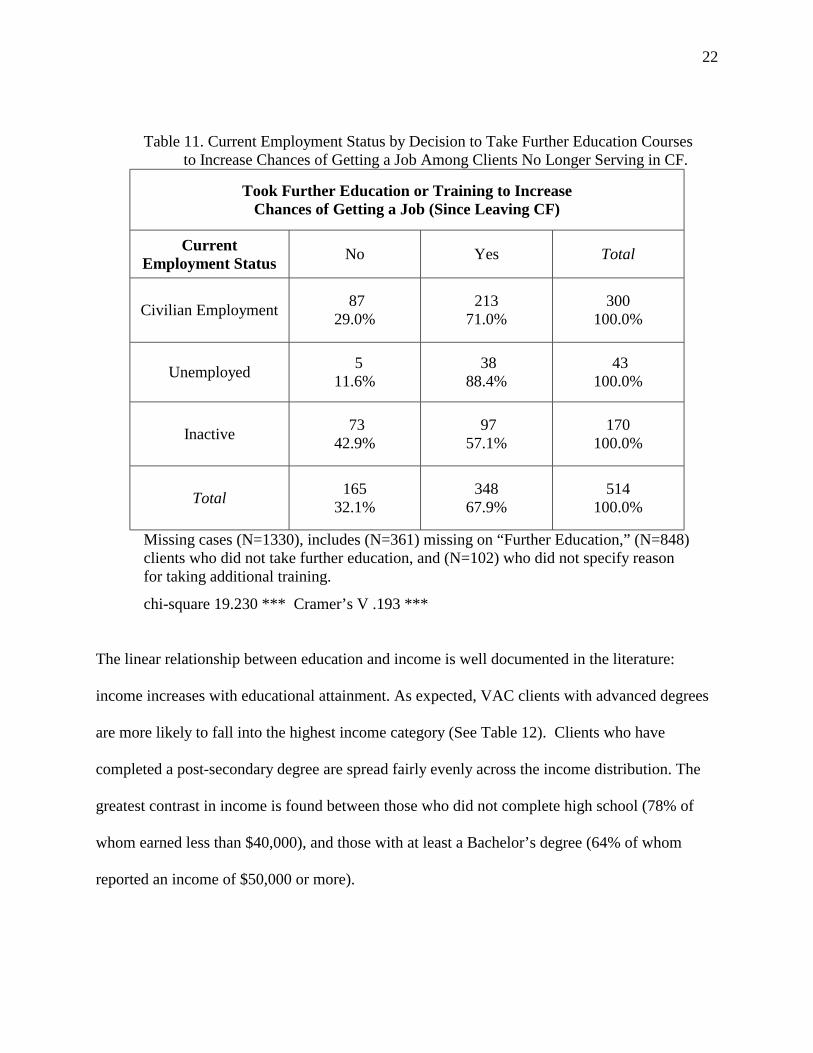
Clients were asked about their motivation for having taken continuing education / training
courses, and the majority of clients did so with the intention of enhancing job opportunities
(See Table 11). As expected, clients who consider themselves to be “inactive” are least
likely to take further education courses to enhance job opportunities, which reflects both
position within the labour force and a cohort effect. Clients who are unemployed are most
likely to report having taken courses to increase job opportunities. Although sequencing of
continued education and the experience of unemployment is unclear, it appears that clients
recognize the value of taking courses to improve their standing in the paid labour force. As
considered above, further education and training does decrease the likelihood that clients are
unemployed.
22
Table 11. Current Employment Status by Decision to Take Further Education Courses to Increase Chances of Getting a Job Among Clients No Longer Serving in CF.
Took Further Education or Training to Increase Chances of Getting a Job (Since Leaving CF)
Current Employment Status No Yes Total
Civilian Employment 87 29.0%
213 71.0%
300 100.0%
Unemployed 5 11.6%
38 88.4%
43 100.0%
Inactive 73 42.9%
97 57.1%
170 100.0%
Total 165 32.1%
348 67.9%
514 100.0%
Missing cases (N=1330), includes (N=361) missing on “Further Education,” (N=848) clients who did not take further education, and (N=102) who did not specify reason for taking additional training.
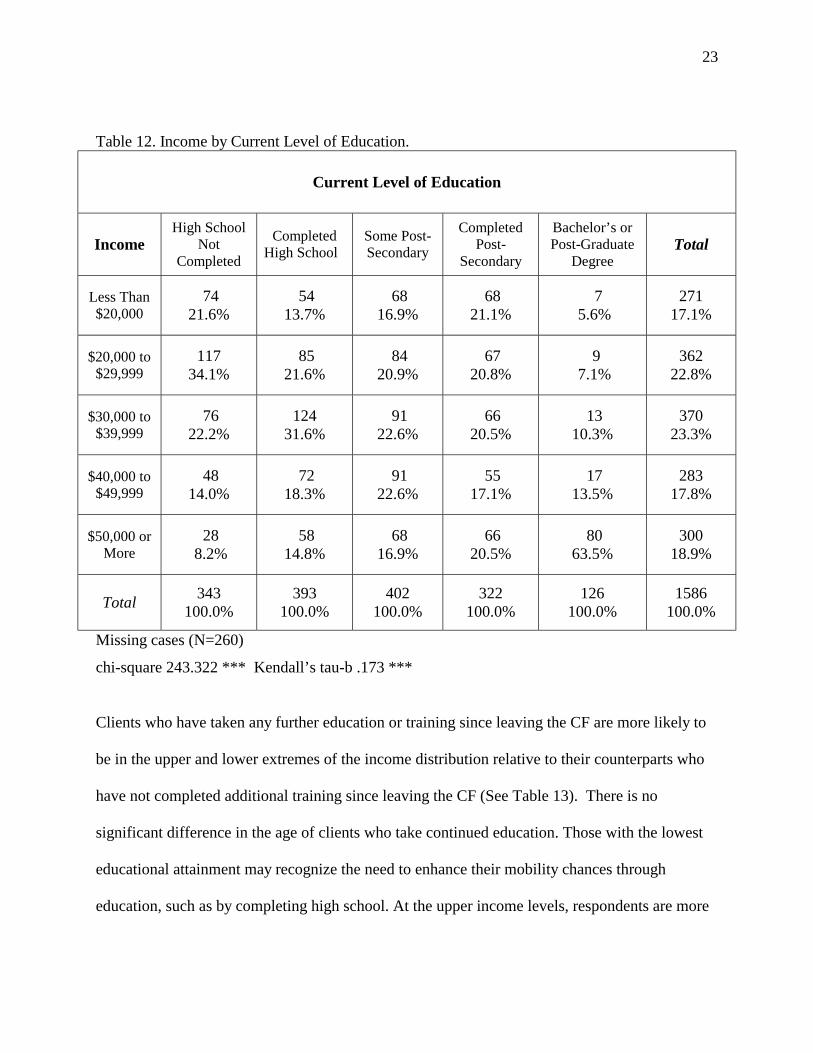
chi-square 19.230 *** Cramer’s V .193 *** The linear relationship between education and income is well documented in the literature:
income increases with educational attainment. As expected, VAC clients with advanced degrees
are more likely to fall into the highest income category (See Table 12). Clients who have
completed a post-secondary degree are spread fairly evenly across the income distribution. The
greatest contrast in income is found between those who did not complete high school (78% of
whom earned less than $40,000), and those with at least a Bachelor’s degree (64% of whom
reported an income of $50,000 or more).
23
Table 12. Income by Current Level of Education.
Current Level of Education
Income High School
Not Completed
Completed High School
Some Post-Secondary
Completed Post-
Secondary
Bachelor’s or Post-Graduate
Degree Total
Less Than $20,000
74 21.6%
54 13.7%
68 16.9%
68 21.1%
7 5.6%
271 17.1%
$20,000 to $29,999
117 34.1%
85 21.6%
84 20.9%
67 20.8%
9 7.1%
362 22.8%
$30,000 to $39,999
76 22.2%
124 31.6%
91 22.6%
66 20.5%
13 10.3%
370 23.3%
$40,000 to $49,999
48 14.0%
72 18.3%
91 22.6%
55 17.1%
17 13.5%
283 17.8%
$50,000 or More
28 8.2%
58 14.8%
68 16.9%
66 20.5%
80 63.5%
300 18.9%
Total 343 100.0%
393 100.0%
402 100.0%
322 100.0%
126 100.0%
1586 100.0%
Missing cases (N=260)
chi-square 243.322 *** Kendall’s tau-b .173 ***
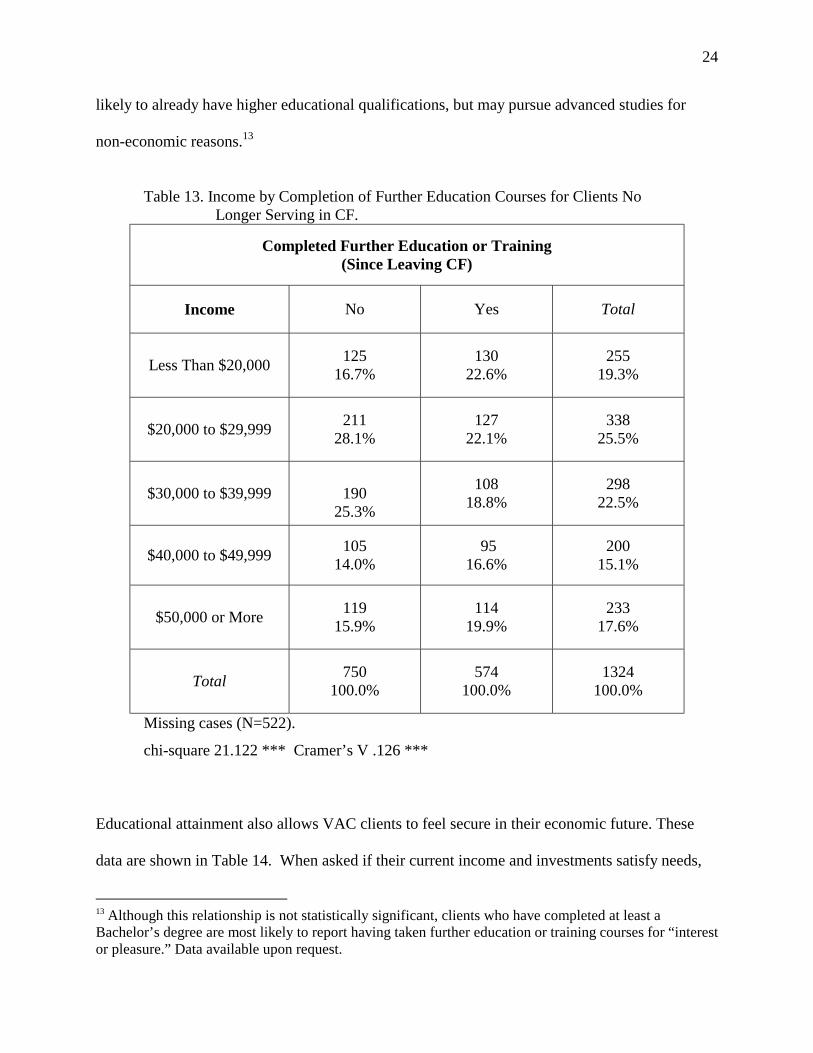
Clients who have taken any further education or training since leaving the CF are more likely to
be in the upper and lower extremes of the income distribution relative to their counterparts who
have not completed additional training since leaving the CF (See Table 13). There is no
significant difference in the age of clients who take continued education. Those with the lowest
educational attainment may recognize the need to enhance their mobility chances through
education, such as by completing high school. At the upper income levels, respondents are more
24
likely to already have higher educational qualifications, but may pursue advanced studies for
non-economic reasons.13
Table 13. Income by Completion of Further Education Courses for Clients No
Longer Serving in CF.
Completed Further Education or Training (Since Leaving CF)
Income No Yes Total
Less Than $20,000 125 16.7%
130 22.6%
255 19.3%
$20,000 to $29,999 211 28.1%
127 22.1%
338 25.5%
$30,000 to $39,999
190 25.3%
108 18.8%
298 22.5%
$40,000 to $49,999 105 14.0%
95 16.6%
200 15.1%
$50,000 or More 119 15.9%
114 19.9%
233 17.6%
Total 750 100.0%
574 100.0%
1324 100.0%
Missing cases (N=522).
chi-square 21.122 *** Cramer’s V .126 ***
Educational attainment also allows VAC clients to feel secure in their economic future. These
data are shown in Table 14. When asked if their current income and investments satisfy needs,
13 Although this relationship is not statistically significant, clients who have completed at least a Bachelor’s degree are most likely to report having taken further education or training courses for “interest or pleasure.” Data available upon request.
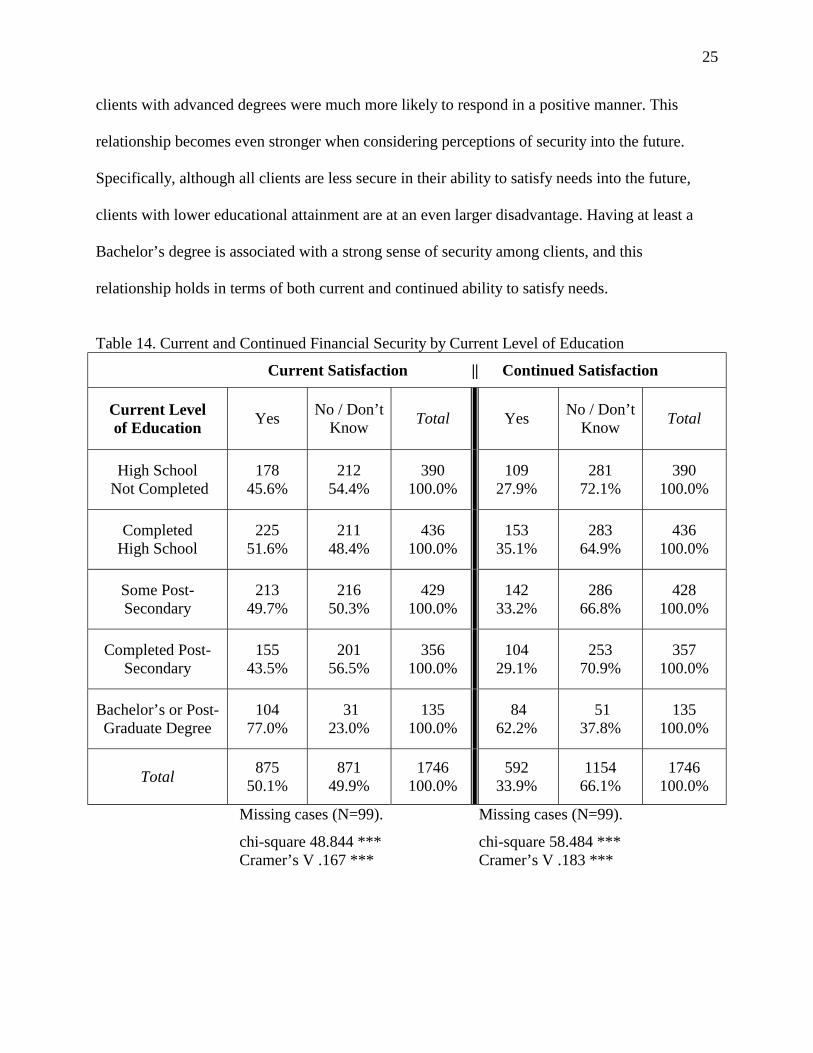
25
clients with advanced degrees were much more likely to respond in a positive manner. This
relationship becomes even stronger when considering perceptions of security into the future.
Specifically, although all clients are less secure in their ability to satisfy needs into the future,
clients with lower educational attainment are at an even larger disadvantage. Having at least a
Bachelor’s degree is associated with a strong sense of security among clients, and this
relationship holds in terms of both current and continued ability to satisfy needs.
Table 14. Current and Continued Financial Security by Current Level of Education
Current Satisfaction || Continued Satisfaction
Current Level of Education Yes No / Don’t
Know Total Yes No / Don’t Know Total
High School Not Completed
178 45.6%
212 54.4%
390 100.0%
109 27.9%
281 72.1%
390 100.0%
Completed High School
225 51.6%
211 48.4%
436 100.0%
153 35.1%
283 64.9%
436 100.0%
Some Post-Secondary
213 49.7%
216 50.3%
429 100.0%
142 33.2%
286 66.8%
428 100.0%
Completed Post-Secondary
155 43.5%
201 56.5%
356 100.0%
104 29.1%
253 70.9%
357 100.0%
Bachelor’s or Post-Graduate Degree
104 77.0%
31 23.0%
135 100.0%
84 62.2%
51 37.8%
135 100.0%
Total 875 50.1%
871 49.9%
1746 100.0%
592 33.9%
1154 66.1%
1746 100.0%
Missing cases (N=99). Missing cases (N=99).
chi-square 48.844 *** chi-square 58.484 *** Cramer’s V .167 *** Cramer’s V .183 ***
26
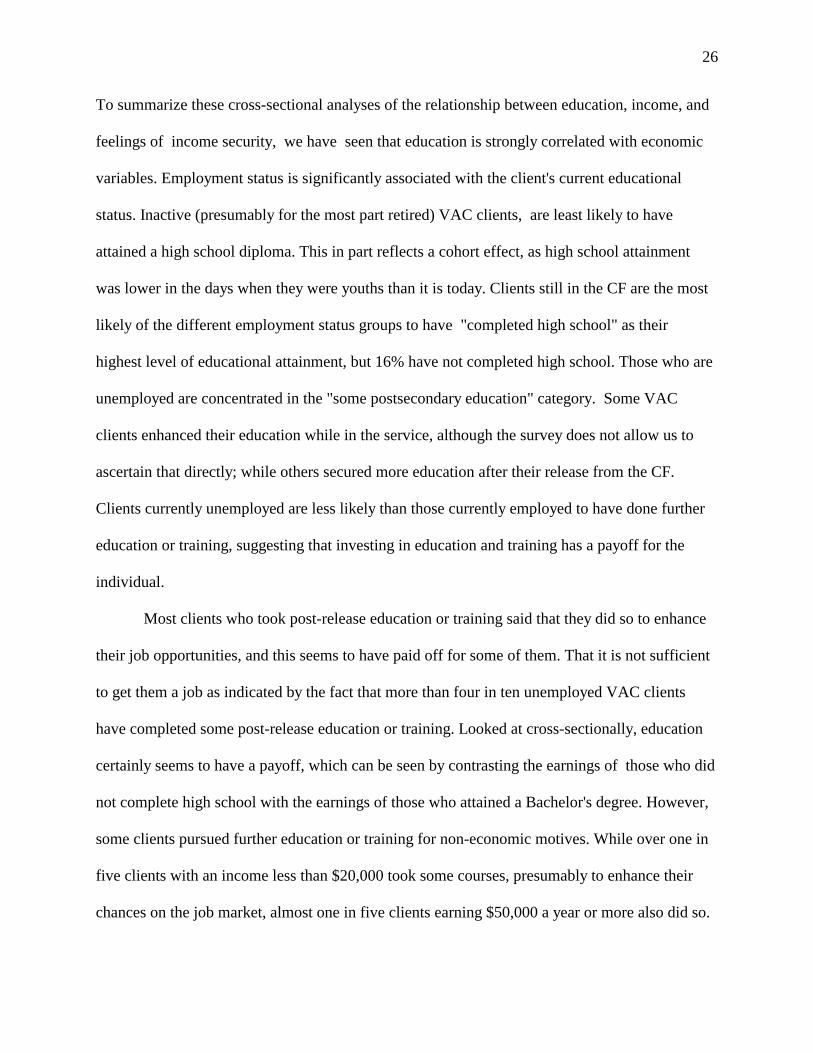
To summarize these cross-sectional analyses of the relationship between education, income, and
feelings of income security, we have seen that education is strongly correlated with economic
variables. Employment status is significantly associated with the client's current educational
status. Inactive (presumably for the most part retired) VAC clients, are least likely to have
attained a high school diploma. This in part reflects a cohort effect, as high school attainment
was lower in the days when they were youths than it is today. Clients still in the CF are the most
likely of the different employment status groups to have "completed high school" as their
highest level of educational attainment, but 16% have not completed high school. Those who are
unemployed are concentrated in the "some postsecondary education" category. Some VAC
clients enhanced their education while in the service, although the survey does not allow us to
ascertain that directly; while others secured more education after their release from the CF.
Clients currently unemployed are less likely than those currently employed to have done further
education or training, suggesting that investing in education and training has a payoff for the
individual.
Most clients who took post-release education or training said that they did so to enhance
their job opportunities, and this seems to have paid off for some of them. That it is not sufficient
to get them a job as indicated by the fact that more than four in ten unemployed VAC clients
have completed some post-release education or training. Looked at cross-sectionally, education
certainly seems to have a payoff, which can be seen by contrasting the earnings of those who did
not complete high school with the earnings of those who attained a Bachelor's degree. However,
some clients pursued further education or training for non-economic motives. While over one in
five clients with an income less than $20,000 took some courses, presumably to enhance their
chances on the job market, almost one in five clients earning $50,000 a year or more also did so.
27
Their motives may have been a mix of economic enhancement and leisure, recreational or
interest.
The last table in this section (Table 14) deals with a less concrete aspect of the VAC CF
client's economic situation-- his feelings of financial security both now and for the future. The
two most central findings about feelings of economic security are first, that there are high levels
of insecurity , particularly when looking to the future; and second, that the only significant aspect
of educational attainment that makes a difference for feelings of security is attainment of the
university Bachelor's degree. Below that level, differences in educational attainment are not
strongly related to feelings of security, which are quite low (i.e. large percentages of clients feel
insecure). Above that level, clients are much more likely to view the future as secure.
28
IV. Relationship between Education and Socioeconomic Well Being The relationships between educational attainment and a number of demographics, health status
indicators, military service characteristics, and socioeconomic measures are evident from the
above analyses. Many of these factors interact to determine socioeconomic status. We now turn
to causal modeling in order to understand the complexity of these associations. Depending on
the nature of the dependent variable, we use multivariate ordinary least squares regression
(educational attainment and income) or binary logistic regression (completion of further
education upon release from CF, current level of financial security, and continued satisfaction of
ability to meet needs).
Predictive factors are considered in a series of blocks: (1) demographic characteristics,
including respondent age, marital status, and educational attainment; (2) health status, including
global assessment (excellent/good versus fair/poor), current level of pain (none/mild, moderate,
or severe), an ADL measure which counts the number of activities the respondent reported
experiencing difficulty completing, and medical release status; (3) military career
characteristics, including rank and number of overseas deployments; and, when applicable, (4)
post-military work characteristics, including employment status, income, completion of further
education or training, and retirement/release preparations.
Each model helps us to understand a new set of factors associated with measures of
socioeconomic status and financial security. As we move from one model to another within each
table, the models become more intricate, which better reflects the complexity of factors leading
to variability in the dependent variables. As we add this complexity, our ability to understand the
factors influencing socioeconomic status and financial security increases. We now explain the
findings of our regression analysis.

Table15. OLS Regression of Current Level of Education (Time of Survey) on Demographics, Health and Military Career of VAC Client Sample (N=1592)a
Model 1 Model 2 Model 3
Demographics Age -.010*** -.011*** -.018***
(.003) (.003) (.003)
Marital Status (1=married/common law) .145 .127 .090
(.093) (.092) (.088)
Health Current Health (1=good/excellent) .306*** .240***
(.077) (.074)
Current Level of Pain (None/Mild)
Moderate -.152 -.105
(.085) (.081)
Severe -.094 -.042
(.118) (.112)
Activities of Daily Living (Range: 0-14) .014 .030
(.018) (.017)
Military Career Rank on Date of Release (Non-Commissioned Officer or below)
Junior/Subordinate Officer .271**
(.097)
General/Flag/Senior Officer 1.117***
(.096)
Number of Overseas Deployments -.139***
(.026)
Constant 3.050 3.025 3.329
(.166) (.183) (.181)
R2.007 .024 .113
a Sample data are weighted and limited to male respondents who are age 65 or less. * p<.05; ** p<.01; *** p<.001Note: Coefficients are unstandardized regression weights (their standard errors are in parentheses).
30
Educational attainment is a strong predictor of income, employment status and financial security;
therefore, we begin with an analysis of the factors that predict educational achievement.14 (See
Table 15.) Model 1 clearly illustrates the importance of age as a determinant of educational
attainment. Specifically, a cohort effect exists such that older VAC clients have significantly
lower levels of educational attainment. This relationship persists as other blocks of predictors are
entered into the model. Marital status does not significantly affect educational attainment,
although, as we will see later, it does influence measures of income and financial security.
General health status is also a significant predictor of educational attainment such that
those clients in better health achieve higher levels of education. The experience of pain or ADLs
do not significantly influence the level of education a client completes; however, it is possible
that disability or decreased health may occur after education has been completed. Furthermore,
among clients who are no longer serving in the CF, medical release status does not predict
educational attainment. (See Table 15A in Appendix.)
In Model 3, we see that including military career characteristics increases our
understanding of educational attainment. Specifically, clients of higher rank are significantly
more likely to have high levels of education. Furthermore, clients who have been deployed
overseas have lower educational attainment. Each additional deployment is associated with lower
educational attainment, which may be in part due to opportunity to pursue educational goals
while in the service as well as the likelihood of clients who are deployed being in the land
element of the CF (which is related to lower educational attainment upon entry into the CF).
Overall, we see that educational attainment is primarily a factor of military experience
and age cohort, although this analysis is limited to a specific set of predictors that do not 14 For this analysis, we consider educational attainment to be a continuous variable. When used as a predictor in later models, we enter education as ordinal categories in order to look for a threshold effect.
31
necessarily capture factors that influence educational achievement at an earlier time in the life
course. What is important, however, is that the relationship between educational attainment and
military service is significant. Whether educational achievements occur prior to entry into the
military or during the course of service, there are foreseeable opportunities for the CF to enhance
the human capital of its members.
We next turn to the predictors of personal income (See Table 16A). We have shown that
educational attainment is strongly associated with personal income, but it is important to
consider the complexity of this relationship in regards to other predictors of financial status. In
this analysis, educational attainment categories are used as a predictor of income, in order to
determine if a threshold relationship exists. The reference category for education is “high school
not completed.”
Model 1 highlights the importance of both marital status and education as predictors of
income. Specifically, VAC clients who are married report significantly higher personal income
in comparison to their non-married counterparts.15 Although the strength of this relationship
declines slightly as other variables are added, marital status remains a significant predictor of
income. Therefore, family support allows clients to achieve a higher socioeconomic standing, a
finding that is consistent with research literature.
In terms of education, human capital is a strong and consistent predictor of economic
standing, and this relationship holds across all levels of achievement. Furthermore, the
relationship between educational attainment and income holds even as other predictors of health
status, military career experiences, and employment characteristics are considered. Model 4 15 Marital status is coded as follows: “Married / Common Law” or “Not Married” including separated, divorced, widowed, or never been married.
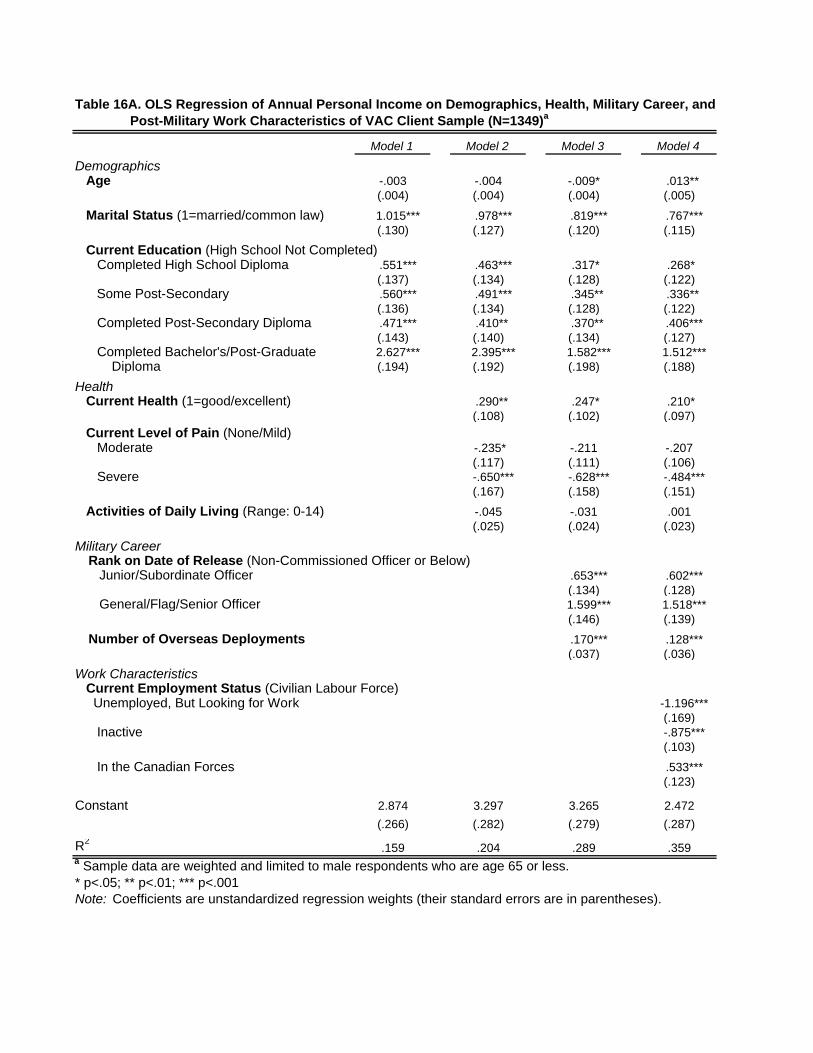
Table 16A. OLS Regression of Annual Personal Income on Demographics, Health, Military Career, and Post-Military Work Characteristics of VAC Client Sample (N=1349)a
Model 1 Model 2 Model 3 Model 4
Demographics Age -.003 -.004 -.009* .013**
(.004) (.004) (.004) (.005)
Marital Status (1=married/common law) 1.015*** .978*** .819*** .767***(.130) (.127) (.120) (.115)
Current Education (High School Not Completed) Completed High School Diploma .551*** .463*** .317* .268*
(.137) (.134) (.128) (.122) Some Post-Secondary .560*** .491*** .345** .336**
(.136) (.134) (.128) (.122) Completed Post-Secondary Diploma .471*** .410** .370** .406***
(.143) (.140) (.134) (.127) Completed Bachelor's/Post-Graduate 2.627*** 2.395*** 1.582*** 1.512*** Diploma (.194) (.192) (.198) (.188)
Health Current Health (1=good/excellent) .290** .247* .210*
(.108) (.102) (.097)
Current Level of Pain (None/Mild) Moderate -.235* -.211 -.207
(.117) (.111) (.106) Severe -.650*** -.628*** -.484***
(.167) (.158) (.151)
Activities of Daily Living (Range: 0-14) -.045 -.031 .001(.025) (.024) (.023)
Military Career Rank on Date of Release (Non-Commissioned Officer or Below) Junior/Subordinate Officer .653*** .602***
(.134) (.128) General/Flag/Senior Officer 1.599*** 1.518***
(.146) (.139)
Number of Overseas Deployments .170*** .128***(.037) (.036)
Work Characteristics Current Employment Status (Civilian Labour Force) Unemployed, But Looking for Work -1.196***
(.169) Inactive -.875***
(.103)
In the Canadian Forces .533***(.123)
Constant 2.874 3.297 3.265 2.472
(.266) (.282) (.279) (.287)
R2.159 .204 .289 .359
a Sample data are weighted and limited to male respondents who are age 65 or less. * p<.05; ** p<.01; *** p<.001Note: Coefficients are unstandardized regression weights (their standard errors are in parentheses).
33
includes the full set of predictors. We see that age becomes a significant predictor of
income through its relationship with both military career characteristics and employment status.
Also, subjective health status predicts better income while severe pain on a daily basis predicts
lower income.
Limiting the analysis to VAC clients who are no longer serving in the CF, we can
consider a number of post-military experiences as predictors of income. (See Table 16B.)
Because the sample for this table is limited to clients no longer serving in the CF, we are able to
include additional predictors of health (medical release status) and post-military employment
(ever employed in civilian labour force since leaving CF, ever unemployed since leaving CF,
completed further education or training since leaving CF, and made retirement preparations).16
The addition of these predictors offers some insight to the experience of clients once released
from the CF.
Generally, marital status and education remain strong predictors of income for clients no
longer serving in the CF. In terms of health status, medical release predicts lower income;
however, this relationship is mediated by military and post-military work experiences. It appears
that demographics, military career characteristics, and civilian labour force measures are the
most important predictors of economic standing. Yet, current level of pain or discomfort, a
measure of health status that is significantly related to medical release status, does remain a
significant indicator of decreased income. So, although medical release status is mediated by
more proximal determinants of economic position in these models, it may be that disability, in
16 The added variables have the following frequencies: medical release status (31% yes); ever employed in civilian labour force since leaving CF (86% yes); ever unemployed since leaving the CF (50% yes); completed further education or training since leaving CF (43% yes); and made retirement preparations (85% yes).
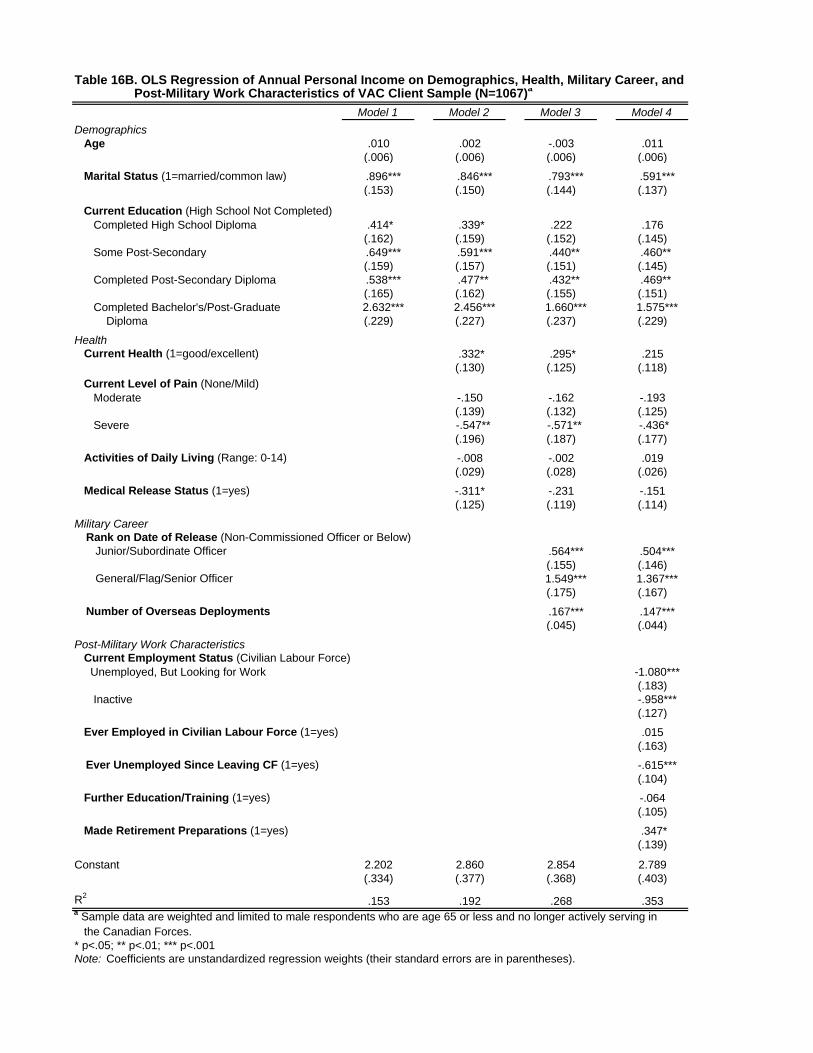
Table 16B. OLS Regression of Annual Personal Income on Demographics, Health, Military Career, and Post-Military Work Characteristics of VAC Client Sample (N=1067)a
Model 1 Model 2 Model 3 Model 4
Demographics Age .010 .002 -.003 .011
(.006) (.006) (.006) (.006)
Marital Status (1=married/common law) .896*** .846*** .793*** .591***(.153) (.150) (.144) (.137)
Current Education (High School Not Completed) Completed High School Diploma .414* .339* .222 .176
(.162) (.159) (.152) (.145) Some Post-Secondary .649*** .591*** .440** .460**
(.159) (.157) (.151) (.145) Completed Post-Secondary Diploma .538*** .477** .432** .469**
(.165) (.162) (.155) (.151) Completed Bachelor's/Post-Graduate 2.632*** 2.456*** 1.660*** 1.575*** Diploma (.229) (.227) (.237) (.229)
Health Current Health (1=good/excellent) .332* .295* .215
(.130) (.125) (.118)
Current Level of Pain (None/Mild) Moderate -.150 -.162 -.193
(.139) (.132) (.125) Severe -.547** -.571** -.436*
(.196) (.187) (.177)
Activities of Daily Living (Range: 0-14) -.008 -.002 .019(.029) (.028) (.026)
Medical Release Status (1=yes) -.311* -.231 -.151(.125) (.119) (.114)
Military Career Rank on Date of Release (Non-Commissioned Officer or Below) Junior/Subordinate Officer .564*** .504***
(.155) (.146) General/Flag/Senior Officer 1.549*** 1.367***
(.175) (.167)
Number of Overseas Deployments .167*** .147***(.045) (.044)
Post-Military Work Characteristics Current Employment Status (Civilian Labour Force) Unemployed, But Looking for Work -1.080***
(.183) Inactive -.958***
(.127)
Ever Employed in Civilian Labour Force (1=yes) .015(.163)
Ever Unemployed Since Leaving CF (1=yes) -.615***(.104)
Further Education/Training (1=yes) -.064(.105)
Made Retirement Preparations (1=yes) .347*(.139)
Constant 2.202 2.860 2.854 2.789(.334) (.377) (.368) (.403)
R2.153 .192 .268 .353
a Sample data are weighted and limited to male respondents who are age 65 or less and no longer actively serving in the Canadian Forces. * p<.05; ** p<.01; *** p<.001Note: Coefficients are unstandardized regression weights (their standard errors are in parentheses).
35
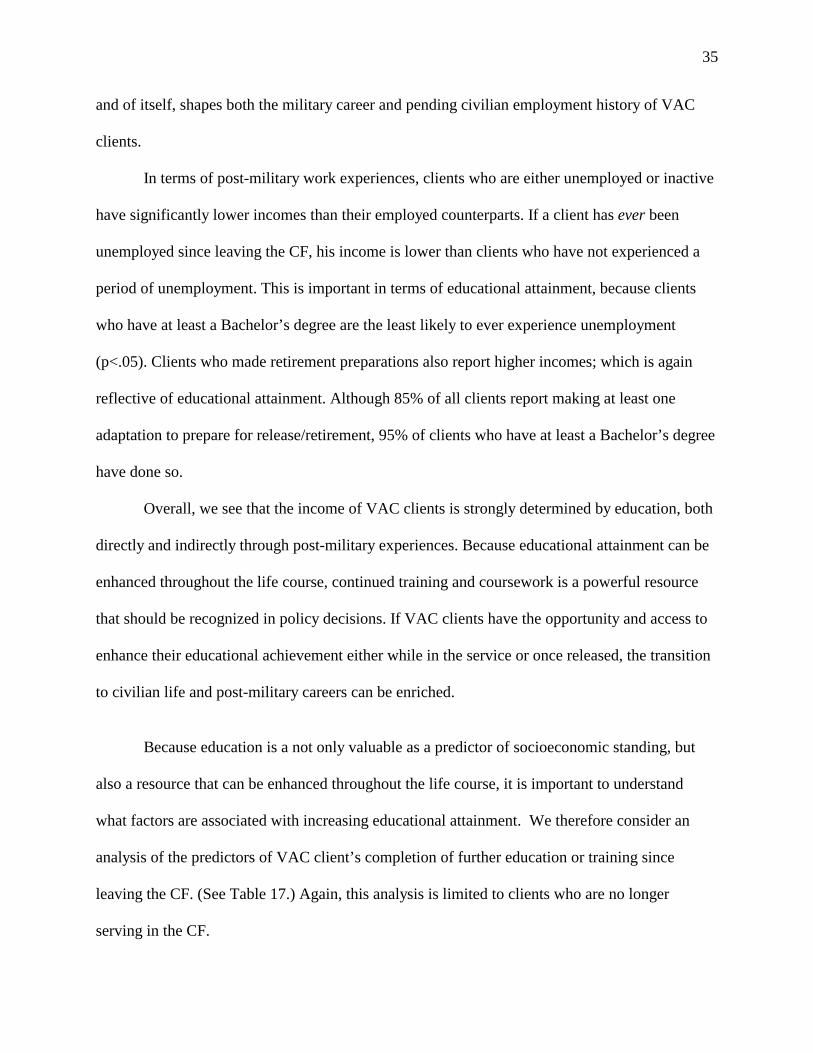
and of itself, shapes both the military career and pending civilian employment history of VAC
clients.
In terms of post-military work experiences, clients who are either unemployed or inactive
have significantly lower incomes than their employed counterparts. If a client has ever been
unemployed since leaving the CF, his income is lower than clients who have not experienced a
period of unemployment. This is important in terms of educational attainment, because clients
who have at least a Bachelor’s degree are the least likely to ever experience unemployment
(p<.05). Clients who made retirement preparations also report higher incomes; which is again
reflective of educational attainment. Although 85% of all clients report making at least one
adaptation to prepare for release/retirement, 95% of clients who have at least a Bachelor’s degree
have done so.
Overall, we see that the income of VAC clients is strongly determined by education, both
directly and indirectly through post-military experiences. Because educational attainment can be
enhanced throughout the life course, continued training and coursework is a powerful resource
that should be recognized in policy decisions. If VAC clients have the opportunity and access to
enhance their educational achievement either while in the service or once released, the transition
to civilian life and post-military careers can be enriched.
Because education is a not only valuable as a predictor of socioeconomic standing, but
also a resource that can be enhanced throughout the life course, it is important to understand
what factors are associated with increasing educational attainment. We therefore consider an
analysis of the predictors of VAC client’s completion of further education or training since
leaving the CF. (See Table 17.) Again, this analysis is limited to clients who are no longer
serving in the CF.
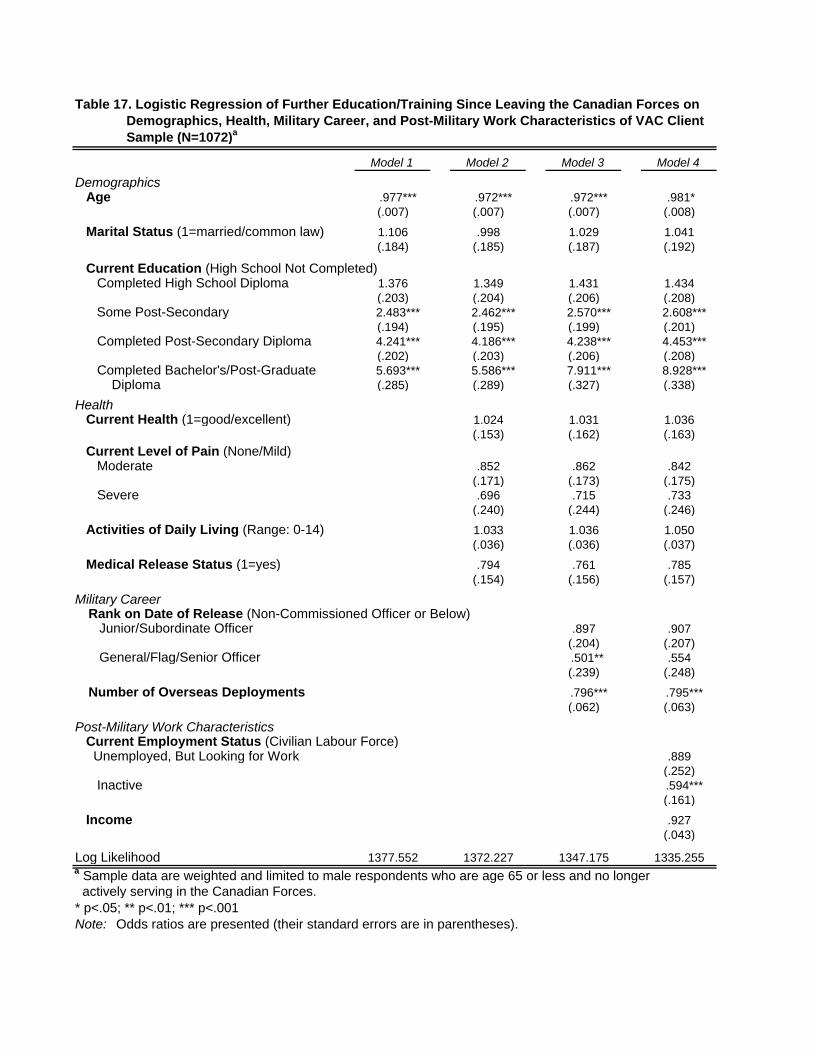
Table 17. Logistic Regression of Further Education/Training Since Leaving the Canadian Forces on Demographics, Health, Military Career, and Post-Military Work Characteristics of VAC Client Sample (N=1072)a
Model 1 Model 2 Model 3 Model 4
Demographics Age .977*** .972*** .972*** .981*
(.007) (.007) (.007) (.008)
Marital Status (1=married/common law) 1.106 .998 1.029 1.041(.184) (.185) (.187) (.192)
Current Education (High School Not Completed) Completed High School Diploma 1.376 1.349 1.431 1.434
(.203) (.204) (.206) (.208) Some Post-Secondary 2.483*** 2.462*** 2.570*** 2.608***
(.194) (.195) (.199) (.201) Completed Post-Secondary Diploma 4.241*** 4.186*** 4.238*** 4.453***
(.202) (.203) (.206) (.208) Completed Bachelor's/Post-Graduate 5.693*** 5.586*** 7.911*** 8.928*** Diploma (.285) (.289) (.327) (.338)
Health Current Health (1=good/excellent) 1.024 1.031 1.036
(.153) (.162) (.163)
Current Level of Pain (None/Mild) Moderate .852 .862 .842
(.171) (.173) (.175) Severe .696 .715 .733
(.240) (.244) (.246)
Activities of Daily Living (Range: 0-14) 1.033 1.036 1.050(.036) (.036) (.037)
Medical Release Status (1=yes) .794 .761 .785(.154) (.156) (.157)
Military Career Rank on Date of Release (Non-Commissioned Officer or Below) Junior/Subordinate Officer .897 .907
(.204) (.207) General/Flag/Senior Officer .501** .554
(.239) (.248)
Number of Overseas Deployments .796*** .795***(.062) (.063)
Post-Military Work Characteristics Current Employment Status (Civilian Labour Force) Unemployed, But Looking for Work .889
(.252) Inactive .594***
(.161)
Income .927(.043)
Log Likelihood 1377.552 1372.227 1347.175 1335.255a Sample data are weighted and limited to male respondents who are age 65 or less and no longer actively serving in the Canadian Forces.* p<.05; ** p<.01; *** p<.001Note: Odds ratios are presented (their standard errors are in parentheses).

37
Model 1 suggests that age is a significant predictor of whether clients will complete further
education or training. Specifically, clients are slightly less likely (approximately 2%) to pursue
continued education for each additional year that they age. This may be indicative of retirement
or cohort effects of educational attainment, but it also reflects the idea that clients who are
released from the CF at younger ages typically need to enter the civilian labor force. Therefore,
pursuing continued education as a means to enhance one's occupational career is a goal for many
clients. (As noted earlier, 68% of clients who complete further education courses do so to
increase their chances of finding a job.) The relationship between age and continued education is
mediated by current employment status, which reflects this trend: clients who are inactive are
40% less likely to complete continued education or training than their employed counterparts.
Current level of education is significantly related to the completion of additional
coursework upon release from the CF. This association is linear, such that clients with higher
levels of education are more likely to have completed courses since release. Furthermore, there
appears to be a threshold effect: clients with a high school diploma are no more likely to have
taken further education courses than clients who have not finished high school. Again, this may
partially be due to a cohort effect with older clients reporting the lowest levels of educational
attainment. However, having some post-secondary education is associated with a great likelihood
of having taken further education or training since leaving the forces, and additional increases n
likelihood are evident for each further step-up in educational level. The available data do not
provide complete clarity as to the educational career of individual clients. It is likely that clients
who pursue continued education do so in a way that enhances overall educational attainment.
Without longitudinal data, we are uncertain as to whether educational attainment is a cause or
consequence of completing continued education or training.
38
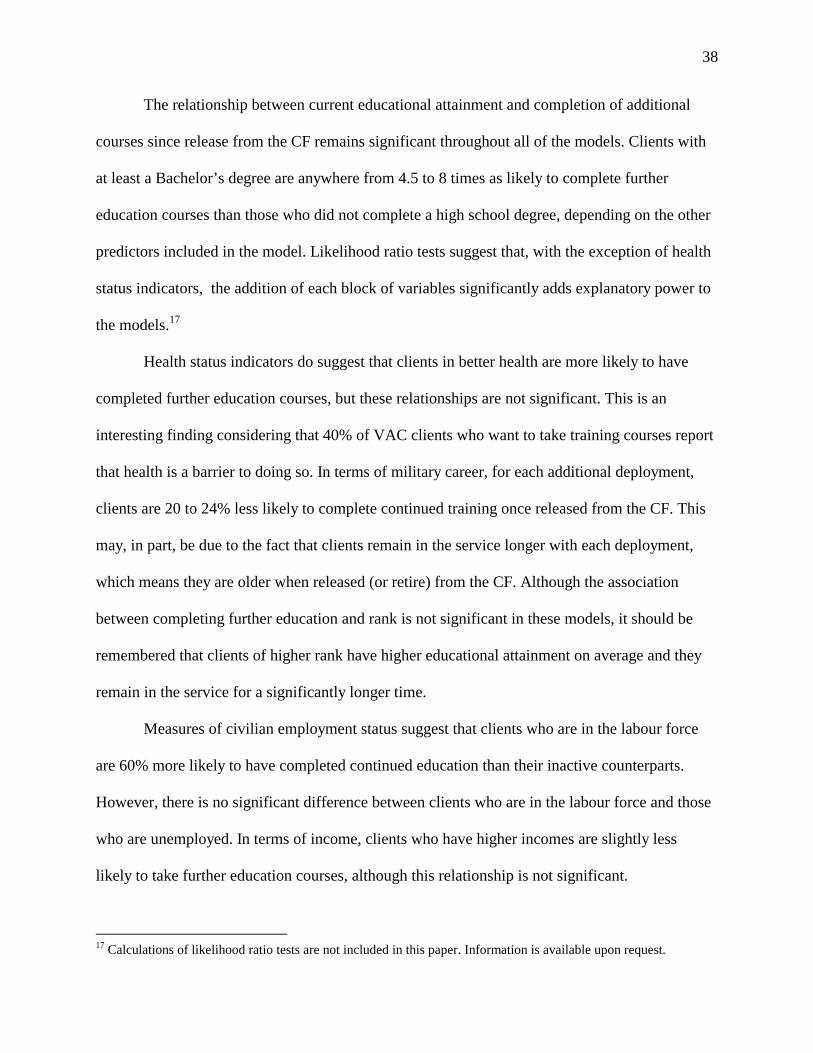
The relationship between current educational attainment and completion of additional
courses since release from the CF remains significant throughout all of the models. Clients with
at least a Bachelor’s degree are anywhere from 4.5 to 8 times as likely to complete further
education courses than those who did not complete a high school degree, depending on the other
predictors included in the model. Likelihood ratio tests suggest that, with the exception of health
status indicators, the addition of each block of variables significantly adds explanatory power to
the models.17
Health status indicators do suggest that clients in better health are more likely to have
completed further education courses, but these relationships are not significant. This is an
interesting finding considering that 40% of VAC clients who want to take training courses report
that health is a barrier to doing so. In terms of military career, for each additional deployment,
clients are 20 to 24% less likely to complete continued training once released from the CF. This
may, in part, be due to the fact that clients remain in the service longer with each deployment,
which means they are older when released (or retire) from the CF. Although the association
between completing further education and rank is not significant in these models, it should be
remembered that clients of higher rank have higher educational attainment on average and they
remain in the service for a significantly longer time.
Measures of civilian employment status suggest that clients who are in the labour force
are 60% more likely to have completed continued education than their inactive counterparts.
However, there is no significant difference between clients who are in the labour force and those
who are unemployed. In terms of income, clients who have higher incomes are slightly less
likely to take further education courses, although this relationship is not significant.
17 Calculations of likelihood ratio tests are not included in this paper. Information is available upon request.
39
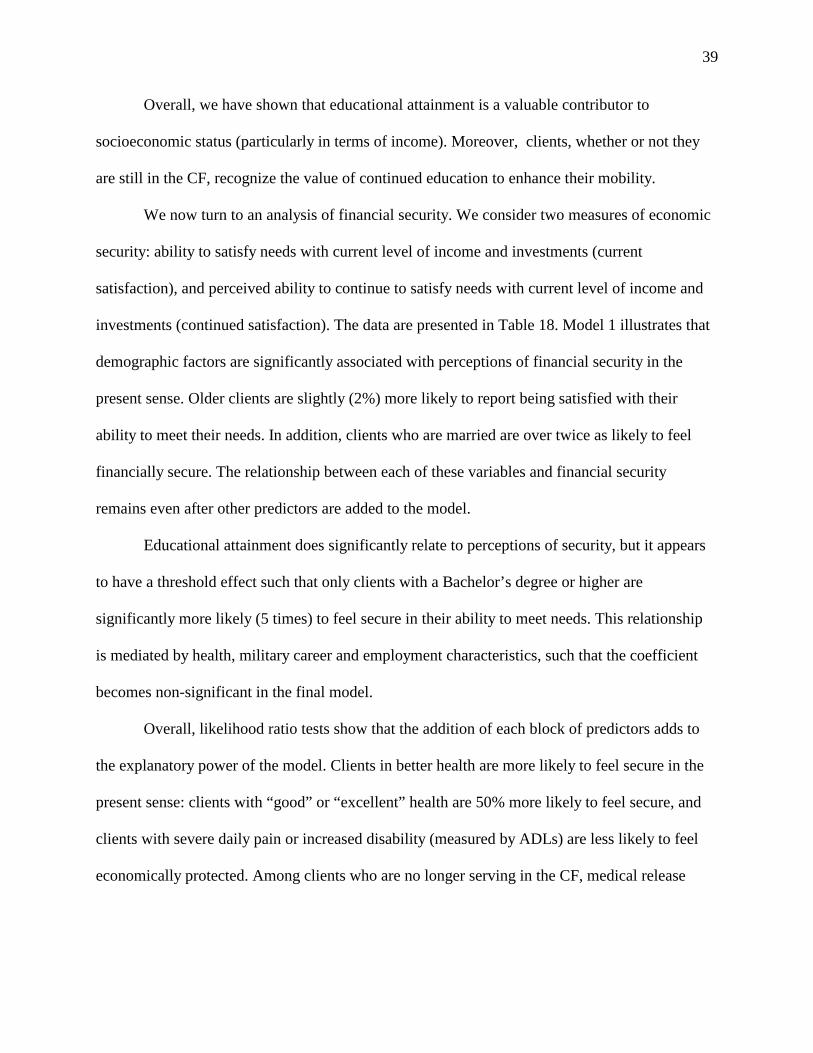
Overall, we have shown that educational attainment is a valuable contributor to
socioeconomic status (particularly in terms of income). Moreover, clients, whether or not they
are still in the CF, recognize the value of continued education to enhance their mobility.
We now turn to an analysis of financial security. We consider two measures of economic
security: ability to satisfy needs with current level of income and investments (current
satisfaction), and perceived ability to continue to satisfy needs with current level of income and
investments (continued satisfaction). The data are presented in Table 18. Model 1 illustrates that
demographic factors are significantly associated with perceptions of financial security in the
present sense. Older clients are slightly (2%) more likely to report being satisfied with their
ability to meet their needs. In addition, clients who are married are over twice as likely to feel
financially secure. The relationship between each of these variables and financial security
remains even after other predictors are added to the model.
Educational attainment does significantly relate to perceptions of security, but it appears
to have a threshold effect such that only clients with a Bachelor’s degree or higher are
significantly more likely (5 times) to feel secure in their ability to meet needs. This relationship
is mediated by health, military career and employment characteristics, such that the coefficient
becomes non-significant in the final model.
Overall, likelihood ratio tests show that the addition of each block of predictors adds to
the explanatory power of the model. Clients in better health are more likely to feel secure in the
present sense: clients with “good” or “excellent” health are 50% more likely to feel secure, and
clients with severe daily pain or increased disability (measured by ADLs) are less likely to feel
economically protected. Among clients who are no longer serving in the CF, medical release
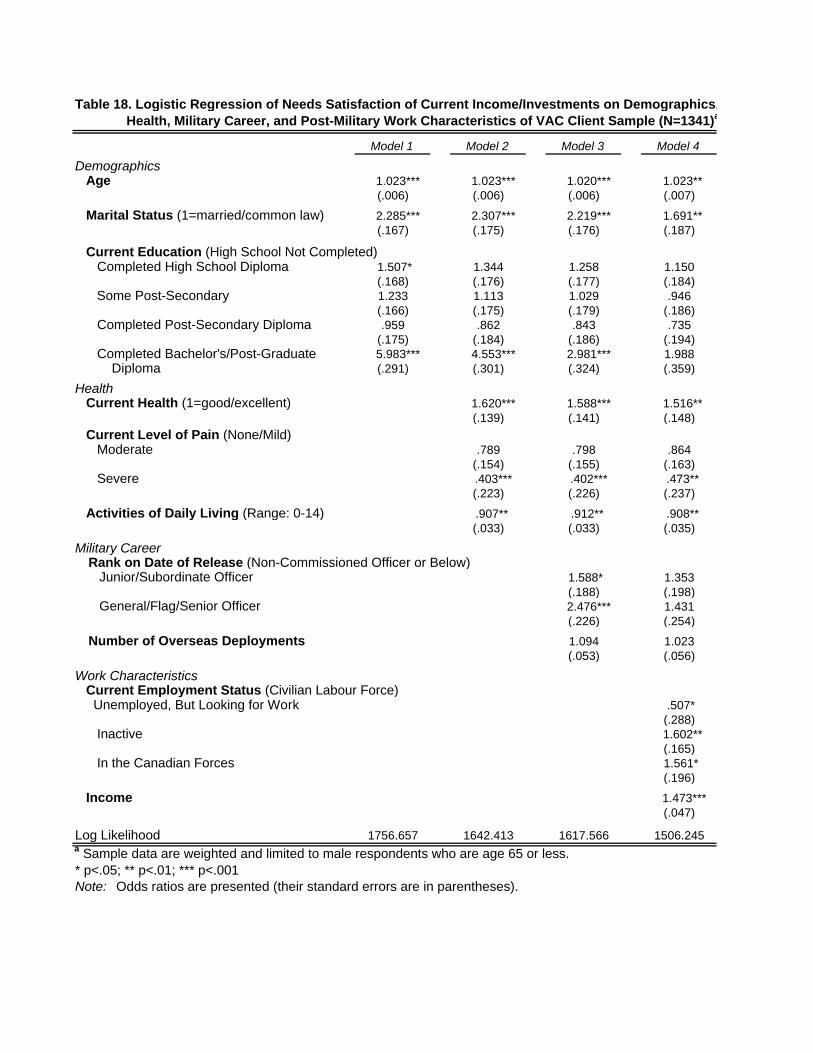
Table 18. Logistic Regression of Needs Satisfaction of Current Income/Investments on Demographics, Health, Military Career, and Post-Military Work Characteristics of VAC Client Sample (N=1341)a
Model 1 Model 2 Model 3 Model 4
Demographics Age 1.023*** 1.023*** 1.020*** 1.023**
(.006) (.006) (.006) (.007)
Marital Status (1=married/common law) 2.285*** 2.307*** 2.219*** 1.691**(.167) (.175) (.176) (.187)
Current Education (High School Not Completed) Completed High School Diploma 1.507* 1.344 1.258 1.150
(.168) (.176) (.177) (.184) Some Post-Secondary 1.233 1.113 1.029 .946
(.166) (.175) (.179) (.186) Completed Post-Secondary Diploma .959 .862 .843 .735
(.175) (.184) (.186) (.194) Completed Bachelor's/Post-Graduate 5.983*** 4.553*** 2.981*** 1.988 Diploma (.291) (.301) (.324) (.359)
Health Current Health (1=good/excellent) 1.620*** 1.588*** 1.516**
(.139) (.141) (.148)
Current Level of Pain (None/Mild) Moderate .789 .798 .864
(.154) (.155) (.163) Severe .403*** .402*** .473**
(.223) (.226) (.237)
Activities of Daily Living (Range: 0-14) .907** .912** .908**(.033) (.033) (.035)
Military Career Rank on Date of Release (Non-Commissioned Officer or Below) Junior/Subordinate Officer 1.588* 1.353
(.188) (.198) General/Flag/Senior Officer 2.476*** 1.431
(.226) (.254)
Number of Overseas Deployments 1.094 1.023(.053) (.056)
Work Characteristics Current Employment Status (Civilian Labour Force) Unemployed, But Looking for Work .507*
(.288) Inactive 1.602**
(.165) In the Canadian Forces 1.561*
(.196)
Income 1.473***(.047)
Log Likelihood 1756.657 1642.413 1617.566 1506.245a Sample data are weighted and limited to male respondents who are age 65 or less.* p<.05; ** p<.01; *** p<.001Note: Odds ratios are presented (their standard errors are in parentheses).
41
status predicts lower security, but this relationship is mediated by military career and post-
military employment characteristics (See Table 18A in Appendix).
In terms of military careers, clients with a higher rank are more likely to feel secure
economically. Compared to non-commissioned officers, junior or subordinate officers are 59%
more likely to feel secure and general, flag, or senior officers are 148% more likely to feel
economically satisfied. Being deployed overseas is not significantly associated with feelings of
security. Being in the service also predicts a sense of financial security: clients who remain in the
service are 50% more likely to be confident in their ability to meet current needs than clients
who are in the civilian labour force.
Both of the work characteristics included in the model are significantly associated with
feelings of security. Clients who are unemployed are half as likely to be satisfied with their
ability to meet current needs compared to those in the civilian labour force. Clients who consider
themselves to be inactive are 60% more likely to feel they can meet their needs, which may be
indicative of a selection effect: clients may become “inactive” (or retire) only if they feel
financially able to do so.
Considering the above analysis, similar models predict clients’ perceptions of their ability
to meet economic needs into the future (See Table 19). Age and marital status have a similar
relationship with continued security as with current ability to meet needs. Older clients are about
2% more likely to feel they are able to satisfy their needs into the future; and those who are
married are 54% more likely to feel positive about their economic futures. In this model, the
association between educational attainment and financial security is similar to the previous
analysis, but the relationship remains statistically significant for clients who have at least a
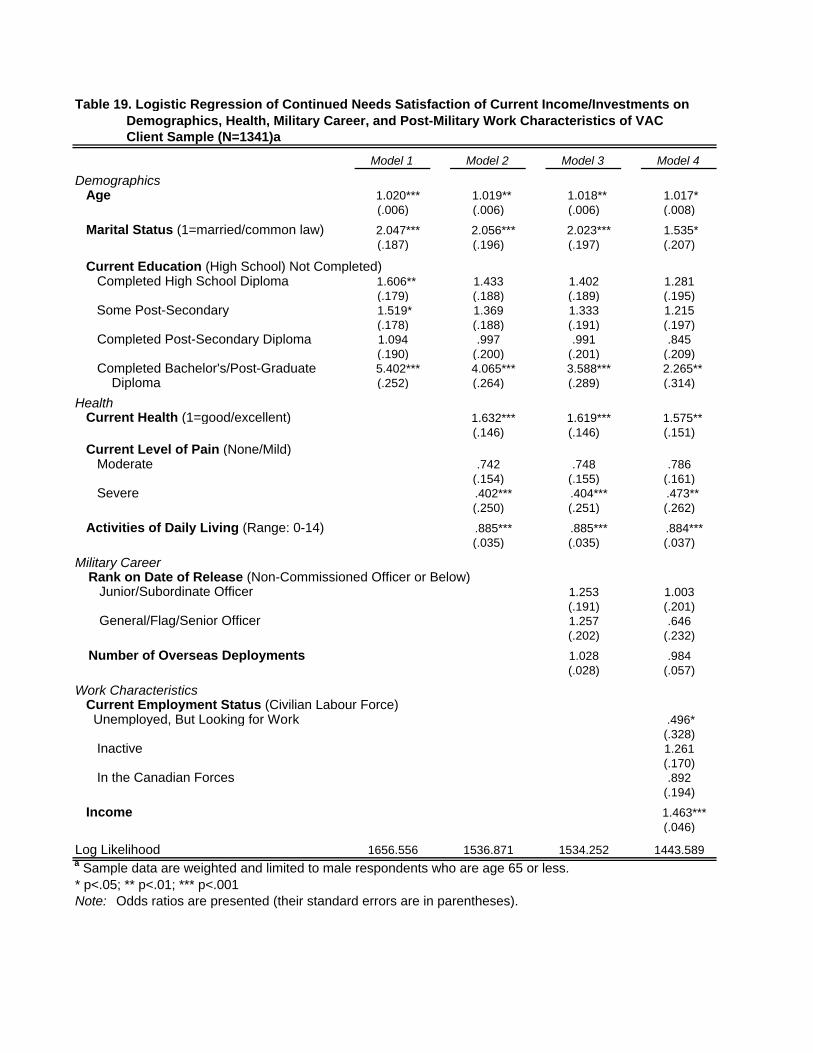
Table 19. Logistic Regression of Continued Needs Satisfaction of Current Income/Investments on Demographics, Health, Military Career, and Post-Military Work Characteristics of VAC Client Sample (N=1341)a
Model 1 Model 2 Model 3 Model 4
Demographics Age 1.020*** 1.019** 1.018** 1.017*
(.006) (.006) (.006) (.008)
Marital Status (1=married/common law) 2.047*** 2.056*** 2.023*** 1.535*(.187) (.196) (.197) (.207)
Current Education (High School) Not Completed) Completed High School Diploma 1.606** 1.433 1.402 1.281
(.179) (.188) (.189) (.195) Some Post-Secondary 1.519* 1.369 1.333 1.215
(.178) (.188) (.191) (.197) Completed Post-Secondary Diploma 1.094 .997 .991 .845
(.190) (.200) (.201) (.209) Completed Bachelor's/Post-Graduate 5.402*** 4.065*** 3.588*** 2.265** Diploma (.252) (.264) (.289) (.314)
Health Current Health (1=good/excellent) 1.632*** 1.619*** 1.575**
(.146) (.146) (.151)
Current Level of Pain (None/Mild) Moderate .742 .748 .786
(.154) (.155) (.161) Severe .402*** .404*** .473**
(.250) (.251) (.262)
Activities of Daily Living (Range: 0-14) .885*** .885*** .884***(.035) (.035) (.037)
Military Career Rank on Date of Release (Non-Commissioned Officer or Below) Junior/Subordinate Officer 1.253 1.003
(.191) (.201) General/Flag/Senior Officer 1.257 .646
(.202) (.232)
Number of Overseas Deployments 1.028 .984(.028) (.057)
Work Characteristics Current Employment Status (Civilian Labour Force) Unemployed, But Looking for Work .496*
(.328) Inactive 1.261
(.170) In the Canadian Forces .892
(.194)
Income 1.463***(.046)
Log Likelihood 1656.556 1536.871 1534.252 1443.589a Sample data are weighted and limited to male respondents who are age 65 or less.* p<.05; ** p<.01; *** p<.001Note: Odds ratios are presented (their standard errors are in parentheses).
43
Bachelor’s degree even with all other predictors included in the model. Clients with the highest
level of education are 127% more likely to feel able to meet their needs into the future when
compared to those who have not completed high school. Again, we see that obtaining a
university degree is a protective factor for not only socioeconomic status (measured by income),
but also for perceptions of financial security.
Each block of predictors significantly improves the fit of the model (as calculated by
likelihood ratio tests), with the exception of military career markers. Although military service
provides a “safety net” to clients in the immediate sense, respondents feel that this protective
factor will not exist once they are released from the CF. Clients who are in the CF do not differ
significantly in their perceived ability to meet needs into the future when compared to those in
the civilian labour force; this differs from the previous analysis, where being in the service
allowed clients to feel more secure in their ability to meet needs (See Table 18). Furthermore,
none of the markers of military service are significant in this analysis.
Health is again a major predictor of perceived security. In previous research we found
that health status is a strong indicator of clients’ beliefs about challenges to civilian life. 18
Furthermore, the complex relationship between health and socioeconomic status may be
magnified in a sample of men who are at some level of disability at the outset of the analysis (as
evidenced by being a VAC client). Being removed from military service prior from intended
release due to injury leaves clients vulnerable and unprepared in terms of both experience and
ability in the civilian labor force and socioeconomic status.
18 Marshall, Victor W., Rebecca A. Matteo, and David Pedlar “Work-related Experience and Financial Security of Veterans Affairs Canada Clients: Contrasting Medical and Non-Medical Discharge” Unpublished manuscript of paper for presentation at Canadian Association on Gerontology Annual Scientific and Educational Meetings, Montreal, Quebec, October 2002.
44
The influence of work characteristics holds relatively constant whether considering all
clients or limiting the analysis to those who are no longer serving. (See Table 19A in Appendix.)
The additional variables of medical release status, completion of further education or training,
and making preparations for release do not add significantly to the understanding of financial
security. However, income remains a powerful resource in terms of financial security into the
future: client are 46% more likely to feel they will be able to meet their needs into the future with
each additional $10,000 in annual income.
45
V. Conclusions
The Canadian Forces Survey of Veterans Affairs Canada Clients was conducted in 1999 in an
attempt to better understand the needs of VAC clients. It is probably fair to say that interest by
VAC officials in the specific issues addressed in this paper has risen dramatically since the
survey was carried out. The survey is far from ideal to address the complex relationships linking
education, service in the Canadian Forces, release factors, health, and dimensions of income
security. The survey was not designed with the specific intent to examine these relationships. An
ideal survey would have included measures that are not available to us in this instance, for
example in leaving us without the ability to separate educational attainment while in the CF from
that attained subsequent to release. The cross-sectional nature of the survey makes it difficult to
sort out causation. With these restrictions in mind, we have attempted to assess the importance of
education for economic outcomes such as employment, income and feelings of economic
security; and we have sought to identify the factors associated with variability in educational
attainment.
Veterans Affairs Canada launched a Service and Program Modernization Task Force in
September of 2003, with a mandate to "develop a comprehensive and improved suite of
programs and services to aid the successful transition of CF members and families to civilian
life".19 Our analysis has attempted to provided a better understanding of three markers of
successful transitions to civilian life: having work, having sufficient income, and feeling secure
about one's economic status and future. We have focused on the importance of education as a
'social determinant' of these three things and, while the methodological issues noted above have
let us to be somewhat restrained in our interpretation, we feel we have established some of the
19 Quoted in Honouring Canada's Commitment: "Opportunity with Security" for Canadian Forces Veterans and Their Families in the 21st Century. A Discussion Paper prepared by the Canadian Forces Advisory Council of Veterans Affairs Canada, March 2004, pp. 25-26.
46
ways in which education important for the attainment of success after release from the Canadian
Forces as a VAC client.
From a purely descriptive point of view, many VAC clients are poorly educated, and
lower educational status is associated with cohort-- older VAC clients are more likely to have
entered the service with lower educational attainment than younger, more recent entrants.
Controlling for a number of other factors, including different dimensions of health, rank, and
post-military work characteristics for those who have left the CF, education has a strong
relationship to personal income, and for those who have left the CF, it is attaining at least some
post-secondary education that makes a difference in the first instance. It is not surprising that
any increase in the level of additional educational attainment is associated with higher income
when all clients are considered, but that for those who have left the CF, the initial threshold is not
completing high school but having completed at least some post-secondary education (compare
Tables 16A and 16B). For the released clients or for the somewhat larger group that includes
clients still in the forces, past the first threshold every increment in educational attainment is
associated with higher personal income.
The policy implication is that if the Canadian Forces with to enhance the ability of its
serving members to enjoy economic security, it should invest in education. The key to post-
secondary education is of course that one must first have completed high school. If every
serving member of the CF had the opportunity to at least complete high school, the transition
process would likely have more positive economic outcomes than is currently the case. As we
showed in the analysis of factors associated with taking further education and training after
discharge from the CF (Table 17), educational attainment has a multiplier effect-- the higher the
47
educational attainment, the more likely is a respondent to take additional education or training
post-discharge.
Satisfaction with current or future income and investments is associated with education in
a simple model (Tables 18 and 18A and 19 and 19A) but significance of education effects
disappears when other factors are entered into the equations: health status; rank while in the
service; whether one is working in the civilian labour force, inactive or in the CF; and not
surprisingly, personal income. As many of these factors are related to education this suggests
indirect pathways through which education influences one's feelings or current economic
security. It should also be noted that those who report severe pain are much less likely to be
satisfied with their current income and investments. This suggests that pain is an important factor
affecting ability to work following release from the Canadian Forces.
In epidemiological terms, low education can be seen as a risk factor increasing the
likelihood of objective and subjective economic hardship for CF clients of VAC. The Canadian
Forces, like any modern military service, can be characterized as an educational institution with
ongoing, continuous education. Many in the service are recruited at low levels of education,
with only high school education or less than completed secondary education. From the survey
data we have examined it can plausibly by suggested that education has direct positive effects
that increase economic well-being after discharge, and indirect effects as well, in that education
provides a stimulus and background supportive of more education-- those who have an education
are likely to attain more, and the more one has, the more additional advantage one will have.
From a policy perspective it may thus follow that, if the Canadian Forces and Veterans Affairs
Canada wish to facilitate a smooth transition out of the forces, it may be desirable to encourage
high school and perhaps secondary education for those still actively serving, as well as to make it

48
easier for those who are discharged to complete high school and go on to post-secondary
education.

49
Appendix (Additional Tables) Tables 2C and 2D. Additional tables as discussed in Section I in relation to cohort effects on
educational attainment.
Table 2C. Level of Education Upon Entry to CF by Age (in Categories).
Age Category
Education Level Upon Entry to CF < 35 35 - 44 45 – 54 55 + Total
High School Not Completed
33 20.6%
130 35.7%
206 45.7%
409 51.4%
778 44.0%
Completed High School
79 49.4%
115 31.6%
122 27.1%
180 22.6%
496 28.0%
Some Post-Secondary
31 19.4%
67 18.4%
58 12.9%
108 13.6%
264 14.9%
Completed Post-Secondary
11 6.9%
43 11.8%
42 9.3%
72 9.1%
168 9.5%
Bachelor’s or Post-Graduate Degree
6 3.8%
9 2.5%
23 5.1%
26 3.3%
64 3.6%
Total 160 100.0%
364 100.0%
451 100.0%
795 100.0%
1770 100.0%
Missing cases (N=76) including 4 cases of inconsistent data for “Level of Education Upon Entry into CF.”
chi-square 87.002 *** Cramer’s V .128 ***
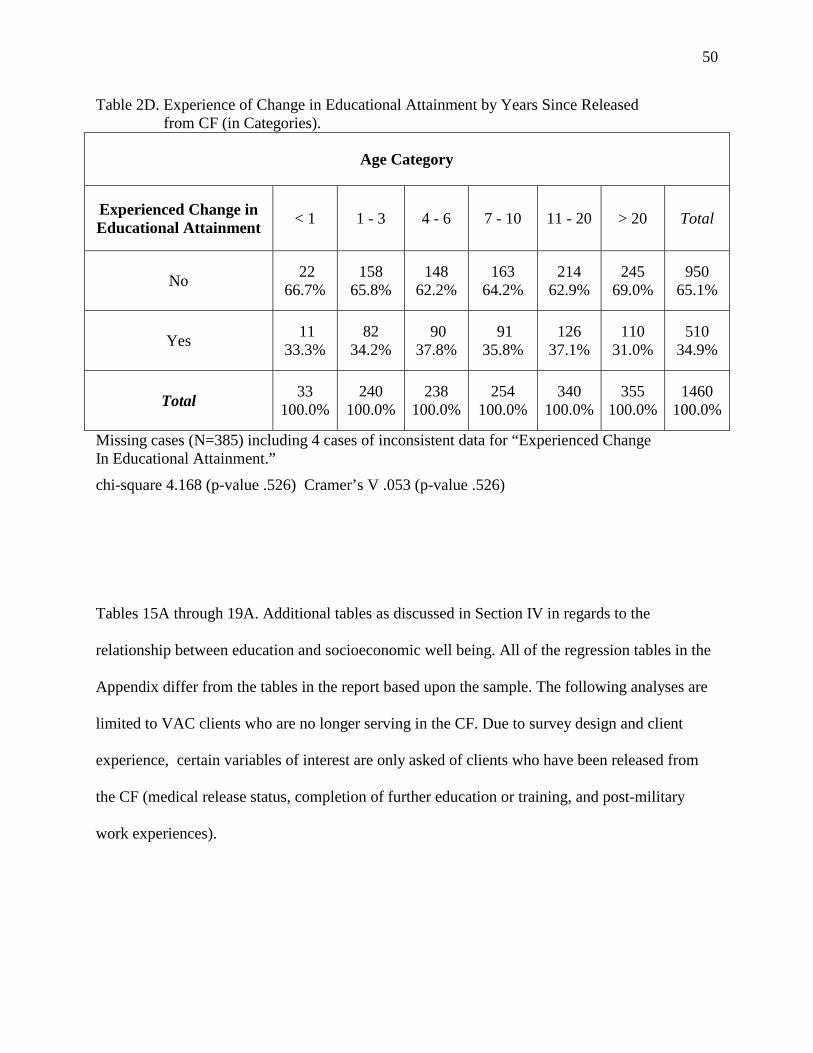
50
Table 2D. Experience of Change in Educational Attainment by Years Since Released from CF (in Categories).
Age Category
Experienced Change in Educational Attainment < 1 1 - 3 4 - 6 7 - 10 11 - 20 > 20 Total
No 22 66.7%
158 65.8%
148 62.2%
163 64.2%
214 62.9%
245 69.0%
950 65.1%
Yes 11 33.3%
82 34.2%
90 37.8%
91 35.8%
126 37.1%
110 31.0%
510 34.9%
Total 33 100.0%
240 100.0%
238 100.0%
254 100.0%
340 100.0%
355 100.0%
1460 100.0%
Missing cases (N=385) including 4 cases of inconsistent data for “Experienced Change In Educational Attainment.”
chi-square 4.168 (p-value .526) Cramer’s V .053 (p-value .526)
Tables 15A through 19A. Additional tables as discussed in Section IV in regards to the
relationship between education and socioeconomic well being. All of the regression tables in the
Appendix differ from the tables in the report based upon the sample. The following analyses are
limited to VAC clients who are no longer serving in the CF. Due to survey design and client
experience, certain variables of interest are only asked of clients who have been released from
the CF (medical release status, completion of further education or training, and post-military
work experiences).
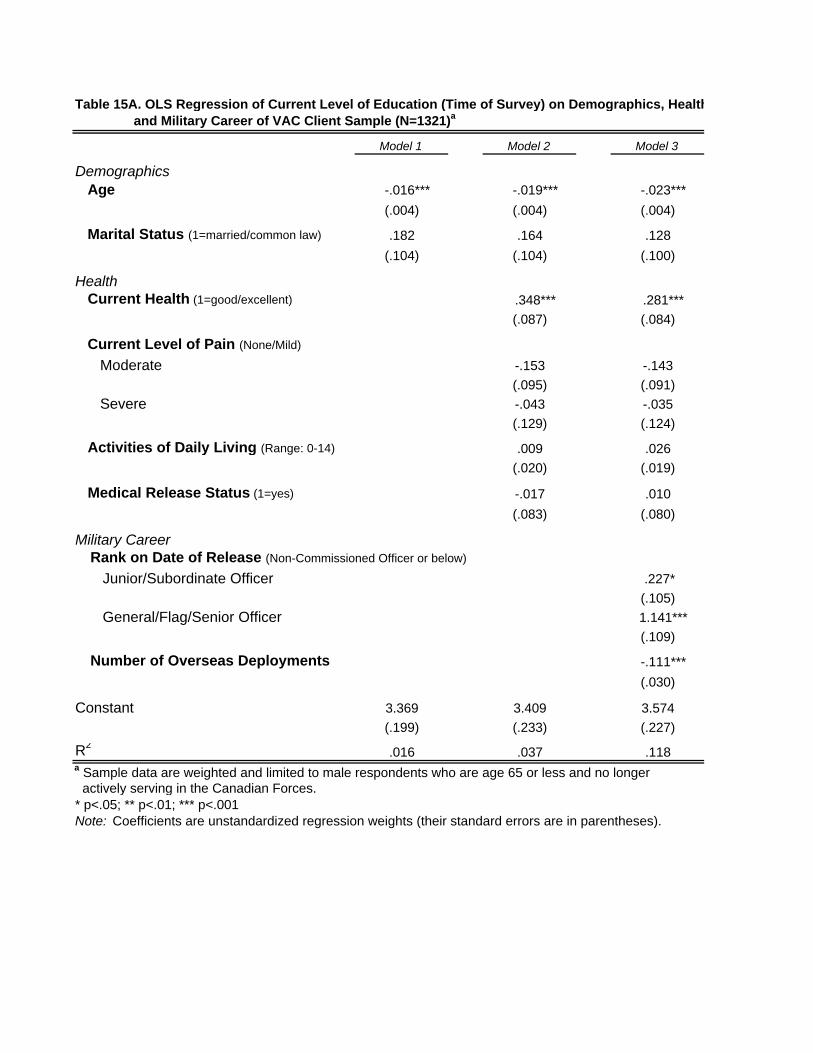
Table 15A. OLS Regression of Current Level of Education (Time of Survey) on Demographics, Health and Military Career of VAC Client Sample (N=1321)a
Model 1 Model 2 Model 3
Demographics Age -.016*** -.019*** -.023***
(.004) (.004) (.004)
Marital Status (1=married/common law) .182 .164 .128
(.104) (.104) (.100)
Health Current Health (1=good/excellent) .348*** .281***
(.087) (.084)
Current Level of Pain (None/Mild)
Moderate -.153 -.143
(.095) (.091)
Severe -.043 -.035
(.129) (.124)
Activities of Daily Living (Range: 0-14) .009 .026
(.020) (.019)
Medical Release Status (1=yes) -.017 .010
(.083) (.080)
Military Career Rank on Date of Release (Non-Commissioned Officer or below)
Junior/Subordinate Officer .227*
(.105)
General/Flag/Senior Officer 1.141***
(.109)
Number of Overseas Deployments -.111***
(.030)
Constant 3.369 3.409 3.574
(.199) (.233) (.227)
R2.016 .037 .118
a Sample data are weighted and limited to male respondents who are age 65 or less and no longer actively serving in the Canadian Forces.* p<.05; ** p<.01; *** p<.001Note: Coefficients are unstandardized regression weights (their standard errors are in parentheses).
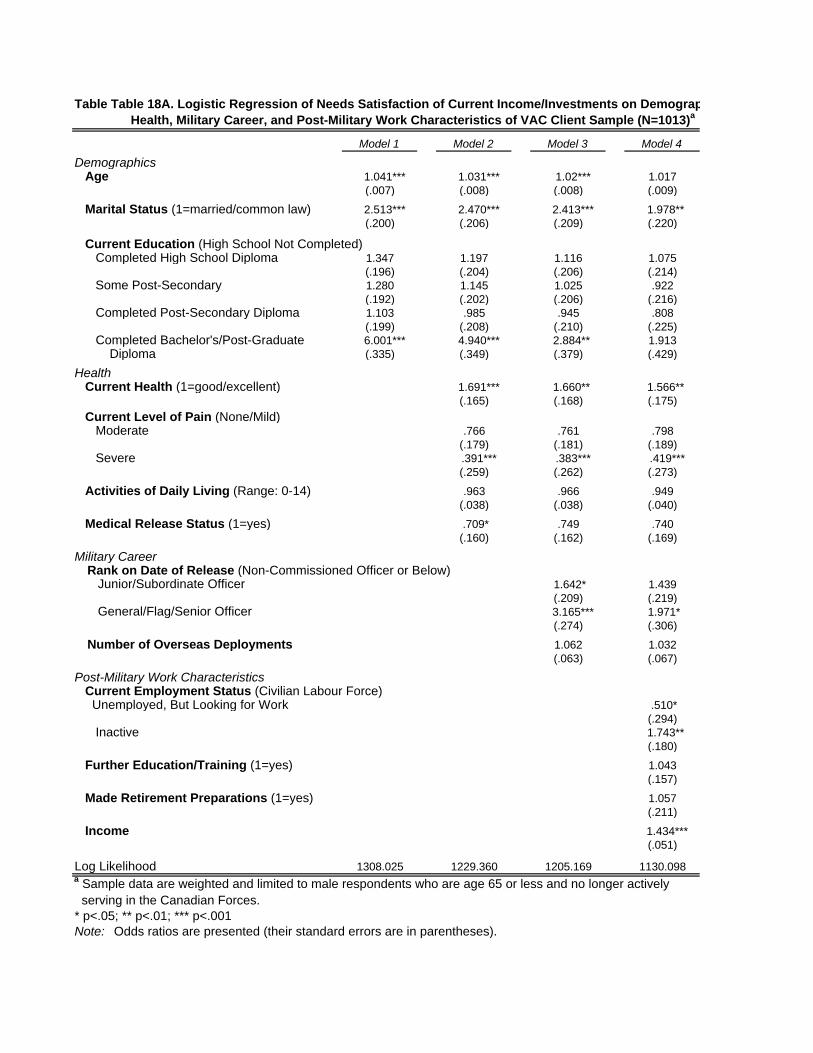
Table Table 18A. Logistic Regression of Needs Satisfaction of Current Income/Investments on Demographics, Health, Military Career, and Post-Military Work Characteristics of VAC Client Sample (N=1013)a
Model 1 Model 2 Model 3 Model 4
Demographics Age 1.041*** 1.031*** 1.02*** 1.017
(.007) (.008) (.008) (.009)
Marital Status (1=married/common law) 2.513*** 2.470*** 2.413*** 1.978**(.200) (.206) (.209) (.220)
Current Education (High School Not Completed) Completed High School Diploma 1.347 1.197 1.116 1.075
(.196) (.204) (.206) (.214) Some Post-Secondary 1.280 1.145 1.025 .922
(.192) (.202) (.206) (.216) Completed Post-Secondary Diploma 1.103 .985 .945 .808
(.199) (.208) (.210) (.225) Completed Bachelor's/Post-Graduate 6.001*** 4.940*** 2.884** 1.913 Diploma (.335) (.349) (.379) (.429)
Health Current Health (1=good/excellent) 1.691*** 1.660** 1.566**
(.165) (.168) (.175)
Current Level of Pain (None/Mild) Moderate .766 .761 .798
(.179) (.181) (.189) Severe .391*** .383*** .419***
(.259) (.262) (.273)
Activities of Daily Living (Range: 0-14) .963 .966 .949(.038) (.038) (.040)
Medical Release Status (1=yes) .709* .749 .740(.160) (.162) (.169)
Military Career Rank on Date of Release (Non-Commissioned Officer or Below) Junior/Subordinate Officer 1.642* 1.439
(.209) (.219) General/Flag/Senior Officer 3.165*** 1.971*
(.274) (.306)
Number of Overseas Deployments 1.062 1.032(.063) (.067)
Post-Military Work Characteristics Current Employment Status (Civilian Labour Force) Unemployed, But Looking for Work .510*
(.294) Inactive 1.743**
(.180)
Further Education/Training (1=yes) 1.043(.157)
Made Retirement Preparations (1=yes) 1.057(.211)
Income 1.434***(.051)
Log Likelihood 1308.025 1229.360 1205.169 1130.098a Sample data are weighted and limited to male respondents who are age 65 or less and no longer actively serving in the Canadian Forces.* p<.05; ** p<.01; *** p<.001Note: Odds ratios are presented (their standard errors are in parentheses).
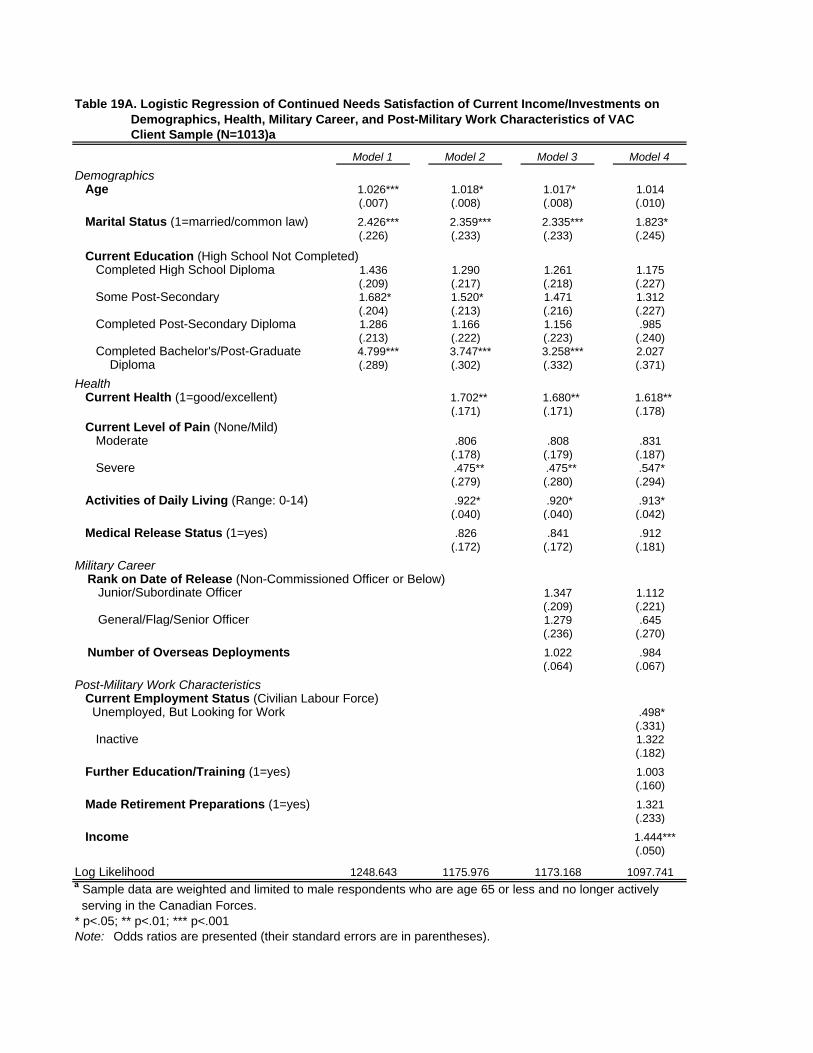
Table 19A. Logistic Regression of Continued Needs Satisfaction of Current Income/Investments on Demographics, Health, Military Career, and Post-Military Work Characteristics of VAC Client Sample (N=1013)a
Model 1 Model 2 Model 3 Model 4
Demographics Age 1.026*** 1.018* 1.017* 1.014
(.007) (.008) (.008) (.010)
Marital Status (1=married/common law) 2.426*** 2.359*** 2.335*** 1.823*(.226) (.233) (.233) (.245)
Current Education (High School Not Completed) Completed High School Diploma 1.436 1.290 1.261 1.175
(.209) (.217) (.218) (.227) Some Post-Secondary 1.682* 1.520* 1.471 1.312
(.204) (.213) (.216) (.227) Completed Post-Secondary Diploma 1.286 1.166 1.156 .985
(.213) (.222) (.223) (.240) Completed Bachelor's/Post-Graduate 4.799*** 3.747*** 3.258*** 2.027 Diploma (.289) (.302) (.332) (.371)
Health Current Health (1=good/excellent) 1.702** 1.680** 1.618**
(.171) (.171) (.178)
Current Level of Pain (None/Mild) Moderate .806 .808 .831
(.178) (.179) (.187) Severe .475** .475** .547*
(.279) (.280) (.294)
Activities of Daily Living (Range: 0-14) .922* .920* .913*(.040) (.040) (.042)
Medical Release Status (1=yes) .826 .841 .912(.172) (.172) (.181)
Military Career Rank on Date of Release (Non-Commissioned Officer or Below) Junior/Subordinate Officer 1.347 1.112
(.209) (.221) General/Flag/Senior Officer 1.279 .645
(.236) (.270)
Number of Overseas Deployments 1.022 .984(.064) (.067)
Post-Military Work Characteristics Current Employment Status (Civilian Labour Force) Unemployed, But Looking for Work .498*
(.331) Inactive 1.322
(.182)
Further Education/Training (1=yes) 1.003(.160)
Made Retirement Preparations (1=yes) 1.321(.233)
Income 1.444***(.050)
Log Likelihood 1248.643 1175.976 1173.168 1097.741a Sample data are weighted and limited to male respondents who are age 65 or less and no longer actively serving in the Canadian Forces.* p<.05; ** p<.01; *** p<.001Note: Odds ratios are presented (their standard errors are in parentheses).


