CANADIAN AMMONIA PRODUCERS … AMMONIA PRODUCERS BENCHMARKING ENERGY EFFICIENCY AND CARBON DIOXIDE...
34
CANADIAN AMMONIA PRODUCERS BENCHMARKING ENERGY EFFICIENCY AND CARBON DIOXIDE EMISSIONS PREPARED FOR THE CANADIAN FERTILIZER INSTITUTE AND NATURAL RESOURCES CANADA
Transcript of CANADIAN AMMONIA PRODUCERS … AMMONIA PRODUCERS BENCHMARKING ENERGY EFFICIENCY AND CARBON DIOXIDE...

CANADIAN AMMONIA PRODUCERS
BENCHMARKING ENERGY EFFICIENCY ANDCARBON DIOXIDE EMISSIONS
PREPARED FOR THE CANADIAN FERTILIZER INSTITUTE ANDNATURAL RESOURCES CANADA

In co-operation with the Canadian Fertilizer Institute and the Canadian Industry Program for Energy Conservation
For more information or to receive additional copies of this publication, write to:
Canadian Industry Program for Energy ConservationOffice of Energy Efficiency c/o Natural Resources Canada 580 Booth Street, 18th Floor Ottawa ON K1A 0E4
Tel.: 613-995-6839Fax: 613-992-3161E-mail: [email protected] site: oee.nrcan.gc.ca/cipec
or
Canadian Fertilizer Institute 350 Sparks Street, Suite 802Ottawa ON K1R 7S8
Tel.: 613-230-2600Fax: 613-230-5142E-mail: [email protected] site: www.cfi.ca
Photo credits: Canadian Fertilizer Ltd. and Agrium Inc.
Aussi disponible en français sous le titre : Les Producteurs Canadiens d’ammoniac – Analyse comparative de l’efficacité énergétique et des émissions de dioxyde de carbone
Library and Archives Canada Cataloguing in Publication
Canadian ammonia producers : benchmarking energy efficiency and carbon dioxide emissions / prepared for the Canadian Fertilizer Institute and Natural Resources Canada.
Published by the Canadian Industry Program for Energy Conservation. Includes bibliographical references: p. 30
Cat. No. M144-155/2007E-PDF (Online) ISBN 978-0-662-46150-0
1. Ammonia industry--Energy consumption--Canada. 2. Ammonia industry--Waste disposal--Canada. 3. Carbon dioxide--Environmental aspects--Canada. 4. Energy auditing--Canada. I. Canadian FertilizerInstitute II. Canadian Industry Program for Energy Conservation III. Canada. Natural Resources Canada IV. Title: Benchmarking energy efficiency and carbon dioxide emissions.
TJ163.5.S83B46 2007 338.4’7661340682 C2007-980160-9
© Her Majesty the Queen in Right of Canada, 2008
Recycled paper

Natural Resources Canada’s Office of Energy EfficiencyLeading Canadians to Energy Efficiency at Home, at Work and on the Road
TABLE OF CONTENTS
1. INTRODUCTION . . . . . . . . . . . . . . . . . . . . . . . . . . . . . . . . . . . . . . . . . . . . . . . . . . . . . . . . 2
1.1 The Canadian Ammonia Industry . . . . . . . . . . . . . . . . . . . . . . . . . . . . . . . . . . . . . . . 2
1.2 Energy Consumption and Carbon Dioxide Emissions in Ammonia Production . . . . . 3
2. THE BENCHMARKING STUDY . . . . . . . . . . . . . . . . . . . . . . . . . . . . . . . . . . . . . . . . . . . . . . 6
2.1 Objectives of the Study . . . . . . . . . . . . . . . . . . . . . . . . . . . . . . . . . . . . . . . . . . . . . . . 6
2.2 Methodology . . . . . . . . . . . . . . . . . . . . . . . . . . . . . . . . . . . . . . . . . . . . . . . . . . . . . . 7
3. BENCHMARKING RESULTS . . . . . . . . . . . . . . . . . . . . . . . . . . . . . . . . . . . . . . . . . . . . . . . 10
Section 3.1: Benchmarking Energy Efficiency and CO2 Emissions of Canadian Ammonia Producers (2000–2002) . . . . . . . . . . . . . . . . . . . . . 11
3.1.1 Ammonia Production and Energy Use . . . . . . . . . . . . . . . . . . . . . . . . . . . . . . 12
3.1.2 Ammonia Production and CO2 Emissions . . . . . . . . . . . . . . . . . . . . . . . . . . . 13
Section 3.2: Global Energy Efficiency and CO2 Emissions Comparisons (2002) . . . . . . . 15
3.2.1 Ammonia Production Energy Efficiencies . . . . . . . . . . . . . . . . . . . . . . . . . . . 15
3.2.2 Estimated CO2 Emissions From Ammonia Production . . . . . . . . . . . . . . . . . 16
Section 3.3: “World Top” Performance and Future Projections . . . . . . . . . . . . . . . . . . 19
3.3.1 Worldwide Benchmarking . . . . . . . . . . . . . . . . . . . . . . . . . . . . . . . . . . . . . . . 19
3.3.2 Canada in “World Top” Rankings . . . . . . . . . . . . . . . . . . . . . . . . . . . . . . . . . 19
3.3.3 The Future of Ammonia Plant Low-Energy Designs . . . . . . . . . . . . . . . . . . . 20
APPENDICES . . . . . . . . . . . . . . . . . . . . . . . . . . . . . . . . . . . . . . . . . . . . . . . . . . . . . . . . . 24
APPENDIX A: ABBREVIATIONS . . . . . . . . . . . . . . . . . . . . . . . . . . . . . . . . . . . . . . . . . . . . . . 24
APPENDIX B: PLANT SURVEYS INTERNATIONAL’S AMMONIA PLANT ENERGY EFFICIENCYNORMALIZATION METHODOLOGY . . . . . . . . . . . . . . . . . . . . . . . . . . . . . . . . . . . 25
APPENDIX C: HISTORICAL DATA . . . . . . . . . . . . . . . . . . . . . . . . . . . . . . . . . . . . . . . . . . . . . 29
APPENDIX D: REFERENCES . . . . . . . . . . . . . . . . . . . . . . . . . . . . . . . . . . . . . . . . . . . . . . . . 30
CANADIAN AMMONIA PRODUCERS – BENCHMARKING ENERGY EFFICIENCY AND CARBON DIOXIDE EMISSIONS


INTRODUCTION1
1. INTRODUCTION
Canada supplies approximately 12 percent of the world’s fertilizer materials. The fertilizerindustry contributes over $6 billion annually to the Canadian economy. Most Canadianfertilizer material production is in the form of either nitrogen or potash. Ammonia (NH3)is an important nitrogen fertilizer and is the basic building block used in downstreamnitrogen fertilizer production. Ammonia production is the most energy-intensive step innitrogen fertilizer production.
Natural Resources Canada’s (NRCan’s) Office of Energy Efficiency (OEE) has workedwith the Canadian Fertilizer Institute (CFI) by providing assistance for this study, which ispart of NRCan’s ongoing effort to promote more efficient energy use in Canada. Thisdocument presents the results of the energy efficiency and carbon dioxide (CO2) emissionsbenchmarking of the Canadian ammonia production industry. The potash industry’s energybenchmarking results are published under separate cover.
1.1 The Canadian Ammonia Industry
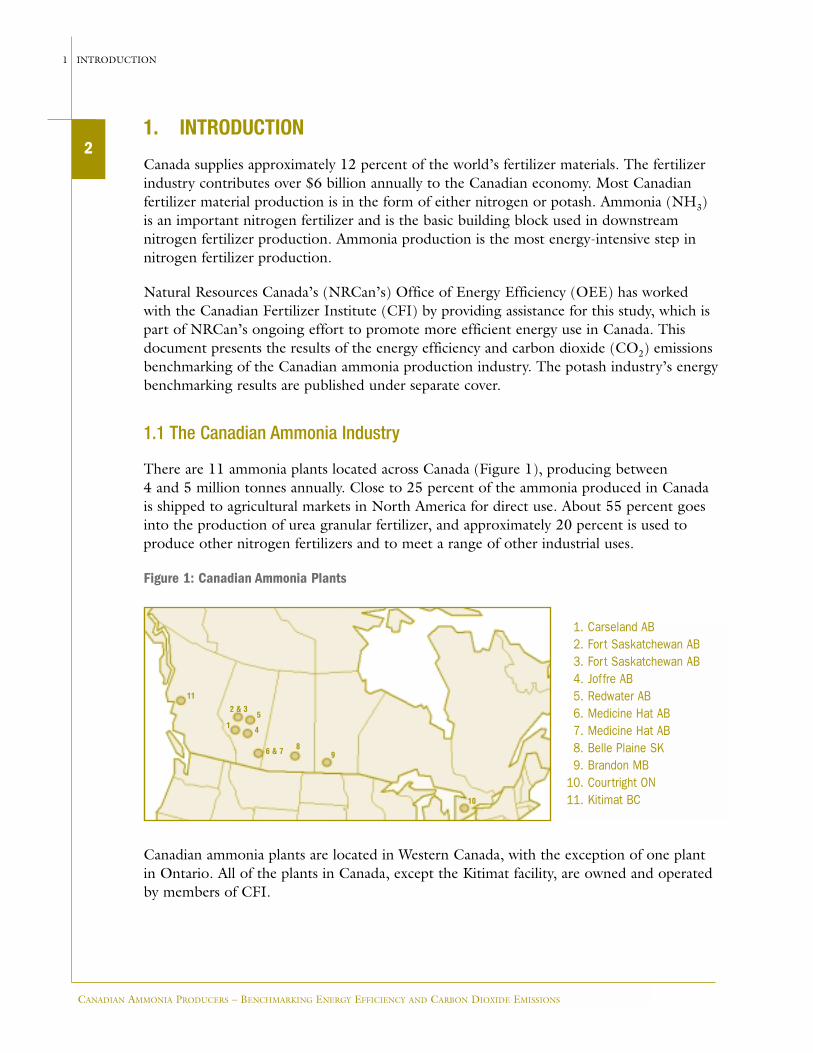
There are 11 ammonia plants located across Canada (Figure 1), producing between 4 and 5 million tonnes annually. Close to 25 percent of the ammonia produced in Canadais shipped to agricultural markets in North America for direct use. About 55 percent goesinto the production of urea granular fertilizer, and approximately 20 percent is used toproduce other nitrogen fertilizers and to meet a range of other industrial uses.
Figure 1: Canadian Ammonia Plants
Canadian ammonia plants are located in Western Canada, with the exception of one plantin Ontario. All of the plants in Canada, except the Kitimat facility, are owned and operatedby members of CFI.
2
CANADIAN AMMONIA PRODUCERS – BENCHMARKING ENERGY EFFICIENCY AND CARBON DIOXIDE EMISSIONS
1 INTRODUCTION
1. Carseland AB2. Fort Saskatchewan AB3. Fort Saskatchewan AB4. Joffre AB5. Redwater AB6. Medicine Hat AB7. Medicine Hat AB8. Belle Plaine SK9. Brandon MB
10. Courtright ON11. Kitimat BC
11
2 & 3
8
415
6 & 7 9
10

1.2 Energy Consumption and Carbon Dioxide Emissions in Ammonia Production
Energy, in the form of natural gas, is a significant input into the production of ammonia inCanada. Natural gas costs represent between 70 and 90 percent of input costs, so ammoniaproducers are very focused on reducing consumption to stay competitive. The fertilizerindustry consumes about 8 percent of the natural gas used in Canada.
Natural gas use in ammonia plants results in two major streams of carbon dioxide (CO2)emissions – fuel and process. The fuel-generated CO2 emissions result from the combustionof natural gas (or other hydrocarbon fuels) to supply heat for steam/gas reforming, steamboilers, process heaters, gas turbines and other equipment in the ammonia plant. Duringcombustion, all of the carbon in the fuel is converted to CO2 and is discharged to theatmosphere in the flue gas.
The process-generated CO2 emissions result from the conversion of carbon in the naturalgas feedstock to CO2 and hydrogen during synthesis gas production. The hydrogen gas iscombined with nitrogen from the air in a subsequent production process to form ammonia(NH3). The plant’s CO2 removal system strips off the CO2 from the process gas stream toavoid contamination of the ammonia synthesis catalyst. This relatively pure CO2 is normallyvented to the atmosphere unless some other use can be found for it.
Many facilities use part or all of the process-generated CO2 for urea production. This is ofgreat benefit since it reduces the amount of process-generated CO2 emitted to theatmosphere. Canada is unique in that each of the participating ammonia plants is situatedwith one or more urea plants. Therefore, Canadian ammonia plants recover a higherpercentage of their process-generated CO2 emissions than do producers in other countries.
CANADIAN AMMONIA PRODUCERS – BENCHMARKING ENERGY EFFICIENCY AND CARBON DIOXIDE EMISSIONS
INTRODUCTION 1
3


THEBENCHMARKING
STUDY2

2. THE BENCHMARKING STUDY
The Canadian fertilizer industry is committed to cost-effective reductions of CO2 fromammonia plants, which contribute to greenhouse gases (GHGs). Consistent with thiscommitment, the Canadian Fertilizer Institute (CFI) is an active member of NaturalResources Canada’s Canadian Industry Program for Energy Conservation (CIPEC).
CIPEC helps Canadian industry boost its bottom line by using energy more efficiently.CIPEC is a unique government-industry collaboration between the Government of Canadaand industry that offers a number of services to help each of Canada’s industrial sectorsdevelop energy efficiency goals and action plans. Together with industry, CIPEC definessector-specific energy efficiency targets, develops and implements action plans to achievethem, and measures and reports on progress in its annual report.
In October 2003, CFI and CIPEC jointly engaged Plant Surveys International, Inc. (PSI),a firm recognized for its expertise in worldwide benchmarking of ammonia plants and CO2
emissions, to produce Energy Efficiency and CO2 Emissions Benchmarking Study of CFIAmmonia Producers 2000–2002. Ten Canadian ammonia plants, operated by six companies,participated in the study.
2.1 Objectives of the Study
The benchmarking study helps Canadian ammonia plants identify what opportunities existfor energy efficiency improvements and emissions reductions when compared with theirglobal competitors. The objectives of the study were as follows:
• Provide historical knowledge of ammonia plant energy efficiencies and actual CO2
emissions
• Benchmark ammonia plant energy efficiencies and CO2 emissions against those of otherregions around the world
• Develop an awareness of best-in-class performance and Canada’s position within theinternational market
• Estimate future energy efficiency performance for “world top” and Canadian ammoniaplants
6
CANADIAN AMMONIA PRODUCERS – BENCHMARKING ENERGY EFFICIENCY AND CARBON DIOXIDE EMISSIONS
2 THE BENCHMARKING STUDY

2.2 Methodology
Data collection and calculationEach plant submitted its annual performance data for the operating periods of 2000, 2001and 2002 using a PSI data questionnaire in Microsoft Excel format. See Appendices A andB for more information on data conversion, collection activities and required calculations.
Performance data included production volumes, gas compositions, energy imports andexports, CO2 distribution, production conditions, and other plant data. In this report,process CO2 emissions are determined by subtracting the process CO2 used in ureaproduction from the process-generated CO2.
Ammonia plant efficiencies and CO2 emissions are presented as individual plant andindustry averages for the three-year period. CO2 emissions are presented as mass emissions (tonnes) and specific emissions (t CO2/t NH3). Year-by-year trend data (2000, 2001 and 2002) are presented as industry averages.
Data adjustmentsEnergy efficiency data were normalized in order to provide a common basis for comparison.Adjustments were made for such items as product ammonia conditions, and steam importsand exports. A complete explanation of this normalization methodology is presented inAppendix B.
Energy efficiencies are indicated throughout this report on the basis of a lower heatingvalue (LHV), which is also called net heating value, and efficiencies are per tonne ofammonia. The annual average LHV of each stream is used to convert the volumetric usageto gigajoules (GJ). See Appendix B for details of LHV adjustments.
CANADIAN AMMONIA PRODUCERS – BENCHMARKING ENERGY EFFICIENCY AND CARBON DIOXIDE EMISSIONS
THE BENCHMARKING STUDY 2
7


BENCHMARKINGRESULTS3

3. BENCHMARKING RESULTS
The results of the benchmarking project are presented in three sections:
Section 3.1: Benchmarking EnergyEfficiency and CO2 Emissions ofCanadian Ammonia Producers(2000–2002) This section provides an overview ofthe data for the Canadian industry,describes the operations involved inthe project and presents data onenergy efficiencies and CO2 emissionsfor the sector.
Section 3.2: Global EnergyEfficiency and CO2 EmissionsComparisons (2002)Canadian ammonia plant energyefficiencies and CO2 emissions werecompared with those of otherammonia plants throughout theworld. Results were reported byglobal regions. Ammonia and ureaproductions used in this report arebased on the International FertilizerDevelopment Center’s worldwideplant capacity data.
Section 3.3: “World Top”Performance and FutureProjectionsThis section reviews where Canadianfacilities rank versus “world top”performance. A look at future low-energy designs is also included.
10
CANADIAN AMMONIA PRODUCERS – BENCHMARKING ENERGY EFFICIENCY AND CARBON DIOXIDE EMISSIONS
3 BENCHMARKING RESULTS
Factors that influence energy efficiency andCO2 emissions production
A number of factors influence the energy efficiency andCO2 emissions production of each operation, and noattempt has been made to correct for differences relatedto the following:
Catalyst conditions: plant efficiency declines asoperating catalysts age.
Catalyst reductions: as old catalysts are replaced, somenew catalysts require a reduction procedure before they can be placed into service. Frequently, this involvesan energy loss when reduction gases are vented.
Climatic conditions: plants operate in cold or warmclimates or at high or low elevations.
Environmental energy requirements: various plantsoperate supplemental systems to reduce emissions, such as process condensate stripping and steam injection togas turbines.
Equipment performance: poor equipment performancecan adversely affect the plant’s operational energyefficiency.
Feedstock pre-treatment requirements: somefeedstocks have higher sulphur content than others andmay require additional pre-treatment.
Feedstock quality: some feedstocks have high inert levelsor excessive levels of high molecular weight hydrocarbons;any compression requirements are considered to be insidebattery limits.
Internal recycle streams: through the prudent recyclingof off-gases and hydrogen, the plant’s energy efficiencycan be enhanced.
Operating factor: this is the percent of the year that theplant is operating and producing ammonia (i.e., noprovisions are made for shutdowns or productioncutbacks).
Process technology used to produce ammonia: someprocesses are more energy efficient than others (e.g., ICI-Katalco LCA process, Kellogg KAAP process).

Section 3.1: Benchmarking Energy Efficiency and CO2 Emissions of CanadianAmmonia Producers (2000–2002)
Currently, there are 11 ammonia plants operating in Canada. A list of the10 Canadianammonia plants operated by six companies that participated in the benchmarking study andthe corresponding rated production capacity are provided in Table 1 below.
Table 1: Canadian Ammonia Plants Participating in 2000–2002 Benchmarking Project
CANADIAN AMMONIA PRODUCERS – BENCHMARKING ENERGY EFFICIENCY AND CARBON DIOXIDE EMISSIONS
BENCHMARKING RESULTS 3
11
Company and plant name
Agrium Carseland
Agrium Fort Saskatchewan
Agrium Joffre*
Agrium Redwater #2
Canadian Fertilizers LimitedMedicine Hat 1
Canadian Fertilizers LimitedMedicine Hat 2
Saskferco Ammonia
Sherritt Ammonia
Simplot Brandon
Terra Courtright 2
Location
Location
Carseland AB
Fort Saskatchewan AB
Joffre AB
Redwater AB
Medicine Hat AB
Medicine Hat AB
Belle Plaine SK
Fort Saskatchewan AB
Brandon MB
Courtright ON
Rated production capacity(thousand metric tonnes/yr)
535
465
450
950
530
530
625
155
425
412
* Note: All facilities use natural gas feedstock for ammonia production except Joffre, which uses by-product hydrogen stream. Joffre plant dataare not included in inter-plant comparisons that include feedstock energy data.

3.1.1 Ammonia Production and Energy Use
Average annual net energy efficiency for the 10 Canadian plants over the three-yearbenchmarking study remained constant at 33.8 GJ/t NH3, as shown in Figure 2.However, the feedstock and fuel energy has decreased from 33.5 to 32.8 GJ/t NH3. This2 percent improvement resulted in the same percentage reduction in CO2 generation. Netenergy remained constant since other energy use offset the reduction in feedstock and fuelenergy.
Figure 2: Canadian Ammonia Producers Average Efficiency Trend (2000–2002)
The three-year average normalized or net ammonia plant energy efficiencies for the naturalgas feedstock Canadian plants are shown in Figure 3. The efficiencies of the nine naturalgas-based plants range from 29.7 to 42.3 GJ/t NH3, with an average for natural gas plants(NG) of 34.4 GJ/t NH3. The group average is 33.2 GJ/t NH3, with the hydrogen-basedplant included. The most energy-efficient plant uses approximately 70 percent of theenergy used by the least energy-efficient plant, per tonne of ammonia production.
12
CANADIAN AMMONIA PRODUCERS – BENCHMARKING ENERGY EFFICIENCY AND CARBON DIOXIDE EMISSIONS
3 BENCHMARKING RESULTS
Average*(GJ/t NH3)
34.4
High*(GJ/t NH3)
42.3
Low*(GJ/t NH3)
29.7
* NG: natural gas plants using lower heating value (LHV) for gas.
GJ/t
NH 3
33.82 33.8233.80
33.22
32.81
33.52
32.2
32.4
32.6
32.8
33
33.2
33.4
33.6
33.8
34
2000 2001 2002Year
Feedstock and Fuel EnergyNet Energy

Figure 3: Normalized Plant Net Energy Efficiency (2000–2002)
3.1.2 Ammonia Production and CO2 Emissions
Canadian ammonia plants generate 7 459 188 t/yr CO2 (average over 2000–2002). All ofthe natural gas-based ammonia plants in Canada also produce urea. Urea productioncombines two molecules of ammonia with one molecule of CO2 to form urea and water in solution. The urea solution is evaporated to form urea granular fertilizer. A total of 3 013 689 t/yr CO2 is used for urea production. This is a 40 percent recovery factor forCO2 that would otherwise be emitted to the atmosphere.
Specific CO2 generation ranges from 1.66 to 1.98 t CO2/t NH3 for the natural gasfeedstock ammonia plants (as shown in Table 2). The variability is primarily due to the energyefficiency of the plant and, to a lesser extent, the carbon content of the feedstock and fuel (see Factors that influence energy efficiency and CO2 emissions production, page 10). Moreenergy-efficient plants have a lower specific CO2 generation since less fuel and feedstock areused to produce the same amount of ammonia.
CANADIAN AMMONIA PRODUCERS – BENCHMARKING ENERGY EFFICIENCY AND CARBON DIOXIDE EMISSIONS
BENCHMARKING RESULTS 3
13
0
5
10
15
20
25
30
35
40
45
Plant 2 Plant 3 Plant 4 Plant 5 Plant 6 Plant 7 Plant 8 Plant 9 Plant 10
Ener
gy E
ffici
ency
(GJ/
t NH 3)

Table 2: Canadian Ammonia Producers CO2 Recovery Emissions (2000–2002)
The favourable impact of recovering some of the process-generated CO2 is shown in Figure 4. Because all the natural gas-based plants are associated with urea plants, theyrecover otherwise vented CO2 for urea production. Specific recovery ranges from 0.30 to 1.11 t CO2/t NH3 for an overall average of 0.61 t CO2/t NH3.
The resulting total CO2 emissions from ammonia facilities (total generated – totalrecovered) range from 0.55 to 1.68 t CO2/t NH3, with average specific CO2 emissions of1.07 t CO2/t NH3 from natural gas-based plants . The specific CO2 emissions levels foreach plant are also presented in Figure 4.
Figure 4: CO2 Recovery and Emissions – Specific Basis
14
CANADIAN AMMONIA PRODUCERS – BENCHMARKING ENERGY EFFICIENCY AND CARBON DIOXIDE EMISSIONS
3 BENCHMARKING RESULTS
Total CO2Generation
Total CO2Recovered
Total CO2 Emitted
Average (NG) (t CO2/t NH3)
1.68
0.61
1.07
High(t CO2/t NH3)
1.98
1.11
1.68
Low(t CO2/t NH3)
1.66
0.30
0.55
0
0.5
1
1.5
2
2.5
Plant 2 Plant 3 Plant 4 Plant 5 Plant 6 Plant 7 Plant 8 Plant 9 Plant 10
t CO 2/
t NH 3
CO2 Generated CO2 Recovered CO2 Emissions

Section 3.2: Global Energy Efficiency and CO2 Emissions Comparisons (2002)
Canadian ammonia plant energy efficiencies and CO2 emissions were compared with thoseof other ammonia plants throughout the world. There are 71 countries that produceammonia and 58 that produce urea. For reporting purposes, these countries were groupedinto 13 regions (Table 3). Ammonia and urea productions used in this report are based onthe International Fertilizer Development Center’s worldwide plant capacity data.
Table 3: Ammonia-Producing Regions
3.2.1 Ammonia Production Energy Efficiencies
CO2 generation and emissions from ammonia plants are calculated using feed plus fuelenergy (FFE) efficiencies rather than net energy efficiencies. FFE relates directly to theCO2 generated within the ammonia plant, whereasnet energy efficiencies include electrical usage andadjustments for other energy debits and credits,which can have associated offsite CO2 emissions notdirectly from the ammonia plant.
Estimated FFE efficiencies for each global region are shown in Figure 5 (on p. 16). Theserange from 33.1 to 40.4 GJ/t NH3, with a world average of 38.6 GJ/t NH3. Canada ranksfirst in having the most FFE-efficient plants. These plants generate the least amount ofCO2/NH3 production.
CANADIAN AMMONIA PRODUCERS – BENCHMARKING ENERGY EFFICIENCY AND CARBON DIOXIDE EMISSIONS
BENCHMARKING RESULTS 3
15
1. Africa 7. India
2. Asia (excluding China and India) 8. Mexico
3. Canada 9. Oceania
4. China 10. South America
5. Eastern Europe 11. Trinidad and Tobago
6. Former Soviet Union 12. United States
13. Western Europe
Average(GJ/t NH3)
38.6
High(GJ/t NH3)
40.4
Low(GJ/t NH3)
33.1
Canada(GJ/t NH3)
33.1
Global Ammonia Plant Energy Efficiency
Canadian plants rank first as the most feed-and-fuel energy-efficient plants in the world.

Figure 5: Estimated Ammonia Plant Energy Efficiency by Global Region
3.2.2 Estimated CO2 Emissions From Ammonia Production
CO2 emissions were calculated using ammonia and urea production estimates and a 79.5 percent capacity utilization for each global region. Canadian estimates were based onactual 2002 production from the nine natural gas-based ammonia plants. CO2 emissionsfrom ammonia production are derived from the combustion of natural gas used as a fueland from the steam reformation process used to derive the hydrogen stream from thenatural gas used as a feedstock. These CO2 emissions streams are referred to as fuel andprocess (or feed) respectively.
Total world ammonia production for 2002 is estimated to be 128 megatonnes (Mt). TotalCO2 generation from these ammonia plants is estimated to be 275 Mt. Approximately 62 percent, or 170 Mt CO2, is process- or feed-related. A significant amount (28.5 percent)of total CO2 generated is recovered for use in urea production, leaving CO2 emissions of 197 Mt from ammonia plants throughout the world. The global CO2 generation andemissions estimates for 2002 are summarized in Figure 6.
16
CANADIAN AMMONIA PRODUCERS – BENCHMARKING ENERGY EFFICIENCY AND CARBON DIOXIDE EMISSIONS
3 BENCHMARKING RESULTS
0
5
10
15
20
25
30
35
40
45
Canada WesternEurope
India UnitedStates
Oceania SouthAmerica
Mexico EasternEurope
FormerSovietUnion
Africa Asia (excluding
China and India)
China Trinidadand Tobago
Feedstock Fuel Total Feed + FuelGJ
/t N
H 3 – L
HV

Figure 6: CO2 Generation and Emissions From Ammonia Plants
Gross CO2 generation from ammonia plants and emissions net of CO2 used in ureaproduction in the various regions of the world are shown in Figure 7. China ranks firstwith the highest CO2 emissions (21.9 percent), and Oceania has the least. Canada isamong the regions with the least CO2 emissions, ranking 11th (highest to lowest), andemits 2.2 percent of the world’s total CO2 from ammonia plants.
Figure 7: CO2 Generated and Emitted by Region (2002)
CANADIAN AMMONIA PRODUCERS – BENCHMARKING ENERGY EFFICIENCY AND CARBON DIOXIDE EMISSIONS
BENCHMARKING RESULTS 3
17
275 Mt
Estimated global CO2 generated from ammonia production (2002)
197 Mt
CO2 emissionsgenerated by fuel
consumption
CO2 generated byprocess gasconsumption
Process CO2
emitted to theatmosphere
Global CO2
Emissions (2002) Process CO2
consumed inurea production
105 Mt 170 Mt
78 Mt92 Mt
275 Mt
t CO 2
70 000
Gross CO2 Generated CO2 Emissions (net of CO2 used for urea production)
60 000
50 000
40 000
30 000
20 000
10 000
Oceania Mexico Canada SouthAmerica
Africa Trinidadand Tobago
India EasternEurope
WesternEurope
UnitedStates
Asia(excluding
China and India)
FormerSovietUnion
China
0

On a per tonne of production basis, CO2 generation from ammonia production ranges from1.84 to 2.24 t CO2/t NH3, with a world average of 2.14 t CO2/t NH3. Canada and WesternEurope are the most efficient regions, with generation factors of 1.81 and 1.84 respectively.
When the CO2 that has been captured and used inurea production is accounted for, total CO2
emissions from ammonia production range from0.91 to 2.23 t CO2/t NH3. Canada is the second-lowest region in terms of emissions per tonne ofammonia production, at 1.11 t CO2/t NH3. Figure 8 presents the specific CO2 generationand emissions rates by region for 2002.
Figure 8: Specific CO2 Generation and Emission Rates (2002)
18
CANADIAN AMMONIA PRODUCERS – BENCHMARKING ENERGY EFFICIENCY AND CARBON DIOXIDE EMISSIONS
3 BENCHMARKING RESULTS
Average High Low Canada(t CO2/ (t CO2/ (t CO2/ (t CO2/t NH3) t NH3) t NH3) t NH3)
Global CO2 Generated per Tonne 2.14 2.24 1.81 1.81of Ammonia Production
Global CO2 Emitted per Tonne 2.14 2.23 0.91 1.11of Ammonia Production
2.5
2
1.5
1
0.5
0
t CO 2
/t N
H 3
Canada WesternEurope
India UnitedStates
Oceania Asia(excludingChina and
India)
SouthAmerica
FormerSovietUnion
Mexico Trinidadand Tobago
China Africa EasternEurope
Fuel generated Fuel and feed generated Total emitted
Canada and Western Europe are the most efficient regions, with generationfactors of 1.81 and 1.84 respectively.

Section 3.3: “World Top” Performance and Future Projections
3.3.1 Worldwide Benchmarking
Nearly all the worldwide commercial production ofammonia is from hydrocarbon feedstocks and fuels.As mentioned previously, improving the energyefficiency of ammonia production is an importantstrategy to reduce CO2 emissions.
Benchmarking the energy efficiency of individual ammonia plants is an effective way tomeasure plant performance against other producers and determine the best performers in theworld. It provides a quantitative measure of what is possible with today’s technology and canbe used to assess the feasibility of making improvements. Figure 9 shows the performance ofthe individual Canadian ammonia plants against other plants around the globe.
Figure 9: Net Energy Efficiencies (Normalized)
3.3.2 Canada in “World Top” Rankings
A “world top” rating ranks plants in 10 groupsaccording to energy efficiency. If a plant is ranked inthe top group, it is considered world top. Anammonia plant with an energy efficiency of 32.6 GJ/t NH3 or lower is considered to be worldtop. As noted previously, Canadian ammoniaproduction is energy efficient. Comparing globalregions, the nine Canadian ammonia producers arethe second-most efficient, following the Western European producers. The average netenergy efficiency of the nine Canadian producers is 34.1 GJ/t NH3. This is 11 percentbetter than the world average of 38.5 GJ/t NH3.
CANADIAN AMMONIA PRODUCERS – BENCHMARKING ENERGY EFFICIENCY AND CARBON DIOXIDE EMISSIONS
BENCHMARKING RESULTS 3
19
42
35
28
21
14
7
0
Quartile
Net E
nerg
y Effi
cien
cy (G
J/t N
H 3)
World Average38.5 GJ/t
Q1 Q2 Q4Q3
Canadian Average34.1 GJ/t
“World Top”< 32.6 GJ/t
Two of the Canadian plants are “world top”plants – those that rank in the top decileglobally in terms of energy efficiency.
The Agrium plant in Joffre, Alberta, is anexcellent Canadian example of inter-plantintegration. A by-product hydrogen streamfrom an adjacent facility replaces theneed for steam reforming of natural gasto supply the feedstock for ammoniaproduction.

3.3.3 The Future of Ammonia Plant Low-Energy Designs
Modern ammonia production technology began in the 1960s. The energy efficiency ofthese plants was typically 39.5 GJ/t. The efficiency of newly designed plants improvedsubstantially, as numerous innovative concepts were developed. Designs of 28.0 GJ/tbecame available in 1991. Since then, improvements have continued but at a muchreduced rate. Currently, low energy designs approaching 27.0 GJ/t are being offered.
The best estimate of future improvements in the efficiency of low-energy ammonia plantscomes from Ammonia: Principles and Industrial Practice. After an extensive review of thehistory of industrial ammonia production and current technologies, the author, Max Appl,makes the following broad predictions:
• Natural gas will remain the preferred feedstock for at least the next 10 to 15 years. Coal gasification will not play a major role in ammonia production in that period.
• The present ammonia technology will not change fundamentally, at least in the next 10 to 15 years. Even if there are radical, unforeseeable developments, they will take timeto reach commercial introduction.
• With the traditional concepts, the margins of additional improvements have becomesmall after years of intensive research and development.
• Only minor improvements of individual steps, catalysts and equipment are expected.
• There is unlikely to be any further significant reduction in the energy consumption of the natural-gas-based steam-reforming ammonia process; figures between 27 and 28 GJ/t are already close to the theoretical minimum, which is 20.9 GJ/t.
• For the next 10 to 15 years, the bulk of ammonia production will still be produced inworld-scale plants of 1000–2000 tonnes per day NH3. Small capacity plants will belimited to locations where special logistical, financial or feedstock conditions favour them.
• New developments in ammonia technology will mainly reduce investment costs andincrease operational reliability. Smaller integrated process units contribute to thisreduction and give additional savings by simplifying piping and instrumentation.Reliability may be improved by advances in catalyst and equipment quality and byimproved instrumentation and computer control.
20
CANADIAN AMMONIA PRODUCERS – BENCHMARKING ENERGY EFFICIENCY AND CARBON DIOXIDE EMISSIONS
3 BENCHMARKING RESULTS

With this forecast in mind, the improvement in the consumption of fuel energy of newlow-energy design plants is estimated to continue at a slower rate than that experiencedover 1991–2003, where the Energy ImprovementFactor (EIF) averaged 1.0 percent of the fuel peryear. From now through 2014, it is estimated thatthe fuel consumption improvement will be 35 percent less than that during the previousdecade. This equates to a 0.65 percent per year EIF.The energy efficiency of these low-energy designs isexpected to drop from 6.2 to 5.8 GJ/t, whileprocess efficiency will remain fixed by chemistry.The total energy efficiency in 2014 will be 26.7 GJ/t.
CANADIAN AMMONIA PRODUCERS – BENCHMARKING ENERGY EFFICIENCY AND CARBON DIOXIDE EMISSIONS
BENCHMARKING RESULTS 3
21
Recently completed Process Integration (PI) studies at Canadian ammoniaproduction facilities have highlightedopportunities to improve the integrationbetween ammonia and urea plants. By looking for opportunities to furtherinclude PI methodologies during thedesign phase of new ammonia and ureaplants, future plants can be built witheven greater energy efficiency and atlower or minor incremental capital cost.


APPENDICES

APPENDIX A: ABBREVIATIONS
• G – giga – 109
• J – joule
• k – kilo – 103
• M – mega – 106
• t – metric tonne
• m3 – cubic metre
24
CANADIAN AMMONIA PRODUCERS – BENCHMARKING ENERGY EFFICIENCY AND CARBON DIOXIDE EMISSIONS
APPENDIX A
To convert To Multiply by
Natural gas (GJ) Tonnes CO2 equivalent 0.0513
Diesel (litres) Tonnes CO2 equivalent 0.00276
Gasoline (litres) Tonnes CO2 equivalent 0.00249
No. 2 fuel oil (litres) Tonnes CO2 equivalent 0.00284
Source: Canada’s Greenhouse Gas Inventory, 1990–2000. Greenhouse Gas Division, Environment Canada (June 2002).
Conversion factors for greenhouse gas emissions from fuels

APPENDIX B: PLANT SURVEYS INTERNATIONAL’S AMMONIA PLANTENERGY EFFICIENCY NORMALIZATION METHODOLOGY
Energy Efficiency
One of the primary reasons for benchmarking is to compare performance results. In somecases, it is desirable to make adjustments to performance measurements so that plantprocesses are compared on a common basis. Such is the case for ammonia plant energyefficiencies, where adjustments are made to arrive at a standardized or normalized plant.The method used to make these adjustments is shown in the table below.
CANADIAN AMMONIA PRODUCERS – BENCHMARKING ENERGY EFFICIENCY AND CARBON DIOXIDE EMISSIONS
APPENDIX B
25
Normalized Ammonia PlantEnergy Efficiency Example Calculation
GJ/t (Lower Heating Value)
Total feed 25.1
Total fuel 8.2
Total Feed + Fuel 33.3
Electric import (40%) 1.2
Nitrogen (N2) imports (40% electric) – 0.0
Oxygen (O2) imports (40% electric) 0.0
Total steam imports (90%) 0.0
Total steam exports (90%) – 1.1
Total other energy imports 0.0
Total other energy exports – 0.0
Ammonia (NH3) product adjustment 0.1
Cooling water (CW) energy adjustment 0.3
Boiler feedwater (BFW) energy adjustment 0.0
Other Energy 0.5
Net Energy Efficiency 33.8

Energy Efficiency Normalization
Basis• Actual plant calendar year data are used. All quantities are on an annual basis. Annual
ammonia production and all feedstock and fuel energy consumed by a plant during theyear are recorded. This includes the energy to produce ammonia, as well as the energyused during start-ups, shutdowns, catalyst reductions, etc. The ammonia plant fuelenergy includes energy for reformer firing, auxiliary boiler use, gas turbine use andprocess heater use.
• The lower heating value (LHV), also called the net heating value, is used throughout.The annual average LHV of each stream is used to convert the volumetric usage togigajoules (GJ).
Adjustments• Imported off-gas streams are valued at their LHV. Typically, these are a small percentage
of the total feed and fuel usage. However, in the case of hydrogen imports thatconstituted the bulk of the feedstock requirement, an estimate of the energy needed toproduce this hydrogen is included in the feedstock energy.
• Imported electricity is converted to a heat equivalent at a 40 percent (LHV fossil fuelbasis) efficiency (1 kWh = 9000 kJ LHV). This is a typical overall efficiency for fossil fuelutility-based electric generation and distribution. The purpose of the electrical efficiencyadjustment is to reflect the fossil fuel use associated with its production. This conversiondoes impact a plant’s energy efficiency calculation, but it has no effect on a plant’s CO2
emissions calculation. Only carbon-bearing streams directly used in a plant are used inthe CO2 emissions calculations. Electricity exports are valued at 100 percent conversionefficiency (1 kWh = 3600 kJ LHV). A high efficiency conversion rate is used for internalgeneration of electricity for export because it is considered to be incidental to the processand normally represents the recovery of waste heat.
• Process nitrogen imports (nitrogen for process use) are based on actual energy used forproduction and delivery to the ammonia plant. Otherwise, an estimate of the electricityneeded to produce and supply the nitrogen to the ammonia plant is used based onproduction from an air separation plant using a 40 percent LHV electrical conversionefficiency. No energy debit is made for the import of nitrogen for utility use, such as forinert gas blanketing needs and purging of vessels.
• Process oxygen imports (oxygen for process use) are based on actual energy used forproduction and delivery to the ammonia plant. Otherwise, an estimate of the electricityneeded to produce and supply the oxygen to the ammonia plant is based on productionfrom an air separation plant using a 40 percent LHV electrical conversion efficiency.
26
CANADIAN AMMONIA PRODUCERS – BENCHMARKING ENERGY EFFICIENCY AND CARBON DIOXIDE EMISSIONS
APPENDIX B

• Steam imports and exports are based on their actual enthalpy at plant battery-limitconditions (defined below). Export steam must have a valid use. Vented steam and othersuch uses do not qualify as export steam. A conversion efficiency of 90 percent is used(enthalpy/0.90 = 1.11 × enthalpy). This is typical of condensing steam systems. Plantshave the option of using their actual utilization efficiencies in cases where theysignificantly differ from the default 90 percent conversion. Note: 90 percent conversionefficiency is based on inlet water at 15°C where enthalpy is 63 kJ/kg.
• Other energy imports and exports are valued at their LHV.
• Ammonia product adjustments are made to normalize ammonia production to liquid atatmospheric pressure (–32°C), using the difference in enthalpy. Gaseous ammonia isconverted to liquid using a heat of vaporization of 1148 kJ/kg. Liquid ammonia above–32°C is adjusted using a specific heat of 4.63 kJ/kg °C. This results in a minoradjustment for most plants and a more significant adjustment for those plants producinga high percentage of gaseous product.
• The basis for cooling water is that the energy for producing and pumping all coolingwater is included in the plant’s energy usage. Where a plant imports cooling water (froma cooling tower, river water, sea water, etc.), the pumping energy and cooling fan energy(for cooling towers) is added as an energy debit. Actual energy usage is used, if known.Otherwise, estimates are used where the pumping energy is based on using a single-stage,double-suction centrifugal pump with an 85 percent efficiency. Coupled with a large 96 percent efficient electric motor, the resulting pumping efficiency is 82 percent. Anadditional energy load of 44 kWh/km3 is used for cooling tower fan operation. The netenergy usage for cooling water is then determined by using a 40 percent electricalconversion efficiency.
• Boiler feedwater (BFW) adjustments are made for those plants importing BFW. Theactual electrical pumping energy is used, if known. Otherwise, pumping energy isestimated using a multi-stage centrifugal pump with a 65 percent efficiency. Coupledwith a large 96 percent efficient electric motor, the resulting pumping efficiency is 62 percent. The net energy usage is then determined by using a 40 percent electricalconversion efficiency.
Plant Battery LimitBattery limit is the “fence” around an ammonia plant. Inside the battery limit (ISBL),ammonia is manufactured and the energy efficiency is determined from measurements offeedstocks and energy flows across this boundary. Important utilities to support themanufacture of ammonia are typically produced outside battery limit (OSBL) and deliveredto the plant. Commonly, hydrocarbon feedstocks and fuels, electric power and (sometimes)steam are produced OSBL and delivered to the ammonia plant.
CANADIAN AMMONIA PRODUCERS – BENCHMARKING ENERGY EFFICIENCY AND CARBON DIOXIDE EMISSIONS
APPENDIX B
27

Standard ammonia plant configurationISBL
– Boiler feed water production– Cooling water production and circulation– Feedstock pre-treatment– Feedstock compression– Process flares– Process condensate treatment
OSBL– Electrical power generation– Ammonia storage and handling– Ammonia storage flare
In a normalized ammonia plant, cooling water production is ISBL. In plants using offsitecooling water, the pumping and cooling (tower fan) energy for all of the circulatingcooling water must be determined since the entire circulating flow crosses the battery limit.Ammonia storage and handling are considered to be OSBL.
28
CANADIAN AMMONIA PRODUCERS – BENCHMARKING ENERGY EFFICIENCY AND CARBON DIOXIDE EMISSIONS
APPENDIX B

APPENDIX C: HISTORICAL DATA
There are more than 400 ammonia plants throughout the world. Plant SurveysInternational, Inc. (PSI) has historical data on about one fourth of these plants. The most accurate data are in global regions where PSI has considerable data, such as Western Europe, the United States, Trinidad and Tobago, Oceania and Canada. In regionswhere there are limited data, the bottom-half average listed in the table below was used.
CANADIAN AMMONIA PRODUCERS – BENCHMARKING ENERGY EFFICIENCY AND CARBON DIOXIDE EMISSIONS
APPENDIX C
29
Average Feedstock Fuel Total feed + fuel
1 Quartile 23.3 8.2 31.6
2 Quartile 23.6 11.0 34.7
3 Quartile 23.5 13.7 37.2
4 Quartile 24.9 18.2 43.1
Bottom Half 24.2 16.0 40.2
World 23.8 12.9 36.7
*Note: FFE = Feed + Fuel Energy (hydrocarbon basis)
Historical Ammonia Plant FFE* Efficiencies From PSI Benchmarking RecordsGJ/t NH3 LHV

APPENDIX D: REFERENCES1 International Fertilizer Development Center, Worldwide Ammonia Capacity Listing by
Plant (FSR-10), (September 2003).
2 International Fertilizer Development Center, Worldwide Urea Capacity Listing by Plant(FSR-7), IFDC, October 2003.
3 Plant Surveys International, Inc., 1997–1998 Worldwide Ammonia Plant BenchmarkingStudy.
4 Plant Surveys International, Inc., 2000–2001 Worldwide Ammonia Plant BenchmarkingStudy.
5 Nand, Dr. S., “Downtime in India Ammonia and Urea Plants,” The Fertilizer Association of India, AIChE paper (September 1999).
6 Nand, Dr. S. and Goswami, Manish, “On-Stream and Energy Efficiency of IndianAmmonia and Urea Plants – An Analysis,” The Fertiliser Association of India[ABSTRACT] presented at the Ammonia Symposium (2004).
7 Appl, Max, Ammonia, Methanol, Hydrogen, Carbon Monoxide – Modern ProductionTechnologies (British Sulphur Publishing, ISBN 1-873387-26-1, 1997).
8 Appl, Max, Ammonia: Principles and Industrial Practice (Wiley-VCH, ISBN 3-527-29593-3, 1999).
9 European Fertilizer Manufacturers Association, “Best Available Techniques for PollutionPrevention and Control in the European Fertilizer Industry,” Booklet No. 1 of 8,“Production of Ammonia” (second edition revised in 2000).
10 G.P. Williams with Kellogg Brown and Root (private correspondence), Design Efficiencyfor Proposed CNCC plant for Hainan Island, China.
30
CANADIAN AMMONIA PRODUCERS – BENCHMARKING ENERGY EFFICIENCY AND CARBON DIOXIDE EMISSIONS
APPENDIX D