1 A PROFITABLE, GROWTH-ORIENTED, INTERMEDIATE GOLD PRODUCER SEPTEMBER 2015.

CANADA’S INTERMEDIATE GOLD PRODUCER
Updated LOM Plan – Detour Lake June 28, 2018

2
This presentation contains certain forward-looking information and forward-looking statements, as defined in applicable securities laws (collectively referred to herein as “forward-looking statements”).
Forward-looking statements reflect current expectations or beliefs regarding future events or the Company’s future performance. All statements other than statements of historical fact are forward-looking
statements. Often, but not always, forward-looking statements can be identified by the use of words such as “plans”, “expects”, “is expected”, “budget”, “scheduled”, “estimates”, “continues”, “forecasts”,
“projects”, “predicts”, “intends”, “anticipates”, “targets”, or “believes”, or variations of, or the negatives of, such words and phrases or state that certain actions, events or results “may”, “could”, “would”,
“should”, “might” or “will” be taken, occur or be achieved.
Forward-looking statements involve known and unknown risks, uncertainties and other factors which may cause the Company’s actual results, performance or achievements to differ materially from those
expressed or implied by such forward-looking statements. All forward-looking statements, including those herein are qualified by this cautionary statement. Accordingly, readers should not place undue
reliance on forward-looking statements. The forward-looking statements in this presentation speak only as of the date of this presentation or as of the date or dates specified in such statements.
In particular, this presentation contain forward-looking statements including, without limitation, with respect to Detour Gold’s 2018 LOM plan assumptions and parameters, mine production plan, estimated unit
costs, estimated site operating costs, estimated capital costs, estimated deferred stripping costs, estimated total site costs, estimated cash flows, estimated revenues, estimated net project value of the Detour
Lake mining operation, permitting schedule, realizing the operational improvement strategy, and expectations regarding future price assumptions, financial performance and other outlook or guidance.
Inherent in forward-looking statements are risks, uncertainties and other factors beyond the Company’s ability to predict or control. These risks, uncertainties and other factors include, but are not limited to
gold price volatility, changes in debt and equity markets, the uncertainties involved in interpreting geological data, increases in costs, environmental compliance and changes in environmental legislation,
regulation and policies, support of the Company’s Aboriginal communities, receipt of permits, interest rate and exchange rate fluctuations, general economic conditions and other risks involved in the gold
exploration, development and production industry, as well as those risk factors listed in the section entitled "Description of Business - Risk Factors" in Detour Gold's 2017 Annual Information Form (“AIF”) and
in the continuous disclosure documents filed by Detour Gold on and available on SEDAR at www.sedar.com. Readers are cautioned that the foregoing list of factors is not exhaustive of the factors that may
affect forward-looking statements. Actual results and developments and the results of the final revised life of mine plan are likely to differ, and may differ materially or materially and adversely, from those
expressed or implied by forward-looking statements, including those contained in this presentation. Such statements are based on a number of assumptions which may prove to be incorrect, including, but not
limited to, assumptions about the following: the availability of financing for exploration and development activities; operating and capital costs; results of operations; the Company’s available cash resources;
the Company's ability to attract and retain skilled staff; the mine development and production schedule and related costs; dilution control; sensitivity to metal prices and other sensitivities; the supply and
demand for, and the level and volatility of the price of, gold; timing of the receipt of regulatory and governmental approvals for the proposed development of the West Detour project and the continued
development of the Detour Lake pit, other development projects and other operations; the timing and results of consultations with the Company’s Aboriginal partners; the supply and availability of consumables
and services; the exchange rates of the Canadian dollar to the U.S. dollar; energy and fuel costs; required capital investments; estimates of net present value and internal rate of returns; the accuracy of
mineral reserve and mineral resource estimates, production estimates and capital and operating cost estimates and the assumptions on which such estimates are based; market competition; ongoing relations
with employees and impacted communities and general business and economic conditions; and general business and economic conditions.
The Company undertakes no obligation to update publicly or otherwise revise any forward-looking statements whether as a result of new information or future events or otherwise, except as may be required
by law. If the Company does update one or more forward-looking statements, no inference should be drawn that it will make additional updates with respect to those or other forward-looking statements.
All monetary amounts are in Canadian dollars unless otherwise stated.
Cautionary Statement on Forward Looking Information
3
Non-IFRS Financial Performance Measures The Company has included non-IFRS measures in this presentation: total site costs, net debt, and free cash flow before financing activities . The Company believes that these measures, in addition to
conventional measures prepared in accordance with IFRS, provide investors an improved ability to evaluate the underlying performance of the Company. The non-IFRS measures are intended to
provide additional information and should not be considered in isolation or as a substitute for measures of performance prepared in accordance with IFRS. These measures do not have any
standardized meaning prescribed under IFRS, and therefore may not be comparable to other issuers. Other companies may calculate this measure differently as a result of differences in underlying
principles and policies applied.
Total site costs, total site costs per ounce and various unit costs
Detour Gold reports total site costs and total site costs per ounce on a sold basis. Total site costs include production and operating costs such as mining, processing, site general and administration,
bullion shipment, refining, agreements with Aboriginal communities, capital costs (including closure costs) and net of silver sales. The Company calculates total site costs per ounce as the sum of total
site costs (as described above) divided by the total gold ounces sold.
Detour Gold reports the following unit costs:
Mining unit costs: calculated as mining costs divided by total tonnes mined (ore + waste).
Processing unit costs: calculated as process costs divided by the total tonnes milled.
G&A unit costs: calculated as site G&A costs (excluding costs related to agreements with Aboriginal communities) divided by total tonnes milled.
Information Concerning Estimates of Mineral Reserves and Resources These estimates have been prepared in accordance with the requirements of Canadian securities laws, which differ from the requirements of United States' securities laws. The terms "mineral reserve",
"proven mineral reserve and "probable mineral reserve" are Canadian mining terms as defined in accordance with NI 43-101 and the CIM Definition Standards. The CIM Definition Standards differ from
the definitions in the United States Securities and Exchange Commission ("SEC") Guide 7 ("SEC Guide 7") under the United States Securities Act of 1933, as amended. Under SEC Guide 7, a "final" or
"bankable" feasibility study is required to report mineral reserves, the three-year historical average price is used in any mineral reserve or cash flow analysis to designate mineral reserves and the
primary environmental analysis or report must be filed with the appropriate governmental authority. In addition, the terms "mineral resource", "measured mineral resource", "indicated mineral resource"
and "inferred mineral resource" are defined in NI 43-101 and recognized by Canadian securities laws but are not defined terms under SEC Guide 7 or recognized under U.S. securities laws. U.S.
investors are cautioned not to assume that any part or all of mineral deposits in these categories will ever be upgraded to mineral reserves. "Inferred mineral resources" have a great amount of
uncertainty as to their existence, and great uncertainty as to their economic and legal feasibility. It cannot be assumed that all or any part of an "inferred mineral resource" will ever by upgraded to a
higher category. Under Canadian securities laws, estimates of "inferred mineral resources" may not form the basis of feasibility or pre-feasibility studies, except in rare cases. U.S. investors are
cautioned not to assume that all or any part of an inferred mineral resource exists or is economically or legally mineable. Accordingly, these mineral reserve and mineral resource estimates and related
information may not be comparable to similar information made public by U.S. companies subject to the reporting and disclosure requirements under the United States federal laws and the rules and
regulations thereunder, including SEC Guide 7.
Mineral resources are not mineral reserves, and do not have demonstrated economic viability, but do have reasonable prospects for economic extraction. Measured and indicated mineral resources are
sufficiently well defined to allow geological and grade continuity to be reasonably assumed and permit the application of technical and economic parameters in assessing the economic viability of the
resource. Inferred mineral resources are estimated on limited information not sufficient to verify geological and grade continuity or to allow technical and economic parameters to be applied. Inferred
mineral resources are too speculative geologically to have economic considerations applied to them to enable them to be categorized as mineral reserves. There is no certainty that mineral resources
of any category can be upgraded to mineral reserves through continued exploration.
Detour Gold’s mineral reserve and mineral resource figures are estimates and Detour Gold can provide no assurances that the indicated levels of gold will be produced or that Detour Gold will receive
the gold price assumed in determining its mineral reserves. Such estimates are expressions of judgment based on knowledge, mining experience, analysis of drilling results and industry
practices. Valid estimates made at a given time may significantly change when new information becomes available. While the Company believes that these mineral reserve and mineral resource
estimates are well established and the best estimates of Detour Gold’s management, by their nature mineral reserve and mineral resource estimates are imprecise and depend, to a certain extent, upon
analysis of drilling results and statistical inferences which may ultimately prove unreliable. If the Company’s mineral reserve or mineral reserve estimates are inaccurate or are reduced in the future, this
could have an adverse impact on Detour Gold’s future cash flows, earnings, results or operations and financial condition.
Detour Gold estimates the future mine life of the Detour Lake operation. Detour Gold can give no assurance that its mine life estimate will be achieved. Failure to achieve this estimate could have an
adverse impact on Detour Gold’s future cash flows, earnings, results of operations and financial condition.
Qualified Persons
The scientific and technical content of this presentation was reviewed, verified and approved by Drew Anwyll, P.Eng., Senior Vice President Technical Services, a Qualified Person as defined by
Canadian Securities Administrators National Instrument 43-101 “Standards of Disclosure for Mineral Projects”.
Note to Investors

4
Agenda – 2018 LOM Plan
Overview
Permitting
2018 LOM Plan
Site Operating and Capital Costs
Economic Analysis
Operational Improvement Strategy
Opportunities & Risks
Additional Information

5
Why an updated LOM Plan?
Longer timeframe to obtain permits
Cost review of current conditions indicating increased operating
costs and capital investment assumptions
Successful reduction of annual variations in gold production profile
from the prior LOM plan
Pit sequencing improvements without increasing operational risk
Focus plan over next 5 years to achieve incremental improvements
DETOUR LAKE IS A ROBUST ECONOMIC OPERATION
Overview

6 6
Permitting
Aboriginal Consultation
Permitting Process
7
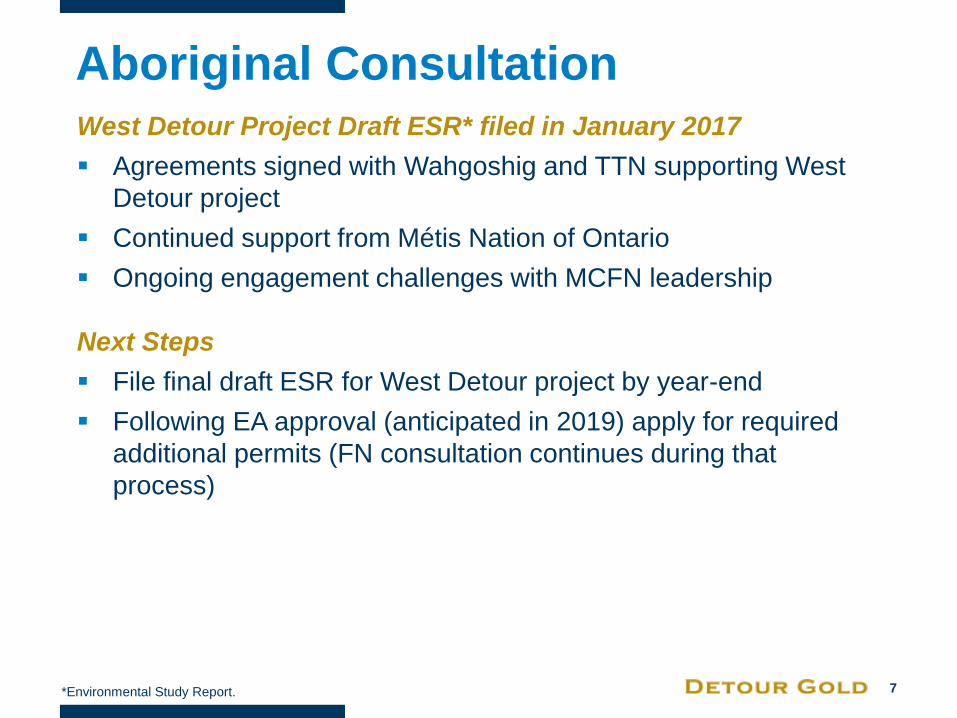
Aboriginal Consultation
West Detour Project Draft ESR* filed in January 2017
Agreements signed with Wahgoshig and TTN supporting West
Detour project
Continued support from Métis Nation of Ontario
Ongoing engagement challenges with MCFN leadership
Next Steps
File final draft ESR for West Detour project by year-end
Following EA approval (anticipated in 2019) apply for required
additional permits (FN consultation continues during that
process)
*Environmental Study Report.

8
Permitting Process – Adding Time
Lindbergh
Lake
1
Walter Lake
Pond
120m offset
2018 LOM Plan adds more time to obtain required permits:
2010 Environmental Assessment (In-hand)
Associated remaining permit expected in Q3 2018
Associated permits required by mid-2020
West Detour Project & Walter Lake permits required by 2025 and beyond
2 3
4
4
4
1
2
3
4

9
Permitting Process
Main components of ESR:
› DLM Pit (Walter Lake)
› North Pit
› West Detour Pit
› Stockpiles:MRS2-Ext,
MRS3, and MRS4
› Water discharge point
(Sunday creek or Detour
river)
West Detour Project – Draft ESR

10 10
2018 LOM Plan
Production Plan (summary)
Operating Plan
Changes from Prior Plan
11
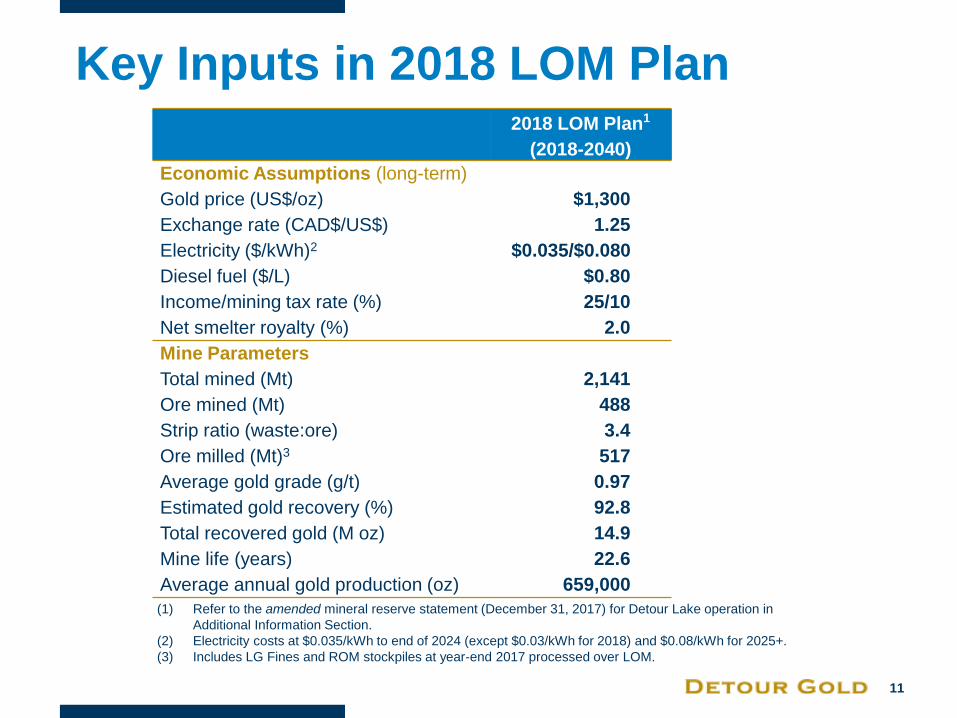
Key Inputs in 2018 LOM Plan
2018 LOM Plan1
(2018-2040)
Economic Assumptions (long-term)
Gold price (US$/oz) $1,300
Exchange rate (CAD$/US$) 1.25
Electricity ($/kWh)2 $0.035/$0.080
Diesel fuel ($/L) $0.80
Income/mining tax rate (%) 25/10
Net smelter royalty (%) 2.0
Mine Parameters
Total mined (Mt) 2,141
Ore mined (Mt) 488
Strip ratio (waste:ore) 3.4
Ore milled (Mt)3 517
Average gold grade (g/t) 0.97
Estimated gold recovery (%) 92.8
Total recovered gold (M oz) 14.9
Mine life (years) 22.6
Average annual gold production (oz) 659,000
(1) Refer to the amended mineral reserve statement (December 31, 2017) for Detour Lake operation in
Additional Information Section.
(2) Electricity costs at $0.035/kWh to end of 2024 (except $0.03/kWh for 2018) and $0.08/kWh for 2025+.
(3) Includes LG Fines and ROM stockpiles at year-end 2017 processed over LOM.

12
Item 20181 2019 2020 2021 2022 2023
LOM
Total
2018-40
LOM
Avg
2018-40
Total Mined (Mt) 107 115-120 123 126 126 126 2,141 95
Strip Ratio (waste:ore) 4.7 4.2 4.4 6.6 4.8 3.5 3.4 3.4
Tonnes Milled (Mt) 21.0 21.5-22.5 22.5 23.0 23.0 23.0 517 22.9
Head Grade (g/t Au) 0.99 0.88-0.92 0.88 0.91 0.91 0.91 0.97 0.97
Gold Recovery (%) 90.0-91.5 91.5 92.1 92.1 92.8 92.8 92.8 92.8
Gold Production (k oz) 595 -635 570-605 587 620 626 623 14,884 659
Summary Mine Production Plan
(1) As per revised guidance provided on April 26, 2018. All numbers are approximate.
Average annual gold production of 614,000 oz for next 12 years
Subsequently, 10 years averaging 725,000 oz per year

13
Detour Lake Operating Plan
0.00
0.20
0.40
0.60
0.80
1.00
1.20
1.40
-
100
200
300
400
500
600
700
800
900
1,000
2018 2019 2020 2021 2022 2023 2024 2025 2026 2027 2028 2029 2030 2031 2032 2033 2034 2035 2036 2037 2038 2039 2040
LOM Gold Production
Gold Production (k oz) Head Grade (g/t Au)
614 koz/yr for next 12 yrs &
725 koz/yr for subsequent 10 yrs
Head grade
(g/t Au) Gold production
(k oz)

14
Detour Lake Operating Plan
0.00
1.00
2.00
3.00
4.00
5.00
6.00
7.00
0
20
40
60
80
100
120
140
2018 2019 2020 2021 2022 2023 2024 2025 2026 2027 2028 2029 2030 2031 2032 2033 2034 2035 2036 2037 2038 2039 2040
Tonnes Mined per Pit
Detour Lake Pit West Detour Pit North Pit Overall S/R
Detour Lake pit (88% of ore)
Tonnes Mined
(Mt) Strip Ratio
(waste:ore)

15
Detour Lake Operating Plan
Gradual ramp up of processing plant:
Throughput from 21.0 Mt in 2018 to 23.0 Mt in 2021 onwards
Gold recovery LOM average of 92.8%
LG Fines accounts <5% of total LOM feed
0.0
5.0
10.0
15.0
20.0
25.0
2018 (guid) 2019 2020 2021 2022 2023
Ore Feed LG Fines
To
nn
es
Mille
d (
Mt)
23 Mt
21 Mt 21.5-22.5 Mt 22.5Mt 23 Mt 23 Mt

16
Notable Changes from Prior 2017 LOM
More consistent production profile (2019-2023)
› Strip ratio reduced to bring ounces forward however additional
permitting delay
Increase in operating costs and modify productivity assumptions
› Inflation, rate & amount productivity gains, consumable consumption
Increase in capital costs
› TMA inflation & design changes, plant investment to sustain, mine fleet
Permitting flexibility
› North Pit in 2026, Walter Lake impacted in 2028
Higher standards for closure plan
› Best practices to increase social license
Economic Assumptions
› Long-term gold price from US$1,250 to US$1,300 per ounce

17 17
Costs
Operating and Capital Costs Summary
Unit Costs
Capital Costs

18
Operating and Capital Costs
Description Units 2019 2020 2021 2022 2023
LOM
Total
2018-40
LOM
Average
2018-40
Unit Costs
Mining Unit Costs1,2 $/t mined 2.82 2.65 2.52 2.57 2.44 - 2.92
Processing Unit Costs1 $/t milled 9.48 9.06 8.37 8.19 8.15 - 9.25
G&A Unit Costs1,3 $/t milled 3.19 3.01 2.77 2.77 2.71 - 2.77
Site Operating Costs4 $ M 572 548 487 513 525 11,780 521
Site Capital5 $ M 224 158 135 100 88 2,519 111
Deferred Stripping $ M 48 59 131 77 0 1,097 49
Total Capital Costs $ M 272 217 266 177 88 3,616 160
Total Site Costs1,6 US$/oz sold 1,179 1,062 991 898 803 - 843
Summary
(1) Refer to the section on Non-IFRS Performance Measures on slide 3. (2) Mining unit costs exclude planned component replacements (PCR) and capitalized maintenance and repair contract (MARC).
These costs are included in capital costs. (3) Exclude costs related to agreements with Aboriginal communities. (4) Include all site costs including bullion delivery, refining and costs related to agreements with Aboriginal communities. Include
adjustments for deferred stripping and stockpile movements. (5) Include closure costs.
(6) Ounces sold = production X 97.95% (100%-2% NSR-0.05% refiners take).

19
Unit mining costs impacted by:
Lower truck haulage efficiency (trucks speeds and delays)
Higher truck hours
› Higher diesel consumption
› Increased mobile equipment maintenance costs
Unit Costs Compared to Mining Rate Mining
0
20
40
60
80
100
120
140
1.50
2.00
2.50
3.00
3.50
2014A 2015A 2016A 2017A 2018 (guid) 2019 2020 2021 2022 2023
To
nn
es
Min
ed
(M
t)
Un
it C
ost
($/t
min
ed
)
Actual Unit Rate ($/mined) 2018 LOM Tonnes Mined (Mt/yr)
* Range provided for 2019 is 115-120 Mt.
*
LOM Avg $2.92/t
20
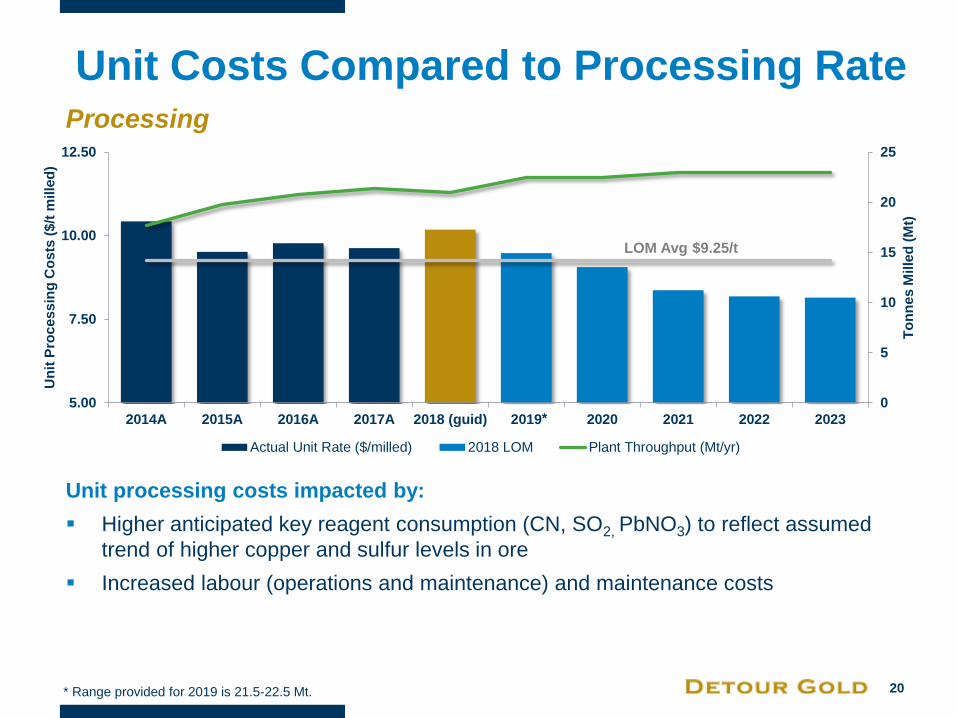
Unit Costs Compared to Processing Rate Processing
Unit processing costs impacted by:
Higher anticipated key reagent consumption (CN, SO2, PbNO3) to reflect assumed
trend of higher copper and sulfur levels in ore
Increased labour (operations and maintenance) and maintenance costs
0
5
10
15
20
25
5.00
7.50
10.00
12.50
2014A 2015A 2016A 2017A 2018 (guid) 2019 2020 2021 2022 2023
To
nn
es
Mille
d (
Mt)
Un
it P
roc
es
sin
g C
os
ts (
$/t
mille
d)
Actual Unit Rate ($/milled) 2018 LOM Plant Throughput (Mt/yr)
* Range provided for 2019 is 21.5-22.5 Mt.
*
LOM Avg $9.25/t

21
Unit Costs Compared to Processing Rates G&A and Other (excluding FN costs)
G&A and Other costs impacted by:
Higher site infrastructure costs for water management and site services
Inflationary impacts
Increased personnel on site (higher camp costs)
0
5
10
15
20
25
1.50
2.50
3.50
4.50
2014A 2015A 2016A 2017A 2018 (guid) 2019 2020 2021 2022 2023
To
nn
es
Mille
d (
Mt)
G&
A U
nit
Co
sts
($
/t m
ille
d)
Actual Unit Rate ($/milled) 2018 LOM Plant Throughput (Mt/yr)
* Range provided for 2019 is 21.5-22.5 Mt.
*

22
Description Units 2019 2020 2021 2022 2023
LOM LOM
Total Average
2018-40 2018-40
Mining1 $ M 94 94 96 75 61 1,617 72
Process plant2 $ M 37 11 7 6 6 136 6
Tailings3 $ M 77 47 28 16 18 548 24
G&A and Other4 $ M 16 6 3 2 2 68 3
Mine Closure $ M 149 7
Site Capital Costs $ M 224 158 135 100 88 2,519 111
Deferred stripping $ M 48 59 131 77 0 1,097 49
Total Capital Costs $ M 272 217 266 177 88 3,616 160
Capital Costs Summary of capital requirements over 2018 LOM Plan
Main components of capital include:
1) Replacement of truck fleet and ancillary gear and some shovels, component change outs, MARC, shop, and safety.
2) Conveyors, dust management, spares, corrosion, leach tanks, ball mill trunnions, screen replacements, and detox modifications.
3) Split approximately 15% Cell 1, 50% Cell 2 and 35% Cell 3.
4) G&A and other include capital for increasing camp capacity and quality, IT, supply chain and security systems.

23
Capital Costs
Changes from prior LOM plan:
TMA Facility & Water Management
Higher contractor rates
Dam design changes based on final
geotech evaluations (impacting Cell 2)
Processing Plant
Projects to ensure plant operating time
improvements and sustainable throughput
Health and Safety projects (Dust collection
system and cyanide off-loading)
Mining
Some additional haul truck
replacement
Pit-related infrastructure
Added safety related technology and
infrastructure
Closure Plan
Additional closure costs to achieve higher
standards
-
100
200
300
400
500
600
700
800
900
1,000
CapitalizedMining Opex
(PCRs +MARC)
MiningCapital (ExclPCR +MARC)
TMA Capital Plant Capital ClosureC
ap
ita
l C
os
t ($
M)
Site Capital Costs
2018 LOM Plan

24 24
Economic Analysis
NPV 5%
Sensitivity Analysis

25
Description Units 2019 2020 2021 2022 2023
LOM
Total
2018-40
LOM
Avg
2018-40
Revenue $ M 931 936 988 998 993 23,720 1,050
Operating Costs $ M 572 548 487 513 525 11,780 521
Total Capital Costs1 $ M 272 217 266 177 88 3,616 160
Total Site Costs2 $ M 844 765 754 690 613 15,396 681
US$/oz 1,179 1,062 991 898 803 843
Pre-tax Cash Flow3 $ M 76 164 264 308 332 8,376 371
NPV5% (pre-tax) $ M - - - - - 4,233 -
Tax4 $ M 3 5 8 7 6 1,795 79
NPV5% (after-tax) $ M 3,448
NPV5% (after Tax) = $3.45 B (@ $1,300/oz & FX rate of 1.25)
Economic Analysis*
(1) Included deferred stripping and closure costs.
(2) Refer to the section on Non-IFRS Performance Measures on slide 3.
(3) Includes adjustments for working capital movements.
(4) Calculated on site cash flows only, without benefit for tax shield from corporate, exploration and interest costs.
* Valuation is based on a start date of January 1, 2018.

26
Economic Analysis*
-10% LOM Plan +10%
Gold price 2.4
3.4
4.4
Operating Cost 4.0 2.9
Capital Expenditure 3.7 3.2
NPV5% (after tax)Sensitivity Analysis (in $ B)
C$/US$ FX Rate
Gold US$/oz 1.20 1.25 1.30
1,200 2.4 2.7 3.0
1,300 3.1 3.4 3.8
1,400 3.9 4.2 4.5
* Valuation is based on a start date of January 1, 2018.
27
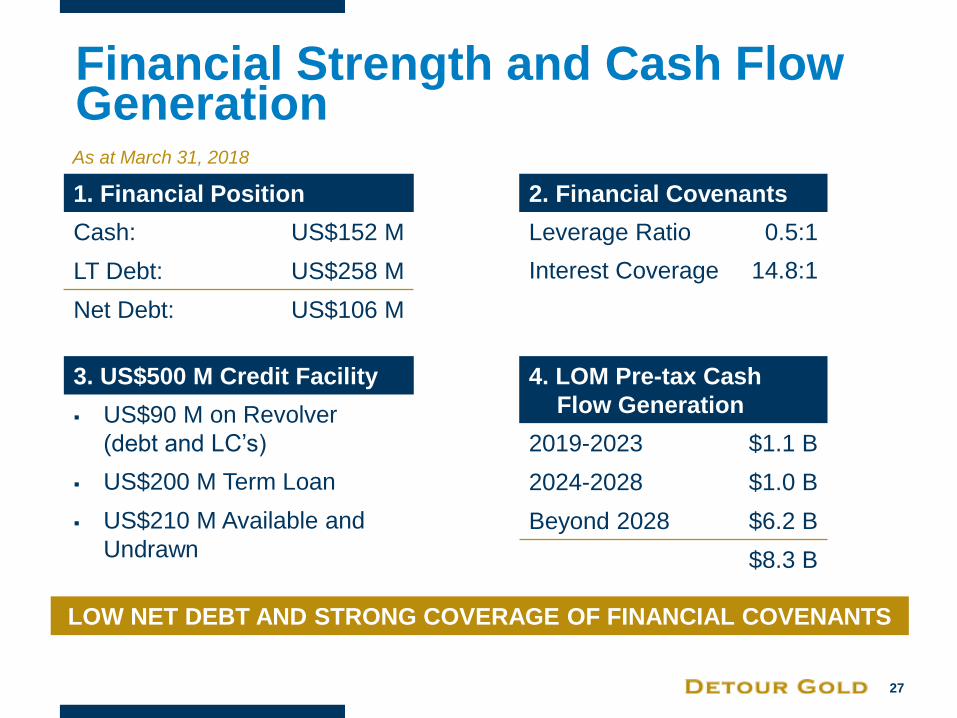
Financial Strength and Cash Flow Generation
As at March 31, 2018
1. Financial Position
Cash: US$152 M
LT Debt: US$258 M
Net Debt: US$106 M
2. Financial Covenants
Leverage Ratio 0.5:1
Interest Coverage 14.8:1
LOW NET DEBT AND STRONG COVERAGE OF FINANCIAL COVENANTS
3. US$500 M Credit Facility
US$90 M on Revolver
(debt and LC’s)
US$200 M Term Loan
US$210 M Available and
Undrawn
4. LOM Pre-tax Cash
Flow Generation
2019-2023 $1.1 B
2024-2028 $1.0 B
Beyond 2028 $6.2 B
$8.3 B

28 28
Operational Improvement Strategy

29
Focus Area Examples Expected Improvements
Timeframes
People and Organization
Structure / Effectiveness
Depth and experience to
leadership
Focus on efficiency and
communications
Culture of change
Immediate impact
Sustained improvement within
12-18 months
Benchmarking and
Gap Analysis
Plant review and re-capitalization
Mobile maintenance review Operational benchmarking
Alignment of key value drivers
Gap analysis completed (plant
and mobile fleet)
Capital injection progressing
2018-20
Sustainable benefits expected
12-36 months
Systems Focus
Mine operating systems review
Contractor management
Mine/Mill interface
Reliability & planning centered
systems
Improve stability of the operation
and operational predictability
(12-36 months)
Automation and Data
Analytics
Predictive maintenance
Tele-remote drills
Remote dozers
Semi-autonomous haul trucks
Allows for financial upside
(improvement to 2018 LOM
Plan)
Top Operational Focus Areas

30 30
Additional Information (Appendix)
Mine Production Plan
Shovel Productivity
Block Model Reconciliation
Amended Mineral Reserves
and Resources
Operational Focus Areas
SNL Benchmarking
Pit Phases
Key Risks and Opportunities

31
Mine Production Plan Full 2018 LOM (23 years)
Year Ore Mined Waste Mined Strip Ratio
Ore Processed
Head Grade Gold
Recovery Gold
Production (Mt) (Mt) (waste:ore) (Mt) (g/t Au) % koz
2018 ~107 ~4.7 ~21.0 ~0.99 90.0-91.5 595-635
2019 115 - 120 4.2 21.2-22.5 0.88-0.92 91.5 570- 605
2020 22.9 100.1 4.4 22.5 0.88 92.1 587
2021 16.5 109.3 6.6 23.0 0.91 92.1 620
2022 21.7 103.8 4.8 23.0 0.91 92.8 626
2023 27.9 98.3 3.5 23.0 0.91 92.8 623
2024 26.4 102.4 3.9 23.0 0.89 92.8 610
2025 24.0 100.0 4.2 23.0 0.93 92.9 641
2026 17.1 110.8 6.5 23.0 0.90 92.8 621
2027 19.6 111.0 5.7 23.0 0.88 92.8 606
2028 20.5 110.3 5.4 23.0 0.90 92.8 617
2029 19.8 91.9 4.6 23.0 0.90 92.8 615
2030 21.8 96.1 4.4 23.0 0.94 92.9 648
2031 31.3 73.5 2.3 23.0 1.01 93.0 695
2032 35.8 48.1 1.3 23.0 1.01 93.0 693
2033 12.7 45.4 3.6 23.0 0.98 93.0 674
2034 16.3 40.6 2.5 23.0 0.96 92.9 662
2035 23.8 42.4 1.8 23.0 1.05 93.1 726
2036 30.9 32.2 1.0 23.0 1.13 93.2 778
2037 24.9 23.5 0.9 23.0 1.18 93.3 811
2038 21.3 20.2 0.9 23.0 1.25 93.4 860
2039 8.9 10.8 1.2 23.0 1.02 93.0 702
2040 3.0 0.1 0.0 13.9 0.65 92.2 268
Total 488 1,653 3.4 517 0.97 92.8 14,884
Average 21.6 73.1 3.4 22.9 - - 659

32
Rope Shovel Production
Rope shovels priority for waste production
Modeling has increased with time reflecting increased efficiency and increased availability from current operating levels
10.0
12.5
15.0
17.5
20.0
22.5
25.0
27.5
30.0
2014(A)
2015(A)
2016(A)
2017(A)
2018 (F) 2019 2020 2021 2022 2023 2024 2025 2026 2027 2028
Mt/
yr
CAT 7495 Rope Shovel Production per Year per Unit

33
Hydraulic Shovel Production
CAT 6060 shovels will move the bulk of ore tonnes and the balance of waste remaining from CAT 7495s
Moderate increase in future years
An increase in productivity will decrease mining costs
11.0
11.5
12.0
12.5
13.0
13.5
14.0
14.5
15.0
15.5
2014(A)
2015(A)
2016(A)
2017(A)
2018 (F) 2019 2020 2021 2022 2023 2024 2025 2026 2027 2028
Mt/
yr
CAT 6060 Hydraulic Shovel Production per Year per Unit

34
Block Model Reconciliation Reserve to Declared Ore Mined
Recent external resource audit completed in 2018 by SRK confirms the integrity of the Detour Lake resource model
SRK: “Methodology used to estimate the Detour Lake mineral resource was reasonable and
based on generally accepted best practices.”
Reserve model has been accurate to predict annual results
Historical variability has been largely within a 10% window
2.9%
12.5%
6.7%
-4.7%
2.8% 4.40%
1.1%
-6.2% -5.4%
1.8%
8.3%
-1.60%
4.1%
5.5%
1.0%
-3.0%
11.3%
2.80%
-20%
-15%
-10%
-5%
0%
5%
10%
15%
20%
2014 2015 2016 2017 2018 (TO END OF
M AY)
2014 TO DATE
Block Model Reconcilliation
Tonnage Grade Ounce

35
Amended Reserves & Resources Notes:
1. The Company’s amended mineral reserve and
mineral resource estimates effective December
31, 2017 are classified in accordance with the
Canadian Institute of Mining, Metallurgy and
Petroleum (“CIM”) “CIM Definition Standards –
For Mineral Resources and Mineral Reserves”
adopted by the CIM Council (as amended, the
“CIM Definition Standards”) in accordance with
the requirements of National Instrument 43-101
“Standards of Disclosure for Mineral Projects”
(“NI 43-101”). Mineral reserve and mineral
resource estimates reflect the Company’s
reasonable expectation that all necessary permits
and approvals will be obtained and maintained.
2. Mineral reserves were estimated using a gold
price of US$1,000/oz and mineral resources were
estimated using a gold price of US$1,200/oz at a
CAD/US exchange rate of 1.10.
3. Mineral reserves and resources were based on a
cut-off grade of 0.50 g/t Au.
4. LG Fines (sourced from material grading 0.40-
0.50 g/t Au) classified as Measured and Indicated
were reported as Probable mineral reserves and
included in the mine plan. LG Fines also include
1.7 Mt averaging 0.45 g/t Au.
5. Further information, including key assumptions,
parameters, and methods used to estimate
mineral resources and mineral reserves are
described in the Technical Report on the Detour
Lake operation, dated March 22, 2017.
6. Mineral resources are reported exclusive of
mineral reserves. Mineral resources that are not
mineral reserves do not have demonstrated
economic viability. Mineral resources are
constrained within an economic pit shell.
7. Totals may not add due to rounding.
Effective Dec. 31, 2017
Reserves Tonnes
(millions)
Grade
(g/t Au)
Contained
Gold Ounces
(000’s oz)
Detour Lake Pit Proven 88.8 1.24 3,538
Probable 344.6 0.92 10,233
Total P&P 433.4 0.99 13,771
West Detour Pit Proven 1.9 0.96 60
Probable 53.0 0.94 1,596
North Pit Probable 6.0 0.98 187
Total P&P 60.9 0.94 1,843
LG Fines Probable 22.6 0.59 431
Total P&P 516.9 0.97 16,044
Resources
Detour Lake Pit Measured 16.4 1.33 701
Indicated 65.5 0.99 2,092
M+I 81.9 1.06 2,793
West Detour Pit Measured 0.3 0.93 9
Indicated 28.5 0.88 806
North Pit Indicated 2.1 0.93 64
M+I 31.0 0.88 878
Total M+I 112.9 1.01 3,671
Detour Lake Mine Inferred 33.1 0.79 842
West Detour Pit Inferred 9.2 0.95 280
North Pit Inferred 0.1 0.85 2
Total Inferred 42.4 0.82 1,124

36
Operational Focus Areas
1. People & Organizational Structure – Top Priority
Commentary:
Currently have an engaged and committed site leadership team and
workforce
Adding depth and experience to the organization to support soon-to-be-
hired MGM
New positions: senior mine manager and senior maintenance manager
Allow Leaders to work on efficiency and improvements as opposed to
fire fighting
Behaviour based and leadership training
37
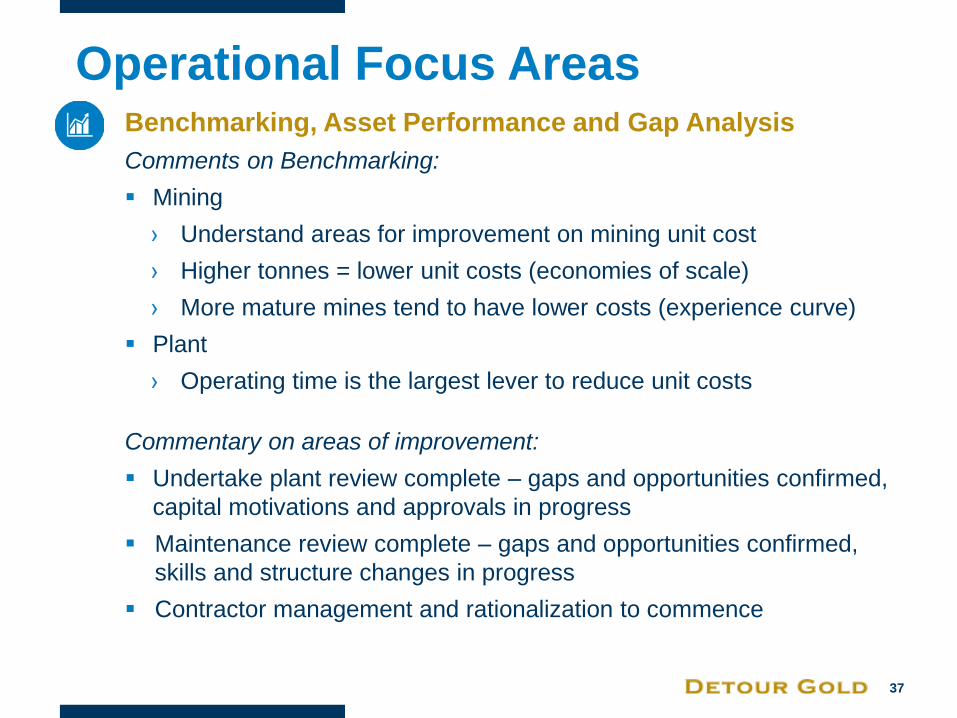
Operational Focus Areas
2. Benchmarking, Asset Performance and Gap Analysis
Comments on Benchmarking:
Mining
› Understand areas for improvement on mining unit cost
› Higher tonnes = lower unit costs (economies of scale)
› More mature mines tend to have lower costs (experience curve)
Plant
› Operating time is the largest lever to reduce unit costs
Commentary on areas of improvement:
Undertake plant review complete – gaps and opportunities confirmed,
capital motivations and approvals in progress
Maintenance review complete – gaps and opportunities confirmed,
skills and structure changes in progress
Contractor management and rationalization to commence

38
Operational Focus Areas
3. Systems Focus Improve operational stability and
predictability
Fleet management
Maintenance based on reliability & planning
Optimization and standardization of Mine Operating Systems in
Operations and Maintenance
Improved Root Cause Analysis and Failure Mode and Effects Analysis
Key focus area Mine Mill Interface to reduce mine operating costs
and increase plant milling rates
Additional SAP training

39
Operational Focus Areas
4. Automation, Analytics & Technology
Data Analytics
› Improved Data Management – integrated systems, acquires, filter,
analyze, make decisions
› Improved data collection and use in reliability-based maintenance
Automation / Technology – upside to 2018 LOM
› Tele-remote drilling (H2 2018); followed by evaluation of automation
› Feasibility of CAT truck fleet automation
› Evaluation of trolley assist trucks (on dump)

40
SNL Benchmarking – Mining1 (2017 Costs)
1. North American OP operations
50-150 Mt/yr
Cu and Au operations
source data SNL database
All costs in US$ / tonne
Commentary on this dataset:
Potential for +10% improvement on Mining unit cost
Not all data points allow for direct comparison, but present a trend:
Higher tonnes = lower unit costs (economies of scale)
More mature mines tend to have lower costs (experience curve)

41
SNL Benchmarking – Processing1 (2017 Costs)
1. North American Plant operations
5-50 Mt/yr
Cu, Au and Heap leach operations
source data SNL database
All costs in US$ / tonne
Commentary: DGC does not have many direct peers for plants
Not all benchmarking data comparable; not all data reliable
We do know, there is room for improvement

42
Detour Lake - Pit Phases

43
Opportunities not in 2018 LOM Plan
Additional optimization studies initiated for equipment
productivity improvements
Fleet automation and technology advancements including semi-
autonomous and/or trolley line
Reducing dilution from current assumptions
Further improvements in plant operating time, gold recovery and
plant throughput
Potential to add mineral resources
Obtaining key operational permits ahead of planned schedule
Potential to convert mineral resources into mineral reserves
Advancing Zone 58N to development and production
Renewal of electricity contract post 2024
Remote mining tax application

44
Risks to the 2018 LOM
Further delays in obtaining various operating permits
Not achieving the 2018 LOM Plan assumptions including mining
productivities and processing plant capital effectiveness
Adverse gold price and/or CAD/US exchange rate over a long-
time period
Adverse mineralogy in ore feed

45 45
Contact Information
Laurie Gaborit VP Investor Relations
Email: [email protected]
Phone: 416.304.0581
www.detourgold.com
Michael Kenyon Interim CEO
Phone: 416.304.0800