Canada Research Redknee Solutions Inc. - Life Well Planned · Canada Research Published by Raymond...
37
Canada Research Published by Raymond James Ltd. Please read domestic and foreign disclosure/risk information beginning on page 33 and Analyst Certification on page 32. Raymond James Ltd. | 2100 – 925 West Georgia Street | Vancouver BC Canada V6C 3L2 Redknee Solutions Inc. November 14, 2014 RKN-TSX Company Report - Initiation of Coverage Steven Li CFA | 416.777.4918 | [email protected] Jonathan Lo (Associate) | 416.777.6414 | [email protected] Software/IT Services Initiating Coverage of Redknee with an Outperform Rating Recommendation Carriers globally have invested $40 bln+ per year over the last few years upgrading their networks to LTE, but now face legacy billing systems that restrict their ability to fully monetize their data traffic. Redknee is a vendor of real-time converged billing software and the recent acquisition of NSN BSS business has transformed Redknee from a niche to a top 10 BSS vendor (quadrupling its revenue base). With much of the synergies (revenue and cost) and scale benefits from the acquisition still ahead of them, we are initiating coverage with an Outperform rating. Analysis Organic growth opportunities. The traditional IRCM market is growing at a 3% CAGR (according to Gartner). With the scale gained from the NSN BSS acquisition, we see plenty of opportunities to add market share as Redknee looks to expand within global group operators that are already using Redknee/NSN solutions in certain geographic regions. Redknee is also using the same billing technology to target non- telco environments with an early focus on utilities (smart meters). We estimate non- telco revenues to be minimal at this point, but management expects utilities to contribute ~10% of its bookings in F2015. Increasing importance of real-time – Redknee’s heritage. The ability to rate and charge subscribers in real-time is key to the introduction of many new revenue generating services. Redknee began as a BSS provider of prepaid billing and charging systems. Prepaid BSS is inherently a real-time solution in order to deduct usage from a subscriber’s prepaid balance instantly. Redknee’s software stack is built from the ground up with real-time at the core, and now includes both prepaid and postpaid in a real-time converged system. Model – F2015 consensus looks a little high, but a reset priced-in inexpensive valuation. Our F2015 estimates include revenues of $262 mln (+1% y/y), adj. EBITDA of $33 mln (or 12.5%) and adj. EPS of $0.13. This is below consensus of $275 mln revenue (+6% y/y), $38 mln adj. EBITDA (or 14%), and $0.17 EPS. Our F2016 estimates include revenues of $278 mln (+6% y/y), adj. EBITDA of $50 mln, and adj. EPS of $0.25. Valuation Our C$5.40 target price is based on 9x C2016E adj. EBITDA, at a discount to a group of Canadian software companies given Redknee’s profitability is still lagging. Redknee currently trades at 7x C2016E adj. EBITDA, in-line with other pure-play OSS/BSS vendors and NEPs at ~7x EBITDA and at a discount to other Canadian software companies which trade at 12x EBITDA on average. See our Valuation & Recommendation section for more details. EPS 1Q 2Q 3Q 4Q Full Revenues EBITDA Dec Mar Jun Sep Year (mln) (mln) 2013A US$(0.02) US$0.03 US$0.00 US$(0.01) US$0.03 US$142 US$11 2014E (0.03)A 0.05A (0.06)A (0.01) (0.03) 258 10 2015E NA NA NA NA 0.13 262 33 2016E NA NA NA NA 0.25 278 50 Source: Raymond James Ltd., Thomson One Outperform 2 C$5.40 target price Current Price ( Nov-10-14 ) C$4.06 Total Return to Target 33% 52-Week Range C$7.82 - C$3.15 Suitability Aggressive Growth Market Data Market Capitalization (mln) US$390 Current Net Debt (mln) -US$52 Enterprise Value (mil.) US$338 Shares Outstanding (mln, f.d.) 108.9 10 Day Avg Daily Volume (000s) 410 Dividend/Yield C$0.00/0.0% Key Financial Metrics 2013A 2014E 2015E 2016E P/E NM NM 27.2x 14.5x EV/EBITDA 30.0x 32.4x 10.4x 6.8x EV/Revenue NA 1.3x 1.3x 1.2x Company Description Redknee provides BSS software for communication service providers to offer value added services for better monetization of their networks via real-time converged billing, charging, and customer care.
Transcript of Canada Research Redknee Solutions Inc. - Life Well Planned · Canada Research Published by Raymond...

Canada Research Published by Raymond James Ltd.
Please read domestic and foreign disclosure/risk information beginning on page 33 and Analyst Certification on page 32. Raymond James Ltd. | 2100 – 925 West Georgia Street | Vancouver BC Canada V6C 3L2
Redknee Solutions Inc. November 14, 2014 RKN-TSX Company Report - Initiation of Coverage Steven Li CFA | 416.777.4918 | [email protected]
Jonathan Lo (Associate) | 416.777.6414 | [email protected]
Software/IT Services
Initiating Coverage of Redknee with an Outperform Rating
Recommendation Carriers globally have invested $40 bln+ per year over the last few years upgrading their networks to LTE, but now face legacy billing systems that restrict their ability to fully monetize their data traffic. Redknee is a vendor of real-time converged billing software and the recent acquisition of NSN BSS business has transformed Redknee from a niche to a top 10 BSS vendor (quadrupling its revenue base). With much of the synergies (revenue and cost) and scale benefits from the acquisition still ahead of them, we are initiating coverage with an Outperform rating.
Analysis Organic growth opportunities. The traditional IRCM market is growing at a 3% CAGR
(according to Gartner). With the scale gained from the NSN BSS acquisition, we see plenty of opportunities to add market share as Redknee looks to expand within global group operators that are already using Redknee/NSN solutions in certain geographic regions. Redknee is also using the same billing technology to target non-telco environments with an early focus on utilities (smart meters). We estimate non-telco revenues to be minimal at this point, but management expects utilities to contribute ~10% of its bookings in F2015.
Increasing importance of real-time – Redknee’s heritage. The ability to rate and charge subscribers in real-time is key to the introduction of many new revenue generating services. Redknee began as a BSS provider of prepaid billing and charging systems. Prepaid BSS is inherently a real-time solution in order to deduct usage from a subscriber’s prepaid balance instantly. Redknee’s software stack is built from the ground up with real-time at the core, and now includes both prepaid and postpaid in a real-time converged system.
Model – F2015 consensus looks a little high, but a reset priced-in inexpensive valuation. Our F2015 estimates include revenues of $262 mln (+1% y/y), adj. EBITDA of $33 mln (or 12.5%) and adj. EPS of $0.13. This is below consensus of $275 mln revenue (+6% y/y), $38 mln adj. EBITDA (or 14%), and $0.17 EPS. Our F2016 estimates include revenues of $278 mln (+6% y/y), adj. EBITDA of $50 mln, and adj. EPS of $0.25.
Valuation Our C$5.40 target price is based on 9x C2016E adj. EBITDA, at a discount to a group of Canadian software companies given Redknee’s profitability is still lagging. Redknee currently trades at 7x C2016E adj. EBITDA, in-line with other pure-play OSS/BSS vendors and NEPs at ~7x EBITDA and at a discount to other Canadian software companies which trade at 12x EBITDA on average. See our Valuation & Recommendation section for more details.
EPS 1Q 2Q 3Q 4Q Full Revenues EBITDA Dec Mar Jun Sep Year (mln) (mln)
2013A US$(0.02) US$0.03 US$0.00 US$(0.01) US$0.03 US$142 US$11
2014E (0.03)A 0.05A (0.06)A (0.01) (0.03) 258 10
2015E NA NA NA NA 0.13 262 33
2016E NA NA NA NA 0.25 278 50
Source: Raymond James Ltd., Thomson One
Outperform 2 C$5.40 target price
Current Price ( Nov-10-14 ) C$4.06 Total Return to Target 33% 52-Week Range C$7.82 - C$3.15 Suitability Aggressive Growth
Market Data Market Capitalization (mln) US$390 Current Net Debt (mln) -US$52 Enterprise Value (mil.) US$338 Shares Outstanding (mln, f.d.) 108.9 10 Day Avg Daily Volume (000s) 410 Dividend/Yield C$0.00/0.0%
Key Financial Metrics 2013A 2014E 2015E 2016E
P/E NM NM 27.2x 14.5x
EV/EBITDA 30.0x 32.4x 10.4x 6.8x
EV/Revenue NA 1.3x 1.3x 1.2x
Company Description Redknee provides BSS software for communication service providers to offer value added services for better monetization of their networks via real-time converged billing, charging, and customer care.
Canada Research | Page 2 of 37 Redknee Solutions Inc.
Raymond James Ltd. | 2100 – 925 West Georgia Street | Vancouver BC Canada V6C 3L2
Table of Contents
Investment Thesis ........................................................................................................................................ 3
Investment Risks .......................................................................................................................................... 6
Company Description & History .................................................................................................................. 7
Industry Overview & Growth Opportunities ................................................................................................ 7
Customers & Markets Served ...................................................................................................................... 15
Products ....................................................................................................................................................... 16
Competition & Industry Commentary ......................................................................................................... 17
Financial Model Highlights ........................................................................................................................... 20
Financial Model Forecasts ........................................................................................................................... 23
Valuation & Recommendation .................................................................................................................... 24
Appendix I: Financial Statements ................................................................................................................ 25
Appendix II: Management & Board of Directors ......................................................................................... 27
Appendix III: Share Ownership & Insider Holdings ...................................................................................... 29
Appendix IV: Definitions .............................................................................................................................. 30

Redknee Solutions Inc. Canada Research | Page 3 of 37
Raymond James Ltd. | 2100 – 925 West Georgia Street | Vancouver BC Canada V6C 3L2
Investment Thesis
Redknee is an Integrated Revenue and Customer Management (IRCM) vendor specializing mostly in Business Support Systems (BSS). Redknee’s BSS software allows communication service providers (CSPs) to offer value added services (e.g. data boosts, tiered pricing) for better monetization of their networks through real-time converged billing, charging, customer care, and payment solutions. The IRCM market is estimated to grow to $21 billion in 2018 (from $18 billion in 2013) according to Gartner, a 3.2% CAGR (Gartner Forecast Analysis: Telecom Operations Management Systems (BSS, OSS and SDP), Worldwide, 1Q14 Update). In 2013, Redknee acquired the BSS unit of Nokia Siemens and quadrupled its revenue base to ~$250 million. Notable Tier 1 customer success stories include: Vodafone India (100 million subscribers supported in one deployment; 20% increase in data revenue), Telus (50% increase in annual average revenue per unit (ARPU) over market average) and Telecommunications Services of Trinidad and Tobago (7% revenue increase).
New Technology Deployments New technology deployments such as LTE drive IRCM spending. Despite the ongoing challenging macro, CSPs have continued to invest heavily in their networks advancing from 3G to 4G more recently. Each generation of network technology is accompanied by the latest billing/charging systems at the time, which means some Tier 1s can have 8-10 different billing systems across their entire network. Subscribers on older network technologies continue to run on legacy systems as risk adverse CSPs choose to retain legacy systems to support their existing customer bases. This inevitably creates a disjointed back office system unable to smoothly rollout new business models and new services across all subscribers simultaneously. We believe modernization programs will drive market growth as CSPs transform their back office infrastructure to better monetize their investments, differentiate their services, and remain competitive. In other instances, regulations are driving modernization. The European Union is imposing regulations on CSPs on how much they can charge foreign mobile users to roam on their networks. By December 15, 2015, the EU will only allow CSPs to charge the same to a roaming customer as they would to a domestic customer. This requires a modernized BSS that is capable of supporting roaming customers, quickly routing the roaming charges to the provider, as well as properly rating and charging the customer.
The Need for Revenue-Generating Services According to Gartner, LTE rollouts have launched at 268 operators in 100 countries as of February 2014 with ~$40 billion spent on mobile infrastructure alone. At the same time however, telecom ARPUs are not growing. Gartner forecasts worldwide annual ARPU per subscriber will decrease from $157.50 in 2013 to $149.20 in 2018, a 5% decline as competition intensifies. While mobile subscriber growth of 5.5% CAGR from 2013 to 2018 (6.5 billion to 8.5 billion subscribers) helps offset the declining ARPU to some extent (mostly in emerging markets), CSPs in developed markets (where subscriber growth is minimal) need a better way to monetize data traffic to improve their return on investment. We have also started to see a slowdown in capex, especially in developed markets (for example, AT&T’s recent capex cut). While it might be a little counterintuitive, we expect as more operators complete roll outs, they may begin to look to invest in more agile BSS systems to monetize new services. Some examples of new services that are being deployed by CSPs using more agile BSS systems include: Turbo Boost for Data, Over-The-Top Digital services, Tiered pricing / innovative pricing models, and Campaigns, amongst others.

Canada Research | Page 4 of 37 Redknee Solutions Inc.
Raymond James Ltd. | 2100 – 925 West Georgia Street | Vancouver BC Canada V6C 3L2
Exhibit 1: Forecast Worldwide Mobile Infrastructure Spending Increases as ARPU Decreases
Source: Gartner (Forecast Analysis: Carrier Network Infrastructure, Worldwide, 1Q14 Update & Forecast: Mobile Services, Worldwide, 2011-2018, 1Q14 Update), Raymond James Ltd.
Increasing Importance Of Real-Time – Redknee’s Heritage Customer expectations are changing; now expecting control and transparency with the services they are purchasing, including the ability to change their tariff options/rate plans themselves for immediate use. A real-time BSS is becoming increasingly critical as the telecommunications industry trends toward increasing data consumption. The ability to rate and charge subscribers in real-time is key not only to the introduction of new revenue generating services, but also other capabilities like accurate data overage warnings. Redknee began as a BSS provider of prepaid billing and charging systems. Prepaid BSS is inherently a real-time solution in order to deduct usage from a subscriber’s prepaid balance instantly as minutes, text messages, or data are used. Postpaid BSS historically has been different as subscribers use the CSPs services and are billed after the fact. In postpaid, the BSS only needs to generate the usage summary and invoice once a month (well after services are used); a much less resource intensive solution compared to prepaid. Redknee’s software stack is built from the ground up with real-time at the core, and now includes both prepaid and postpaid in a real-time converged system. Many of Redknee’s competitors are approaching the demand for real-time at the core from the other direction (from legacy postpaid systems), resulting in a less streamlined solution, while Redknee is battle proven at a large scale (100 million subscribers supported at one customer’s deployment). Gartner’s Magic Quadrant (October 2014) for IRCM for CSPs puts Redknee in the challengers quadrant, as a vendor with strong ability to execute, but still developing its overall vision (see Exhibit 2). From the March 29, 2013 acquisition of NSN BSS to October 28, 2014, Redknee has made 53 news releases announcing organic new customer wins (14), upsells (7), upgrades (3), renewals (7) and NSN BSS acquired renewals (22).

Redknee Solutions Inc. Canada Research | Page 5 of 37
Raymond James Ltd. | 2100 – 925 West Georgia Street | Vancouver BC Canada V6C 3L2
Exhibit 2: Gartner Magic Quadrant for Integrated Revenue and Customer Management for CSPs
Source: Gartner (October 2014)
Growth Opportunities
Redknee has a three pronged growth strategy involving organic growth, M&A, and expansion into new market verticals. With the scale gained from the NSN BSS acquisition, Redknee is looking to expand within global group operators that are already using Redknee’s solutions in certain geographic regions. For instance, the relationship with Digicel began in Jamaica and has now expanded to cover all of its 31 countries in the Caribbean, Central America, and Oceania. Similarly, Vodafone (over 20 countries in EMEA and APAC), Vodacom (over 40 countries in Africa), America Movil (18 countries in Latin America and the US), Telekom Austria Group (8 European countries), Orange (over 32 countries in EMEA and the US), and Telefonica (over 21 countries in Europe, Americas, and Asia) are all potential organic growth opportunities for Redknee over the next couple of years with several of those already in discussions. The Redknee Unified Connected Suite also brings real-time rating, charging and billing to the Internet of Things (IoT) given its ability to manage billions of transactions in real-time with partner billing and settlement, and tiered rate and tariff plans based on time of day, resource availability or other parameters. In addition, Redknee has started to bid on contracts for smart metering. We estimate revenues from IoT to be minimal at this point, but management expects utilities to contribute ~10% of its bookings in F2015.
Strong Team The executive team, led by founder and CEO Lucas Skoczkowski, is very experienced and consists of both long-tenured executives and new executives with diverse relevant experiences including telecom, engineering and IT. As Redknee’s founder and first employee, CEO Lucas Skoczkowski has been directing the execution of Redknee’s business activities and corporate operations since 1999. Prior to Redknee, Lucas gained considerable experience in sales, operations, business and product development with a variety of international companies including Nortel Networks (USA, UK, Canada) and Clearnet Communications Inc. Management and Directors own about 13.7% of shares outstanding.

Canada Research | Page 6 of 37 Redknee Solutions Inc.
Raymond James Ltd. | 2100 – 925 West Georgia Street | Vancouver BC Canada V6C 3L2
Exhibit 3: Insider Ownership (as at Nov-10-14)
Insider Holders Position with the Company Shares % of O/S Options RPSU RRSU RSU RDSU
Lucas Skoczkowski CEO, Director, Co-Founder 8,897,017 8.17% 1,130,054 92,262
Vishal Kothari COO, Co-Founder 4,402,942 4.04% 568,797 47,619
Kent Thexton Chairman of the Board 867,285 0.80% 57,500 94,313
Nitin Singhal VP - Partner Alliances 244,210 0.26% 378,574 16,667
David Charron CFO 175,439 0.16% 693,477 42,857
Stephen Davies Director 158,730 0.15% 20,000 94,313
Alan Michels Director 100,000 0.09% 20,000 94,313
Terry Nickerson Director 50,000 0.05% 82,415
Christopher Newton-Smith VP - Marketing 21,735 0.02% 391,707 22,321 5,122
Chris McGrady VP - HR, Integration Management,
and Corporate IT & Security
161,707 61,872 59,699
Roy Smeets VP - R&D 48,269 17,460 35,088
Gregory Jacobsen Director 84,915
14,917,358 13.74% 3,470,085 301,058 64,821 35,088 450,269
Source: Ink Research, Raymond James Ltd.
Investment Risks
Macroeconomic risk – Global macroeconomic health can have a significant effect, either positive or negative, on Redknee’s customers and demand for Redknee’s products. Currency fluctuations – Following the acquisition of the NSN BSS business in 2013, ~70% of Redknee’s revenues are generated outside of the US (mostly EMEA and APAC). Redknee reports in US dollars. When the euro appreciates 1% against the US dollar, Redknee’s revenue increases by $1.2 million (+0.5%) and the EBIT increases $0.5 million (+0.45%). When the Canadian dollar appreciates 1% against the US dollar, EBIT decreases by $0.15 million (-0.13%).
Revenue Distribution Expense Distribution
Currency % Currency %
EUR 48% EUR 50%
USD 30% USD 5%
CAD 1% CAD 12%
INR 2% INR 11%
Other 19% Other 22%
Total 100% Total 100% Acquisition of NSN BSS business – Given the previously bundled pricing of the acquired NSN contracts and the size of the NSN employee base moving over to Redknee, it may be challenging to integrate, maintain, and grow the NSN BSS business as well as retain and blend the cultures of the two companies. Highly competitive industry – Redknee competes with large multi-disciplinary and network equipment providers such as Amdocs, Ericsson, Comverse, Oracle, SAP, and Huawei. Increased competition may cause pricing pressure, reduced gross margins, and loss of market share. Long lead times – Customers invest significant time and resources to test live the solutions provided by Redknee resulting in long lead times from first contact to actual sale. Customer credit risk – Industry practice is to bill customers when specific milestones are achieved, exposing the company to credit risk from its customers, channel partners, and third parties. Quarterly fluctuations; no quarter to quarter boundaries – While reporting quarterly results, Redknee internally does not bound itself on a quarterly basis due to the nature of contract negotiations which could give customers leverage in contract negotiations. This has recently resulted in lumpy revenues quarter to quarter. As a result of the variability between quarters,
Redknee Solutions Inc. Canada Research | Page 7 of 37
Raymond James Ltd. | 2100 – 925 West Georgia Street | Vancouver BC Canada V6C 3L2
revenue mix can vary greatly too, especially if less license sales occur in the quarter and more low margin professional services and 3rd party hardware/software is sold.
Company Description & History
Based in Mississauga, Canada, Redknee (established in 1999) is a provider of real-time converged billing, charging, customer care and payment solutions for communications providers globally, on-premise and through the cloud. Telecommunications companies use Redknee’s software to consolidate all of the chargeable services into a single bill including voice, data, text, multimedia, and content. This solution is provided in real-time allowing the end user to see their usage and the relevant charges to their account instantly. Historically, the company has made periodic acquisitions to expand its product offering, customer base, and geographic growth.
Acquisition of Argent In 2007, Redknee acquired Argent Networks to extend its operations in Australia, the Middle East and US, and expand its offerings into interconnect billing, content settlement and real-time mediation, rating, billing and customer care for prepaid and postpaid services. The acquisition added 18 new customers in emerging markets and 5 in North America.
Acquisition of Nimbus Systems In 2010, Redknee acquired Nimbus Systems adding 10 Spanish customers including Tier 1 customers Telefonica, Orange and Vodafone.
Acquisition of Nokia Siemens Networks’ Business Support Systems (NSN BSS) On March 29, 2013, the company acquired the Nokia Siemens Networks' Business Support Systems business unit. The NSN BSS business unit provided real-time charging, rating, policy and customer care solutions to more than 130 communication service providers and added multiple Tier 1 operators from across the globe. Redknee acquired the BSS customer and supplier contracts, intellectual property rights, tangible assets and associated liabilities, along with the transfer of BSS employees, tripling its customer base.
Industry Overview & Growth Opportunities
Redknee is an IRCM vendor specializing mostly in BSS. Redknee’s BSS software allows CSPs to offer value added services (e.g. data boosts, tiered pricing) for better monetization of their networks through real-time converged billing, charging, customer care and payment solutions. The IRCM market is estimated to grow to $21 billion in 2018 (from $18 billion in 2013) according to Gartner, a 3.2% CAGR (Gartner Forecast Analysis: Telecom Operations Management Systems (BSS, OSS and SDP), Worldwide, 1Q14 Update).

Canada Research | Page 8 of 37 Redknee Solutions Inc.
Raymond James Ltd. | 2100 – 925 West Georgia Street | Vancouver BC Canada V6C 3L2
Exhibit 4: IRCM Market Growth Forecast
Source: Gartner (Forecast Analysis: Telecom Operations Management Systems (BSS, OSS and SDP), Worldwide, 1Q14 Update), Raymond James Ltd.
New Technology Deployments New technology deployments such as LTE drive IRCM spending. Despite the ongoing challenging macro, CSPs have continued to invest heavily in their networks, advancing from 3G to 4G more recently. Each generation of network technology is accompanied by the latest billing and charging systems at the time which means some Tier 1s can have 8-10 different billing systems across their entire network. Subscribers on older network technologies continue to run on legacy systems as risk adverse CSPs choose to retain legacy systems to support their existing customer bases. This inevitably creates a disjointed back office system unable to smoothly rollout new business models and new services across all subscribers simultaneously. We believe modernization programs will drive market growth as CSPs transform their back office infrastructure to better monetize their investments, differentiate their services and remain competitive. CSPs approach these modernization programs in different ways. Some are embracing a 100% transformation strategy which allows for legacy systems to remain online until the new system is implemented, with the advantage of full system capability once complete. The risk of a 100% implementation is high upfront capital and time commitments. Some use a “cap and grow” approach where legacy systems are capped at certain subscriber levels and all new subscribers or those on next generation technologies (3G/4G/LTE) are launched on the new BSS system. The problem is that CSP back office infrastructure remains disparate and expensive to maintain. Redknee’s approach is more hybrid in nature as it overlays a modular system over a CSP’s entire subscriber base, retaining the legacy system, but gradually implementing new services to the entire subscriber base starting with the highest ROI customer segment or functions (bill shock prevention, over-the-top app services [digital services], bonus/loyalty programs, self-care capabilities, etc.). Redknee’s approach eventually allows the new BSS system to completely replace the legacy system, albeit over a longer period of time.
The Need for New Revenue-Generating Services The telecommunications industry has invested significant capital into expanding and improving their networks from 2G to 3G to 4G/LTE. According to Gartner (Forecast Analysis: Carrier Network Infrastructure, Worldwide, 1Q14 Update – March 31, 2014), LTE rollouts have launched at 268 operators in 100 countries as of February 2014 (up from 222 operators in 83 countries in October 2013) a 21% increase in 4 months. According to the same report, annual mobile infrastructure spending in 2013 was ~$40 billion and is forecast to increase moderately each year to nearly ~$47 billion by 2018. At the same time, telecom’s ARPUs are not growing. Gartner forecasts worldwide

Redknee Solutions Inc. Canada Research | Page 9 of 37
Raymond James Ltd. | 2100 – 925 West Georgia Street | Vancouver BC Canada V6C 3L2
annual ARPU per subscriber will decrease from $157.50 in 2013 to $149.20 in 2018, a 5% decline as competition intensifies. While mobile subscriber growth of 5.5% CAGR from 2013 to 2018 (6.5 billion to 8.5 billion subscribers) helps offset the declining ARPU to some extent (mostly in emerging markets), CSPs in developed markets (where subscriber growth is minimal) need a better way to monetize data traffic to improve their return on investment. Exhibit 5: Forecast Worldwide Mobile Infrastructure Spending Increases as ARPU Decreases
Source: Gartner (Forecast Analysis: Carrier Network Infrastructure, Worldwide, 1Q14 Update & Forecast: Mobile Services, Worldwide, 2011-2018, 1Q14 Update), Raymond James Ltd.
Below are some examples of new services that are being deployed by CSPs using more agile BSS systems: Turbo Boost for Data: This is the throttling up of download speeds (i.e. 3G to 4G/LTE) and bandwidth allocation for a short period of time for a one-time fee. The cue would occur when a customer starts downloading a movie, for example, with a pop up box offering the turbo boost for a certain price, say $1 for the next 30 minutes/hour. This could be useful for readiness-to-pay customers who are going to lose connectivity by going on a plane, cruise ship or crossing into a roaming zone.
Source: Redknee Solutions Inc. Over-The-Top (OTT) or Digital services: Over-the-top services include apps like Facebook, YouTube, Twitter, Netflix, Spotify, Skype, Whatsapp and other digital content or third party apps not provided by the CSP. OTT services are driving explosive demand for bandwidth while CSPs

Canada Research | Page 10 of 37 Redknee Solutions Inc.
Raymond James Ltd. | 2100 – 925 West Georgia Street | Vancouver BC Canada V6C 3L2
absorb the costs of the network and see lower returns on investment. The use of messaging apps like Whatsapp, or voice apps like Skype also reduce the use of SMS (text messaging) and voice services. As a result, CSPs have been increasingly partnering with OTTs to share in the rewards – a model only possible with a modernized BSS with policy management and real-time capability. For example, a customer can buy unlimited Spotify (online music streaming) usage separately from his regular data limits. In addition, the quality of service can vary as well where the unlimited specific-use add-on for music streaming gets the fastest network speeds all the time versus a user on a regular data plan that could get throttled down to 3G speeds from 4G/LTE. T-Mobile US began offering (June 2014) a differentiated service called Music Freedom where customers have access to six music streaming services which do not contribute to the users’ data usage. The OTT subscription payment is usually processed through the CSP’s payment infrastructure, which is easy with a real-time converged billing BSS with policy management. Tiered pricing / innovative pricing models: By offering subscribers a choice of mobile data usage plans at different bandwidth rate levels and fair usage quotas, operators can typically increase ARPU through more granular market segmentation. According to a Cisco study, an operator with 1.5 million mobile data subscribers could grow to 2.2 million subscribers, increase revenue by US$22.9 million per month, and realize an ARPU increase of US$6.85 per month based on tiered pricing. Tiered pricing models can only be executed with a modern BSS system which can handle rating and rerating in real-time in order to charge the customer the correct rates. Bundling: Some CSPs offer more than just wireless mobile services. They can be “multi-play” service providers like a Rogers or Bell who offer television, broadband internet, and landline services as well as wireless mobile services. These CSPs have been trending toward offering a bundle of all their services under one account while using the leverage of all the services to provide bundled discounts. Campaigns: A CSP can offer free text messages, free data, voice minutes, or gift cards to customers during a major event by targeting only their customers located in the area with a text to their phone. For example, in a soccer game the first 100 customers to “like” a post on the CSP’s Facebook page or Twitter account could receive a $10 gift card. Targeted campaigns require a real-time BSS with customer service and policy management services enabled.
Source: Redknee Solutions Inc. Family Plans/Share Plans: With family shared accounts, a parent subscriber can have a postpaid plan while his children (on the same invoice/account) can have dollar constrained prepaid plans. Plans such as these enable the family to stay within their budget and make a CSPs offering more unique. As more operators complete the rollout of their LTE networks, we are also seeing a slowdown in capex, especially in developed markets. In Europe for instance, spending has declined year over

Redknee Solutions Inc. Canada Research | Page 11 of 37
Raymond James Ltd. | 2100 – 925 West Georgia Street | Vancouver BC Canada V6C 3L2
year from 2011 to 2014, while Latin America and the US are flattening in 2014. Network investments remain generally high but as they complete roll outs, CSPs may begin to look to invest in more agile BSS systems to monetize new services. Exhibit 6: Telecommunication Operator Capital Expenditure Trends
Source: Raymond James and Associates, Raymond James Ltd., Company Reports
Why Redknee? Redknee began as a BSS provider of prepaid billing and charging systems. Prepaid BSS is inherently a real-time solution in order to deduct usage from a subscriber’s prepaid balance instantly as minutes, text messages, or data are used. Postpaid BSS historically has been different as subscribers use the CSP’s services and are billed after the fact. In postpaid, the BSS only needs to generate the usage summary and invoice once a month (well after services are used), a much less resource intensive solution compared to prepaid. Redknee’s software stack is mostly built from the ground up with real-time at the core, and now includes both prepaid and postpaid in a real-time converged system. Many of Redknee’s competitors are approaching the demand for real time at the core from the other direction (from legacy postpaid systems), resulting in a less streamlined solution while Redknee is battle proven at large scale (100 million subscribers supported at one customer’s deployment).
End-to-End Redknee’s solution is an end-to-end billing, customer care and revenue management solution. Its billing solution is pre-integrated with Microsoft Dynamic CRM framework CRM system which consolidates customer data for customer service staff at CSPs. Having a complete view of a customer’s profile and activity with analytics all in real-time, the CSP can provide a superior level of customer service and adapt customer profiles and services instantaneously.
Real Time Customer expectations are changing, expecting control and transparency with the services they are purchasing including the ability to change their tariff options/rate plans themselves for immediate use. A real-time BSS solution is critical as the telecommunications industry trends toward increasing data consumption. Data overage incidents have been splashed across the media the last few years as data usage has outpaced BSS technology modernization cycles. Many real-time systems now send SMS alerts around the 75% usage mark and again at 95% or 100% usage. Legacy systems will consolidate each day’s usage at the end of the day making it very possible for a customer to reach 75% of available data and subsequently extend over 100% before the day’s data usage is tallied.

Canada Research | Page 12 of 37 Redknee Solutions Inc.
Raymond James Ltd. | 2100 – 925 West Georgia Street | Vancouver BC Canada V6C 3L2
Virtualization Redknee’s solution can be delivered on-premise or over the cloud for quicker deployment and lower risk, as well as lower operating costs. Over the years, the back office of most CSPs has likely grown into a very complex system of disparate IT solutions – which is costly to manage and adapt. This is especially apparent with incumbent CSPs (mobile network operators, or MNO) who are typically more resistant to change. The trend among new entrant CSPs (mobile virtual network operators, or MVNO) has been to operate on lower cost off-premise virtualized systems. In 2012, only 6% of CSPs were on cloud-based (virtualized) billing systems, and by 2014 that number is expected to be 36%, according to Accenture. Non-virtualized solutions typically take a long time to test, negotiate and implement, but a virtualized system can cut the implementation time down to as little as 10 days with minor configurations or with some customization (typical non-virtualized solution can take 6-12 months). The time savings is mostly a result of not having to procure new hardware on premise.
Converged Billing According to Gartner, 74% of global subscribers are still on prepaid subscriptions and over the next few years, subscribers are expected to gradually migrate towards postpaid contracts. The more mixed a CSP subscriber base becomes (prepaid and postpaid), the more necessary a convergent billing solution becomes. Redknee’s converged billing functionality services multiple generations of network technology (2G, 3G, 4G, etc.) as well as different payment types (prepaid and postpaid) all on the same system. This leads to lower costs of maintaining multiple BSS for each combination of network technology and payment type, and also enables the CSP to be more agile in launching promotions and campaigns across the entire subscriber base simultaneously. Having one converged billing system to manage both subscriber types can save costs of managing multiple billing systems. Accenture cites an Italian CSP which retired 90% of its legacy systems and reduced its BSS operating and capital expenses by 40% over 3 years. Exhibit 7: Mobile Subscriber Forecast (Prepaid versus Postpaid)
Source: Gartner Mobile Services Forecast (2Q14), Raymond James Ltd.

Redknee Solutions Inc. Canada Research | Page 13 of 37
Raymond James Ltd. | 2100 – 925 West Georgia Street | Vancouver BC Canada V6C 3L2
Growth Opportunities Redknee has a three pronged growth strategy involving organic growth, M&A, and expansion into new market verticals.
Organic Growth – Global Group Operators With the scale gained from the NSN BSS acquisition, Redknee is looking to expand within global group operators that are already using Redknee’s solutions in certain geographic regions. For instance, the relationship with Digicel began in Jamaica and has now expanded to cover all of its 31 countries in the Caribbean, Central America and Oceania. Similarly, Vodafone (over 20 countries in EMEA and APAC), Vodacom (over 40 countries in Africa), America Movil (18 countries in Latin America and the US), Telekom Austria Group (8 European countries), Orange (over 32 countries in EMEA and the US), and Telefonica (over 21 countries in Europe, Americas, and Asia) are all potential organic growth opportunities for Redknee over the next couple of years with several of those already in discussions.
M&A – Redknee is a potential consolidator While there are organic growth/share gain opportunities, the IRCM market is a mature market with Gartner forecasting only a 3.2% CAGR growing from $18 billion in 2013 to $21 billion in 2018. There are several non-pure-play BSS providers in the market and in our view it is possible these vendors may look to divest their BSS business segments to focus on other more core segments. Among the BSS industry’s “pure-play” vendors, Comverse has been recently hampered by a cost restructuring plan to adjust for lower revenues. Comverse’s BSS license revenue suffered a significant 31% y/y decline in the July 2014 quarter to $30.4 million, while the BSS maintenance revenue declined 1% y/y to $29.7 million ($26.8 million in the April quarter, -20% y/y). As well, we think carve-out opportunities are possible with the BSS segments of network equipment providers (NEPs), similar to the NSN BSS carve-out. BSS typically only make up a small portion of these vendors’ total revenues (1% to 5%).
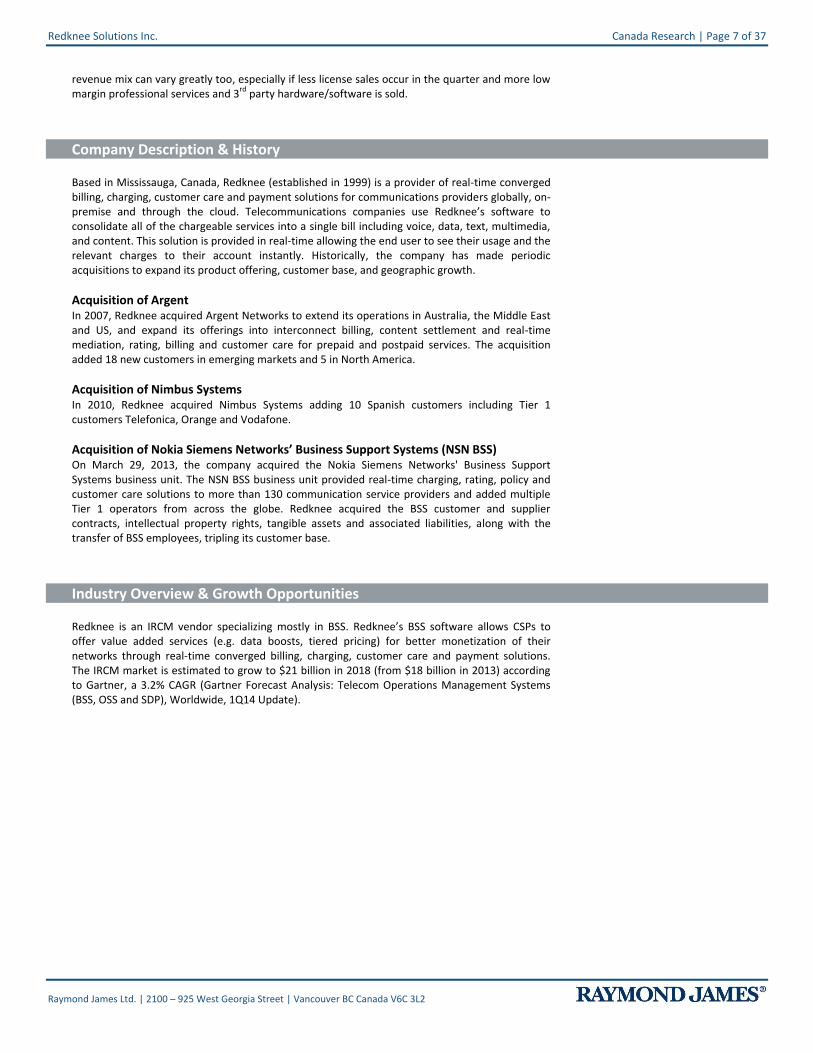
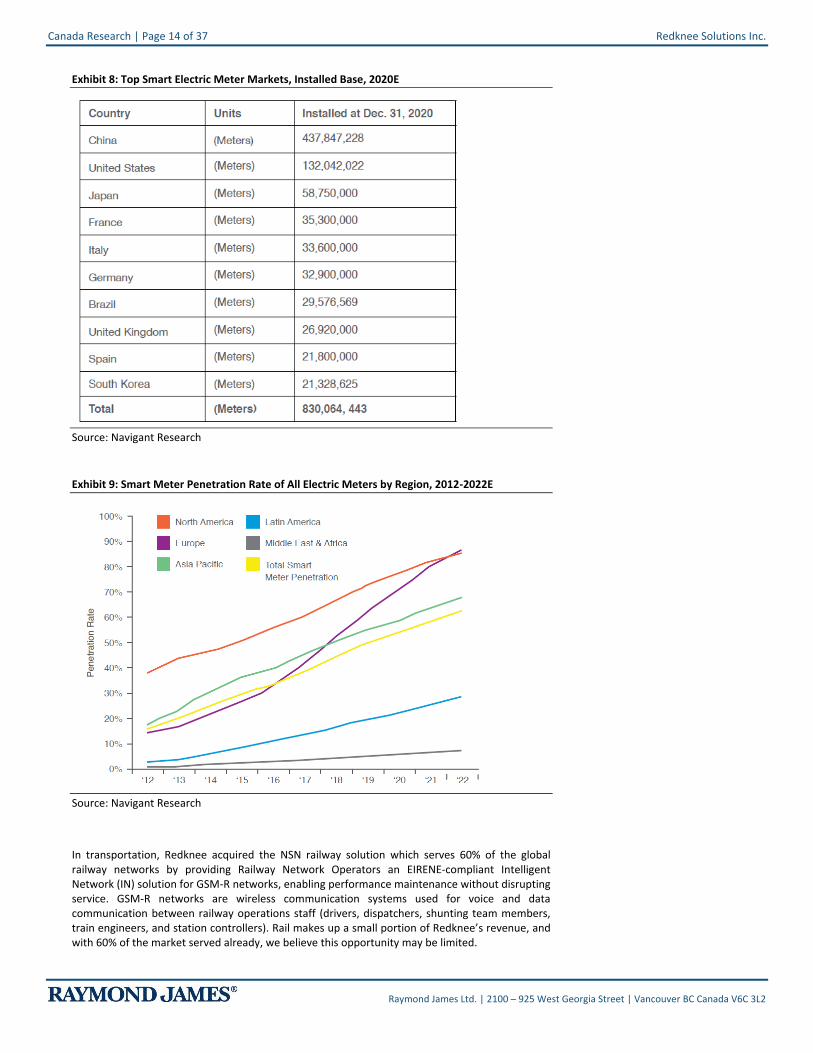
Longer-term, incremental growth from new verticals The Redknee Unified Connected Suite also brings real-time rating, charging and billing to non-telco environments (IoT – Internet of Things) given its ability to manage billions of transactions in real-time with partner billing and settlement, and tiered rate and tariff plans based on time of day, resource availability or other parameters. In addition, Redknee has started to bid on contracts for smart metering. Other verticals Redknee has exposure to include transportation, specifically in railways, which it acquired from the NSN transaction. We estimate revenues from non-telco environments to be minimal at this point, but management expects utilities to contribute ~10% of its bookings in F2015. In utilities, Redknee provides rating and billing for electricity, water, gas and even energy creation (solar cells). With Redknee, energy providers can remotely connect and disconnect smart meters and manage load reductions and balance controls, saving transportation and labour expenses. The consumer also gains the ability to access their consumption and utility bills in real-time through a mobile app on their smartphone. According to Navigant Research, by 2020 over 830 million electric smart meters will be installed globally led by China with over 437 million devices (70% penetration by 2022), the United States with 132 million devices, and Japan with 59 million devices (began in 2014), while Europe will see the fastest penetration from 15% in 2012 to 85% by 2020 (France: 35 million, Germany: 33 million, UK: 27 million), largely due to the EU smart metering policy which calls for 80% of households to have smart gas and electric meters installed by 2020. If we assume smart metering extends to water and gas metering as well, the smart metering opportunity could be a few billion devices by the beginning of the next decade. At just $1/year per subscriber, we think this could become a massive incremental revenue opportunity for BSS vendors like Redknee.
Canada Research | Page 14 of 37 Redknee Solutions Inc.
Raymond James Ltd. | 2100 – 925 West Georgia Street | Vancouver BC Canada V6C 3L2
Exhibit 8: Top Smart Electric Meter Markets, Installed Base, 2020E
Source: Navigant Research
Exhibit 9: Smart Meter Penetration Rate of All Electric Meters by Region, 2012-2022E
Source: Navigant Research
In transportation, Redknee acquired the NSN railway solution which serves 60% of the global railway networks by providing Railway Network Operators an EIRENE-compliant Intelligent Network (IN) solution for GSM-R networks, enabling performance maintenance without disrupting service. GSM-R networks are wireless communication systems used for voice and data communication between railway operations staff (drivers, dispatchers, shunting team members, train engineers, and station controllers). Rail makes up a small portion of Redknee’s revenue, and with 60% of the market served already, we believe this opportunity may be limited.

Redknee Solutions Inc. Canada Research | Page 15 of 37
Raymond James Ltd. | 2100 – 925 West Georgia Street | Vancouver BC Canada V6C 3L2
Customers & Markets Served
System Integration Partnerships Redknee is mostly direct sales and delivers most of its solutions on its own. Redknee has 5 certified partners and resellers (Microsoft, Accenture, Huawei, Tech Mahindra, TCS), which may limit local subject matter expertise it has access to in some situations. However, selling and delivering direct enables Redknee to better manage the customer relationship.
Long Sales Cycle Redknee’s sales cycle is typically a long one. It starts with a proof of concept (a technical win), which involves month/years of testing, and proceeds to the negotiation of commercial agreements for licenses and support which can take several quarters (2 to 3 quarters especially for deals with over 50 million subscribers). Finally, licenses are ordered and implementation takes place over the next several months (up to 12 months).
Notable customers include Vodacom: Converged charging to over 43 million subscribers across 5 southern African countries. Vodafone India: Over 100 million prepaid and postpaid customers, Redknee’s largest install base. PLDT: Converged charging to over 50 million prepaid subscribers using LTE/3G/HSPA+ network technologies. i-wireless: MVNO with presence in over 2,600 retail stores across the US, using Redknee’s virtualized BSS to reduce time to market and operating costs by 50%.
Europe, Middle East & Africa Americas Asia Pacific
TAG Group AT&T KDDI
Truphone Sprint PLDT
VIP T-Mobile Smart
Ooredoo Softbank
Swisscom
Telefonica
Vodacom
Vodafone
BH Telecom
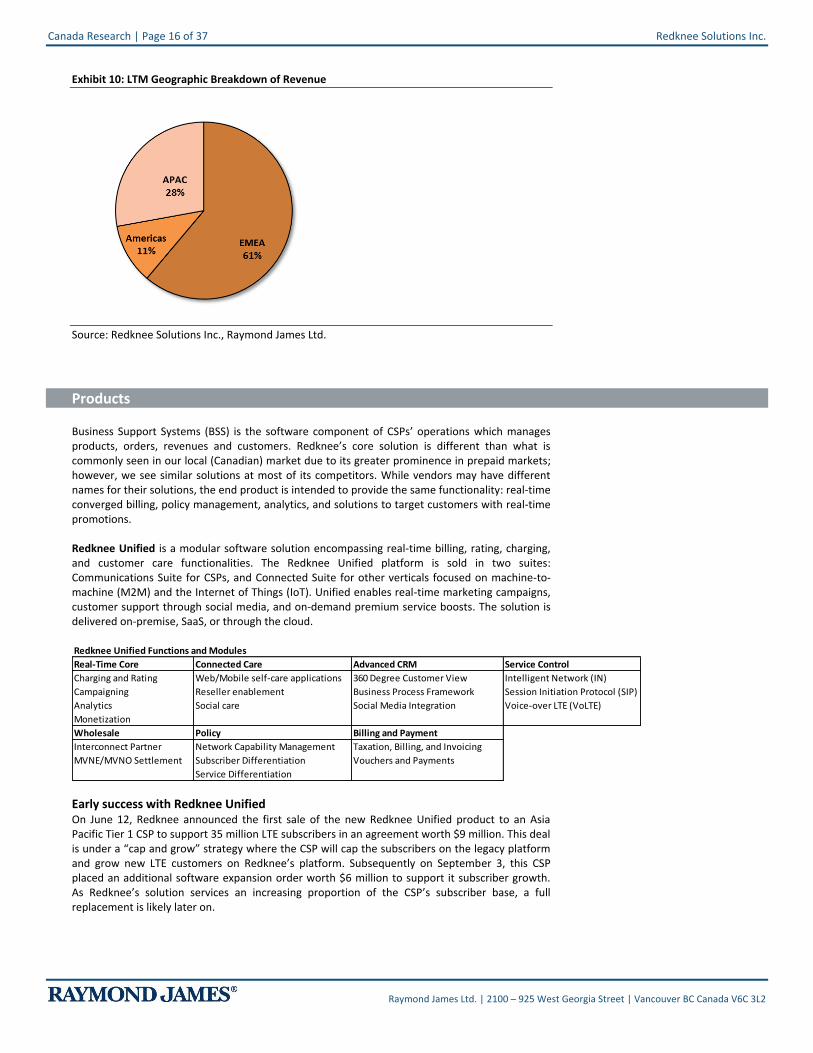
Tele2 Geographic Breakdown Redknee operates globally with over 200 customers in over 90 countries. It breaks down revenue by Asia and Pacific Rim (APAC), Europe, Middle East and Africa (EMEA), and North America, Latin America and Caribbean (Americas). Revenue from Asia Pacific declined 22% y/y in 3Q14 from 3Q13 as software and services revenues decreased. A Tier 1 customer order for $15 million ($9 million and subsequent $6 million) should help the region bounce back. In EMEA, revenue increased by 26% on stronger software, services and support revenue. With the acquisition of NSN BSS in March, 2013 a significant portion of NSN’s BSS customer base is in EMEA and APAC, shifting Redknee’s geographic skew from 40-40-20 (EMEA-Americas-APAC) to 60-10-30 today.
Canada Research | Page 16 of 37 Redknee Solutions Inc.
Raymond James Ltd. | 2100 – 925 West Georgia Street | Vancouver BC Canada V6C 3L2
Exhibit 10: LTM Geographic Breakdown of Revenue
Source: Redknee Solutions Inc., Raymond James Ltd.
Products
Business Support Systems (BSS) is the software component of CSPs’ operations which manages products, orders, revenues and customers. Redknee’s core solution is different than what is commonly seen in our local (Canadian) market due to its greater prominence in prepaid markets; however, we see similar solutions at most of its competitors. While vendors may have different names for their solutions, the end product is intended to provide the same functionality: real-time converged billing, policy management, analytics, and solutions to target customers with real-time promotions. Redknee Unified is a modular software solution encompassing real-time billing, rating, charging, and customer care functionalities. The Redknee Unified platform is sold in two suites: Communications Suite for CSPs, and Connected Suite for other verticals focused on machine-to-machine (M2M) and the Internet of Things (IoT). Unified enables real-time marketing campaigns, customer support through social media, and on-demand premium service boosts. The solution is delivered on-premise, SaaS, or through the cloud. Redknee Unified Functions and Modules
Real-Time Core Connected Care Advanced CRM Service Control
Charging and Rating Web/Mobile self-care applications 360 Degree Customer View Intelligent Network (IN)
Campaigning Reseller enablement Business Process Framework Session Initiation Protocol (SIP)
Analytics Social care Social Media Integration Voice-over LTE (VoLTE)
Monetization
Wholesale Policy Billing and Payment
Interconnect Partner Network Capability Management Taxation, Billing, and Invoicing
MVNE/MVNO Settlement Subscriber Differentiation Vouchers and Payments
Service Differentiation
Early success with Redknee Unified On June 12, Redknee announced the first sale of the new Redknee Unified product to an Asia Pacific Tier 1 CSP to support 35 million LTE subscribers in an agreement worth $9 million. This deal is under a “cap and grow” strategy where the CSP will cap the subscribers on the legacy platform and grow new LTE customers on Redknee’s platform. Subsequently on September 3, this CSP placed an additional software expansion order worth $6 million to support it subscriber growth. As Redknee’s solution services an increasing proportion of the CSP’s subscriber base, a full replacement is likely later on.

Redknee Solutions Inc. Canada Research | Page 17 of 37
Raymond James Ltd. | 2100 – 925 West Georgia Street | Vancouver BC Canada V6C 3L2
On June 25, Redknee announced another sale of Redknee Unified to group operator Vodafone Germany to support its virtualization strategy, reducing costs, enhancing customer experiences and easy scalability, and launching new services to the market faster. Vodafone Germany is utilizing a private cloud environment to reduce hardware costs. Group operators like Vodafone present an opportunity for Redknee to expand geographically by making a beachhead in one of the CSP’s operating countries, in this case Germany, and penetrating other operating countries. On August 12, Redknee announced a sale of Redknee Unified with another EMEA based leading group operator to support its 4G roll out. The $17 million multi-order deal implies the solution will support in excess of 50 million subscribers, but we expect may be closer to 70 million across multiple countries. On October 14, Redknee Unified’s momentum continued with a $10 million order from a Tier 1 operator in EMEA to support its real-time billing and charging virtualization strategy. Redknee Turnkey Converged Billing (TCB): Redknee’s converged billings solution allows CSPs to manage billing in real-time for any service (voice calls, data usage, text messaging, content), through any technology (2G, 3G, 4G/LTE, wireline, WiMax, satellite, cable or broadband), and support all payment types (prepaid, postpaid, or a hybrid). Converged billing solutions enable CSPs to save operating and capital costs associated with managing separate billing systems for postpaid and prepaid subscribers. While in North America we see a larger portion of postpaid subscribers, the dominant payment method in the rest of the world is prepaid. Redknee Policy Control Server (PCS): Policy management is the ability to optimize the provisioning of data to various network users by offering differentiated services (i.e. turbo boost, roaming specials, real-time promotions). PCS allows CSPs to set priorities and limits for subscribers and applications to better guarantee the quality of the user experience without over provisioning its network. Redknee InBill: A convergent Business to Business (B2B) settlement solution captures the raw data directly from the switch on every transaction over the network (voice, data, content) to ensure wholesale billing is more accurate, minimizing revenue leakage. InBill supports interconnect, Carrier Access Billing Systems (CABS) and content/partner settlement for MNOs and MVNOs. It also enables rating and re-rating used for network traffic classification so that pricing/rates can be applied correctly. Redknee Railway: Acquired in the NSN transaction, the solution serves 60% of the global railway networks by providing Railway Network Operators an EIRENE-compliant Intelligent Network (IN) solution for GSM-R networks. GSM-R networks are wireless communication systems used for voice and data communication between railway operations staff (drivers, dispatchers, shunting team members, train engineers, and station controllers).
Competition & Industry Commentary
Specialized IRCM Vendors AsiaInfo: A specialized IRCM vendor with about $600 million IRCM revenue in 2013, according to Gartner. AsiaInfo serves nearly 1 billion subscribers globally, but its major customer footprint lies in China. Solutions provided include: Billing, CRM, Business Intelligence, Convergent Context-Awareness Center (i.e. big data analytics for real-time marketing campaigns and precise targeting), and Open Operational Platform (i.e. enable CSPs to partner with OTT apps to offer app specific services and usage). Openet: A specialized IRCM vendor with about $140 million IRCM revenue in 2013, Openet serves Tier 1 CSPs globally. Solutions it provides include: Intelligent Up-sell, Application Service Pass, Bill Shock Elimination, Tiered Service Controls, Data Service Pass, Loyalty and Promotion, Speed Tiers, and Roaming Controls. Openet has 80 customers in 32 countries including Tier 1s in North America, Latin America, Western and Eastern Europe, APAC, the Middle East, and Africa.

Canada Research | Page 18 of 37 Redknee Solutions Inc.
Raymond James Ltd. | 2100 – 925 West Georgia Street | Vancouver BC Canada V6C 3L2
Non-Specialized IRCM Vendors Amdocs: Amdocs, a leader in IRCM, is both an outsourcer and software provider with 2013 IRCM revenue of $1.9 billion. Amdocs has a highly comprehensive and broad IRCM deployment, but also integrates its own solutions. Given its stronger competitive position, it also typically has a higher price point, according to Gartner. Amdocs serves customers in over 70 countries. Amdocs’ revenue and customer management offerings include: Convergent Charging and Billing, Mediation (process raw data into actionable business information), Partner Management (interconnect, roaming, wholesale, MVNO), Service Delivery (creation, deployment, and execution of new services on the network), Compact Convergence (converged billing for small/medium CSPs, MVNOs, and MVNEs on-premise or in cloud), M2M solutions (smart cars and connected homes), and Customer Management (unified sales channels, unified view of the customer, and proactive customer insight using big data). CSG International (Volubill): CSG acquired Volubill in December 2013. Volubill is a specialized IRCM vendor with about $21 million IRCM revenue in 2012. With ~70 customers, its solutions specialize in charging and integrated policy management. Volubill’s revenue has been stagnant for the past 3 years. CSG International provides a much bigger stage for Volubill’s specialized solutions with about $400 million in IRCM revenue in 2013. CSG is not a specialized IRCM vendor although it has been acquiring IRCM vendors (Ascade in 2012 and Volubill in 2013). Solutions it provides include: Convergent Billing, Customer Management, Commerce Engine, Business Explorer. They generate 48% of their revenue from 3 customers in North America (Comcast, Dish, and Time Warner). Comverse: On October 31, 2012, Comverse Inc. was spun off of Comverse Technologies (CTI) to CTI’s shareholders. Comverse divides its business into 2 segments: BSS and Digital Services. BSS includes converged billing, customer management systems, policy management and enforcement for CSPs. Digital Services enable voicemail, visual voicemail, call completion, SMS, MMS, enterprise communication services, and IP based communications services (group chat, file transfer, video, social and presence). Comverse provides IRCM, value-added services and policy management solutions to over 450 CSPs serving 2 billion subscribers in over 125 countries either on-premise or in the cloud. ~$300 million of its 2013 revenue was from IRCM and policy. In August 2014, Comverse acquired Solaiemes, a Spain-based innovator of monetization solutions for IP based digital services.
Network Equipment Providers (NEP) Ericsson: Ericsson is a leading provider of telecom services, networking equipment, software, system integration and outsourcing services. Ericsson has overall revenue of over $35 billion with only ~3% of its revenue generated from IRCM solutions. Still, at ~$1 billion in 2013, Ericsson is one of the largest IRCM vendors. Ericsson acquired MetraTech in July 2014 to accelerate its cloud and enterprise billing capabilities beyond the telecom market into transportation and utilities, as well as Telcocell (Canada) and Devoteam (France) in 2013. Huawei: Similar to Ericsson, Huawei is a very large network equipment provider with total revenue of ~$39.5 billion, but also generates ~4% of its revenue from IRCM solutions ($1.6 billion in 2013 according to Gartner). Huawei has a strong presence in emerging markets and in Western Europe. Huawei serves over 160 CSPs including China Mobile, Vodafone, MTN, Etisalat, and Singtel. NEC (NetCracker): NEC is another very large network equipment provider and outsourcer with total revenue over $33 billion with its NetCracker (IRCM) division generating over $1.5 billion in 2013, according to Gartner. NEC acquired Convergys’ Information Management division in 2012, which was integrated into NetCracker, a subsidiary of NEC. Oracle: While not a NEP, Oracle provides hardware and software with total revenue of over $38 billion in 2013 with IRCM revenue of ~$490 million (1% of revenue), according to Gartner. Oracle has made some acquisitions in BSS including MetaSolv (2007) and Tekelec (2013), a top 3 vendor in policy management. Oracle offers a converged modular system with 3 billion subscribers managed, including convergent charging and policy, unified CRM, billing and revenue management.

Redknee Solutions Inc. Canada Research | Page 19 of 37
Raymond James Ltd. | 2100 – 925 West Georgia Street | Vancouver BC Canada V6C 3L2
Industry Commentary
Comverse “With regard to BSS, the service provider's billing market is clearly growing at a much slower pace than most experts expected as recently as 18 months ago. We see large transformation projects being delayed or canceled in favor of phased evolutions of installed BSS systems. …We believe our strategy in expanding billing in the cloud and in subscription-based businesses will drive growth.” Comverse F4Q13 Transcript – President and CEO Phillippe Tartavull “I think what we have seen is RFPs where we are in final stages being canceled by the board of director -- and I think what's happening is, in our view, is when service providers invest so much in [LTE] and other CapEx intensive program, the IT system or the BSS system -- investment in the BSS start to be questioned a little bit more than it may have been in the past” Comverse F4Q13 Transcript – President and CEO Phillippe Tartavull “This initiative in both telco and non-telco environments, where we already have a solid track record in e-commerce and other verticals. We believe this market will surpass the size of the more traditional billing market currently targeted by Comverse ONE, and that we can compete for business in a large portion of this market by leveraging our Kenan product expertise, large install base, and reputation.” Comverse F2Q14 Transcript – President and CEO Phillippe Tartavull
CSG Systems International ”Decision-making in the communication space continues to be slow, in particular on large modernization initiatives… they remain cautious in their investments and spending, focusing on those areas that have a demonstrable return on investment.” CSG Systems International 2Q14 Transcript – President and CEO Peter Kalan
Amdocs “We continue to see many opportunities to support our customers, but we expect that the growth rate we have recently enjoyed are not necessary sustainable considering factors such as the timing of new projects award and normal fluctuations in account activity. Additionally, our short-term outlook remains subject to lingering uncertainties resulting from announced consolidation activities among North American wireless and pay-TV operators.” Amdocs F3Q14 Transcript – President and CEO Eli Gelman “Major carriers in Latin America and Southeast Asia are continuing to make critical decisions under the directions of their long-term IT system infrastructures as they navigate two important ways of changing industry dynamics. The first one, carriers are focusing investments toward an improved customer experience as their best vehicle to increasingly compete for customer’s loyalty. This is especially important … due to the slower rate of subscriber growth and shifts from prepaid to postpaid. Second, rapid economic development in these regions is translating into a rising middle class and higher penetration of small devices and multiplayer offerings. Carriers, therefore, are considering replacing their homegrown and legacy systems in favor of scalable modern platforms, which are also enabling them to support the higher level of operating complexity.” Amdocs F3Q14 Transcript – President and CEO Eli Gelman “20 years ago, most of IT in the world, was developed in-house but over the last 20 years, there is a major shift, continuous shift, from make to buying. In other words, buying from companies like us. And every time we win from an in-house IT application moving it to Amdocs, it is another gain…. You need to realize that out of the overall market that we are active in about 50% of the market is still in-house” Amdocs Citi 2014 Global Technology Conference September 3, 2014 Transcript – President and CEO Eli Gelman Asked what is driving increasing demand for core systems: “In Central Latin America, it's mainly because of the move from prepaid to postpaid and the fact that the carriers are going from land grabbing, just getting customers, fight for their SIM card distribution to customer experience as

Canada Research | Page 20 of 37 Redknee Solutions Inc.
Raymond James Ltd. | 2100 – 925 West Georgia Street | Vancouver BC Canada V6C 3L2
the differentiator, as we've seen in Europe and in North America in the last 10 years. In Southeast Asia, you still have inherent growth because there are people that are not exposed to certain technologies; especially you move to smartphones, it creates data demand and stuff like this. You can see it in Indonesia, you can see it in the Philippines.” Amdocs Citi 2014 Global Technology Conference September 3, 2014 Transcript – President and CEO Eli Gelman “In Europe, it is mainly transformation. The conglomerate, the Vodafone of the world, the Deutsche Telekom of the world, still need to invest somewhat in the systems in order to cope with the local competitors. So you see Telefonica getting into Germany with O2 and now buying E-Plus, they need to do something right. There's no point for them to run two companies on two different sets of systems and both of them are homegrown. So you can see some consolidation and you can see some savings.” Amdocs Citi 2014 Global Technology Conference September 3, 2014 Transcript – President and CEO Eli Gelman “In North America, the major driver is consolidation after the previous round which was data. So multi-play is getting bigger in North America.” Amdocs Citi 2014 Global Technology Conference September 3, 2014 Transcript – President and CEO Eli Gelman “If you look at other companies (CSPs), they have three systems of this, seven of that, eight of this and it's a nightmare to operate…And this is not surprising because at the end of day when people take the time and investigate, they understand that the back-end IT system is the only differentiator between one carrier to the other… Long-term I think it is good for the bigger companies like Amdocs and there are very, very, very, very few companies like Amdocs.” Amdocs Citi 2014 Global Technology Conference September 3, 2014 Transcript – President and CEO Eli Gelman
Financial Model Highlights
Software and Services Revenue Software and service revenue consists of fees earned from the licensing (perpetual licenses) and deployment of software products and the associated consulting and training services. The margin profile can change from quarter to quarter depending on revenue mix as licenses have ~90%-95% gross margin while professional services have ~20%-25% gross margin. Some customer wins are capacity expansions which are mostly license revenues as there would be minimal additional services or support required to deploy these additional licenses to existing customers. In Exhibit 11 we show the strong correlation between license revenue as a percentage of total software and services revenue each quarter and the number of press releases announcing capacity expansion awards. In 3Q14 and 4Q14, two license expansion awards for $9 million and $6 million were announced for a Tier 1 in Asia Pacific. These awards are expected to be recognized in F1Q15 and F2Q15, respectively. As such, we would expect a higher proportion of licenses in these quarters and higher gross margin given the more favourable revenue mix.

Redknee Solutions Inc. Canada Research | Page 21 of 37
Raymond James Ltd. | 2100 – 925 West Georgia Street | Vancouver BC Canada V6C 3L2
Exhibit 11: License Expansion Announcement versus License Portion of Software and Services
0
1
2
3
4
5
0%
10%
20%
30%
40%
50%
60%
70%
80%
90%
100%
F3Q13 F4Q13 F1Q14 F2Q14 F3Q14 F4Q14E F1Q15E F2Q15E
License % of Software and Services (LHS)
License Expansion Press Releases (RHS)
Announced in 3Q14: $9 mln expansion for a Tier 1 in APAC we expect to be recognized in 1Q15
Announced in 4Q14: $6 mln follow-on expansion for the same Tier 1 in APAC, we expect to be recognized in 2Q15
Source: Redknee Solutions Inc., Raymond James Ltd.
Support and Subscription Revenue Support revenue consists of revenue from customer support, subscription (SaaS software license fees) and maintenance contracts, and includes technical support and upgrades for subscription agreements.
Third Party Software and Hardware Revenue Third-party software and hardware revenue consists of revenue from the sale of other vendor’s hardware and software components as part of Redknee’s solutions, including server platforms, database software and other ancillary components. Third party revenues are mostly pass-through at minimal margins.
Backlog and Book-to-Bill Backlog as of F3Q14 was $172.7 million, with 70% of the backlog expected to be converted quickly over the next 12 months given the large proportion of deployment services. Historically, Redknee converted backlog at 45%-50% over a 12 month period and we expect Redknee to return to this norm over the next 2-3 years as it improves the mix of its backlog more to software licenses and support. Bookings have increased every quarter for the last 3 quarters, with bookings of $71.9 million (+15% y/y) in its most recent quarter 3Q14 (3Q13: $62.3 million) resulting in backlog increasing 6% to $172.7 million. Since the NSN BSS acquisition, Redknee has averaged book-to-bill higher than 1x.

Canada Research | Page 22 of 37 Redknee Solutions Inc.
Raymond James Ltd. | 2100 – 925 West Georgia Street | Vancouver BC Canada V6C 3L2
Exhibit 12: Backlog and Book-to-Bill Trend
Source: Redknee Solutions Inc., Raymond James Ltd.
Progress Report: Integration of Acquired Nokia Siemens BSS Before Redknee acquired NSN BSS, NSN BSS customer contracts had bundled support and maintenance services with hardware sales where the hardware sale was the primary incentive driver for sales associates and the support contract was heavily discounted. As a result, the support and maintenance revenue stream acquired by Redknee was running at -11% EBITDA margin on only 29% gross margin, whereas Redknee was operating at 5% EBITDA margin on 67% gross margin before the acquisition. Management estimates support and maintenance pricing needs to increase ~20% just to get back to market rates. Management plans for a 10%-15% churn as they implement those pricing increases (~10 NSN customers announced they would leave the platform prior to the completion of the acquisition; we expect Redknee has since won 1-2 of these acquired customers back). The second opportunity is the cross-selling of products into the acquired customer base. Redknee gained 55+ operators from NSN which have over 1.6 billion subscribers. Redknee is looking to cross-sell its real-time charging and connected billing and care solution, as well as policy management solution, Redknee Unified, to this acquired customer base. In addition, some of the acquired NSN customers currently use third party software that was sold by NSN, but going forward could be replaced with Redknee’s own software (e.g. InBill and customer care software).
Recent Financial Highlights
F3Q14 Actual Redknee reported F3Q14 revenues of $63.9 million (+9% y/y) and an adjusted EBITDA loss of $3.2 million. Redknee Software and Services revenues were +10% y/y at $28.7 million. Support and Subscription revenue was +5% y/y at $32 million. Management expects the $9 million capacity expansion order announced during the quarter (June 12) to be recognized in F1Q15. Redknee also announced a restructuring plan. During the integration of the NSN BSS business Redknee opened additional work centers and hired external contractors to support the acquired customers. Now that the NSN BSS integration has been completed, Redknee is restructuring its operations over the next 12 to 18 months, beginning in F4Q14. Redknee will reduce costs in three areas: 1) eliminating external contractors; 2) consolidating high cost R&D and support centers; and 3) concentrating R&D and support staff in fewer, lower cost geographic locations.
Redknee Solutions Inc. Canada Research | Page 23 of 37
Raymond James Ltd. | 2100 – 925 West Georgia Street | Vancouver BC Canada V6C 3L2
The restructuring will result in one-time charges over F4Q14 and F1Q15 totaling $15 million to $20 million, mostly consisting of severances, while the remainder of cost savings will be a result of contractor/subcontractor costs rolling off as those agreements end. The restructuring is expected to reduce operating expenses by $30 million to $35 million annually by F2016 ($6-$9 million per quarter from baseline F4Q14).
F4Q14 Preview Redknee is expected to report F4Q14 results on November 20 before market, and will hold a conference call the same day at 8:30 AM EST (Dial In: 1-888-231-8191, ID: 24647276). We are looking for revenue of $61.4 million (+7% y/y), adjusted EBITDA of $2.5 million, and adjusted EPS of $0.00 versus consensus revenue of $62.4 million, adjusted EBITDA of $3.1 million, and adjusted EPS of $(0.01). We forecast Support revenues of $26.8 million (-15% y/y) as customers not transferring from NSN begin to roll off. We also forecast $31 million of Software and Services (+40% y/y) on the back of several deal wins early in the quarter. We note that book-to-bill has been tracking above 1.0x in recent quarters, which bodes well. Wins during the quarter include a $6 million follow on expansion award from a Tier 1 operator in APAC, and new wins at two global group operators and one in EMEA worth $7 million, $6 million and $17 million, respectively. These group operator wins are the early stage build out of Redknee’s organic growth strategy as Redknee expands geographically through group operators they already serve. Redknee also announced a virtualization win with a Tier 1 CSP in EMEA and an $8 million order with a leading CSP in the Americas. Two orders during the quarter were for the new Redknee Unified Suite which indicates some traction for further organic growth (cross-selling modules and capturing market share through expanded license orders). After the quarter, Redknee won a $10 million (new) virtualization win with a Tier 1 operator in EMEA, as well as a wholesale billing win with SingTel Optus in Australia.
Financial Model Forecasts
F2015 Forecast (ending September 30, 2015) We are modeling $262 million in revenue, representing 1% y/y growth. We are modeling $142 million in Software and Services revenue, up 17% y/y from $121 million in F2014 (to reflect recent capacity expansion awards), $105 million in Support and Subscription revenue, down 10% y/y from $117 million (to reflect expected NSN customer churn) and 3rd party hardware and software revenue of $15 million, down 25% y/y from $21 million. We forecast adjusted EBITDA of $32.7 million in F2015 (F2014E: $10.5 mln) and adjusted EPS of $0.13 (F2014E: -$0.03). The projected customer churn as a result of the NSN BSS acquisition has taken longer than originally expected. Instead of seeing the bottom of the support revenue in 2014 and an estimated 10%-15% decline, we are instead expecting those customers to roll off in F2015 and therefore expect flattish year-over-year overall revenue growth in F2015, with new licenses offsetting the decline in support. At this point, 75% of acquired NSN BSS customers have been novated (had contracts adjusted for BSS only agreements) and are staying with Redknee.
F2016 Forecast (ending September 30, 2016) We are modeling $278 million in revenue, representing 6% y/y growth. We are modeling $149 million in Software and Services revenue, up 5% y/y from $142 million in F2015, and $115 million in Support and Subscription revenue, up 10% y/y from $105 million, and 3rd party hardware and software revenue of $14 million (-10% y/y) as, increasingly, virtualization would tend to reduce overall hardware implementations. We forecast adjusted EBITDA of $50 million in F2016 (+52% y/y) and adjusted EPS of $0.25 (F2015E: $0.13).
Long-Term Model Redknee is still in an integration and renewal cycle with the acquired customers from the NSN BSS acquisition. Near-term, we believe the anticipated churn with acquired NSN customers will keep a lid on revenue growth. However, with the recent restructuring, we should expect improving
Canada Research | Page 24 of 37 Redknee Solutions Inc.
Raymond James Ltd. | 2100 – 925 West Georgia Street | Vancouver BC Canada V6C 3L2
EBITDA margins through 2015 and 2016 toward the company’s long-term target of 20%-25% EBITDA margin. Longer-term, with organic growth opportunities within its many global group operator customers, as well as new verticals (rail, utilities, retail, healthcare, etc.), we believe Redknee should be able to easily exceed the mid-single digit growth rate the BSS market has experienced recently.
Valuation & Recommendation
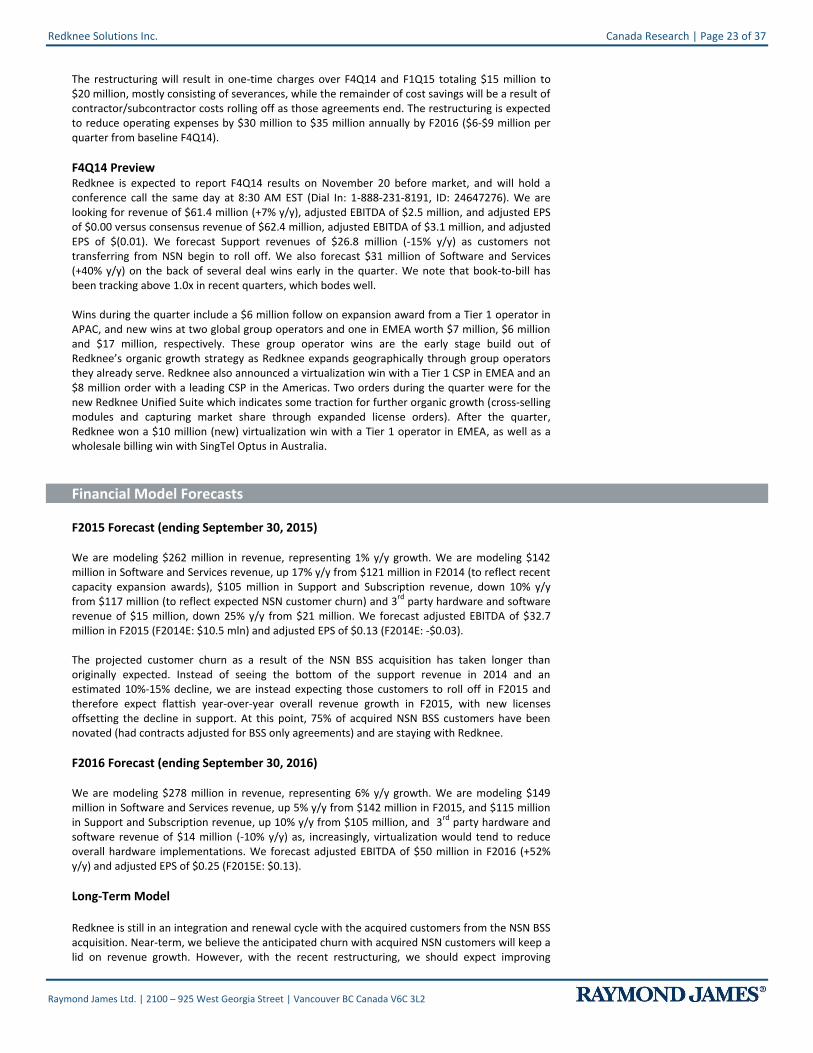
Redknee currently trades at 7x C2016E EBITDA, in-line with other pure-play OSS/BSS vendors and NEPs at ~7x EBITDA. We also compare Redknee to a group of Canadian software companies which trade at 12x EBITDA on average. With much of the synergies (revenue and cost) from the acquisition of NSN customers ahead of them, we expect profitably to quickly improve and revenue growth to resume once the anticipated churn from NSN customers is lapped. We are initiating coverage with an Outperform rating and a C$5.40 target price based on 9x C2016E EBITDA, at a discount to the group of Canadian software companies given Redknee’s profitability is still lagging. While management has indicated they remain on the lookout for accretive transactions, we do not factor in M&A into our forecast.
Exhibit 13: Comparable Companies
EV/MtceRedknee Ticker Price Mkt. Cap. EV/Sales EV/EBITDA P/E Rev Growth (2014E-16E)
Symbol 10-Nov-14 (US$ mlns) C14E C15E C16E C14E C15E C16E C14E C15E C16E TTM Rev. EPS
Pureplay OSS/BSS
Amdocs Limited DOX USD $47.50 $7,584 1.8 1.7 1.6 8.9 8.5 7.2 15.0 13.9 12.9 n.a. 4% 8%
Comverse, Inc. CNSI USD $20.98 $470 0.6 0.6 0.6 15.8 15.1 7.2 n.m. 21.0 19.6 n.a. (1%) n.m.
CSG Systems International Inc. CSGS USD $25.75 $875 1.3 1.2 1.2 5.9 6.0 5.7 12.3 12.0 11.0 10.5 4% 6%
NEP and Resellers
Ericsson OM: ERIC B SEK $11.62 $38,006 1.0 1.0 1.0 8.7 7.2 6.6 18.1 14.5 13.2 n.a. 3% 17%
NEC Corporation TSE:6701 JPY $3.32 $8,637 0.5 0.5 0.5 8.0 6.7 6.3 n.m. 21.3 14.0 n.m. 3% 54%
Alcatel-Lucent ENXTPA:ALU EUR $3.22 $8,915 0.6 0.6 0.6 6.7 5.3 4.9 n.m. 14.0 9.9 n.m. 4% 124%
Oracle Corporation ORCL USD $40.45 $183,967 4.3 4.2 4.0 8.8 8.5 7.8 13.9 13.3 12.1 n.a. 4% 7%
Accenture plc ACN USD $84.16 $57,931 1.8 1.7 1.6 10.8 10.3 9.8 18.5 17.1 15.7 n.m. 5% 8%
Group Average 1.5 1.4 1.4 9.2 8.5 6.9 15.6 15.9 13.5 10.5 3% 32%
Redknee TSX:RKN CAD $4.06 C$442 1.3 1.3 1.2 32.4 10.4 6.8 n.m. 27.2 14.5 3.2 4% n.m.
Other Canadian Software Comparables
Open Text Corporation OTEX USD $58.74 $7,217 4.3 4.1 3.8 13.1 11.9 10.6 16.5 14.6 12.7 11.4 6% 14%
Constellation Software Inc. TSX:CSU CAD $283.41 $6,006 4.2 3.6 3.1 20.0 17.1 14.6 25.7 21.2 18.1 6.6 16% 19%
Enghouse Systems Limited TSX:ESL CAD $34.87 $936 4.2 3.6 3.6 16.5 12.9 n.m. n.m. 22.1 25.8 7.9 8% 15%
The Descartes Systems Group Inc DSGX USD $14.86 $1,019 5.1 4.5 3.8 17.0 14.7 12.5 27.0 24.8 22.9 5.8 15% 9%
Absolute Software Corporation TSX:ABT CAD $6.34 $284 2.8 2.5 2.3 15.9 12.5 9.2 n.m. n.m. n.m. n.m. 10% 31%
Group Average 4.1 3.7 3.3 16.5 13.8 11.7 23.1 20.7 19.9 7.9 11% 18%
Note: Estimates for RKN are from Raymond James Ltd., all other estimates are from Capital IQ
Source: Raymond James Ltd., Capital IQ

Redknee Solutions Inc. Canada Research | Page 25 of 37
Raymond James Ltd. | 2100 – 925 West Georgia Street | Vancouver BC Canada V6C 3L2
Appendix I: Financial Statements
US Dollars
Redknee Solutions Inc. Sep-13 Sep-14 Sep-15 Sep-16 Dec-13 Mar-14 Jun-14 Sep-14 Dec-14 Mar-15 Jun-15 Sep-15
Income Statement F2013 F2014E F2015E F2016E F1Q14 F2Q14 F3Q14 F4Q14E F1Q15E F2Q15E F3Q15E F4Q15E
Revenues (US$ mln) 142.05 258.14 261.91 277.94 60.40 72.43 63.92 61.38 67.58 62.97 63.26 68.11
Cost of revenues 63.11 134.23 123.10 129.24 27.38 37.72 36.01 33.12 31.76 28.34 30.36 32.64
Gross profit 78.93 123.91 138.81 148.70 33.02 34.71 27.91 28.26 35.82 34.63 32.89 35.47
% Gross Margin 56% 48% 53% 54% 55% 48% 44% 46% 53% 55% 52% 52%
Operating expenses:
Sales and marketing 25.13 35.62 39.29 38.36 8.51 9.09 9.13 8.90 9.80 10.07 9.81 9.61
General and administrative 20.65 33.56 35.36 40.30 8.17 7.67 9.01 8.71 9.12 9.13 8.54 8.57
Research and development 34.42 63.24 51.07 40.30 14.88 15.95 16.77 15.64 14.19 12.28 12.34 12.27
Acquisition and related costs & other expenses 12.96 3.89 0.00 0.00 0.87 2.40 0.62 0.00 0.00 0.00 0.00 0.00
93.17 136.32 125.72 118.96 32.44 35.10 35.53 33.24 33.11 31.48 30.68 30.44
EBIT: Operating income (loss) (14.24) (12.41) 13.10 29.74 0.58 (0.39) (7.62) (4.98) 2.70 3.15 2.21 5.03
FX gain (loss) (0.68) 0.22 (1.14) 0.58 0.77
Finance income (costs) (0.98) (1.29) 0.00 0.00 (0.57) (0.80) (0.85) 0.93 0.00 0.00 0.00 0.00
Other income (expenses) 15.81 5.80 0.00 0.00 (1.15) 6.95 0.11 (0.11) 0.00 0.00 0.00 0.00
EBT: Income (loss) before income taxes (0.08) (7.68) 13.10 29.74 (2.27) 6.34 (7.59) (4.16) 2.70 3.15 2.21 5.03
Income taxes (recovery) - current and deferred 0.18 (1.15) 1.96 4.46 0.79 1.57 (0.71) (2.80) 0.41 0.47 0.33 0.75
Net income (loss) (0.26) (6.53) 11.13 25.28 (3.06) 4.77 (6.88) (1.36) 2.30 2.68 1.88 4.28
EPS (0.00) (0.06) 0.10 0.23 (0.03) 0.05 (0.06) (0.01) 0.02 0.02 0.02 0.04
Adjusted Net Income 2.86 (2.81) 14.37 26.85 1.17 1.31 (5.42) 0.13 3.16 3.50 2.80 4.91
Adjusted EPS 0.03 (0.03) 0.13 0.25 0.01 0.01 (0.05) 0.00 0.03 0.03 0.03 0.05
Basic shares 82.81 108.89 108.89 108.89 95.53 98.36 108.89 108.89 108.89 108.89 108.89 108.89
Diluted shares 82.81 108.89 108.89 108.89 95.53 101.80 108.89 108.89 108.89 108.89 108.89 108.89
Net Income (loss) (0.26) (6.53) 11.13 25.28 (3.06) 4.77 (6.88) (1.36) 2.30 2.68 1.88 4.28
Depreciation & Amortization 6.48 12.91 13.50 13.90 3.29 3.19 3.16 3.27 3.38 3.15 3.16 3.81
Revaluation of contingent consideration (15.81) (5.80) 0.00 0.00 1.15 (6.95) (0.11) 0.11 0.00 0.00 0.00 0.00
Bargain purchase gain from acquisition
Finance income (cost) 0.98 1.29 0.00 0.00 0.57 0.80 0.85 (0.93) 0.00 0.00 0.00 0.00
Income tax expense 0.18 (1.15) 1.96 4.46 0.79 1.57 (0.71) (2.80) 0.41 0.47 0.33 0.75
Share-based compensation 6.07 6.07 6.07 6.07 0.67 0.55 0.63 4.22 1.52 1.52 1.52 1.52
Foreign exchange (gain) loss 0.68 (0.22) 0.00 0.00 1.14 (0.58) (0.77) 0.00 0.00 0.00 0.00 0.00
EBITDA (1.69) 6.56 32.66 49.70 4.55 3.34 (3.84) 2.51 7.60 7.81 6.89 10.36
Acquisition and related costs 12.96 3.89 0.00 0.00 0.87 2.40 0.62 0.00 0.00 0.00 0.00 0.00
Adjusted EBITDA 11.27 10.45 32.66 49.70 5.42 5.74 (3.21) 2.51 7.60 7.81 6.89 10.36
Adjusted EBITDA Margin 7.9% 4.0% 12.5% 17.9% 9.0% 7.9% -5.0% 4.1% 11.2% 12.4% 10.9% 15.2%
Source: Redknee Solutions Inc., Raymond James Ltd.
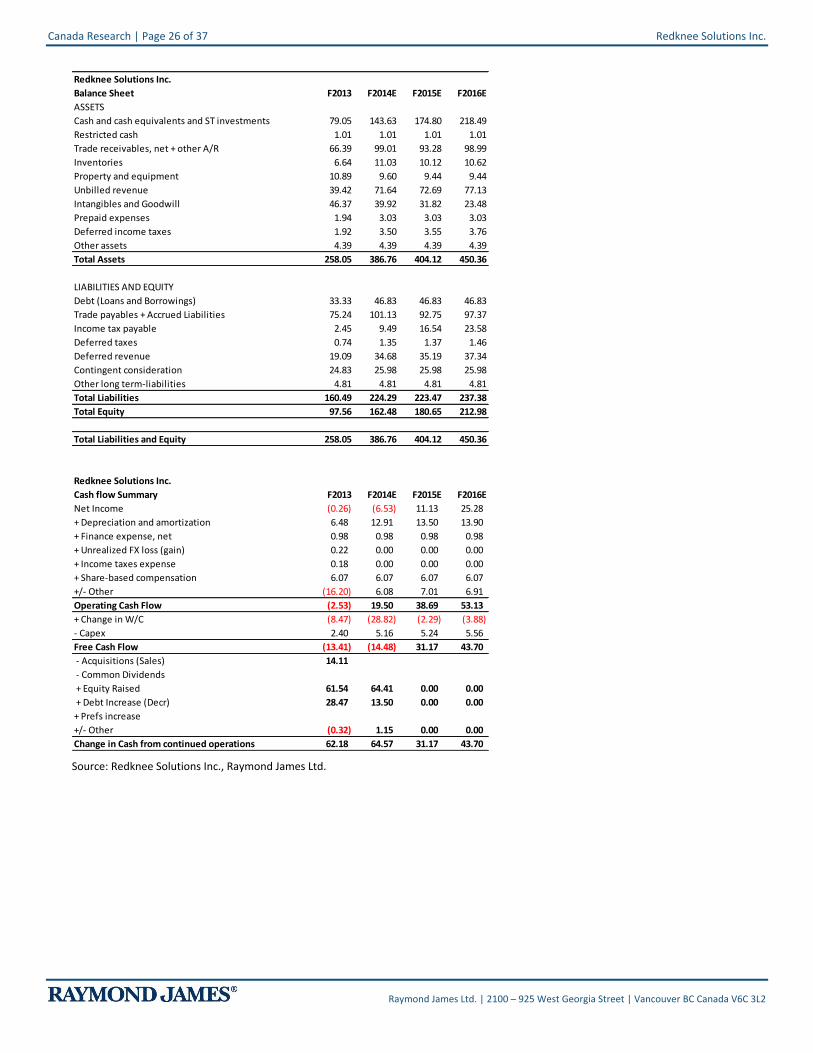
Canada Research | Page 26 of 37 Redknee Solutions Inc.
Raymond James Ltd. | 2100 – 925 West Georgia Street | Vancouver BC Canada V6C 3L2
Redknee Solutions Inc.
Balance Sheet F2013 F2014E F2015E F2016E
ASSETS
Cash and cash equivalents and ST investments 79.05 143.63 174.80 218.49
Restricted cash 1.01 1.01 1.01 1.01
Trade receivables, net + other A/R 66.39 99.01 93.28 98.99
Inventories 6.64 11.03 10.12 10.62
Property and equipment 10.89 9.60 9.44 9.44
Unbilled revenue 39.42 71.64 72.69 77.13
Intangibles and Goodwill 46.37 39.92 31.82 23.48
Prepaid expenses 1.94 3.03 3.03 3.03
Deferred income taxes 1.92 3.50 3.55 3.76
Other assets 4.39 4.39 4.39 4.39
Total Assets 258.05 386.76 404.12 450.36
LIABILITIES AND EQUITY
Debt (Loans and Borrowings) 33.33 46.83 46.83 46.83
Trade payables + Accrued Liabilities 75.24 101.13 92.75 97.37
Income tax payable 2.45 9.49 16.54 23.58
Deferred taxes 0.74 1.35 1.37 1.46
Deferred revenue 19.09 34.68 35.19 37.34
Contingent consideration 24.83 25.98 25.98 25.98
Other long term-liabilities 4.81 4.81 4.81 4.81
Total Liabilities 160.49 224.29 223.47 237.38
Total Equity 97.56 162.48 180.65 212.98
Total Liabilities and Equity 258.05 386.76 404.12 450.36
Redknee Solutions Inc.
Cash flow Summary F2013 F2014E F2015E F2016E
Net Income (0.26) (6.53) 11.13 25.28
+ Depreciation and amortization 6.48 12.91 13.50 13.90
+ Finance expense, net 0.98 0.98 0.98 0.98
+ Unrealized FX loss (gain) 0.22 0.00 0.00 0.00
+ Income taxes expense 0.18 0.00 0.00 0.00
+ Share-based compensation 6.07 6.07 6.07 6.07
+/- Other (16.20) 6.08 7.01 6.91
Operating Cash Flow (2.53) 19.50 38.69 53.13
+ Change in W/C (8.47) (28.82) (2.29) (3.88)
- Capex 2.40 5.16 5.24 5.56
Free Cash Flow (13.41) (14.48) 31.17 43.70
- Acquisitions (Sales) 14.11
- Common Dividends
+ Equity Raised 61.54 64.41 0.00 0.00
+ Debt Increase (Decr) 28.47 13.50 0.00 0.00
+ Prefs increase
+/- Other (0.32) 1.15 0.00 0.00
Change in Cash from continued operations 62.18 64.57 31.17 43.70
Source: Redknee Solutions Inc., Raymond James Ltd.

Redknee Solutions Inc. Canada Research | Page 27 of 37
Raymond James Ltd. | 2100 – 925 West Georgia Street | Vancouver BC Canada V6C 3L2
Appendix II: Management & Board of Directors
Management Team
Lucas Skoczkowski CEO & Director & Co-Founder
As Redknee’s founder and first employee, Lucas Skoczkowski has been directing the execution of
Redknee’s business activities and corporate operations since 1999. In his years at Redknee, he has led
the development of the company’s product portfolio and a global organization of exceptional talent
resulting in continuous growth and a strong recurring revenue stream.
Prior to Redknee, Lucas gained considerable experience in sales, operations, business and product
development with a variety of international companies including Nortel Networks (USA, UK, Canada)
and Clearnet Communications Inc.
David Charron CFO
David Charron is the Chief Financial Officer of Redknee. David is responsible for all financial and
corporate matters of the company, including financial and management reporting, financial planning
and analysis, and investor relations, as well as Redknee’s legal, IT and HR functions. Prior to joining
Redknee in July, 2007 as VP Financial Planning & Analysis, David held senior finance positions with
Nortel Networks Corporation and The Descartes Systems Group.
David is a Certified Management Accountant (CMA), has a Bachelor of Engineering as well as a
Masters of Business Administration. He is also a member of Professional Engineers Ontario.
Vishal Kothari COO & Co-Founder
Vishal Kothari is the co-founder and Vice President of Global Services at Redknee. Vishal is
responsible for the delivery and support of Redknee’s solutions across the globe. He leads a diverse
and experienced team of technical professionals responsible for all aspects of the company’s
operations and delivery services including professional services and customer support.
With more than 15 years’ industry experience, Vishal has held a number of senior executive roles
spanning sales, marketing and product management. Prior to Redknee, Vishal worked at Nortel in
various positions including engineering and at Microsoft in the WinCE group within product
management.
Vishal has a B.A. of Science Degree in Electrical Engineering from the University of Waterloo and a
Masters of Engineering from the University of Toronto.
Chris Newton-Smith VP Marketing
Chris Newton-Smith is the Vice President of Marketing at Redknee. Chris is responsible for
developing Redknee’s market strategy and enabling global partnerships. In this function, he also has
responsibility for product management, corporate and product marketing, business development,
and Redknee’s CTO office, which leads the development of Redknee’s portfolio of patents in the real-
time monetization space.
Mr. Newton-Smith has broad experience in the telecoms industry. In his most recent role at Redknee,
Chris was the General Manager of Redknee’s Europe, Middle East and Africa (EMEA) sales and
operations organization, where he spearheaded the successful growth of Redknee’s presence in the
region. Prior to joining Redknee, he was responsible for business development and product
marketing for the Application & Content Services (ACS) business unit of LogicaCMG Telecoms
(Acision). He has held positions in Sales, Marketing, Product Management, Software Development,
and Technology Evaluation at Redknee, RIM (BlackBerry), Encana, and UBS AG.
Mr. Newton-Smith has a Bachelor of Engineering and Management degree from McMaster University
in Canada. He is also a member of the IEEE.
Nitin Singhal VP Global Partner Alliances
Nitin Singhal is the Vice President of Global Partner Alliances. Nitin leads Redknee’s global
partnership strategy and enablement, including the go-to-market propositions around Redknee’s
converged billing and customer care products. Nitin’s team works with System Integrators to provide
service providers an eco-system of products and services to drive monetization of their business.
Nitin brings over 15 years of experience in working on billing solutions for communication service
providers globally. Over his career at Redknee, Nitin has held several leadership positions, including
Research & Development, Customer Support and Product Management. Nitin has a B.Math degree in
Computer Science from the University of Waterloo.
The company’s management consists of both long-tenured executives and new executives. The executive team brings to Redknee diverse experiences directly relevant to their
current roles including Telecom, Engineering and IT. We include background information on the company’s senior leadership team.
Source: Redknee Solutions Inc., Raymond James Ltd.

Canada Research | Page 28 of 37 Redknee Solutions Inc.
Raymond James Ltd. | 2100 – 925 West Georgia Street | Vancouver BC Canada V6C 3L2
Roy Smeets VP Research & Development
Roy Smeets is the Vice President of Research & Development. Roy leads a diverse team of more than
600 technical professionals across offices in Canada, India, Poland and Germany. He is responsible for
all aspects of the company’s software development lifecycle, including design, development,
customization, test labs and quality assurance.
Roy has more than 15 years’ experience in a variety of roles, including Interim Management, IT
management and Business Consulting at a number of leading Global companies, including Vodafone
and Logica. Most recently, Roy was the Head of Research and Development and Product Management
for the BSS business unit at Nokia Siemens Networks.
Roy holds a Master in IT Management and a Bachelor in Business Administration. He is currently
working on his Executive MBA at Nyenrode University in the Netherlands.
Chris McGrady
Vice President, Human Resources,
Integration Management, and Corporate IT &
Security
Chris McGrady is Vice President of Human Resources, Integration Management, and Corporate IT &
Security. Chris has 25 years' experience in the IT industry, the last 20 of which have been in telco
Billing. Chris joined Redknee in 2011 to lead the EMEA Operations and Global Delivery teams. Prior
to joining Redknee, Chris has held delivery leadership and sales roles at Comverse, CSG, Lucent
Technologies and Kenan Systems. Chris studied at the University of Oxford and holds Masters
degrees in both Philosophy and Computer Science.
Board of Directors
Kent Thexton Non-Executive Chairman of the Board
Mr. Thexton joined the Board of the Company in 2006, having served on the Board of the Company's
predecessor, Redknee Inc., since 2004. Mr. Thexton is also Chairman of i-wireless and on the board of
Sierra Wireless (which is listed on the NASDAQ and Toronto Stock Exchanges). Previously, Mr.
Thexton was the Chief Data and Marketing Officer for O2 Group plc and a member of the O2 Company
plc Board of Directors. Mr Thexton holds an MBA and a Bachelor's Degree in Electrical Engineering
from the University of Western Ontario. Mr. Thexton is a member of Redknee's Audit, Compensation
and Nomination and Governance Committees.
Lucas Skoczkowski CEO & Director & Co-Founder
As Redknee’s founder and first employee, Lucas Skoczkowski has been directing the execution of
Redknee’s business activities and corporate operations since 1999. In his years at Redknee, he has led
the development of the company’s product portfolio and a global organization of exceptional talent
resulting in continuous growth and a strong recurring revenue stream.
Prior to Redknee, Lucas gained considerable experience in sales, operations, business and product
development with a variety of international companies including Nortel Networks (USA, UK, Canada)
and Clearnet Communications Inc.
Stephen Davies Non-Executive Director
Mr. Davies joined the Board in January 2007. Mr. Davies has worked in the internet and telecoms
industry for over 30 years. Prior to joining Redknee's Board, Mr. Davies served as a director of O2
Group, plc. Mr. Davies is currently Chairman of The Practice, Plc, a UK primary healthcare company,
Mr. Davies is Chairman of the Nomination and Governance Committee and is a member of Redknee's
Compensation Committee.
Alan Michels Non-Executive Director
Mr. Michels joined Redknee’s Board in December 2008. Previously, Mr. Michels served as President of
Kenan Systems Inc., President and CEO of Telewest Communications, Plc. and as Chief Financial
Officer in the telecom and software industries. Mr. Michels holds a Master of Business Administration
in Finance, and a Bachelor of History degree from Rutgers, the State University of New Jersey-New
Brunswick. Mr. Michels is a member of Redknee's Audit Committee and Nomination and Governance
Committee.
Terry Nickerson Non-Executive Director
Mr. Nickerson joined Redknee's Board in October 2010. Prior to joining Redknee's Board, Mr.
Nickerson held several senior financial positions at ATI Technologies, Inc., Northern Telecom Ltd.,
IBM Canada and the Molson Companies. Mr. Nickerson is currently a director of Miranda Technologies
Inc. Mr. Nickerson holds a Bachelors of Science degree in Metallurgical Engineering from Queens
University and an M.B.A. from Harvard University. Mr. Nickerson is Chairman of Redknee's Audit
Committee.
Gregory Jacobsen Non-Executive Director
Mr. Jacobsen joined Redknee's Board in March 2011. He is a senior executive with 25 years of diverse
experience in telecommunications, information technology and software. As Group Sector Leader -
Telecom, Media & Entertainment of Capgemini, Mr. Jacobsen currently leads Capgemini’s global TME
practice of over 4,000 business and technology consultants and almost $1.2B in worldwide sales. His
career spans consulting, outsourcing, systems integration, sales, marketing and executive
management. A three-time CEO, he is an entrepreneur, having founded two successful firms, and has
worked within large corporations such as EDS and MCI. Mr. Jacobsen is Chairman of Redknee's
Compensation Committee.
The company’s board of directors includes primarily non-executive directors except for founder and CEO Lucas Skoczkowski. The directors bring experience from M2M and the
telecommunications industry. Description of the company’s board of directors follows.
Source: Redknee Solutions Inc., Raymond James Ltd.

Redknee Solutions Inc. Canada Research | Page 29 of 37
Raymond James Ltd. | 2100 – 925 West Georgia Street | Vancouver BC Canada V6C 3L2
Appendix III: Share Ownership & Insider Holdings (as at Nov-10-14)
Insider Holders Position with the Company Shares % of O/S Options RPSU RRSU RSU RDSU
Lucas Skoczkowski CEO, Director, Co-Founder 8,897,017 8.17% 1,130,054 92,262
Vishal Kothari COO, Co-Founder 4,402,942 4.04% 568,797 47,619
Kent Thexton Chairman of the Board 867,285 0.80% 57,500 94,313
Nitin Singhal VP - Partner Alliances 244,210 0.26% 378,574 16,667
David Charron CFO 175,439 0.16% 693,477 42,857
Stephen Davies Director 158,730 0.15% 20,000 94,313
Alan Michels Director 100,000 0.09% 20,000 94,313
Terry Nickerson Director 50,000 0.05% 82,415
Christopher Newton-Smith VP - Marketing 21,735 0.02% 391,707 22,321 5,122
Chris McGrady VP - HR, Integration Management,
and Corporate IT & Security
161,707 61,872 59,699
Roy Smeets VP - R&D 48,269 17,460 35,088
Gregory Jacobsen Director 84,915
14,917,358 13.74% 3,470,085 301,058 64,821 35,088 450,269
Source: Ink Research, Raymond James Ltd.
Top Holders Shares % of O/S
Pyramis Global Advisors 6,900,000 6.34%
BMO Asset Management 5,068,200 4.65%
Fiera Capital Corporation 4,792,551 4.40%
1832 Asset Management 2,962,700 2.72%
RBC Global Asset Management 2,643,119 2.43%
Pembroke Management 2,640,300 2.42%
Burgundy Asset Management 2,590,200 2.38%
Manulife Asset Management 2,361,766 2.17%
CIBC Asset Management 1,024,440 0.94%
CPP Investment Board 798,000 0.73%
Cypress Capital Management 550,000 0.51%
I.G. Investment Management 525,200 0.48%
Empire Life Investments 492,943 0.45%
Hillsdale Investment Management 390,800 0.36%
Techinvest 340,400 0.31%
Industrial Alliance Investment Management 323,700 0.30%
Morgan Meighen & Associates 300,000 0.28%
Palos Management 250,000 0.23%
CI Investments 235,000 0.22%
Dimensional Fund Advisors 219,479 0.20%
BlackRock Asset Management 216,822 0.20%
GWL Investment Management 202,600 0.19%
Mackenzie Financial Corporation 177,404 0.16%
Front Street Investment Management 133,409 0.12%
TIAA-CREF Investment Management 101,000 0.09%
36,240,033 33.28%
Note: Holding list may not be complete due to timing of disclosures and time of publishing.
Source: BD Vision, Raymond James Ltd.

Canada Research | Page 30 of 37 Redknee Solutions Inc.
Raymond James Ltd. | 2100 – 925 West Georgia Street | Vancouver BC Canada V6C 3L2
Appendix IV: Definitions
BSS: Business Support Systems are comprised primarily of 4 functions, as defined by Gartner, which help run the business. 1) Customer billing management. This solution includes merchant settlement, pricing and discounting, guiding and rating, charging (including prepaid), balance management, interconnect billing, carrier access billing system and order management, and customer care.
a. Billing: Postpaid statement/invoice b. Charging: Recording the usage of services c. Rating: Calculating the usage of certain rates for different services
2) Revenue assurance and fraud management. This solution includes data quality and process improvement methods that improve profits, revenue and cash flow without influencing demand. 3) Online care/self-service. This solution includes account information access and account maintenance, self-registration, online access to customer service representatives, service requests, and SLA reporting, bill viewing and payment; and 4) Mediation. This solution includes devices that collect data from network elements and prepares them for BSSs and OSSs. OSS: Operations Support Systems are comprised primarily of 5 functions, as defined by Gartner, which help run the network. 1) Provisioning and activation. This solution includes systems and steps related to the process of implementing orders for customers; activation systems that map from connection requests that come through other systems to other commands that control network equipment; and provisioning systems that span the entire process of network and service provisioning. It also includes provisioning and activation in the context of SDPs. 2) Inventory management. This solution tracks and manages network assets, and manages network resources. It embodies the automated processes that allocate resources, determine configuration changes and automatically invoke activation. It includes discovery and reconciliation to provide accurate data for decision support. 3) Network management. This solution includes network and element management, and performance monitoring and management (including quality of service). It comprises software that provides operational insight into the performance and availability of services and systems that mediate data from network devices, servers and other operational systems — such as inventory and performance management. It further includes configuration, traffic management, fault and event management, test and measurement systems, security and SLA management for various network technologies, including self-organizing networks. 4) Planning and engineering. This solution includes the steps from network planning to construction. Examples are budgeting, procurement, and line and service testing. 5) Workforce management. This solution includes activities surrounding work assignment, coordination and tracking. It includes software that facilitates processes to ensure that personnel with the appropriate qualifications are given the correct equipment at the right time and place. Examples of IT systems and applications supporting

Redknee Solutions Inc. Canada Research | Page 31 of 37
Raymond James Ltd. | 2100 – 925 West Georgia Street | Vancouver BC Canada V6C 3L2
Company Citations
Company Name Ticker Exchange Currency Closing Price RJ Rating RJ Entity
Accenture plc ACN NYSE US$ 83.94 3 RJ & Associates Alcatel-Lucent ALU NYSE US$ 3.19 3 RJ & Associates America Movil, S.A.B. de C.V. AMX NYSE US$ 23.38 3 RJ & Associates AT&T Inc. T NYSE US$ 35.10 2 RJ & Associates BlackBerry BBRY NASDAQ US$ 11.00 3 RJ LTD. Cisco Systems CSCO NASDAQ US$ 25.15 2 RJ & Associates Comcast Corp. CMCSA NASDAQ US$ 52.96 1 RJ & Associates DISH Network Corp. DISH NASDAQ US$ 63.79 3 RJ & Associates Ericsson ERIC NASDAQ US$ 11.92 3 RJ & Associates Facebook, Inc. FB NASDAQ US$ 74.61 2 RJ & Associates International Business Machines Corp. IBM NYSE US$ 163.30 NC Microsoft MSFT NASDAQ US$ 48.87 3 RJ & Associates Netflix Inc. NFLX NASDAQ US$ 382.55 2 RJ & Associates Nokia NOK NYSE US$ 8.17 3 RJ & Associates Open Text OTEX NASDAQ US$ 58.82 2 RJ LTD. Oracle Corp. ORCL NYSE US$ 40.47 2 RJ & Associates Orange ORA EPA € 12.99 2 RJ Euro Equities
SAS Sierra Wireless SWIR NASDAQ US$ 36.09 3 RJ LTD. T-Mobile US Inc. TMUS NYSE US$ 28.53 2 RJ & Associates Telefonica TEF MCE € 12.18 3 RJ Euro Equities
SAS The Descartes Systems Group Inc. DSGX NASDAQ US$ 14.67 2 RJ LTD. Time Warner Cable Inc. TWC NYSE US$ 134.78 2 RJ & Associates Twitter, Inc. TWTR NYSE US$ 39.59 3 RJ & Associates Vodafone VOD LSE p 219.05 3 RJ Euro Equities
SAS
Notes: Prices are as of the most recent close on the indicated exchange and may not be in US$. See Disclosure section for rating definitions. Stocks that do not trade on a U.S. national exchange may not be registered for sale in all U.S. states. NC=not covered.
Disclaimer
All statements in this report attributable to Gartner represent Raymond James Ltd.’s interpretation of data, research opinion or viewpoints published as part of a syndicated subscription service by Gartner, Inc., and have not been reviewed by Gartner. Each Gartner publication speaks as of its original publication date (and not as of the date of this research report). The opinions expressed in Gartner publications are not representations of fact, and are subject to change without notice.
Canada Research | Page 32 of 37 Redknee Solutions Inc.
Raymond James Ltd. | 2100 – 925 West Georgia Street | Vancouver BC Canada V6C 3L2
IMPORTANT INVESTOR DISCLOSURES Raymond James & Associates (RJA) is a FINRA member firm and is responsible for the preparation and distribution of research created in the United States. Raymond James & Associates is located at The Raymond James Financial Center, 880 Carillon Parkway, St. Petersburg, FL 33716, (727) 567-1000. Non-U.S. affiliates, which are not FINRA member firms, include the following entities which are responsible for the creation and distribution of research in their respective areas; In Canada, Raymond James Ltd., Suite 2100, 925 West Georgia Street, Vancouver, BC V6C 3L2, (604) 659-8200; In Latin America, Raymond James Latin America, Ruta 8, km 17, 500, 91600 Montevideo, Uruguay, 00598 2 518 2033; In Europe, Raymond James Euro Equities, SAS, 40, rue La Boetie, 75008, Paris, France, +33 1 45 61 64 90.
This document is not directed to, or intended for distribution to or use by, any person or entity that is a citizen or resident of or located in any locality, state, country, or other jurisdiction where such distribution, publication, availability or use would be contrary to law or regulation. The securities discussed in this document may not be eligible for sale in some jurisdictions. This research is not an offer to sell or the solicitation of an offer to buy any security in any jurisdiction where such an offer or solicitation would be illegal. It does not constitute a personal recommendation nor does it take into account the particular investment objectives, financial situations, or needs of individual clients. Information in this report should not be construed as advice designed to meet the individual objectives of any particular investor. Investors should consider this report as only a single factor in making their investment decision. Consultation with your investment advisor is recommended. Past performance is not a guide to future performance, future returns are not guaranteed, and a loss of original capital may occur.
The information provided is as of the date above and subject to change, and it should not be deemed a recommendation to buy or sell any security. Certain information has been obtained from third-party sources we consider reliable, but we do not guarantee that such information is accurate or complete. Persons within the Raymond James family of companies may have information that is not available to the contributors of the information contained in this publication. Raymond James, including affiliates and employees, may execute transactions in the securities listed in this publication that may not be consistent with the ratings appearing in this publication.
With respect to materials prepared by Raymond James Ltd. (“RJL”), all expressions of opinion reflect the judgment of the Research Department of RJL, or its affiliates, at this date and are subject to change. RJL may perform investment banking or other services for, or solicit investment banking business from, any company mentioned in this document.
All Raymond James Ltd. research reports are distributed electronically and are available to clients at the same time via the firm’s website (http://www.raymondjames.ca). Immediately upon being posted to the firm’s website, the research reports are then distributed electronically to clients via email upon request and to clients with access to Bloomberg (home page: RJLC), Capital IQ and Thomson Reuters. Selected research reports are also printed and mailed at the same time to clients upon request. Requests for Raymond James Ltd. research may be made by contacting the Raymond James Product Group during market hours at (604) 659-8000.
In the event that this is a compendium report (i.e., covers 6 or more subject companies), Raymond James Ltd. may choose to provide specific disclosures for the subject companies by reference. To access these disclosures, clients should refer to: http://www.raymondjames.ca (click on Equity Capital Markets / Equity Research / Research Disclosures) or call toll-free at 1-800-667-2899.
ANALYST INFORMATION
Analyst Compensation: Equity research analysts and associates at Raymond James are compensated on a salary and bonus system. Several factors enter into the compensation determination for an analyst, including i) research quality and overall productivity, including success in rating stocks on an absolute basis and relative to the local exchange composite Index and/or a sector index, ii) recognition from institutional investors, iii) support effectiveness to the institutional and retail sales forces and traders, iv) commissions generated in stocks under coverage that are attributable to the analyst’s efforts, v) net revenues of the overall Equity Capital Markets Group, and vi) compensation levels for analysts at competing investment dealers.
Analyst Stock Holdings: Effective September 2002, Raymond James equity research analysts and associates or members of their households are forbidden from investing in securities of companies covered by them. Analysts and associates are permitted to hold long positions in the securities of companies they cover which were in place prior to September 2002 but are only permitted to sell those positions five days after the rating has been lowered to Underperform.
The views expressed in this report accurately reflect the personal views of the analyst(s) covering the subject securities. No part of said person's compensation was, is, or will be directly or indirectly related to the specific recommendations or views contained in this research report. In addition, said analyst has not received compensation from any subject company in the last 12 months.
RATINGS AND DEFINITIONS
Raymond James Ltd. (Canada) definitions: Strong Buy (SB1) The stock is expected to appreciate and produce a total return of at least 15% and outperform the S&P/TSX Composite Index over the next six months. Outperform (MO2) The stock is expected to appreciate and outperform the S&P/TSX Composite Index over the next twelve months. Market Perform (MP3) The stock is expected to perform generally in line with the S&P/TSX Composite Index over the next twelve months and is potentially a source of funds for more highly

Redknee Solutions Inc. Canada Research | Page 33 of 37
Raymond James Ltd. | 2100 – 925 West Georgia Street | Vancouver BC Canada V6C 3L2
rated securities. Underperform (MU4) The stock is expected to underperform the S&P/TSX Composite Index or its sector over the next six to twelve months and should be sold.
Raymond James & Associates (U.S.) definitions: Strong Buy (SB1) Expected to appreciate, produce a total return of at least 15%, and outperform the S&P 500 over the next six to 12 months. For higher yielding and more conservative equities, such as REITs and certain MLPs, a total return of at least 15% is expected to be realized over the next 12 months. Outperform (MO2) Expected to appreciate and outperform the S&P 500 over the next 12-18 months. For higher yielding and more conservative equities, such as REITs and certain MLPs, an Outperform rating is used for securities where we are comfortable with the relative safety of the dividend and expect a total return modestly exceeding the dividend yield over the next 12-18 months. Market Perform (MP3) Expected to perform generally in line with the S&P 500 over the next 12 months. Underperform (MU4) Expected to underperform the S&P 500 or its sector over the next six to 12 months and should be sold. Suspended (S) The rating and price target have been suspended temporarily. This action may be due to market events that made coverage impracticable, or to comply with applicable regulations or firm policies in certain circumstances, including when Raymond James may be providing investment banking services to the company. The previous rating and price target are no longer in effect for this security and should not be relied upon.
Raymond James Latin American rating definitions: Strong Buy (SB1) Expected to appreciate and produce a total return of at least 25.0% over the next twelve months. Outperform (MO2) Expected to appreciate and produce a total return of between 15.0% and 25.0% over the next twelve months. Market Perform (MP3) Expected to perform in line with the underlying country index. Underperform (MU4) Expected to underperform the underlying country index. Suspended (S) The rating and price target have been suspended temporarily. This action may be due to market events that made coverage impracticable, or to comply with applicable regulations or firm policies in certain circumstances, including when Raymond James may be providing investment banking services to the company. The previous rating and price target are no longer in effect for this security and should not be relied upon.
Raymond James Euro Equities, SAS rating definitions: Strong Buy (1) Expected to appreciate, produce a total return of at least 15%, and outperform the Stoxx 600 over the next 6 to 12 months. Outperform (2) Expected to appreciate and outperform the Stoxx 600 over the next 12 months. Market Perform (3) Expected to perform generally in line with the Stoxx 600 over the next 12 months. Underperform (4) Expected to underperform the Stoxx 600 or its sector over the next 6 to 12 months. Suspended (S) The rating and target price have been suspended temporarily. This action may be due to market events that made coverage impracticable, or to comply with applicable regulations or firm policies in certain circumstances, including when Raymond James may be providing investment banking services to the company. The previous rating and target price are no longer in effect for this security and should not be relied upon.
In transacting in any security, investors should be aware that other securities in the Raymond James research coverage universe might carry a higher or lower rating. Investors should feel free to contact their Financial Advisor to discuss the merits of other available investments.
Suitability Categories (SR): Total Return (TR) Lower risk equities possessing dividend yields above that of the S&P 500 and greater stability of principal. Growth (G) Low to average risk equities with sound financials, more consistent earnings growth, at least a small dividend, and the potential for long-term price appreciation. Aggressive Growth (AG) Medium or higher risk equities of companies in fast growing and competitive industries, with less predictable earnings and acceptable, but possibly more leveraged balance sheets. High Risk (HR) Companies with less predictable earnings (or losses), rapidly changing market dynamics, financial and competitive issues, higher price volatility (beta), and risk of principal. Venture Risk (VR) Companies with a short or unprofitable operating history, limited or less predictable revenues, very high risk associated with success, and a substantial risk of principal.
RATING DISTRIBUTIONS
Coverage Universe Rating Distribution Investment Banking Distribution
RJL RJA RJ LatAm RJEE RJL RJA RJ LatAm RJEE
Strong Buy and Outperform (Buy) 68% 55% 50% 45% 36% 24% 0% 0%
Market Perform (Hold) 30% 40% 50% 43% 25% 9% 0% 0%
Underperform (Sell) 2% 4% 0% 13% 25% 0% 0% 0%
RAYMOND JAMES RELATIONSHIP DISCLOSURES
Raymond James Ltd. or its affiliates expects to receive or intends to seek compensation for investment banking services from all companies under research coverage within the next three months.
STOCK CHARTS, TARGET PRICES, AND VALUATION METHODOLOGIES
Valuation Methodology: The Raymond James methodology for assigning ratings and target prices includes a number of qualitative and quantitative factors including an assessment of industry size, structure, business trends and overall attractiveness; management effectiveness; competition; visibility; financial condition, and expected total return, among other factors. These factors are subject to change depending on overall economic conditions or industry- or company-specific occurrences.

Canada Research | Page 34 of 37 Redknee Solutions Inc.
Raymond James Ltd. | 2100 – 925 West Georgia Street | Vancouver BC Canada V6C 3L2
Target Prices: The information below indicates our target price and rating changes for the stock over the past three years.
Valuation Methodology: We value Redknee using EBITDA multiples comparable to the peer group.
RISK FACTORS
General Risk Factors: Following are some general risk factors that pertain to the projected target prices included on Raymond James research: (1) Industry fundamentals with respect to customer demand or product / service pricing could change and adversely impact expected revenues and earnings; (2) Issues relating to major competitors or market shares or new product expectations could change investor attitudes toward the sector or this stock; (3) Unforeseen developments with respect to the management, financial condition or accounting policies or practices could alter the prospective valuation.
Risks - Redknee Solutions Inc. Macroeconomic risk – Global macroeconomic health can have a significant effect either positive or negative on Redknee’s customers and demand for Redknee’s products. Currency Fluctuations – Following the acquisition of the NSN BSS business in 2013, ~70% of its revenues are generated outside of the US (mostly EMEA and APAC). Redknee reports in US dollars. When the EURO appreciates 1% against the US Dollar, Redknee’s revenue increases by $1.2 million (+0.5%) and the EBIT increases $0.5 million (+0.45%). When the Canadian Dollar appreciates 1% against the US Dollar, EBIT decreases by $0.15 million (-0.13%). Acquisition of NSN BSS business – Given the previously bundled pricing of the acquired NSN contracts and the size of the NSN employee base moving over to Redknee, it may be challenging to integrate, maintain, and grow the NSN BSS business as well as retain and blend the cultures of the two companies. Highly competitive industry – Redknee competes with large multi-disciplinary and network equipment providers such as Amdocs, Ericsson, Comverse, Oracle, SAP, and Huawei. Increased competition may cause pricing pressure, reduced gross margins and loss of market share. Long lead times – Customers invest significant time and resources to test live the solutions provided by Redknee resulting in long lead times from first contact to actual sale. Customer Credit Risk – Industry practice is for billing customers when specific milestones are achieved, exposing the company to credit risk from its customers, channel partners, and third parties. Quarterly Fluctuations; No Quarter to Quarter Boundaries – While reporting quarterly results, Redknee internally does not bound itself on a quarterly basis due to the nature of contract negotiations which could give customers leverage in contract negotiations. This has

Redknee Solutions Inc. Canada Research | Page 35 of 37
Raymond James Ltd. | 2100 – 925 West Georgia Street | Vancouver BC Canada V6C 3L2
recently resulted in lumpy revenues quarter to quarter. As a result of the variability between quarters, revenue mix can vary greatly too especially if less license sales occur in the quarter and more low margin professional services and 3rd party hardware/software is sold.
Additional Risk and Disclosure information, as well as more information on the Raymond James rating system and suitability categories, is available for Raymond James at rjcapitalmarkets.com/Disclosures/index and for Raymond James Limited at www.raymondjames.ca/researchdisclosures.
INTERNATIONAL DISCLOSURES
FOR CLIENTS IN THE UNITED STATES:
Any foreign securities discussed in this report are generally not eligible for sale in the U.S. unless they are listed on a U.S. exchange. This report is being provided to you for informational purposes only and does not represent a solicitation for the purchase or sale of a security in any state where such a solicitation would be illegal. Investing in securities of issuers organized outside of the U.S., including ADRs, may entail certain risks. The securities of non-U.S. issuers may not be registered with, nor be subject to the reporting requirements of, the U.S. Securities and Exchange Commission. There may be limited information available on such securities. Investors who have received this report may be prohibited in certain states or other jurisdictions from purchasing the securities mentioned in this report. Please ask your Financial Advisor for additional details and to determine if a particular security is eligible for purchase in your state.
Raymond James Ltd. is not a U.S. broker-dealer and therefore is not governed by U.S. laws, rules or regulations applicable to U.S. broker-dealers. Consequently, the persons responsible for the content of this publication are not licensed in the U.S. as research analysts in accordance with applicable rules promulgated by the U.S. Self Regulatory Organizations.
Any U.S. Institutional Investor wishing to effect trades in any security should contact Raymond James (USA) Ltd., a U.S. broker-dealer affiliate of Raymond James Ltd.
FOR CLIENTS IN THE UNITED KINGDOM:
For clients of Raymond James & Associates (London Branch) and Raymond James Financial International Limited (RJFI): This document and any investment to which this document relates is intended for the sole use of the persons to whom it is addressed, being persons who are Eligible Counterparties or Professional Clients as described in the FCA rules or persons described in Articles 19(5) (Investment professionals) or 49(2) (High net worth companies, unincorporated associations etc) of the Financial Services and Markets Act 2000 (Financial Promotion) Order 2005 (as amended) or any other person to whom this promotion may lawfully be directed. It is not intended to be distributed or passed on, directly or indirectly, to any other class of persons and may not be relied upon by such persons and is therefore not intended for private individuals or those who would be classified as Retail Clients.
For clients of Raymond James Investment Services, Ltd.: This report is for the use of professional investment advisers and managers and is not intended for use by clients.
For purposes of the Financial Conduct Authority requirements, this research report is classified as independent with respect to conflict of interest management. RJA, RJFI, and Raymond James Investment Services, Ltd. are authorised and regulated by the Financial Conduct Authority in the United Kingdom.
FOR CLIENTS IN FRANCE:
This document and any investment to which this document relates is intended for the sole use of the persons to whom it is addressed, being persons who are Eligible Counterparties or Professional Clients as described in “Code Monétaire et Financier” and Règlement Général de l’Autorité des Marchés Financiers. It is not intended to be distributed or passed on, directly or indirectly, to any other class of persons and may not be relied upon by such persons and is therefore not intended for private individuals or those who would be classified as Retail Clients.
For institutional clients in the European Economic Area (EEA) outside of the United Kingdom: This document (and any attachments or exhibits hereto) is intended only for EEA institutional clients or others to whom it may lawfully be submitted.
Raymond James International and Raymond James Euro Equities are authorized by the Autorité de contrôle prudentiel et de résolution in France and regulated by the Autorité de contrôle prudentiel et de résolution and the Autorité des Marchés Financiers.
Proprietary Rights Notice: By accepting a copy of this report, you acknowledge and agree as follows:
This report is provided to clients of Raymond James only for your personal, noncommercial use. Except as expressly authorized by Raymond James, you may not copy, reproduce, transmit, sell, display, distribute, publish, broadcast, circulate, modify, disseminate or commercially exploit the information contained in this report, in printed, electronic or any other form, in any manner, without the prior express written consent of Raymond James. You also agree not to use the information provided in this report for any unlawful purpose.
This report and its contents are the property of Raymond James and are protected by applicable copyright, trade secret or other intellectual property laws (of the United States and other countries). United States law, 17 U.S.C. Sec.501 et seq, provides for civil and criminal penalties for copyright infringement.

Canada Research | Page 36 of 37 Redknee Solutions Inc.
Raymond James Ltd. | 2100 – 925 West Georgia Street | Vancouver BC Canada V6C 3L2
Additional information is available upon request. This document may not be reprinted without permission.
RJL is a member of the Canadian Investor Protection Fund. ©2014 Raymond James Ltd.

Redknee Solutions Inc. Canada Research | Page 37 of 37
Raymond James Ltd. | 2100 – 925 West Georgia Street | Vancouver BC Canada V6C 3L2
RAYMOND JAMES LTD. CANADIAN INSTITUTIONAL EQUITY TEAM WWW.RAYMONDJAMES.CA EQUITY RESEARCH HEAD OF EQUITY RESEARCH
DARYL SWETLISHOFF, CFA 604.659.8246
CONSUMER
CONSUMER & RETAIL KENRIC TYGHE, MBA 416.777.7188 KRISZTINA KATAI (ASSOCIATE) 416.777.7060
ENERGY
OIL & GAS ENERGY SERVICES, HEAD OF ENERGY RESEARCH ANDREW BRADFORD, CFA 403.509.0503 TIM MONACHELLO (ASSOCIATE) 403.509.0562 MICHAEL BARTH (JR ASSOCIATE) 403.509.0511
OIL & GAS PRODUCERS KURT MOLNAR 403.221.0414 BRADEN PURKIS (SR ASSOCIATE) 403.509.0518 GORDON STEPPAN, CFA (ASSOCIATE) 403.221.0411
SR. OIL & GAS PRODUCERS | OIL SANDS CHRIS COX, CFA 403.509.0523 MATTHEW MURPHY (ASSOCIATE) 403.509.0534
INDUSTRIAL & TRANSPORTATION
INDUSTRIAL | TRANSPORTATION, HEAD OF INDUSTRIAL RESEARCH BEN CHERNIAVSKY 604.659.8244 THEONI PILARINOS, CFA 604.659.8234 EDWARD GUDEWILL (ASSOCIATE) 604.659.8280
INFRASTRUCTURE & CONSTRUCTION FREDERIC BASTIEN, CFA 604.659.8232 SAMIR GHAFIR (ASSOCIATE) 604.659.8470
TRANSPORTATION | AGRIBUSINESS & FOOD PRODUCTS STEVE HANSEN, CMA, CFA 604.659.8208 DANIEL CHEW (ASSOCIATE) 604.659.8238
MINING
BASE METALS & MINERALS | IRON ORE ADAM LOW, CFA 416.777.4943 WAYNE LAM (ASSOCIATE) 416.777.7042
BASE & PRECIOUS METALS ALEX TERENTIEW, MBA, P.GEO 416.777.4912 ROSS YAKOVLEV, CA, MBA (ASSOCIATE) 416.777.7144
PRECIOUS METALS PHIL RUSSO 416.777.7084 LUC TROIANI (ASSOCIATE) 416.777.7098
PRECIOUS METALS CHRIS THOMPSON, M.SC. (ENG), P.GEO 604.659.8439 BRIAN MARTIN, CFA (ASSOCIATE) 604.654.1236
URANIUM | JR EXPLORATION & DEVELOPMENT DAVID SADOWSKI 604.659.8255 MILTON-ANDRES BERNAL (ASSOCIATE) 604.659.8028
FOREST PRODUCTS
FOREST PRODUCTS DARYL SWETLISHOFF, CFA 604.659.8246 DAVID QUEZADA, CFA (ASSOCIATE ANALYST) 604.659.8257
REAL ESTATE
REAL ESTATE & REITS KEN AVALOS, MBA 727.567.1756 JOHANN RODRIGUES (ASSOCIATE) 416.777.7189
TECHNOLOGY & COMMUNICATIONS
TECHNOLOGY, ALTERNATIVE ENERGY & CLEAN TECH STEVEN LI, CFA 416.777.4918 JONATHAN LO (ASSOCIATE) 416.777.6414
EQUITY RESEARCH PUBLISHING SENIOR SUPERVISORY ANALYST
HEATHER HERRON 403.509.0509 HEAD OF PUBLISHING | SUPERVISORY ANALYST
CYNTHIA LUI 604.659.8210
TYLER BOS (SUPERVISORY ANALYST | EDITOR) 416.777.4948 INDER GILL (RESEARCH EDITOR) 604.659.8202 KATE MAJOR (RESEARCH PRINCIPAL | EDITOR) 416.777.7173 CHRISTINE MARTE (RESEARCH EDITOR) 604.659.8200 ASHLEY RAMSAY (SUPERVISORY ANALYST |EDITOR) 604.659.8226
INSTITUTIONAL EQUITY SALES HEAD OF SALES
MIKE WESTCOTT 416.777.4935 GREG JACKSON (ECM, BUSINESS MANAGER) 416.777.7172 MICHELLE MARGUET (MARKETING COORDINATOR) 416.777.4951
TORONTO (CAN 1.888.601.6105 | USA 1.800.290.4847)
LAURA ARRELL (U.S. EQUITIES) 416.777.4920 SEAN BOYLE 416.777.4927 JEFF CARRUTHERS, CFA 416.777.4929 RICHARD EAKINS 416.777.4926 JONATHAN GREER 416.777.4930 DAVE MACLENNAN 416.777.4934 ROBERT MILLS, CFA 416.777.4945 BRADY PIMLOTT (ASSOCIATE) 416.777.4993 NICOLE SVEC-GRIFFIS, CFA (U.S. EQUITIES) 416.777.4942 NEIL WEBER 416.777.4931 ORNELLA BURNS (ASSISTANT) 416.777.4928 SATBIR CHATRATH (ASSISTANT) 416.777.4915
VANCOUVER (1.800.667.2899)
SCOT ATKINSON, CFA 604.659.8225 NICK POCRNIC 604.659.8230 TERRI MCEWAN (ASSISTANT) 604.659.8228
MONTREAL (514.350.4450 | 1.866.350.4455)
JOHN HART 514.350.4462 DAVID MAISLIN, CFA 514.350.4460 TANYA HATCHER (ASSISTANT) 514.350.4458
LONDON
JON DE VOS 0.207.426.5632 ADAM WOOD 0.207.426.5612
INSTITUTIONAL EQUITY TRADING
CO-HEAD OF TRADING BOB MCDONALD, CFA 604.659.8222 ANDREW FOOTE, CFA 416.777.4924
TORONTO (CANADA 1.888.601.6105 | USA 1.800.290.4847) PAM BANKS 416.777.4923 OLIVER HERBST 416.777.4947 ANDY HERRMANN 416.777.4937 ERIC MUNRO, CFA 416.777.4983 JAMES SHIELDS 416.777.4941 BOB STANDING 416.777.4921 PETER MASON (ASSISTANT) 416.777.7195
VANCOUVER (1.800.667.2899) NAV CHEEMA 604.659.8224 FRASER JEFFERSON 604.659.8218 DEREK ORAM 604.659.8223
MONTREAL (514.350.4450 | 1.866.350.4455) JOE CLEMENT 514.350.4470 PATRICK SANCHE 514.350.4465
INSTITUTIONAL EQUITY OFFICES
Calgary Suite 4250 525 8th Avenue SW Calgary, AB T2P 1G1 403.509.0500
Montreal Suite 3000 1800 McGill College Montreal, PQ H3A 3J6 514.350.4450 Toll Free: 1.866.350.4455
Vancouver Suite 2100 925 West Georgia Street Vancouver, BC V6C 3L2 604.659.8000 Toll Free: 1.800.667.2899
Toronto Suite 5400, Scotia Plaza 40 King Street West Toronto, ON M5H 3Y2 416.777.4900 Toll Free Canada: .888.601.6105 Toll Free USA: 1.800.290.4847
International Headquarters The Raymond James Financial Center 880 Carillon Parkway St.Petersburg, FL USA 33716 727.567.1000