Canada Research Cara Operations Limited … · Cara Operations Limited September ... positioning...
36
Canada Research Published by Raymond James Ltd. Please read domestic and foreign disclosure/risk information beginning on page 32 and Analyst Certification on page 30. Raymond James Ltd. | 2100 – 925 West Georgia Street | Vancouver BC Canada V6C 3L2 Cara Operations Limited September 29, 2015 CAO-TSX Company Report - Initiation of Coverage Kenric S. Tyghe MBA | 416.777.7188 | [email protected] Krisztina Katai (Associate) | 416.777.7060 | [email protected] Consumer & Retail A Chalet in the Mountains, and Runway for the Landing Recommendation We are initiating coverage of Cara Operations Ltd. (Cara) with an Outperform rating and a $38.00 target price. Cara’s turnaround under the new management team continues to gain traction, as highlighted by its stronger operating performance and recent acquisition activity (which we expect to accelerate). Same Restaurant Sales (SRS) growth continues to track higher (on relatively easy comps), as new marketing strategies resonate, which (on solid execution) is driving margin expansion. We expect that Cara will deliver strong (absolute and relative) revenue and EBITDA CAGRs of 12.1% and 16.3%, respectively, through our forecast window to 2017E, with potential acquisitions offering further upside as Cara flexes its under-levered balance sheet. Analysis While we are mindful of the risks associated with a turnaround play, we believe (based on recent performance) that the risk-adjusted opportunity is attractive. The team doesn’t need to hit it out of the park in order to win, but rather to consistently execute against its (relatively aggressive) game plan. Cara’s balance sheet supports both improving the health of the existing network and rapidly building out the network, positioning Cara to increase market share. The highly fragmented restaurant industry presents numerous sizeable and attractive potential acquisition targets, which offer upside to our estimates. The Canadian restaurant industry, in which Cara ranks third with a 3.4% share, grew at a 4.0% 10-year CAGR through 2014, despite the macro headwinds. The $50.4 bln (2014) Canadian Restaurant Industry grew at a 3.7% CAGR in the 5 years through 2009, with growth accelerating post the recession to 4.3% through 2014. We are conservatively modeling SRS growth at the low-end of Cara’s target range of 2.5%-4.0%, and modest EBITDA margin expansion through 2017E. Our 2016E EBITDA growth estimate of 17.8% to $122.1 mln is predicated on SRS growth of 2.4% (for 2016E revenue growth of 14.6% to $369.8 mln). Valuation We are initiating coverage of Cara with an Outperform rating and $38.00 target price. Our target price of $38.00 is based on 16.0x our 2016E EBITDA of $122.1 mln, for an imputed value of $37.52. Our EV/EBITDA based target price is well supported by our DCF valuation of $38.18. We believe Cara warrants a premium valuation relative to its fast casual peer group average of 14.2x 2016E EBITDA, given its relative EBITDA growth trajectory (and margin profile). See our Valuation & Recommendation section for details. EPS 1Q 2Q 3Q 4Q Full Revenues EBITDA Mar Jun Sep Dec Year (mln) (mln) 2014A C$0.18 C$0.23 C$0.12 C$(0.24) C$0.29 C$282 C$84 2015E 0.17A 0.31A 0.28 0.32 1.12 323 104 2016E 0.35 0.41 0.34 0.34 1.44 370 122 2017E 0.36 0.43 0.36 0.37 1.52 397 131 Source: Raymond James Ltd., Thomson One Outperform 2 C$38.00 target price Current Price ( Sep-25-15 ) C$33.00 Total Return to Target 16% 52-Week Range C$36.99 - C$29.52 Suitability Medium Risk/Growth Market Data Market Capitalization (mln) C$1,667 Current Net Debt (mln) C$64 Enterprise Value (mil.) C$1,731 Shares Outstanding (mln, f.d.) 51.0 10 Day Avg Daily Volume (000s) 11 Dividend/Yield C$0.37/1.1% Key Financial Metrics 2014A 2015E 2016E 2017E P/E N/M 29.6x 23.0x 21.7x EV/EBITDA 20.7x 16.7x 14.2x 13.2x Company Description Cara is a leading full-service restaurant franchisor and operator in Canada, with 827 restaurants under 10 banners. Cara operates a highly franchised system, with approximately 89% of restaurants franchised.
Transcript of Canada Research Cara Operations Limited … · Cara Operations Limited September ... positioning...
Canada Research Published by Raymond James Ltd.
Please read domestic and foreign disclosure/risk information beginning on page 32 and Analyst Certification on page 30. Raymond James Ltd. | 2100 – 925 West Georgia Street | Vancouver BC Canada V6C 3L2
Cara Operations Limited September 29, 2015 CAO-TSX Company Report - Initiation of Coverage Kenric S. Tyghe MBA | 416.777.7188 | [email protected]
Krisztina Katai (Associate) | 416.777.7060 | [email protected]
Consumer & Retail
A Chalet in the Mountains, and Runway for the Landing
Recommendation We are initiating coverage of Cara Operations Ltd. (Cara) with an Outperform rating and a $38.00 target price. Cara’s turnaround under the new management team continues to gain traction, as highlighted by its stronger operating performance and recent acquisition activity (which we expect to accelerate). Same Restaurant Sales (SRS) growth continues to track higher (on relatively easy comps), as new marketing strategies resonate, which (on solid execution) is driving margin expansion. We expect that Cara will deliver strong (absolute and relative) revenue and EBITDA CAGRs of 12.1% and 16.3%, respectively, through our forecast window to 2017E, with potential acquisitions offering further upside as Cara flexes its under-levered balance sheet.
Analysis While we are mindful of the risks associated with a turnaround play, we believe
(based on recent performance) that the risk-adjusted opportunity is attractive. The team doesn’t need to hit it out of the park in order to win, but rather to consistently execute against its (relatively aggressive) game plan.
Cara’s balance sheet supports both improving the health of the existing network and rapidly building out the network, positioning Cara to increase market share. The highly fragmented restaurant industry presents numerous sizeable and attractive potential acquisition targets, which offer upside to our estimates.
The Canadian restaurant industry, in which Cara ranks third with a 3.4% share, grew at a 4.0% 10-year CAGR through 2014, despite the macro headwinds. The $50.4 bln (2014) Canadian Restaurant Industry grew at a 3.7% CAGR in the 5 years through 2009, with growth accelerating post the recession to 4.3% through 2014.
We are conservatively modeling SRS growth at the low-end of Cara’s target range of 2.5%-4.0%, and modest EBITDA margin expansion through 2017E. Our 2016E EBITDA growth estimate of 17.8% to $122.1 mln is predicated on SRS growth of 2.4% (for 2016E revenue growth of 14.6% to $369.8 mln).
Valuation We are initiating coverage of Cara with an Outperform rating and $38.00 target price. Our target price of $38.00 is based on 16.0x our 2016E EBITDA of $122.1 mln, for an imputed value of $37.52. Our EV/EBITDA based target price is well supported by our DCF valuation of $38.18. We believe Cara warrants a premium valuation relative to its fast casual peer group average of 14.2x 2016E EBITDA, given its relative EBITDA growth trajectory (and margin profile). See our Valuation & Recommendation section for details.
EPS 1Q 2Q 3Q 4Q Full Revenues EBITDA Mar Jun Sep Dec Year (mln) (mln)
2014A C$0.18 C$0.23 C$0.12 C$(0.24) C$0.29 C$282 C$84
2015E 0.17A 0.31A 0.28 0.32 1.12 323 104
2016E 0.35 0.41 0.34 0.34 1.44 370 122
2017E 0.36 0.43 0.36 0.37 1.52 397 131
Source: Raymond James Ltd., Thomson One
Outperform 2 C$38.00 target price
Current Price ( Sep-25-15 ) C$33.00 Total Return to Target 16% 52-Week Range C$36.99 - C$29.52 Suitability Medium Risk/Growth
Market Data Market Capitalization (mln) C$1,667 Current Net Debt (mln) C$64 Enterprise Value (mil.) C$1,731 Shares Outstanding (mln, f.d.) 51.0 10 Day Avg Daily Volume (000s) 11 Dividend/Yield C$0.37/1.1%
Key Financial Metrics 2014A 2015E 2016E 2017E
P/E N/M 29.6x 23.0x 21.7x
EV/EBITDA 20.7x 16.7x 14.2x 13.2x
Company Description Cara is a leading full-service restaurant franchisor and operator in Canada, with 827 restaurants under 10 banners. Cara operates a highly franchised system, with approximately 89% of restaurants franchised.
Canada Research | Page 2 of 36 Cara Operations Limited
Raymond James Ltd. | 2100 – 925 West Georgia Street | Vancouver BC Canada V6C 3L2
Table of Contents
Executive Summary ............................................................................................................................................. 4
Company Overview .............................................................................................................................................. 5
Investment Thesis ................................................................................................................................................ 8
Financial Analysis & Outlook................................................................................................................................ 18
Valuation & Recommendation ............................................................................................................................ 21
Appendix A: Financial Statements ....................................................................................................................... 23
Appendix B: Management & Board of Directors ................................................................................................. 26
Risks ..................................................................................................................................................................... 28
Cara Operations Limited Canada Research | Page 3 of 36
Raymond James Ltd. | 2100 – 925 West Georgia Street | Vancouver BC Canada V6C 3L2
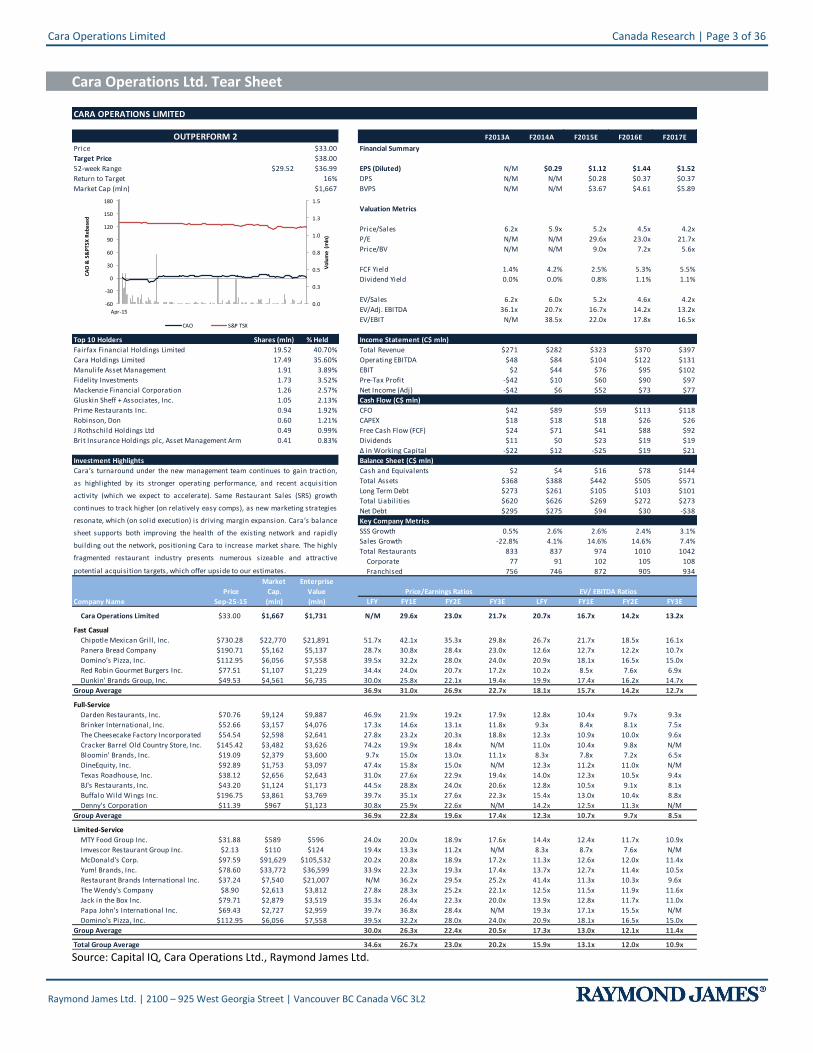
Cara Operations Ltd. Tear Sheet
CARA OPERATIONS LIMITED TSX:CAO
F2013A F2014A F2015E F2016E F2017E
Price $33.00 Financial Summary 12/31/2011 12/31/2013 12/31/2014 12/31/2015 12/30/2016 12/30/2017
Target Price $38.00
52-week Range $29.52 $36.99 EPS (Diluted) N/M $0.29 $1.12 $1.44 $1.52
Return to Target 16% DPS N/M N/M $0.28 $0.37 $0.37
Market Cap (mln) $1,667 BVPS N/M N/M $3.67 $4.61 $5.89
Valuation Metrics
Price/Sales 6.2x 5.9x 5.2x 4.5x 4.2x
P/E N/M N/M 29.6x 23.0x 21.7x
Price/BV N/M N/M 9.0x 7.2x 5.6x
FCF Yield 1.4% 4.2% 2.5% 5.3% 5.5%
Dividend Yield 0.0% 0.0% 0.8% 1.1% 1.1%
EV/Sales 6.2x 6.0x 5.2x 4.6x 4.2x
EV/Adj. EBITDA 36.1x 20.7x 16.7x 14.2x 13.2x
EV/EBIT N/M 38.5x 22.0x 17.8x 16.5x
18.9 18.9 47.0 50.5 50.5
Top 10 Holders Shares (mln) % Held Income Statement (C$ mln)
Fairfax Financial Holdings Limited 19.52 40.70% Total Revenue $271 $282 $323 $370 $397
Cara Holdings Limited 17.49 35.60% Operating EBITDA $48 $84 $104 $122 $131
Manulife Asset Management 1.91 3.89% EBIT $2 $44 $76 $95 $102
Fidelity Investments 1.73 3.52% Pre-Tax Profit -$42 $10 $60 $90 $97
Mackenzie Financial Corporation 1.26 2.57% Net Income (Adj) -$42 $6 $52 $73 $77
Gluskin Sheff + Associates, Inc. 1.05 2.13% Cash Flow (C$ mln)
Prime Restaurants Inc. 0.94 1.92% CFO $42 $89 $59 $113 $118
Robinson, Don 0.60 1.21% CAPEX $18 $18 $18 $26 $26
J Rothschild Holdings Ltd 0.49 0.99% Free Cash Flow (FCF) $24 $71 $41 $88 $92
Brit Insurance Holdings plc, Asset Management Arm 0.41 0.83% Dividends $11 $0 $23 $19 $19
Δ in Working Capital -$22 $12 -$25 $19 $21
Investment Highlights Balance Sheet (C$ mln)
Cash and Equivalents $2 $4 $16 $78 $144
Total Assets $368 $388 $442 $505 $571
Long Term Debt $273 $261 $105 $103 $101
Total Liabilities $620 $626 $269 $272 $273
Net Debt $295 $275 $94 $30 -$38
Key Company Metrics
SSS Growth 0.5% 2.6% 2.6% 2.4% 3.1%
Sales Growth -22.8% 4.1% 14.6% 14.6% 7.4%
Total Restaurants 833 837 974 1010 1042
Corporate 77 91 102 105 108
Franchised 756 746 872 905 934
Market
Price Cap.
Company Name Sep-25-15 (mln) LFY FY1E FY2E FY3E LFY FY1E FY2E FY3E1000 1001 1002 1003 1000 1001 1002 1003
Cara Operations Limited $33.00 $1,667 $1,731 TSX:CAO N/M 29.6x 23.0x 21.7x 20.7x 16.7x 14.2x 13.2x
Fast Casual
Chipotle Mexican Gril l , Inc. $730.28 $22,770 $21,891 CMG 51.7x 42.1x 35.3x 29.8x 26.7x 21.7x 18.5x 16.1x
Panera Bread Company $190.71 $5,162 $5,137 PNRA 28.7x 30.8x 28.4x 23.0x 12.6x 12.7x 12.2x 10.7x
Domino's Pizza, Inc. $112.95 $6,056 $7,558 DPZ 39.5x 32.2x 28.0x 24.0x 20.9x 18.1x 16.5x 15.0x
Red Robin Gourmet Burgers Inc. $77.51 $1,107 $1,229 RRGB 34.4x 24.0x 20.7x 17.2x 10.2x 8.5x 7.6x 6.9x
Dunkin' Brands Group, Inc. $49.53 $4,561 $6,735 DNKN 30.0x 25.8x 22.1x 19.4x 19.9x 17.4x 16.2x 14.7x
Group Average 36.9x 31.0x 26.9x 22.7x 18.1x 15.7x 14.2x 12.7x
Full-Service
Darden Restaurants, Inc. $70.76 $9,124 $9,887 DRI 46.9x 21.9x 19.2x 17.9x 12.8x 10.4x 9.7x 9.3x
Brinker International, Inc. $52.66 $3,157 $4,076 EAT 17.3x 14.6x 13.1x 11.8x 9.3x 8.4x 8.1x 7.5x
The Cheesecake Factory Incorporated $54.54 $2,598 $2,641 CAKE 27.8x 23.2x 20.3x 18.8x 12.3x 10.9x 10.0x 9.6x
Cracker Barrel Old Country Store, Inc. $145.42 $3,482 $3,626 CBRL 74.2x 19.9x 18.4x N/M 11.0x 10.4x 9.8x N/M
Bloomin' Brands, Inc. $19.09 $2,379 $3,600 BLMN 9.7x 15.0x 13.0x 11.1x 8.3x 7.8x 7.2x 6.5x
DineEquity, Inc. $92.89 $1,753 $3,097 DIN 47.4x 15.8x 15.0x N/M 12.3x 11.2x 11.0x N/M
Texas Roadhouse, Inc. $38.12 $2,656 $2,643 TXRH 31.0x 27.6x 22.9x 19.4x 14.0x 12.3x 10.5x 9.4x
BJ's Restaurants, Inc. $43.20 $1,124 $1,173 BJRI 44.5x 28.8x 24.0x 20.6x 12.8x 10.5x 9.1x 8.1x
Buffalo Wild Wings Inc. $196.75 $3,861 $3,769 BWLD 39.7x 35.1x 27.6x 22.3x 15.4x 13.0x 10.4x 8.8x
Denny's Corporation $11.39 $967 $1,123 DENN 30.8x 25.9x 22.6x N/M 14.2x 12.5x 11.3x N/M
Group Average 36.9x 22.8x 19.6x 17.4x 12.3x 10.7x 9.7x 8.5x.
Limited-Service
MTY Food Group Inc. $31.88 $589 $596 MTY 24.0x 20.0x 18.9x 17.6x 14.4x 12.4x 11.7x 10.9x
Imvescor Restaurant Group Inc. $2.13 $110 $124 TSX:IRG 19.4x 13.3x 11.2x N/M 8.3x 8.7x 7.6x N/M
McDonald's Corp. $97.59 $91,629 $105,532 MCD 20.2x 20.8x 18.9x 17.2x 11.3x 12.6x 12.0x 11.4x
Yum! Brands, Inc. $78.60 $33,772 $36,599 YUM 33.9x 22.3x 19.3x 17.4x 13.7x 12.7x 11.4x 10.5x
Restaurant Brands International Inc. $37.24 $7,540 $21,007 QSR N/M 36.2x 29.5x 25.2x 41.4x 11.3x 10.3x 9.6x
The Wendy's Company $8.90 $2,613 $3,812 WEN 27.8x 28.3x 25.2x 22.1x 12.5x 11.5x 11.9x 11.6x
Jack in the Box Inc. $79.71 $2,879 $3,519 JACK 35.3x 26.4x 22.3x 20.0x 13.9x 12.8x 11.7x 11.0x
Papa John's International Inc. $69.43 $2,727 $2,959 PZZA 39.7x 36.8x 28.4x N/M 19.3x 17.1x 15.5x N/M
Domino's Pizza, Inc. $112.95 $6,056 $7,558 DPZ 39.5x 32.2x 28.0x 24.0x 20.9x 18.1x 16.5x 15.0x
Group Average 30.0x 26.3x 22.4x 20.5x 17.3x 13.0x 12.1x 11.4x
Total Group Average 34.6x 26.7x 23.0x 20.2x 15.9x 13.1x 12.0x 10.9x
OUTPERFORM 2
Cara’s turnaround under the new management team continues to gain traction,
as highlighted by its stronger operating performance, and recent acquisition
activity (which we expect to accelerate). Same Restaurant Sales (SRS) growth
continues to track higher (on relatively easy comps), as new marketing strategies
resonate, which (on solid execution) is driving margin expansion. Cara’s balance
sheet supports both improving the health of the existing network and rapidly
building out the network, positioning Cara to increase market share. The highly
fragmented restaurant industry presents numerous sizeable and attractive
potential acquisition targets, which offer upside to our estimates.
Enterprise
Value
(mln)
Price/Earnings Ratios EV/ EBITDA Ratios
0.0
0.3
0.5
0.8
1.0
1.3
1.5
-60
-30
0
30
60
90
120
150
180
Apr-15
Vo
lum
e (
mln
)
CA
O &
S&
PT
SX
Re
ba
sed
CAO S&P TSX
Source: Capital IQ, Cara Operations Ltd., Raymond James Ltd.
Canada Research | Page 4 of 36 Cara Operations Limited
Raymond James Ltd. | 2100 – 925 West Georgia Street | Vancouver BC Canada V6C 3L2
Executive Summary
Turnaround Play Poised to Lever its Market Share
The $50.4 bln (2014) Canadian Restaurant Industry is fragmented, with the top 5 restaurant chains accounting for approximately 31% of the market and the next 195 largest chains accounting for 29% (the top 10 largest chains comprise 40% of restaurant industry sales). The restaurant industry grew at a 4.0% 10-year CAGR through 2014, with growth accelerating from 3.7% in the 5 years through 2009 to 4.3% through 2014, led by growth in limited-service (Harvey’s is Cara’s only limited-service banner). The 5-year full-service CAGR through 2014 was 3.9% versus limited-service of 4.7%, according to Statistics Canada.
Cara, with a 3.4% market share, is the third largest player in Canada behind Restaurant Brands International (13.6%) and McDonald’s (8.0%), with the balance sheet (and appetite) to make meaningful potential acquisitions through our forecast window. With 72% of its network in Ontario, Cara’s performance is closely tied to that of Ontario’s economic growth which, according to the Conference Board of Canada, is expected to outpace the national average for the first time since 2002 (approximately 16% of Cara’s network is in Western Canada).
Franchise Model – Asset Light, FCF Heavy
Cara’s transformation into a pure play restaurant operator began in 2004 with its privatization by the Phelan family, subsequent to which (i) a number of non-core (non-restaurant) assets were divested, and (ii) Cara began the transformation to a largely franchise-driven business model. Prior to its privatization in 2004, Cara’s model was 58% franchised versus 89% today. The capital-light business model shifts CAPEX (and operating costs) to franchisees, generating both strong FCF and ROE metrics, and lends itself to both organic (and acquisition) driven network growth (with attractive peer group relative economics).
While the franchise model supported (and continues to support) EBITDA margin expansion, it is significant cost cutting initiatives (which accelerated under new management) that have driven the marked increase in the EBITDA margins. In 2012, SG&A margins were 66.8% (on SG&A dollars of $233.9 mln), versus 57.7% in 2014.
New (Highly Qualified) Management Team to Drive Turnaround
The new management team has significant retail turnaround and food service experience. The three key members of the new team include the CEO (Mr. Bill Gregson), the CFO (Mr. Ken Grondin) and the President (Family Division) and Chief Development Officer (Mr. Ken Otto). During their tenures at The Brick, Mr. Gregson (who served as CEO from July 2009) and Mr. Grondin (who served as CFO from April 2011) led The Brick through a successful turnaround (and ultimate sale to Leon’s Furniture). Prior to joining The Brick, Mr. Gregson led a successful turnaround of Forzani Group Ltd., where he served as President and Chief Operating Officer.
While Cara is a turnaround play (with aggressive, but in our opinion achievable, organic growth targets), we expect that potential acquisitions to complement the organic growth opportunity will (i) focus on markets outside of Ontario, and (ii) target solid (not troubled) banners, from which growth (and synergies) can be driven by levering Cara’s infrastructure.
Potential Acquisitions to Complement Organic Growth
Cara is, we believe, well positioned to continue to consolidate the highly fragmented Canadian restaurant industry, given its market share, track record of successful integration of acquisitions (Prime Restaurants and The Landing Group) to date, and under-levered balance sheet.
Cara’s leverage of 0.7x times (2Q15) is conservative, and management has indicated that it is comfortable increasing it to 3.0x (approximately $300.0 mln in incremental debt capacity). While Cara paid 8.0x EBITDA for the Landing Group, we believe that 6.0x – 8.0x is the acquisition sweet spot, and that Cara would only pay up into the 8.0x – 10.0x range for crown jewels. We estimate a $250 mln acquisition (on an 8.0x multiple) would generate approximately $31.3 mln in EBITDA (for a 26% 2016E EBITDA estimate increase from $122.1 mln to $153.3 mln). Exhibit 17 details our sensitivity analysis.
While we believe that a bolt-on acquisition of the likes of St-Hubert would bring immediate scale to Cara’s operations in Québec, a series of smaller tuck in acquisitions is equally probable. We detail some of what we believe are the more attractive targets in the report.
Cara Operations Limited Canada Research | Page 5 of 36
Raymond James Ltd. | 2100 – 925 West Georgia Street | Vancouver BC Canada V6C 3L2
Company Overview
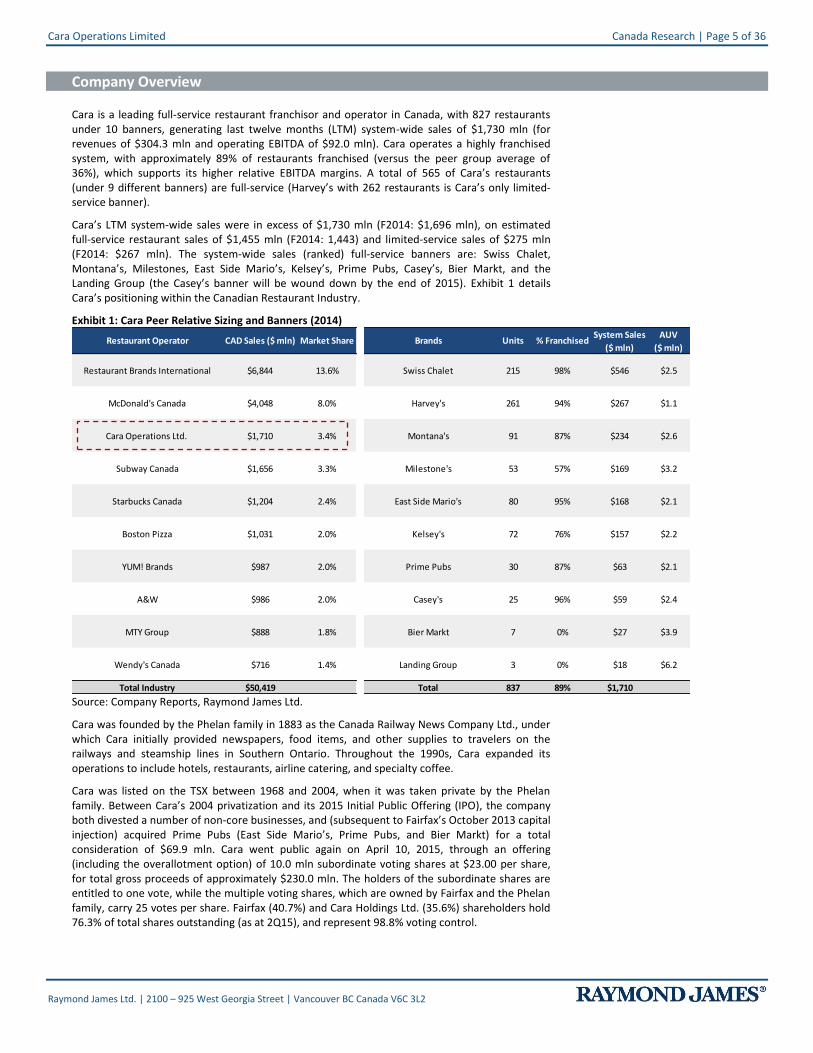
Cara is a leading full-service restaurant franchisor and operator in Canada, with 827 restaurants under 10 banners, generating last twelve months (LTM) system-wide sales of $1,730 mln (for revenues of $304.3 mln and operating EBITDA of $92.0 mln). Cara operates a highly franchised system, with approximately 89% of restaurants franchised (versus the peer group average of 36%), which supports its higher relative EBITDA margins. A total of 565 of Cara’s restaurants (under 9 different banners) are full-service (Harvey’s with 262 restaurants is Cara’s only limited-service banner).
Cara’s LTM system-wide sales were in excess of $1,730 mln (F2014: $1,696 mln), on estimated full-service restaurant sales of $1,455 mln (F2014: 1,443) and limited-service sales of $275 mln (F2014: $267 mln). The system-wide sales (ranked) full-service banners are: Swiss Chalet, Montana’s, Milestones, East Side Mario’s, Kelsey’s, Prime Pubs, Casey’s, Bier Markt, and the Landing Group (the Casey’s banner will be wound down by the end of 2015). Exhibit 1 details Cara’s positioning within the Canadian Restaurant Industry.
Exhibit 1: Cara Peer Relative Sizing and Banners (2014)
Restaurant Brands International $6,844 13.6% Swiss Chalet 215 98% $546 $2.5
McDonald's Canada $4,048 8.0% Harvey's 261 94% $267 $1.1
Cara Operations Ltd. $1,710 3.4% Montana's 91 87% $234 $2.6
Subway Canada $1,656 3.3% Milestone's 53 57% $169 $3.2
Starbucks Canada $1,204 2.4% East Side Mario's 80 95% $168 $2.1
Boston Pizza $1,031 2.0% Kelsey's 72 76% $157 $2.2
YUM! Brands $987 2.0% Prime Pubs 30 87% $63 $2.1
A&W $986 2.0% Casey's 25 96% $59 $2.4
MTY Group $888 1.8% Bier Markt 7 0% $27 $3.9
Wendy's Canada $716 1.4% Landing Group 3 0% $18 $6.2
Total Industry $50,419 Total 837 89% $1,710
% FranchisedSystem Sales
($ mln)
AUV
($ mln)Restaurant Operator CAD Sales ($ mln) Market Share Brands Units
Source: Company Reports, Raymond James Ltd.
Cara was founded by the Phelan family in 1883 as the Canada Railway News Company Ltd., under which Cara initially provided newspapers, food items, and other supplies to travelers on the railways and steamship lines in Southern Ontario. Throughout the 1990s, Cara expanded its operations to include hotels, restaurants, airline catering, and specialty coffee.
Cara was listed on the TSX between 1968 and 2004, when it was taken private by the Phelan family. Between Cara’s 2004 privatization and its 2015 Initial Public Offering (IPO), the company both divested a number of non-core businesses, and (subsequent to Fairfax’s October 2013 capital injection) acquired Prime Pubs (East Side Mario’s, Prime Pubs, and Bier Markt) for a total consideration of $69.9 mln. Cara went public again on April 10, 2015, through an offering (including the overallotment option) of 10.0 mln subordinate voting shares at $23.00 per share, for total gross proceeds of approximately $230.0 mln. The holders of the subordinate shares are entitled to one vote, while the multiple voting shares, which are owned by Fairfax and the Phelan family, carry 25 votes per share. Fairfax (40.7%) and Cara Holdings Ltd. (35.6%) shareholders hold 76.3% of total shares outstanding (as at 2Q15), and represent 98.8% voting control.
Canada Research | Page 6 of 36 Cara Operations Limited
Raymond James Ltd. | 2100 – 925 West Georgia Street | Vancouver BC Canada V6C 3L2
Fairfax Financial Holdings Limited made its initial $170 mln investment in Cara in October 2013, which consisted of $100 mln in cash and the vending into Cara of Prime Restaurants Inc., for a total consideration of $69.6 mln (net of $3.9 mln long-term debt retired). In November 2013, Fairfax purchased a 51% interest Keg Restaurants chain, which reported 2014 system-wide sales of $520.7 mln. On December 18, 2014, Cara acquired a 55% interest in the Landing Group for $18.3 mln and had an option to acquire the remaining 45% at any time until December 18, 2018 (on June 26, 2015 Cara purchased the remaining 45%).
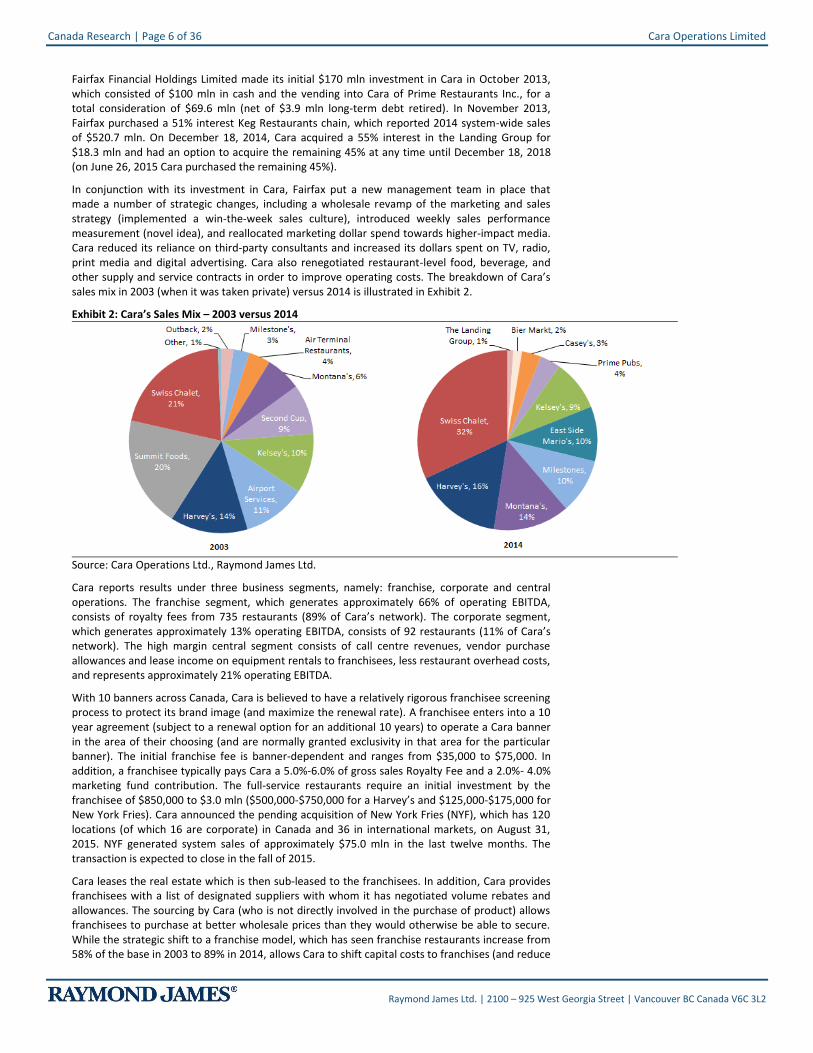
In conjunction with its investment in Cara, Fairfax put a new management team in place that made a number of strategic changes, including a wholesale revamp of the marketing and sales strategy (implemented a win-the-week sales culture), introduced weekly sales performance measurement (novel idea), and reallocated marketing dollar spend towards higher-impact media. Cara reduced its reliance on third-party consultants and increased its dollars spent on TV, radio, print media and digital advertising. Cara also renegotiated restaurant-level food, beverage, and other supply and service contracts in order to improve operating costs. The breakdown of Cara’s sales mix in 2003 (when it was taken private) versus 2014 is illustrated in Exhibit 2.
Exhibit 2: Cara’s Sales Mix – 2003 versus 2014
Source: Cara Operations Ltd., Raymond James Ltd.
Cara reports results under three business segments, namely: franchise, corporate and central operations. The franchise segment, which generates approximately 66% of operating EBITDA, consists of royalty fees from 735 restaurants (89% of Cara’s network). The corporate segment, which generates approximately 13% operating EBITDA, consists of 92 restaurants (11% of Cara’s network). The high margin central segment consists of call centre revenues, vendor purchase allowances and lease income on equipment rentals to franchisees, less restaurant overhead costs, and represents approximately 21% operating EBITDA.
With 10 banners across Canada, Cara is believed to have a relatively rigorous franchisee screening process to protect its brand image (and maximize the renewal rate). A franchisee enters into a 10 year agreement (subject to a renewal option for an additional 10 years) to operate a Cara banner in the area of their choosing (and are normally granted exclusivity in that area for the particular banner). The initial franchise fee is banner-dependent and ranges from $35,000 to $75,000. In addition, a franchisee typically pays Cara a 5.0%-6.0% of gross sales Royalty Fee and a 2.0%- 4.0% marketing fund contribution. The full-service restaurants require an initial investment by the franchisee of $850,000 to $3.0 mln ($500,000-$750,000 for a Harvey’s and $125,000-$175,000 for New York Fries). Cara announced the pending acquisition of New York Fries (NYF), which has 120 locations (of which 16 are corporate) in Canada and 36 in international markets, on August 31, 2015. NYF generated system sales of approximately $75.0 mln in the last twelve months. The transaction is expected to close in the fall of 2015.
Cara leases the real estate which is then sub-leased to the franchisees. In addition, Cara provides franchisees with a list of designated suppliers with whom it has negotiated volume rebates and allowances. The sourcing by Cara (who is not directly involved in the purchase of product) allows franchisees to purchase at better wholesale prices than they would otherwise be able to secure. While the strategic shift to a franchise model, which has seen franchise restaurants increase from 58% of the base in 2003 to 89% in 2014, allows Cara to shift capital costs to franchises (and reduce
Cara Operations Limited Canada Research | Page 7 of 36
Raymond James Ltd. | 2100 – 925 West Georgia Street | Vancouver BC Canada V6C 3L2
working capital requirements), Cara does provide franchisee relief for less profitable restaurants. New franchisees start at full royalty rates.
While Cara currently has approximately 36 pre-qualified candidates from whom it has received deposits of $1.5 mln, we believe the more interesting stats are: (i) management’s confidence in its ability to refresh the franchisee pool, (ii) that approximately 50% of the interest is coming from existing franchisees (speaking to increased brand resonance supporting underlying restaurant performance), and (iii) that new franchisees (or franchisee investor groups) must include a seasoned operator with a minimum 10% equity interest in the venture.
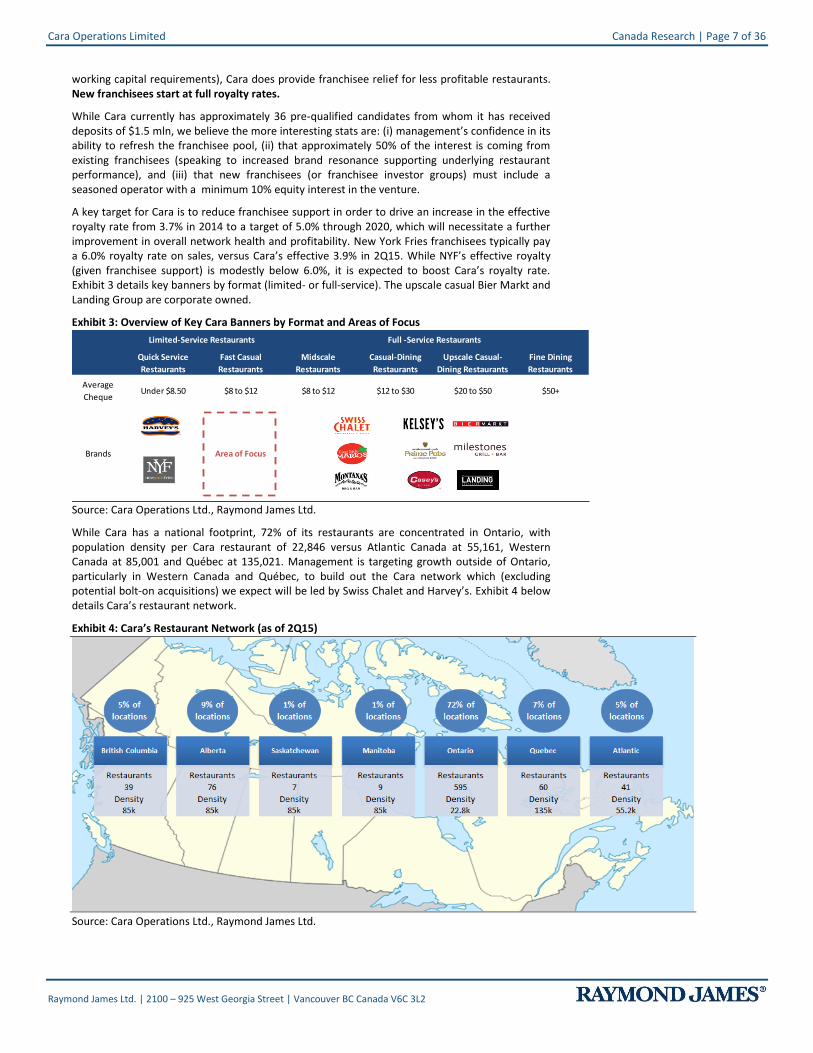
A key target for Cara is to reduce franchisee support in order to drive an increase in the effective royalty rate from 3.7% in 2014 to a target of 5.0% through 2020, which will necessitate a further improvement in overall network health and profitability. New York Fries franchisees typically pay a 6.0% royalty rate on sales, versus Cara’s effective 3.9% in 2Q15. While NYF’s effective royalty (given franchisee support) is modestly below 6.0%, it is expected to boost Cara’s royalty rate. Exhibit 3 details key banners by format (limited- or full-service). The upscale casual Bier Markt and Landing Group are corporate owned.
Exhibit 3: Overview of Key Cara Banners by Format and Areas of Focus
Average
ChequeUnder $8.50 $8 to $12 $8 to $12 $12 to $30 $20 to $50 $50+
Brands Area of Focus
Limited-Service Restaurants
Quick Service
Restaurants
Fast Casual
Restaurants
Full -Service Restaurants
Midscale
Restaurants
Casual-Dining
Restaurants
Upscale Casual-
Dining Restaurants
Fine Dining
Restaurants
Source: Cara Operations Ltd., Raymond James Ltd.
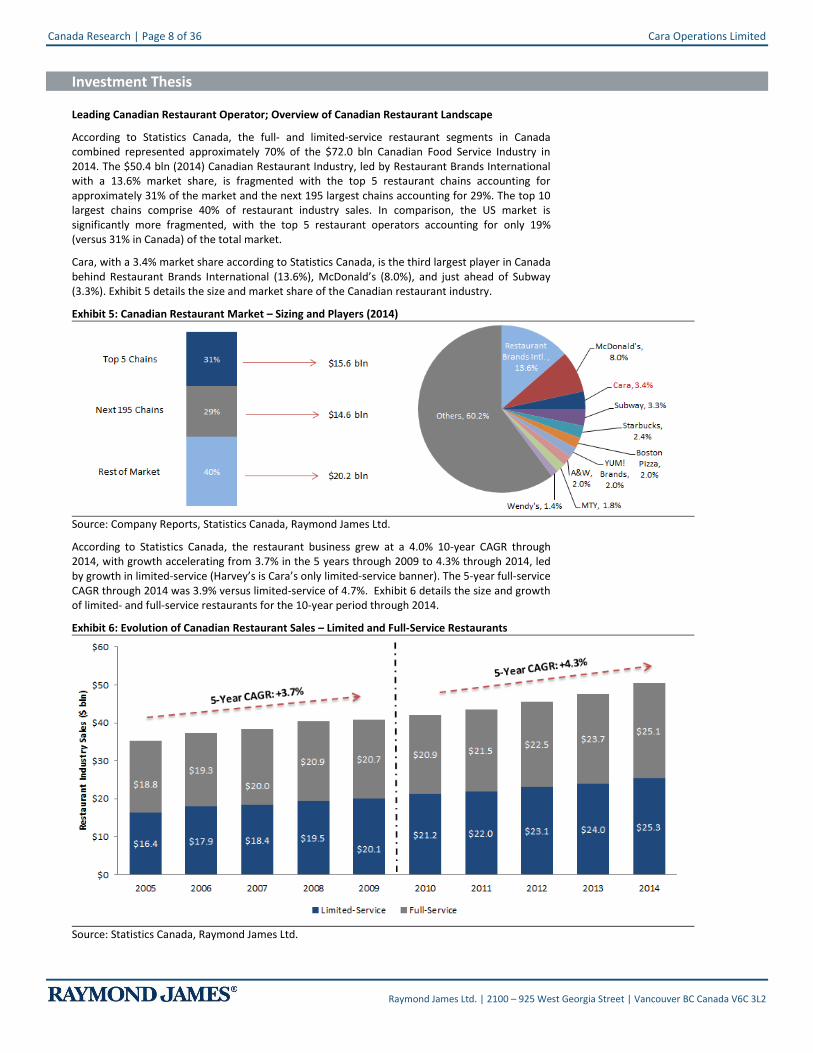
While Cara has a national footprint, 72% of its restaurants are concentrated in Ontario, with population density per Cara restaurant of 22,846 versus Atlantic Canada at 55,161, Western Canada at 85,001 and Québec at 135,021. Management is targeting growth outside of Ontario, particularly in Western Canada and Québec, to build out the Cara network which (excluding potential bolt-on acquisitions) we expect will be led by Swiss Chalet and Harvey’s. Exhibit 4 below details Cara’s restaurant network.
Exhibit 4: Cara’s Restaurant Network (as of 2Q15)
Source: Cara Operations Ltd., Raymond James Ltd.
Canada Research | Page 8 of 36 Cara Operations Limited
Raymond James Ltd. | 2100 – 925 West Georgia Street | Vancouver BC Canada V6C 3L2
Investment Thesis
Leading Canadian Restaurant Operator; Overview of Canadian Restaurant Landscape
According to Statistics Canada, the full- and limited-service restaurant segments in Canada combined represented approximately 70% of the $72.0 bln Canadian Food Service Industry in 2014. The $50.4 bln (2014) Canadian Restaurant Industry, led by Restaurant Brands International with a 13.6% market share, is fragmented with the top 5 restaurant chains accounting for approximately 31% of the market and the next 195 largest chains accounting for 29%. The top 10 largest chains comprise 40% of restaurant industry sales. In comparison, the US market is significantly more fragmented, with the top 5 restaurant operators accounting for only 19% (versus 31% in Canada) of the total market.
Cara, with a 3.4% market share according to Statistics Canada, is the third largest player in Canada behind Restaurant Brands International (13.6%), McDonald’s (8.0%), and just ahead of Subway (3.3%). Exhibit 5 details the size and market share of the Canadian restaurant industry.
Exhibit 5: Canadian Restaurant Market – Sizing and Players (2014)
Source: Company Reports, Statistics Canada, Raymond James Ltd.
According to Statistics Canada, the restaurant business grew at a 4.0% 10-year CAGR through 2014, with growth accelerating from 3.7% in the 5 years through 2009 to 4.3% through 2014, led by growth in limited-service (Harvey’s is Cara’s only limited-service banner). The 5-year full-service CAGR through 2014 was 3.9% versus limited-service of 4.7%. Exhibit 6 details the size and growth of limited- and full-service restaurants for the 10-year period through 2014.
Exhibit 6: Evolution of Canadian Restaurant Sales – Limited and Full-Service Restaurants
Source: Statistics Canada, Raymond James Ltd.
Cara Operations Limited Canada Research | Page 9 of 36
Raymond James Ltd. | 2100 – 925 West Georgia Street | Vancouver BC Canada V6C 3L2
In the 10-year period through 2014, the correlation between real GDP and full-service restaurant sales was a strong 0.6, with limited-service (lower average cheque) restaurants necessarily faring better in periods of economic weakness. In limited-service restaurants, the average cheque is under $8.50 versus full-service where the average cheque is in the range of $8.00 to $50.00. In the last 10 years, full-service restaurant sales have only decreased in one year (2009), while limited-service restaurant sales have not experienced a sales decline in any year. Between 2006-2008, both full-service and limited-service restaurant sales were robust, growing at CAGRs of 3.8% and 4.4%, respectively, which slowed through 2010 (the recession and early recovery) to 4.3% and 0.2%. The full-service pendulum swung as the recovery gathered momentum, with a robust 4.6% CAGR in the 2010-2014 period (versus 4.5% at limited-service restaurants).
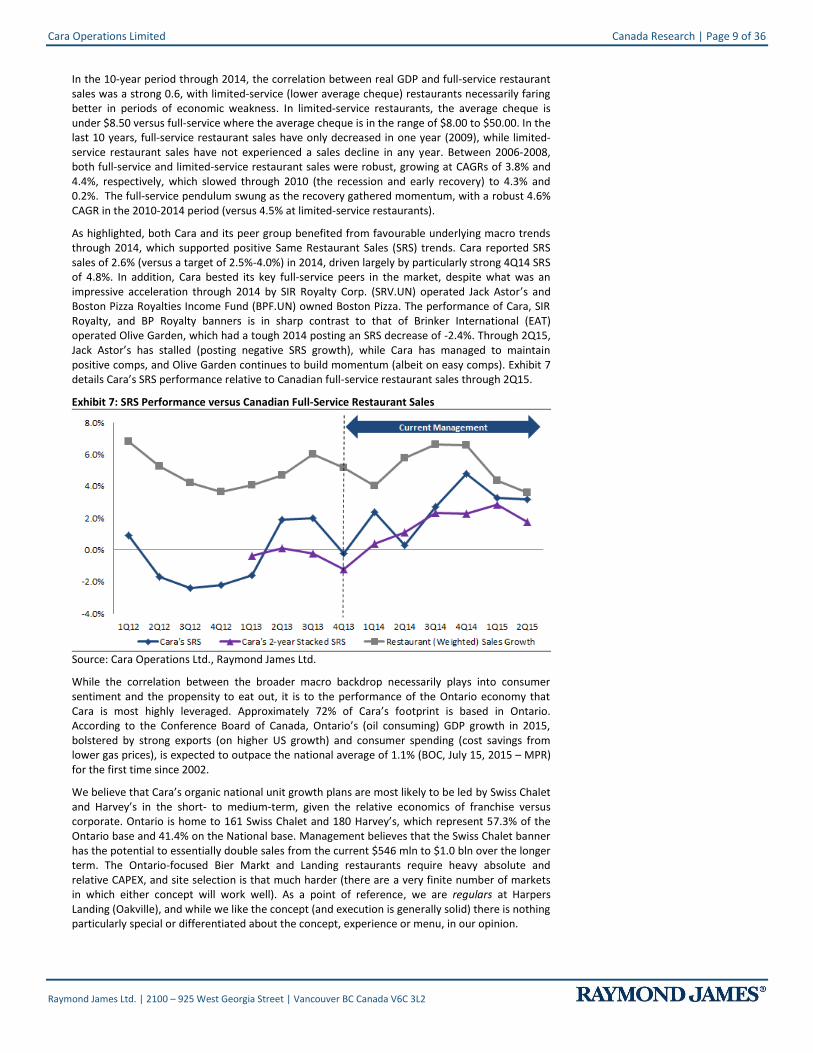
As highlighted, both Cara and its peer group benefited from favourable underlying macro trends through 2014, which supported positive Same Restaurant Sales (SRS) trends. Cara reported SRS sales of 2.6% (versus a target of 2.5%-4.0%) in 2014, driven largely by particularly strong 4Q14 SRS of 4.8%. In addition, Cara bested its key full-service peers in the market, despite what was an impressive acceleration through 2014 by SIR Royalty Corp. (SRV.UN) operated Jack Astor’s and Boston Pizza Royalties Income Fund (BPF.UN) owned Boston Pizza. The performance of Cara, SIR Royalty, and BP Royalty banners is in sharp contrast to that of Brinker International (EAT) operated Olive Garden, which had a tough 2014 posting an SRS decrease of -2.4%. Through 2Q15, Jack Astor’s has stalled (posting negative SRS growth), while Cara has managed to maintain positive comps, and Olive Garden continues to build momentum (albeit on easy comps). Exhibit 7 details Cara’s SRS performance relative to Canadian full-service restaurant sales through 2Q15.
Exhibit 7: SRS Performance versus Canadian Full-Service Restaurant Sales
Source: Cara Operations Ltd., Raymond James Ltd.
While the correlation between the broader macro backdrop necessarily plays into consumer sentiment and the propensity to eat out, it is to the performance of the Ontario economy that Cara is most highly leveraged. Approximately 72% of Cara’s footprint is based in Ontario. According to the Conference Board of Canada, Ontario’s (oil consuming) GDP growth in 2015, bolstered by strong exports (on higher US growth) and consumer spending (cost savings from lower gas prices), is expected to outpace the national average of 1.1% (BOC, July 15, 2015 – MPR) for the first time since 2002.
We believe that Cara’s organic national unit growth plans are most likely to be led by Swiss Chalet and Harvey’s in the short- to medium-term, given the relative economics of franchise versus corporate. Ontario is home to 161 Swiss Chalet and 180 Harvey’s, which represent 57.3% of the Ontario base and 41.4% on the National base. Management believes that the Swiss Chalet banner has the potential to essentially double sales from the current $546 mln to $1.0 bln over the longer term. The Ontario-focused Bier Markt and Landing restaurants require heavy absolute and relative CAPEX, and site selection is that much harder (there are a very finite number of markets in which either concept will work well). As a point of reference, we are regulars at Harpers Landing (Oakville), and while we like the concept (and execution is generally solid) there is nothing particularly special or differentiated about the concept, experience or menu, in our opinion.
Canada Research | Page 10 of 36 Cara Operations Limited
Raymond James Ltd. | 2100 – 925 West Georgia Street | Vancouver BC Canada V6C 3L2
Franchise Model – Asset Light, FCF Heavy
Cara’s transformation into a pure play restaurant operator began in 2004 with its privatization (resulting in leverage of 3.7x EBITDA at the time of its privatization) by the Phelan family, subsequent to which (i) a number of non-core (non-restaurant) assets were divested, and (ii) Cara began the transformation to a largely franchise-driven business model.
The divested assets included the airline catering and logistics business (Cara Airport Services), the food service distribution business (Summit), the air terminal restaurants (ATR), the specialty coffee business (Second Cup) and select restaurant banners (Outback). The proceeds from the divestitures were not used to pay down debt, but to further invest in the business, resulting in a higher cost base (new head office, new data centre, new stores). The financial crisis exacerbated the challenges and by 2012 debt-to-EBITDA was 7.1x.
Prior to its privatization in 2004, Cara’s model was 58% franchised versus 89% today. The capital-light business model shifts CAPEX (and operating costs) to franchisees, generating both strong FCF and ROE metrics, and lends itself to both organic (and acquisition) driven network growth (with attractive peer group relative economics).
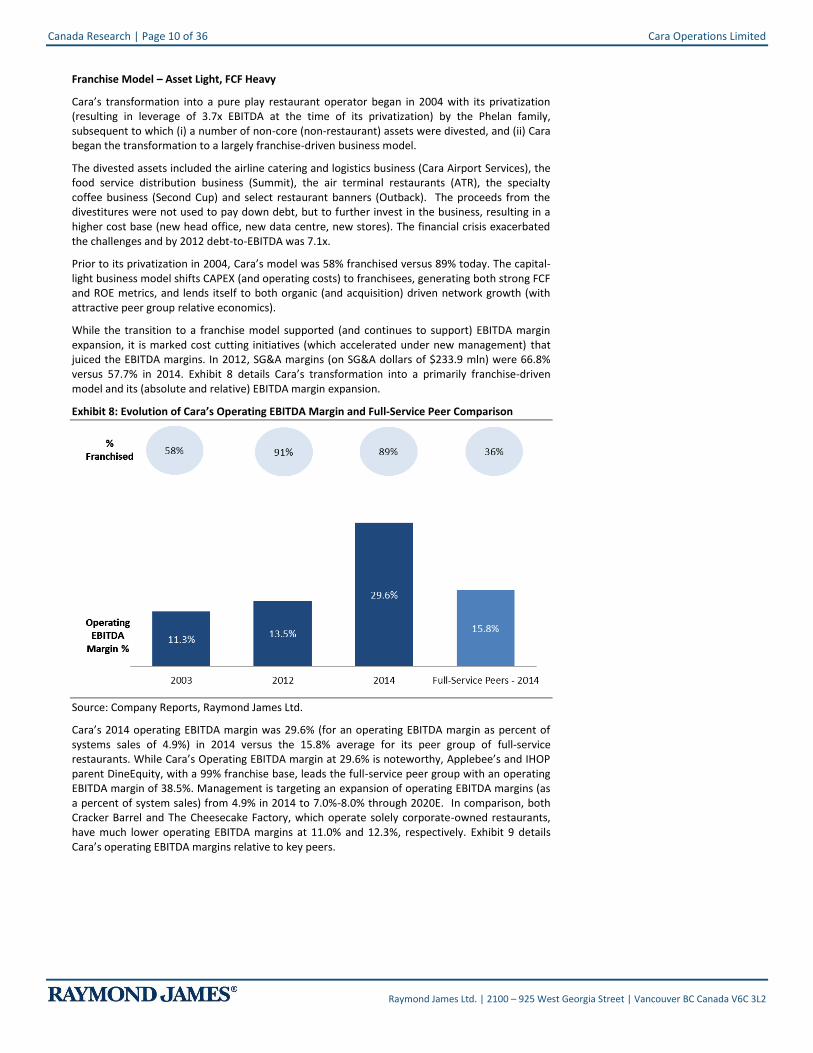
While the transition to a franchise model supported (and continues to support) EBITDA margin expansion, it is marked cost cutting initiatives (which accelerated under new management) that juiced the EBITDA margins. In 2012, SG&A margins (on SG&A dollars of $233.9 mln) were 66.8% versus 57.7% in 2014. Exhibit 8 details Cara’s transformation into a primarily franchise-driven model and its (absolute and relative) EBITDA margin expansion.
Exhibit 8: Evolution of Cara’s Operating EBITDA Margin and Full-Service Peer Comparison
Source: Company Reports, Raymond James Ltd.
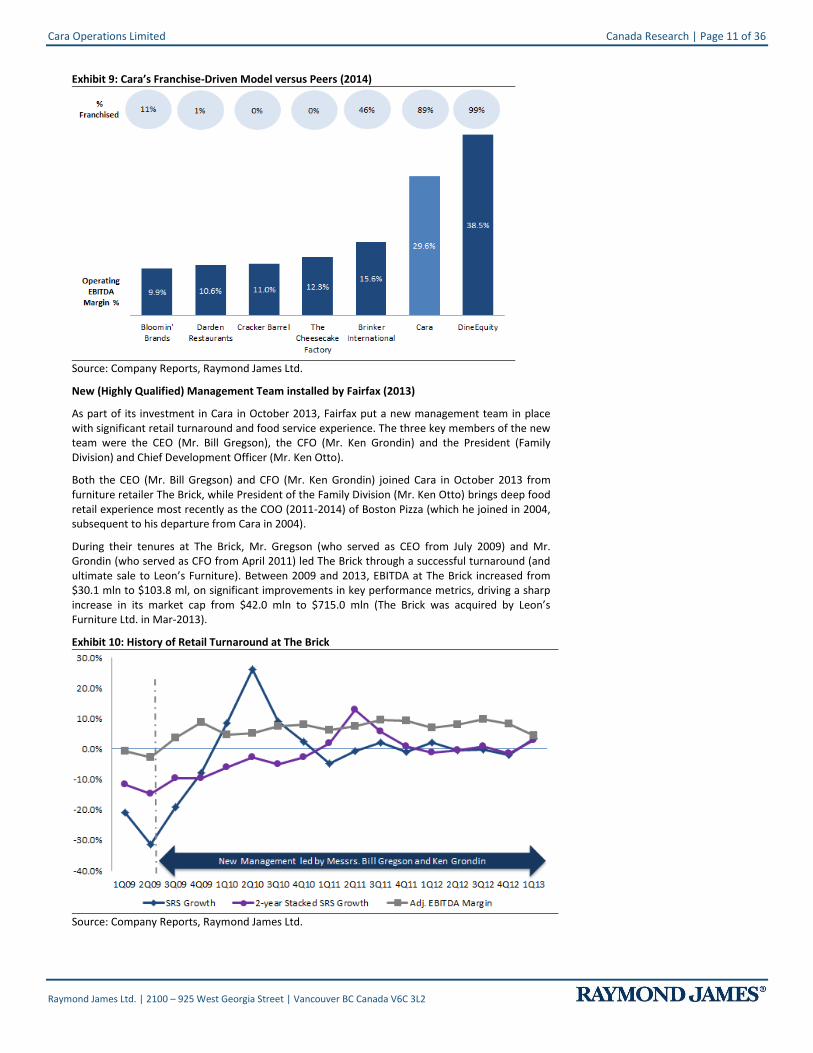
Cara’s 2014 operating EBITDA margin was 29.6% (for an operating EBITDA margin as percent of systems sales of 4.9%) in 2014 versus the 15.8% average for its peer group of full-service restaurants. While Cara’s Operating EBITDA margin at 29.6% is noteworthy, Applebee’s and IHOP parent DineEquity, with a 99% franchise base, leads the full-service peer group with an operating EBITDA margin of 38.5%. Management is targeting an expansion of operating EBITDA margins (as a percent of system sales) from 4.9% in 2014 to 7.0%-8.0% through 2020E. In comparison, both Cracker Barrel and The Cheesecake Factory, which operate solely corporate-owned restaurants, have much lower operating EBITDA margins at 11.0% and 12.3%, respectively. Exhibit 9 details Cara’s operating EBITDA margins relative to key peers.
Cara Operations Limited Canada Research | Page 11 of 36
Raymond James Ltd. | 2100 – 925 West Georgia Street | Vancouver BC Canada V6C 3L2
Exhibit 9: Cara’s Franchise-Driven Model versus Peers (2014)
Source: Company Reports, Raymond James Ltd.
New (Highly Qualified) Management Team installed by Fairfax (2013)
As part of its investment in Cara in October 2013, Fairfax put a new management team in place with significant retail turnaround and food service experience. The three key members of the new team were the CEO (Mr. Bill Gregson), the CFO (Mr. Ken Grondin) and the President (Family Division) and Chief Development Officer (Mr. Ken Otto).
Both the CEO (Mr. Bill Gregson) and CFO (Mr. Ken Grondin) joined Cara in October 2013 from furniture retailer The Brick, while President of the Family Division (Mr. Ken Otto) brings deep food retail experience most recently as the COO (2011-2014) of Boston Pizza (which he joined in 2004, subsequent to his departure from Cara in 2004).
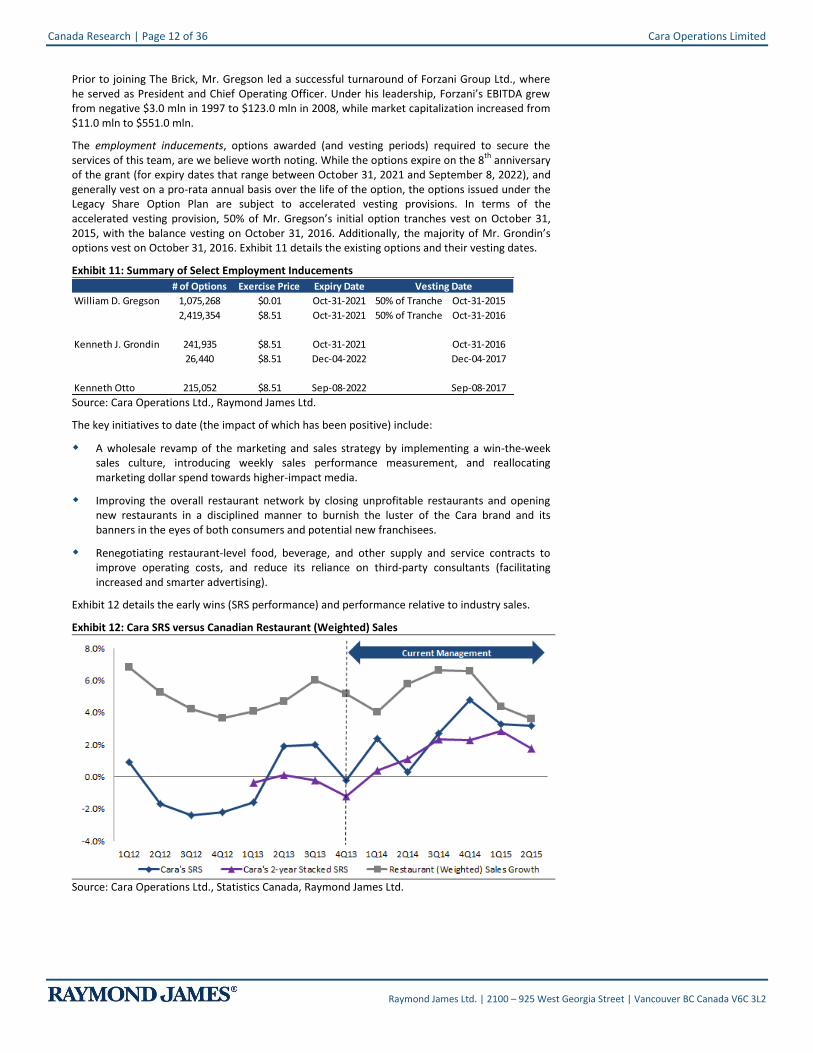
During their tenures at The Brick, Mr. Gregson (who served as CEO from July 2009) and Mr. Grondin (who served as CFO from April 2011) led The Brick through a successful turnaround (and ultimate sale to Leon’s Furniture). Between 2009 and 2013, EBITDA at The Brick increased from $30.1 mln to $103.8 ml, on significant improvements in key performance metrics, driving a sharp increase in its market cap from $42.0 mln to $715.0 mln (The Brick was acquired by Leon’s Furniture Ltd. in Mar-2013).
Exhibit 10: History of Retail Turnaround at The Brick
Source: Company Reports, Raymond James Ltd.
Canada Research | Page 12 of 36 Cara Operations Limited
Raymond James Ltd. | 2100 – 925 West Georgia Street | Vancouver BC Canada V6C 3L2
Prior to joining The Brick, Mr. Gregson led a successful turnaround of Forzani Group Ltd., where he served as President and Chief Operating Officer. Under his leadership, Forzani’s EBITDA grew from negative $3.0 mln in 1997 to $123.0 mln in 2008, while market capitalization increased from $11.0 mln to $551.0 mln.
The employment inducements, options awarded (and vesting periods) required to secure the services of this team, are we believe worth noting. While the options expire on the 8
th anniversary
of the grant (for expiry dates that range between October 31, 2021 and September 8, 2022), and generally vest on a pro-rata annual basis over the life of the option, the options issued under the Legacy Share Option Plan are subject to accelerated vesting provisions. In terms of the accelerated vesting provision, 50% of Mr. Gregson’s initial option tranches vest on October 31, 2015, with the balance vesting on October 31, 2016. Additionally, the majority of Mr. Grondin’s options vest on October 31, 2016. Exhibit 11 details the existing options and their vesting dates.
Exhibit 11: Summary of Select Employment Inducements
# of Options Exercise Price Expiry Date
William D. Gregson 1,075,268 $0.01 Oct-31-2021 50% of Tranche Oct-31-2015
2,419,354 $8.51 Oct-31-2021 50% of Tranche Oct-31-2016
Kenneth J. Grondin 241,935 $8.51 Oct-31-2021 Oct-31-2016
26,440 $8.51 Dec-04-2022 Dec-04-2017
Kenneth Otto 215,052 $8.51 Sep-08-2022 Sep-08-2017
Vesting Date
Source: Cara Operations Ltd., Raymond James Ltd.
The key initiatives to date (the impact of which has been positive) include:
A wholesale revamp of the marketing and sales strategy by implementing a win-the-week sales culture, introducing weekly sales performance measurement, and reallocating marketing dollar spend towards higher-impact media.
Improving the overall restaurant network by closing unprofitable restaurants and opening new restaurants in a disciplined manner to burnish the luster of the Cara brand and its banners in the eyes of both consumers and potential new franchisees.
Renegotiating restaurant-level food, beverage, and other supply and service contracts to improve operating costs, and reduce its reliance on third-party consultants (facilitating increased and smarter advertising).
Exhibit 12 details the early wins (SRS performance) and performance relative to industry sales.
Exhibit 12: Cara SRS versus Canadian Restaurant (Weighted) Sales
Source: Cara Operations Ltd., Statistics Canada, Raymond James Ltd.
Cara Operations Limited Canada Research | Page 13 of 36
Raymond James Ltd. | 2100 – 925 West Georgia Street | Vancouver BC Canada V6C 3L2
The Team’s (Turnaround) Targets
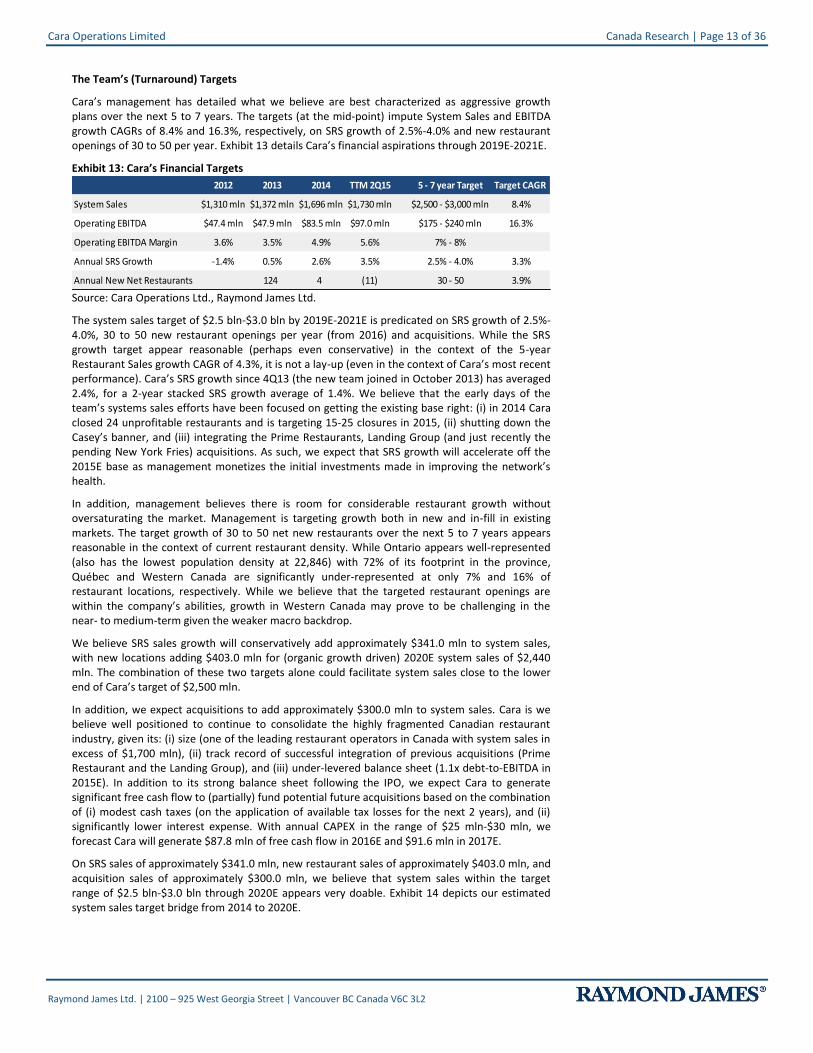
Cara’s management has detailed what we believe are best characterized as aggressive growth plans over the next 5 to 7 years. The targets (at the mid-point) impute System Sales and EBITDA growth CAGRs of 8.4% and 16.3%, respectively, on SRS growth of 2.5%-4.0% and new restaurant openings of 30 to 50 per year. Exhibit 13 details Cara’s financial aspirations through 2019E-2021E.
Exhibit 13: Cara’s Financial Targets
2012 2013 2014 TTM 2Q15 5 - 7 year Target Target CAGR
System Sales $1,310 mln $1,372 mln $1,696 mln $1,730 mln $2,500 - $3,000 mln 8.4%
Operating EBITDA $47.4 mln $47.9 mln $83.5 mln $97.0 mln $175 - $240 mln 16.3%
Operating EBITDA Margin 3.6% 3.5% 4.9% 5.6% 7% - 8%
Annual SRS Growth -1.4% 0.5% 2.6% 3.5% 2.5% - 4.0% 3.3%
Annual New Net Restaurants 124 4 (11) 30 - 50 3.9%
Source: Cara Operations Ltd., Raymond James Ltd.
The system sales target of $2.5 bln-$3.0 bln by 2019E-2021E is predicated on SRS growth of 2.5%-4.0%, 30 to 50 new restaurant openings per year (from 2016) and acquisitions. While the SRS growth target appear reasonable (perhaps even conservative) in the context of the 5-year Restaurant Sales growth CAGR of 4.3%, it is not a lay-up (even in the context of Cara’s most recent performance). Cara’s SRS growth since 4Q13 (the new team joined in October 2013) has averaged 2.4%, for a 2-year stacked SRS growth average of 1.4%. We believe that the early days of the team’s systems sales efforts have been focused on getting the existing base right: (i) in 2014 Cara closed 24 unprofitable restaurants and is targeting 15-25 closures in 2015, (ii) shutting down the Casey’s banner, and (iii) integrating the Prime Restaurants, Landing Group (and just recently the pending New York Fries) acquisitions. As such, we expect that SRS growth will accelerate off the 2015E base as management monetizes the initial investments made in improving the network’s health.
In addition, management believes there is room for considerable restaurant growth without oversaturating the market. Management is targeting growth both in new and in-fill in existing markets. The target growth of 30 to 50 net new restaurants over the next 5 to 7 years appears reasonable in the context of current restaurant density. While Ontario appears well-represented (also has the lowest population density at 22,846) with 72% of its footprint in the province, Québec and Western Canada are significantly under-represented at only 7% and 16% of restaurant locations, respectively. While we believe that the targeted restaurant openings are within the company’s abilities, growth in Western Canada may prove to be challenging in the near- to medium-term given the weaker macro backdrop.
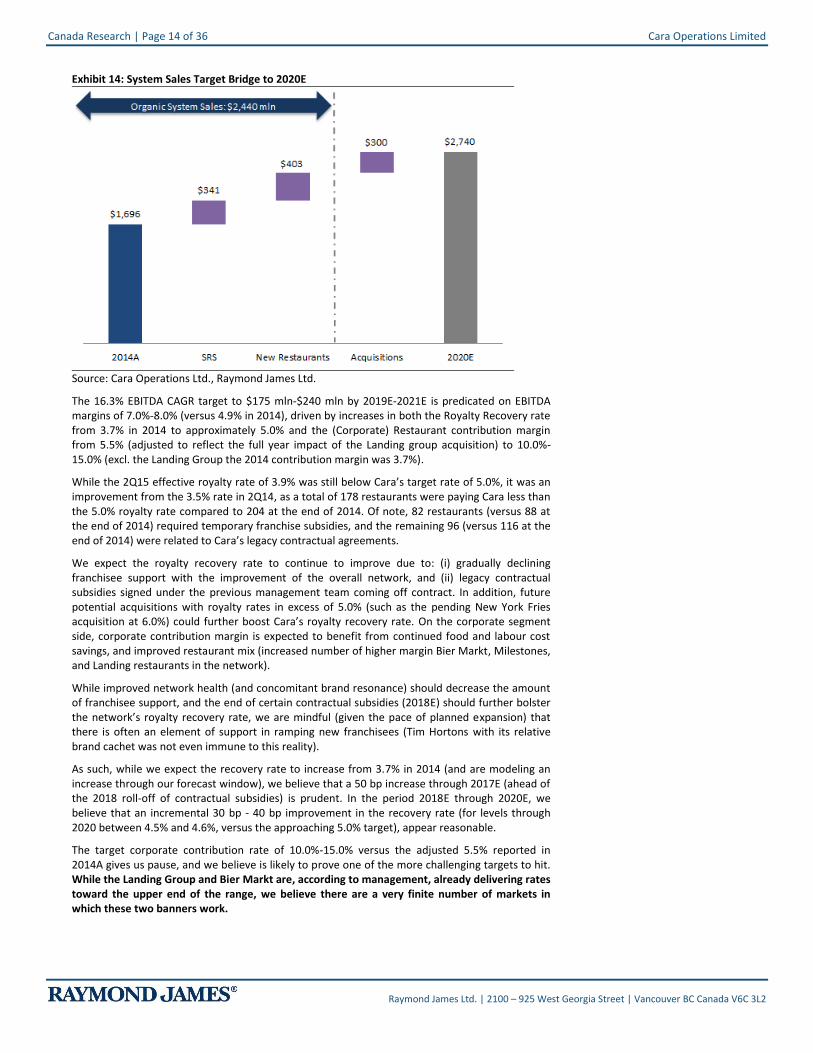
We believe SRS sales growth will conservatively add approximately $341.0 mln to system sales, with new locations adding $403.0 mln for (organic growth driven) 2020E system sales of $2,440 mln. The combination of these two targets alone could facilitate system sales close to the lower end of Cara’s target of $2,500 mln.
In addition, we expect acquisitions to add approximately $300.0 mln to system sales. Cara is we believe well positioned to continue to consolidate the highly fragmented Canadian restaurant industry, given its: (i) size (one of the leading restaurant operators in Canada with system sales in excess of $1,700 mln), (ii) track record of successful integration of previous acquisitions (Prime Restaurant and the Landing Group), and (iii) under-levered balance sheet (1.1x debt-to-EBITDA in 2015E). In addition to its strong balance sheet following the IPO, we expect Cara to generate significant free cash flow to (partially) fund potential future acquisitions based on the combination of (i) modest cash taxes (on the application of available tax losses for the next 2 years), and (ii) significantly lower interest expense. With annual CAPEX in the range of $25 mln-$30 mln, we forecast Cara will generate $87.8 mln of free cash flow in 2016E and $91.6 mln in 2017E.
On SRS sales of approximately $341.0 mln, new restaurant sales of approximately $403.0 mln, and acquisition sales of approximately $300.0 mln, we believe that system sales within the target range of $2.5 bln-$3.0 bln through 2020E appears very doable. Exhibit 14 depicts our estimated system sales target bridge from 2014 to 2020E.
Canada Research | Page 14 of 36 Cara Operations Limited
Raymond James Ltd. | 2100 – 925 West Georgia Street | Vancouver BC Canada V6C 3L2
Exhibit 14: System Sales Target Bridge to 2020E
Source: Cara Operations Ltd., Raymond James Ltd.
The 16.3% EBITDA CAGR target to $175 mln-$240 mln by 2019E-2021E is predicated on EBITDA margins of 7.0%-8.0% (versus 4.9% in 2014), driven by increases in both the Royalty Recovery rate from 3.7% in 2014 to approximately 5.0% and the (Corporate) Restaurant contribution margin from 5.5% (adjusted to reflect the full year impact of the Landing group acquisition) to 10.0%-15.0% (excl. the Landing Group the 2014 contribution margin was 3.7%).
While the 2Q15 effective royalty rate of 3.9% was still below Cara’s target rate of 5.0%, it was an improvement from the 3.5% rate in 2Q14, as a total of 178 restaurants were paying Cara less than the 5.0% royalty rate compared to 204 at the end of 2014. Of note, 82 restaurants (versus 88 at the end of 2014) required temporary franchise subsidies, and the remaining 96 (versus 116 at the end of 2014) were related to Cara’s legacy contractual agreements.
We expect the royalty recovery rate to continue to improve due to: (i) gradually declining franchisee support with the improvement of the overall network, and (ii) legacy contractual subsidies signed under the previous management team coming off contract. In addition, future potential acquisitions with royalty rates in excess of 5.0% (such as the pending New York Fries acquisition at 6.0%) could further boost Cara’s royalty recovery rate. On the corporate segment side, corporate contribution margin is expected to benefit from continued food and labour cost savings, and improved restaurant mix (increased number of higher margin Bier Markt, Milestones, and Landing restaurants in the network).
While improved network health (and concomitant brand resonance) should decrease the amount of franchisee support, and the end of certain contractual subsidies (2018E) should further bolster the network’s royalty recovery rate, we are mindful (given the pace of planned expansion) that there is often an element of support in ramping new franchisees (Tim Hortons with its relative brand cachet was not even immune to this reality).
As such, while we expect the recovery rate to increase from 3.7% in 2014 (and are modeling an increase through our forecast window), we believe that a 50 bp increase through 2017E (ahead of the 2018 roll-off of contractual subsidies) is prudent. In the period 2018E through 2020E, we believe that an incremental 30 bp - 40 bp improvement in the recovery rate (for levels through 2020 between 4.5% and 4.6%, versus the approaching 5.0% target), appear reasonable.
The target corporate contribution rate of 10.0%-15.0% versus the adjusted 5.5% reported in 2014A gives us pause, and we believe is likely to prove one of the more challenging targets to hit. While the Landing Group and Bier Markt are, according to management, already delivering rates toward the upper end of the range, we believe there are a very finite number of markets in which these two banners work.
Cara Operations Limited Canada Research | Page 15 of 36
Raymond James Ltd. | 2100 – 925 West Georgia Street | Vancouver BC Canada V6C 3L2
In addition, squeezing the underperforming banners (given the Milestones and Kelsey’s heavy 2014 contribution rate excluding the Landing Group of 3.7%) is not without material risk, given both the competitive and brand positioning of these banners within the market. The adjusted 2014 contribution rate including the Landing Group was 5.5%. The reality is that while staffing and food costs are the two biggest cost containment levers, they are also the most sensitive. In the restaurant business (and particularly given the plethora of choices in the highly fragmented Canadian restaurant industry), any noticeable deterioration in either the food quality or service experience will relatively quickly impact traffic (and chatter). These things matter (hugely), and there is a higher cost (and sensitivity) to diluting the dining experience, versus the retail experience.
While we are mindful that if there is a team in the restaurant business that could pull off what we characterize as a fine line balancing act, this is the team. We believe that in order to hit the SRS target growth of 2.5%-4.0% contribution rates will be closer to the low end (10%) of the 10.0%-15.0% target range through 2020E.
The Landing Group and Bier Markt’s key competitors (who also dominate the segment in the key Western Canadian market) are the Fuller brothers-owned Earls, Joey and Saltlik chains (the Fuller family retains an interest in Cactus Club, with co-founder Richard Jaffray) and the Gaglardi family-owned Moxie’s chain (Milestones was previously owned by the Gaglardi family). Mr. Stan Fuller (CEO of Earls Restaurants) was on record stating that Ontario is a major thrust and that the problem is now finding premium locations with the right landlords. We lived in Vancouver for a number of years and are intimately familiar with Cactus Club (but have also spent more than our fair share of time and dollars at Joey’s and Earls).
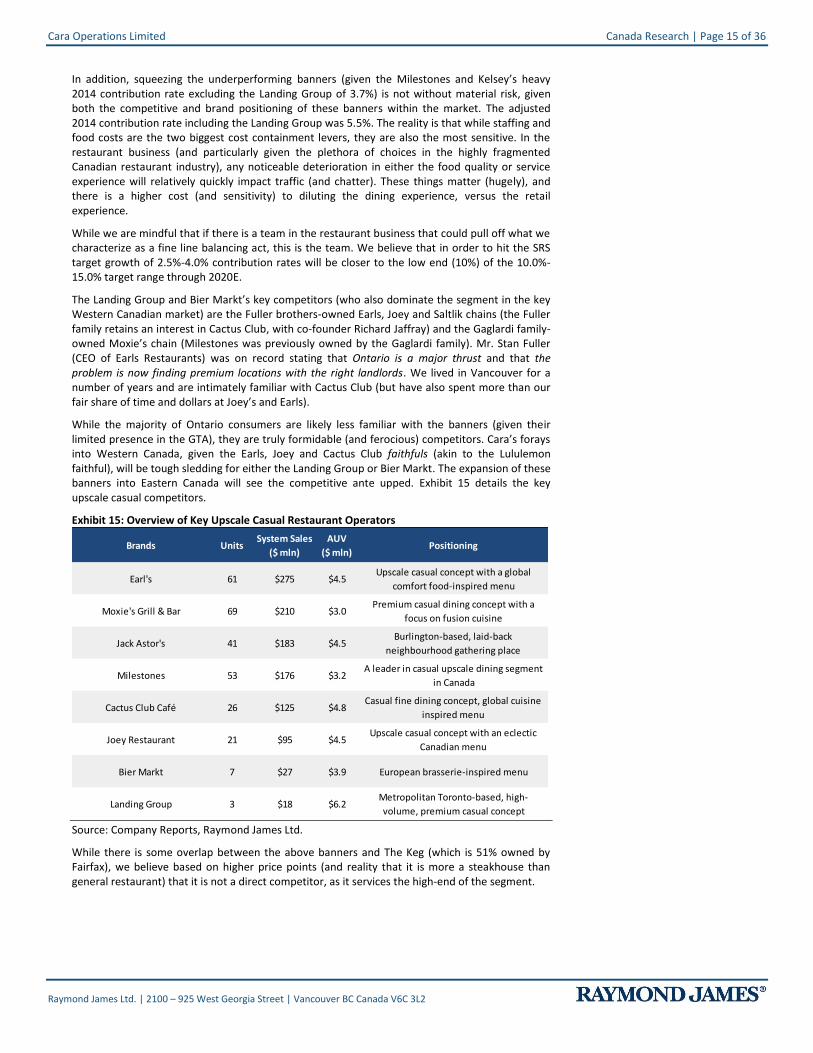
While the majority of Ontario consumers are likely less familiar with the banners (given their limited presence in the GTA), they are truly formidable (and ferocious) competitors. Cara’s forays into Western Canada, given the Earls, Joey and Cactus Club faithfuls (akin to the Lululemon faithful), will be tough sledding for either the Landing Group or Bier Markt. The expansion of these banners into Eastern Canada will see the competitive ante upped. Exhibit 15 details the key upscale casual competitors.
Exhibit 15: Overview of Key Upscale Casual Restaurant Operators
Brands UnitsSystem Sales
($ mln)
AUV
($ mln)Positioning
Earl's 61 $275 $4.5Upscale casual concept with a global
comfort food-inspired menu
Moxie's Grill & Bar 69 $210 $3.0Premium casual dining concept with a
focus on fusion cuisine
Jack Astor's 41 $183 $4.5Burlington-based, laid-back
neighbourhood gathering place
Milestones 53 $176 $3.2A leader in casual upscale dining segment
in Canada
Cactus Club Café 26 $125 $4.8Casual fine dining concept, global cuisine
inspired menu
Joey Restaurant 21 $95 $4.5Upscale casual concept with an eclectic
Canadian menu
Bier Markt 7 $27 $3.9 European brasserie-inspired menu
Landing Group 3 $18 $6.2Metropolitan Toronto-based, high-
volume, premium casual concept Source: Company Reports, Raymond James Ltd.
While there is some overlap between the above banners and The Keg (which is 51% owned by Fairfax), we believe based on higher price points (and reality that it is more a steakhouse than general restaurant) that it is not a direct competitor, as it services the high-end of the segment.
Canada Research | Page 16 of 36 Cara Operations Limited
Raymond James Ltd. | 2100 – 925 West Georgia Street | Vancouver BC Canada V6C 3L2
Acquisition Tally, Talk and Targets
With the successful acquisition (and integration) of both Prime Pubs and the Landing Group (and the New York Fries acquisition pending) highlighting management’s integration capabilities, focus necessarily remains on the acquisition opportunity (we estimate that acquisitions will need to add at least $300 mln to system sales through 2020E to achieve targets of $2.5 bln to $3.0 bln). The Prime Pubs (which generated approximately $300 mln systems sales) acquisition for a total of $69.6 mln (net of $3.9 mln long-term debt retired), saw East Side Mario’s, Prime Pubs, and Bier Markt vended into Cara on October 31, 2013, and was followed by the Landing Group acquisition. On December 18, 2014, Cara acquired a 55% interest in the Landing Group (with an option to acquire the remaining 45% on an agreed upon formula through 2018) for $18.3 mln. While the purchase option on the 45% ran through 2018, Cara purchased the remaining 45% on June 26, 2015 on an effective 8.0x EBITDA multiple. On August 31, 2015, Cara announced the acquisition of New York Fries (NYF). NYF has 120 (of which 16 are corporate) locations in Canada and 36 in international markets and generated system sales of approximately $75.0 mln in the last twelve months.
The combination of Cara’s strong balance sheet and the imperative that is a more balanced network (expansion we believe will be concentrated in Western Canada and Québec markets) makes relatively large scale acquisitions a priority. We are hard pressed to believe that any of the upscale casual crown jewels (Earls, Joey, Cactus Club) of Western Canada (or even Moxie’s) would be up for sale (much less on multiples that would be accretive). With growth in Western Canada more likely to be organic, in our view, Québec is the focus market for acquisitions. In Québec, approximately 89% of Cara’s 54 restaurants are Harvey’s. The single Bier Markt restaurant in Québec opened on January 3, 2014 on the old Queue de Cheval site on the corner of René-Lévesque and Drummond.
While we believe that a bolt-on acquisition of the likes of St-Hubert, would bring immediate scale to Cara’s operations in Québec, a series of smaller tuck in acquisitions is equally probable. We believe that chains the likes of Jimmy the Greek (50 restaurants) and Nando’s (29 restaurants) would make for interesting tuck-in acquisitions.
St-Hubert (controlled by the Léger family) has more than 115 locations (94% of which are in Québec) and generated restaurant sales of approximately $405 mln in 2014 (a decrease from its estimated 2010 sales of $420 mln) and retail sales of $285 mln, for total revenues of an estimated $690 mln. While St-Hubert recently went through a challenging time with the resignation of its CEO, Mr. Robert Depatie, on May 13, 2015 after only 3 months on the job (Mr. Depatie resigned as CEO of Québecor on April 28, 2014), there are no indications to date that Mr. Léger would be interested in selling a majority stake.
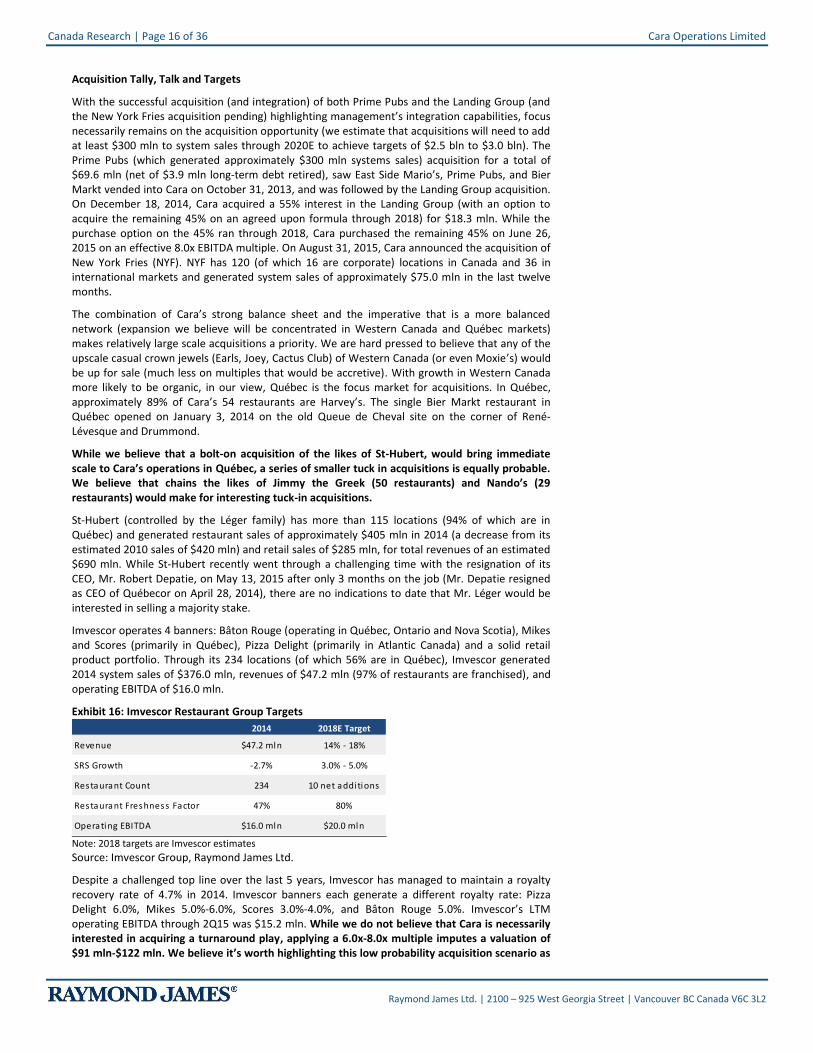
Imvescor operates 4 banners: Bâton Rouge (operating in Québec, Ontario and Nova Scotia), Mikes and Scores (primarily in Québec), Pizza Delight (primarily in Atlantic Canada) and a solid retail product portfolio. Through its 234 locations (of which 56% are in Québec), Imvescor generated 2014 system sales of $376.0 mln, revenues of $47.2 mln (97% of restaurants are franchised), and operating EBITDA of $16.0 mln.
Exhibit 16: Imvescor Restaurant Group Targets
2014 2018E Target
Revenue $47.2 mln 14% - 18%
SRS Growth -2.7% 3.0% - 5.0%
Restaurant Count 234 10 net additions
Restaurant Freshness Factor 47% 80%
Operating EBITDA $16.0 mln $20.0 mln
Note: 2018 targets are Imvescor estimates
Source: Imvescor Group, Raymond James Ltd.
Despite a challenged top line over the last 5 years, Imvescor has managed to maintain a royalty recovery rate of 4.7% in 2014. Imvescor banners each generate a different royalty rate: Pizza Delight 6.0%, Mikes 5.0%-6.0%, Scores 3.0%-4.0%, and Bâton Rouge 5.0%. Imvescor’s LTM operating EBITDA through 2Q15 was $15.2 mln. While we do not believe that Cara is necessarily interested in acquiring a turnaround play, applying a 6.0x-8.0x multiple imputes a valuation of $91 mln-$122 mln. We believe it’s worth highlighting this low probability acquisition scenario as
Cara Operations Limited Canada Research | Page 17 of 36
Raymond James Ltd. | 2100 – 925 West Georgia Street | Vancouver BC Canada V6C 3L2
it is one of a select few public operations whose banners or footprint would be a fit (the majority are privately held).
While SIR Royalty Income Fund (SRV.UN) owns a number of potentially interesting banners (including Jack Astor’s and Canyon Creek), its concentration in Ontario (and the limited fit of other banners in its network for Cara) likely limits its appeal as a potential acquisition target, in our view, despite its attractive 6.0% royalty rate.
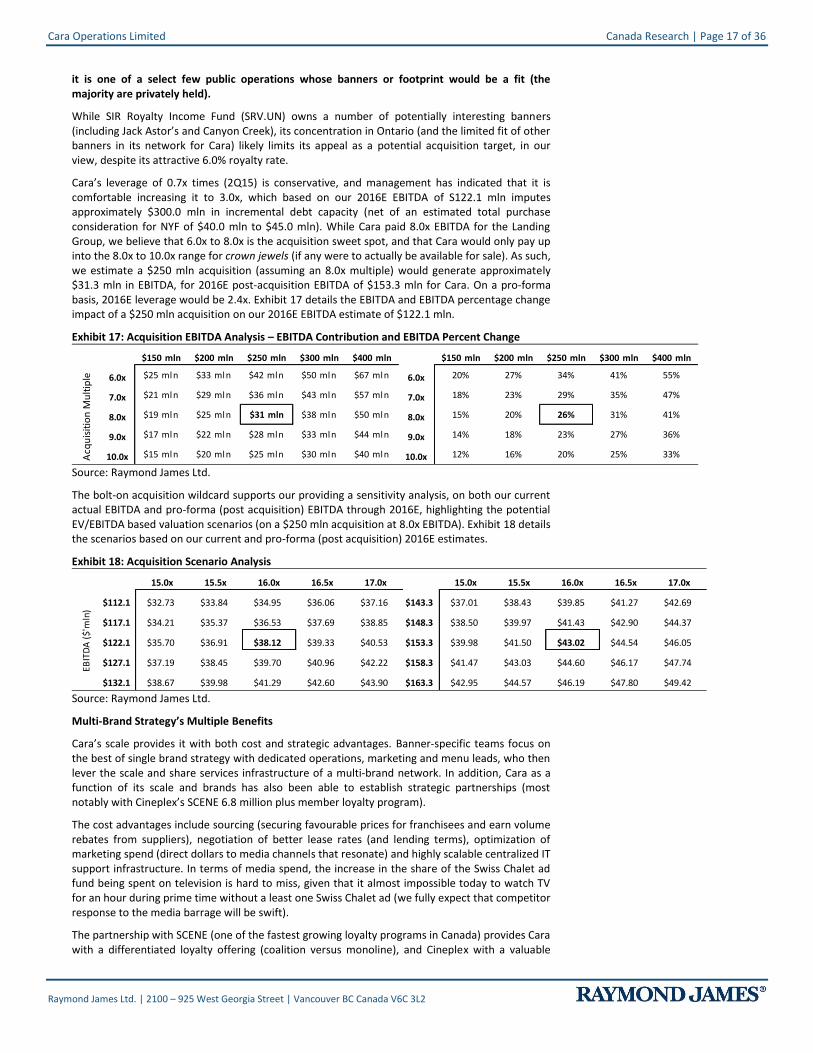
Cara’s leverage of 0.7x times (2Q15) is conservative, and management has indicated that it is comfortable increasing it to 3.0x, which based on our 2016E EBITDA of S122.1 mln imputes approximately $300.0 mln in incremental debt capacity (net of an estimated total purchase consideration for NYF of $40.0 mln to $45.0 mln). While Cara paid 8.0x EBITDA for the Landing Group, we believe that 6.0x to 8.0x is the acquisition sweet spot, and that Cara would only pay up into the 8.0x to 10.0x range for crown jewels (if any were to actually be available for sale). As such, we estimate a $250 mln acquisition (assuming an 8.0x multiple) would generate approximately $31.3 mln in EBITDA, for 2016E post-acquisition EBITDA of $153.3 mln for Cara. On a pro-forma basis, 2016E leverage would be 2.4x. Exhibit 17 details the EBITDA and EBITDA percentage change impact of a $250 mln acquisition on our 2016E EBITDA estimate of $122.1 mln.
Exhibit 17: Acquisition EBITDA Analysis – EBITDA Contribution and EBITDA Percent Change
31.25 $150 mln $200 mln $250 mln $300 mln $400 mln $150 mln $200 mln $250 mln $300 mln $400 mln
6.0x $25 mln $33 mln $42 mln $50 mln $67 mln 6.0x 20% 27% 34% 41% 55%
7.0x $21 mln $29 mln $36 mln $43 mln $57 mln 7.0x 18% 23% 29% 35% 47%
8.0x $19 mln $25 mln $31 mln $38 mln $50 mln 8.0x 15% 20% 26% 31% 41%
9.0x $17 mln $22 mln $28 mln $33 mln $44 mln 9.0x 14% 18% 23% 27% 36%
10.0x $15 mln $20 mln $25 mln $30 mln $40 mln 10.0x 12% 16% 20% 25% 33%Acq
uis
itio
n M
ult
iple
Source: Raymond James Ltd.
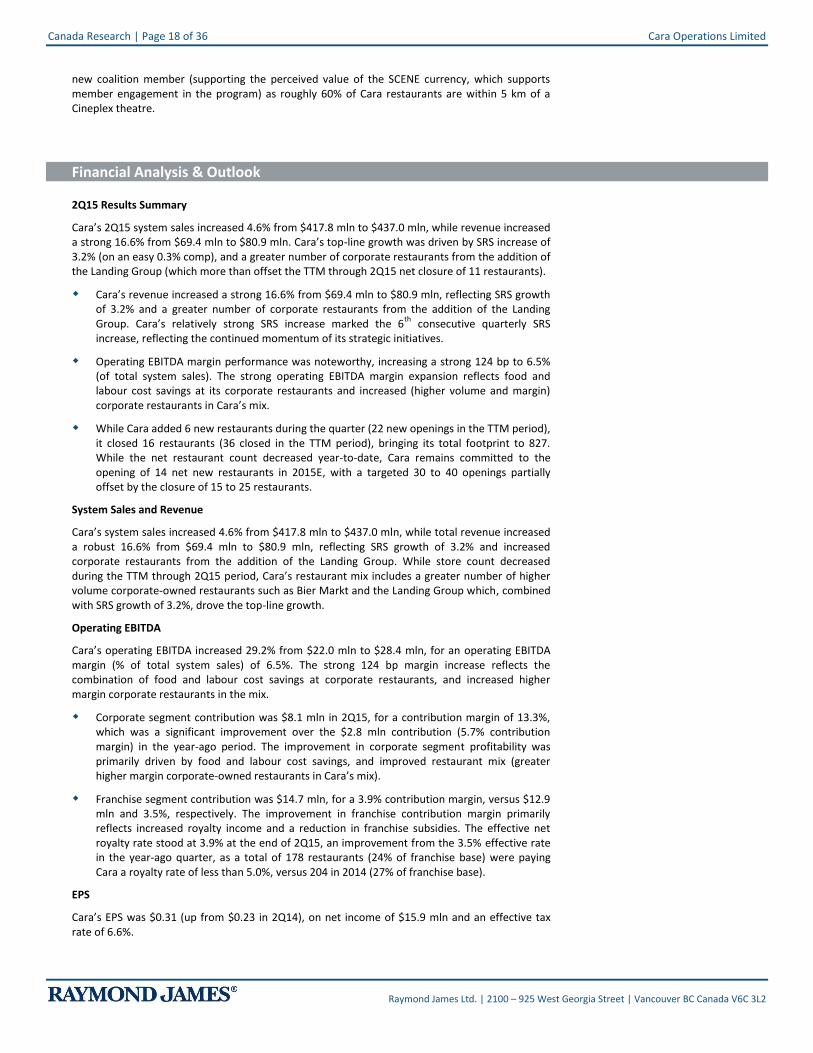
The bolt-on acquisition wildcard supports our providing a sensitivity analysis, on both our current actual EBITDA and pro-forma (post acquisition) EBITDA through 2016E, highlighting the potential EV/EBITDA based valuation scenarios (on a $250 mln acquisition at 8.0x EBITDA). Exhibit 18 details the scenarios based on our current and pro-forma (post acquisition) 2016E estimates.
Exhibit 18: Acquisition Scenario Analysis
##### 15.0x 15.5x 16.0x 16.5x 17.0x ##### 15.0x 15.5x 16.0x 16.5x 17.0x
$112.1 $32.73 $33.84 $34.95 $36.06 $37.16 $143.3 $37.01 $38.43 $39.85 $41.27 $42.69
$117.1 $34.21 $35.37 $36.53 $37.69 $38.85 $148.3 $38.50 $39.97 $41.43 $42.90 $44.37
$122.1 $35.70 $36.91 $38.12 $39.33 $40.53 $153.3 $39.98 $41.50 $43.02 $44.54 $46.05
$127.1 $37.19 $38.45 $39.70 $40.96 $42.22 $158.3 $41.47 $43.03 $44.60 $46.17 $47.74
$132.1 $38.67 $39.98 $41.29 $42.60 $43.90 $163.3 $42.95 $44.57 $46.19 $47.80 $49.42
EBIT
DA
($'
mln
)
Source: Raymond James Ltd.
Multi-Brand Strategy’s Multiple Benefits
Cara’s scale provides it with both cost and strategic advantages. Banner-specific teams focus on the best of single brand strategy with dedicated operations, marketing and menu leads, who then lever the scale and share services infrastructure of a multi-brand network. In addition, Cara as a function of its scale and brands has also been able to establish strategic partnerships (most notably with Cineplex’s SCENE 6.8 million plus member loyalty program).
The cost advantages include sourcing (securing favourable prices for franchisees and earn volume rebates from suppliers), negotiation of better lease rates (and lending terms), optimization of marketing spend (direct dollars to media channels that resonate) and highly scalable centralized IT support infrastructure. In terms of media spend, the increase in the share of the Swiss Chalet ad fund being spent on television is hard to miss, given that it almost impossible today to watch TV for an hour during prime time without a least one Swiss Chalet ad (we fully expect that competitor response to the media barrage will be swift).
The partnership with SCENE (one of the fastest growing loyalty programs in Canada) provides Cara with a differentiated loyalty offering (coalition versus monoline), and Cineplex with a valuable
Canada Research | Page 18 of 36 Cara Operations Limited
Raymond James Ltd. | 2100 – 925 West Georgia Street | Vancouver BC Canada V6C 3L2
new coalition member (supporting the perceived value of the SCENE currency, which supports member engagement in the program) as roughly 60% of Cara restaurants are within 5 km of a Cineplex theatre.
Financial Analysis & Outlook
2Q15 Results Summary
Cara’s 2Q15 system sales increased 4.6% from $417.8 mln to $437.0 mln, while revenue increased a strong 16.6% from $69.4 mln to $80.9 mln. Cara’s top-line growth was driven by SRS increase of 3.2% (on an easy 0.3% comp), and a greater number of corporate restaurants from the addition of the Landing Group (which more than offset the TTM through 2Q15 net closure of 11 restaurants).
Cara’s revenue increased a strong 16.6% from $69.4 mln to $80.9 mln, reflecting SRS growth of 3.2% and a greater number of corporate restaurants from the addition of the Landing Group. Cara’s relatively strong SRS increase marked the 6
th consecutive quarterly SRS
increase, reflecting the continued momentum of its strategic initiatives.
Operating EBITDA margin performance was noteworthy, increasing a strong 124 bp to 6.5% (of total system sales). The strong operating EBITDA margin expansion reflects food and labour cost savings at its corporate restaurants and increased (higher volume and margin) corporate restaurants in Cara’s mix.
While Cara added 6 new restaurants during the quarter (22 new openings in the TTM period), it closed 16 restaurants (36 closed in the TTM period), bringing its total footprint to 827. While the net restaurant count decreased year-to-date, Cara remains committed to the opening of 14 net new restaurants in 2015E, with a targeted 30 to 40 openings partially offset by the closure of 15 to 25 restaurants.
System Sales and Revenue
Cara’s system sales increased 4.6% from $417.8 mln to $437.0 mln, while total revenue increased a robust 16.6% from $69.4 mln to $80.9 mln, reflecting SRS growth of 3.2% and increased corporate restaurants from the addition of the Landing Group. While store count decreased during the TTM through 2Q15 period, Cara’s restaurant mix includes a greater number of higher volume corporate-owned restaurants such as Bier Markt and the Landing Group which, combined with SRS growth of 3.2%, drove the top-line growth.
Operating EBITDA
Cara’s operating EBITDA increased 29.2% from $22.0 mln to $28.4 mln, for an operating EBITDA margin (% of total system sales) of 6.5%. The strong 124 bp margin increase reflects the combination of food and labour cost savings at corporate restaurants, and increased higher margin corporate restaurants in the mix.
Corporate segment contribution was $8.1 mln in 2Q15, for a contribution margin of 13.3%, which was a significant improvement over the $2.8 mln contribution (5.7% contribution margin) in the year-ago period. The improvement in corporate segment profitability was primarily driven by food and labour cost savings, and improved restaurant mix (greater higher margin corporate-owned restaurants in Cara’s mix).
Franchise segment contribution was $14.7 mln, for a 3.9% contribution margin, versus $12.9 mln and 3.5%, respectively. The improvement in franchise contribution margin primarily reflects increased royalty income and a reduction in franchise subsidies. The effective net royalty rate stood at 3.9% at the end of 2Q15, an improvement from the 3.5% effective rate in the year-ago quarter, as a total of 178 restaurants (24% of franchise base) were paying Cara a royalty rate of less than 5.0%, versus 204 in 2014 (27% of franchise base).
EPS
Cara’s EPS was $0.31 (up from $0.23 in 2Q14), on net income of $15.9 mln and an effective tax rate of 6.6%.
Cara Operations Limited Canada Research | Page 19 of 36
Raymond James Ltd. | 2100 – 925 West Georgia Street | Vancouver BC Canada V6C 3L2
Model and Estimates
We expect system sales CAGR of 10.1% from $1,696.0 mln in 2014 to $2,263.1 mln in 2017E, revenue growth of 12.1% from $281.8 mln to $397.3 mln, and operating EBITDA growth of 16.3% from $83.5 mln to $131.3 mln (versus Cara’s targeted system sales and operating EBITDA CAGRs of 8.4% and 16.3%, respectively), as Cara continues to pursue its 5 to 7 year targets.
On system sales growth of 5.2% to $1,784.8 mln, our 2015E revenue is $322.8 mln (growth of 14.6%), for operating EBITDA of $103.6 mln. We expect system sales growth in 2016E to accelerate sharply to 18.9% (system sales of $2,122.8 mln), for revenue of $369.8 mln and operating EBITDA of $122.1 mln. In 2017E, we expect system sales growth of 6.6% for system sales of $2,263.1 mln, revenue of $397.3 mln, and operating EBITDA of $131.3 mln. We are initiating with 2015E EPS of $1.12, 2016E EPS of $1.44, and 2017E EPS of $1.52.
The combination of the tailwinds from the initial investments made in improving the network’s overall health, and focus on improved restaurant mix (higher-margin corporate restaurants, such as Bier Markt, Milestones, and Landing), is expected to facilitate solid performance through our forecast window. While Cara’s results have significantly improved in 2014, the company has yet to realize the full benefits of its operational turnaround, as a number of initiatives are still in early stage.
While sales in Western Canada experienced some softness given the challenging macro backdrop, Cara’s network in the East continues to see solid sales momentum. Importantly, recall that Cara has the greatest exposure to Ontario’s economy, where GDP growth in 2015 is expected to outpace the national average for the first time since 2002 (driven by strong exports and consumer spending). Our earnings forecasts are based on the following assumptions:
2015 Estimates
System Sales: System sales of $1,784.8 mln reflect corporate segment system sales of $226.4 mln and franchise segment system sales of $1,558.1 mln. Total revenue of $322.8 mln reflects a 14.6% increase from the prior year, driven by SRS growth of 2.6% and the addition of 134 new restaurants (includes the pending New York Fries acquisition).
Operating EBITDA: Operating EBITDA margin improvement from 4.9% of system sales to 5.8% (operating EBITDA of $103.6 mln), reflecting our expectations of continued food and labour cost savings at corporate restaurants.
Corporate Segment: Corporate segment contribution margin of 9.2%, versus the long-term targeted contribution margin of 10.0%-15.0%. Cara expects to improve corporate restaurant profitability through lower operating costs, such as sourcing, marketing, and labour.
Franchise Segment: Franchise segment contribution margin of 3.9%, an improvement from the 3.7% contribution margin in 2014. The contribution margin should increase gradually as the effective royalty rate (currently at 3.7%) will increase closer to the standard 5.0% rate as temporary and historical contractual franchisee subsidy support is decreased as overall network health improves.
EPS: EPS of $1.12, which is predicated on our expectations of net income of $52.4 mln and an effective tax rate of 12.9%.
2016 Estimates
System Sales: System sales growth of 18.9% from $1,784.8 mln to $2,122.8 mln, on corporate segment system sales of $258.2 mln and franchise segment system sales of $1,864.3 mln. Total revenue of $369.8 mln reflects a 14.6% increase from 2015E, reflecting our expectations of SRS growth of 2.4% and the addition of 36 new restaurants (which is toward the low end but within Cara’s targeted annual restaurant additions of 30 to 50).
Operating EBITDA: Essentially flat operating EBITDA margin of 5.8% of system sales. Our operating EBITDA estimate of $122.1 mln is toward the low end of Cara’s targeted range of $175 mln-$240 mln over the next 5 to 7 years.
Corporate Segment: Corporate segment contribution margin of 9.4%, for corporate segment contribution of $24.3 mln, reflecting the continued improvement of corporate restaurant profitability on cost savings.
Canada Research | Page 20 of 36 Cara Operations Limited
Raymond James Ltd. | 2100 – 925 West Georgia Street | Vancouver BC Canada V6C 3L2
Franchise Segment: Franchise segment contribution margin improvement of 15 bp, from 3.9% in 2015E to 4.1% in 2016E. The contribution margin should continue to increase gradually with the increase of the effective royalty rate closer to the standard 5.0%, as temporary and historical contractual franchisee subsidy support is decreased as overall network health improves.
EPS: EPS growth of 28.8% to $1.44, which is predicated on our $72.6 mln net income expectation and effective tax rate of 19.0%.
2017 Estimates
System Sales: System sales of $2,263.1 mln reflect corporate segment system sales of $274.0 mln and franchise segment system sales of $1,988.9 mln. Total revenue of $397.3 mln reflects a 7.4% increase from the prior year, driven by SRS growth of 3.1% and the addition of 32 new restaurants (at the lower end of Cara’s targeted 30 to 50 net new restaurant openings).
Operating EBITDA: Essentially flat operating EBITDA margin of 5.8% (operating EBITDA of $131.3 mln), reflecting our expectations of continued food and labour cost savings at corporate restaurants.
Corporate Segment: Corporate segment contribution margin of 9.8%, which remains on track to achieving the long-term targeted range of 10.0% -15.0%. Corporate restaurant profitability is expected to continue to improve driven by lower operating costs, namely sourcing, marketing, and labour.
Franchise Segment: Franchise segment contribution margin of 4.3%, an improvement from the 4.1% contribution margin in 2016E. The contribution margin is expected to continue to increase gradually as the effective royalty rate increases closer to the standard 5.0% rate as temporary and historical contractual franchisee subsidy support is decreased as overall network health improves.
EPS: EPS of $1.52, which is predicated on our expectations of net income of $76.8 mln and an effective tax rate of 21.0%.
Cara Operations Limited Canada Research | Page 21 of 36
Raymond James Ltd. | 2100 – 925 West Georgia Street | Vancouver BC Canada V6C 3L2
Valuation & Recommendation
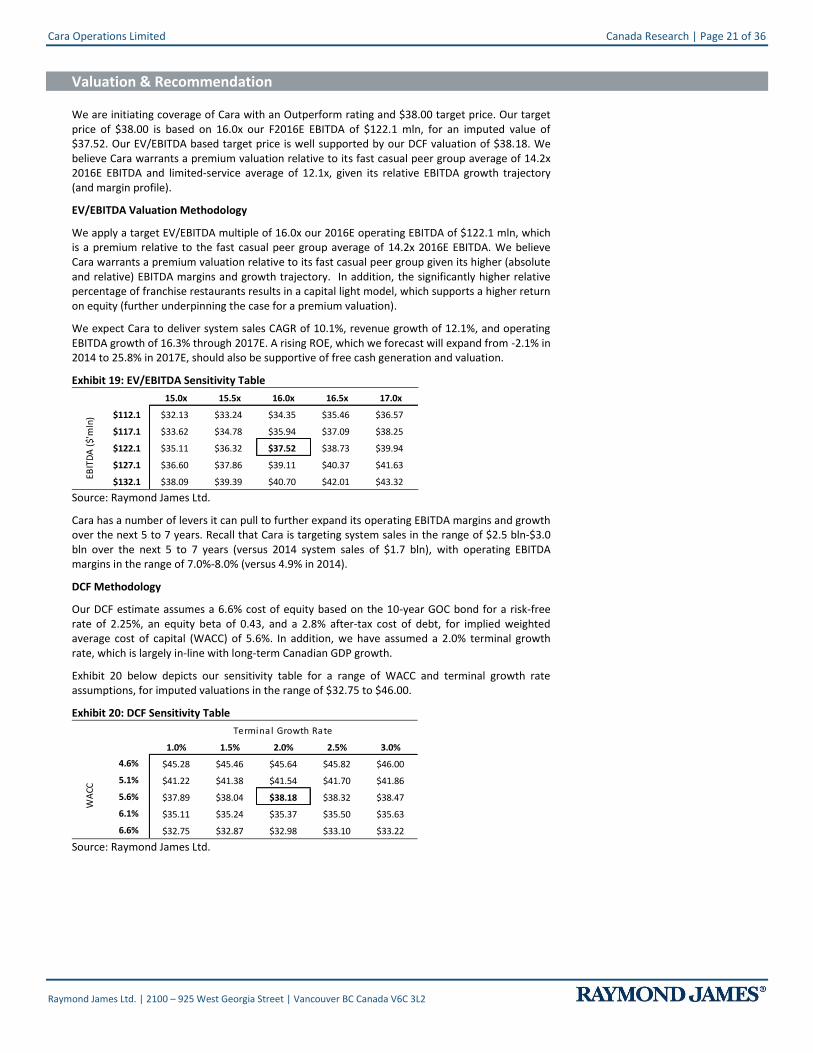
We are initiating coverage of Cara with an Outperform rating and $38.00 target price. Our target price of $38.00 is based on 16.0x our F2016E EBITDA of $122.1 mln, for an imputed value of $37.52. Our EV/EBITDA based target price is well supported by our DCF valuation of $38.18. We believe Cara warrants a premium valuation relative to its fast casual peer group average of 14.2x 2016E EBITDA and limited-service average of 12.1x, given its relative EBITDA growth trajectory (and margin profile).
EV/EBITDA Valuation Methodology
We apply a target EV/EBITDA multiple of 16.0x our 2016E operating EBITDA of $122.1 mln, which is a premium relative to the fast casual peer group average of 14.2x 2016E EBITDA. We believe Cara warrants a premium valuation relative to its fast casual peer group given its higher (absolute and relative) EBITDA margins and growth trajectory. In addition, the significantly higher relative percentage of franchise restaurants results in a capital light model, which supports a higher return on equity (further underpinning the case for a premium valuation).
We expect Cara to deliver system sales CAGR of 10.1%, revenue growth of 12.1%, and operating EBITDA growth of 16.3% through 2017E. A rising ROE, which we forecast will expand from -2.1% in 2014 to 25.8% in 2017E, should also be supportive of free cash generation and valuation.
Exhibit 19: EV/EBITDA Sensitivity Table
37.52$ 15.0x 15.5x 16.0x 16.5x 17.0x
$112.1 $32.13 $33.24 $34.35 $35.46 $36.57
$117.1 $33.62 $34.78 $35.94 $37.09 $38.25
$122.1 $35.11 $36.32 $37.52 $38.73 $39.94
$127.1 $36.60 $37.86 $39.11 $40.37 $41.63
$132.1 $38.09 $39.39 $40.70 $42.01 $43.32
EBIT
DA
($'
mln
)
Source: Raymond James Ltd.
Cara has a number of levers it can pull to further expand its operating EBITDA margins and growth over the next 5 to 7 years. Recall that Cara is targeting system sales in the range of $2.5 bln-$3.0 bln over the next 5 to 7 years (versus 2014 system sales of $1.7 bln), with operating EBITDA margins in the range of 7.0%-8.0% (versus 4.9% in 2014).
DCF Methodology
Our DCF estimate assumes a 6.6% cost of equity based on the 10-year GOC bond for a risk-free rate of 2.25%, an equity beta of 0.43, and a 2.8% after-tax cost of debt, for implied weighted average cost of capital (WACC) of 5.6%. In addition, we have assumed a 2.0% terminal growth rate, which is largely in-line with long-term Canadian GDP growth.
Exhibit 20 below depicts our sensitivity table for a range of WACC and terminal growth rate assumptions, for imputed valuations in the range of $32.75 to $46.00.
Exhibit 20: DCF Sensitivity Table
3,818% 1.0% 1.5% 2.0% 2.5% 3.0%
4.6% $45.28 $45.46 $45.64 $45.82 $46.00
5.1% $41.22 $41.38 $41.54 $41.70 $41.86
5.6% $37.89 $38.04 $38.18 $38.32 $38.47
6.1% $35.11 $35.24 $35.37 $35.50 $35.63
6.6% $32.75 $32.87 $32.98 $33.10 $33.22
Terminal Growth Rate
WA
CC
Source: Raymond James Ltd.
Canada Research | Page 22 of 36 Cara Operations Limited
Raymond James Ltd. | 2100 – 925 West Georgia Street | Vancouver BC Canada V6C 3L2
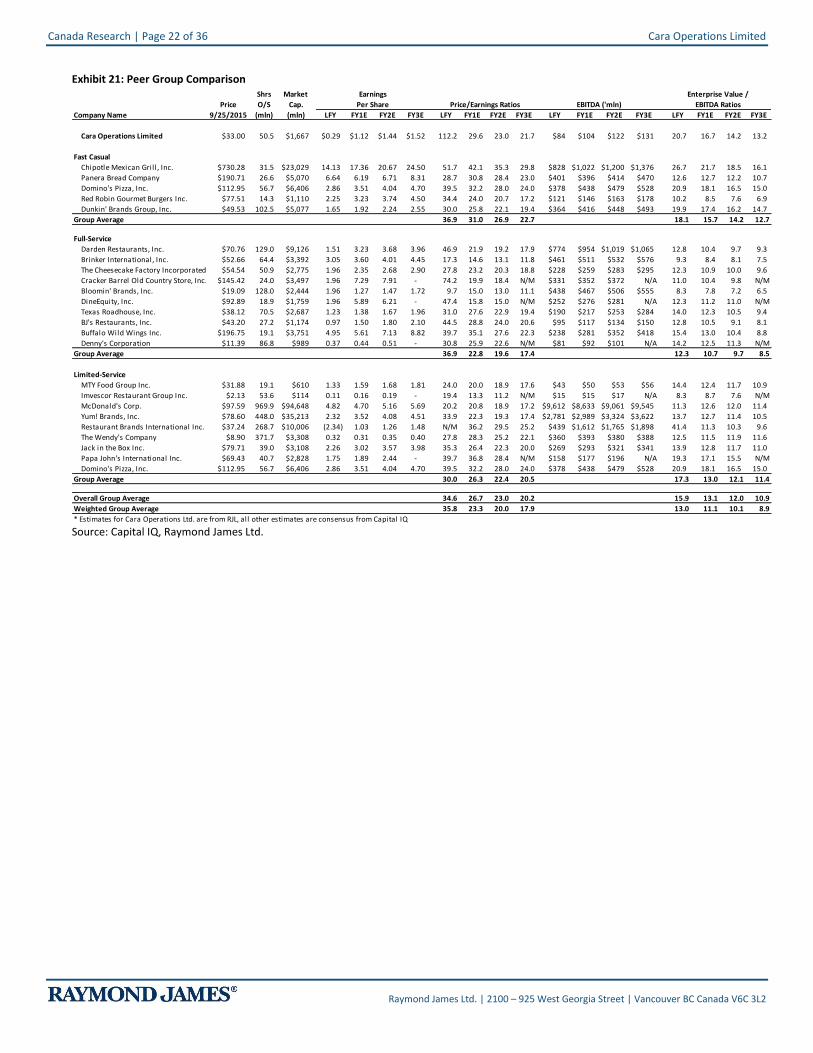
Exhibit 21: Peer Group Comparison Shrs Market 1000 1001 1002 1003
Price O/S Cap.
Company Name 9/25/2015 (mln) (mln) LFY FY1E FY2E FY3E LFY FY1E FY2E FY3E LFY FY1E FY2E FY3E LFY FY1E FY2E FY3E
Cara Operations Limited $33.00 50.5 $1,667 $0.29 $1.12 $1.44 $1.52 112.2 29.6 23.0 21.7 $84 $104 $122 $131 20.7 16.7 14.2 13.2
Fast Casual LAST 1000 1001 1002 1003
Chipotle Mexican Grill , Inc. $730.28 31.5 $23,029 14.13 17.36 20.67 24.50 51.7 42.1 35.3 29.8 $828 $1,022 $1,200 $1,376 26.7 21.7 18.5 16.1
Panera Bread Company $190.71 26.6 $5,070 6.64 6.19 6.71 8.31 28.7 30.8 28.4 23.0 $401 $396 $414 $470 12.6 12.7 12.2 10.7
Domino's Pizza, Inc. $112.95 56.7 $6,406 2.86 3.51 4.04 4.70 39.5 32.2 28.0 24.0 $378 $438 $479 $528 20.9 18.1 16.5 15.0
Red Robin Gourmet Burgers Inc. $77.51 14.3 $1,110 2.25 3.23 3.74 4.50 34.4 24.0 20.7 17.2 $121 $146 $163 $178 10.2 8.5 7.6 6.9
Dunkin' Brands Group, Inc. $49.53 102.5 $5,077 1.65 1.92 2.24 2.55 30.0 25.8 22.1 19.4 $364 $416 $448 $493 19.9 17.4 16.2 14.7
Group Average 36.9 31.0 26.9 22.7 18.1 15.7 14.2 12.7
Full-Service LAST 1000 1001 1002 1003
Darden Restaurants, Inc. $70.76 129.0 $9,126 1.51 3.23 3.68 3.96 46.9 21.9 19.2 17.9 $774 $954 $1,019 $1,065 12.8 10.4 9.7 9.3
Brinker International, Inc. $52.66 64.4 $3,392 3.05 3.60 4.01 4.45 17.3 14.6 13.1 11.8 $461 $511 $532 $576 9.3 8.4 8.1 7.5
The Cheesecake Factory Incorporated $54.54 50.9 $2,775 1.96 2.35 2.68 2.90 27.8 23.2 20.3 18.8 $228 $259 $283 $295 12.3 10.9 10.0 9.6
Cracker Barrel Old Country Store, Inc. $145.42 24.0 $3,497 1.96 7.29 7.91 - 74.2 19.9 18.4 N/M $331 $352 $372 N/A 11.0 10.4 9.8 N/M
Bloomin' Brands, Inc. $19.09 128.0 $2,444 1.96 1.27 1.47 1.72 9.7 15.0 13.0 11.1 $438 $467 $506 $555 8.3 7.8 7.2 6.5
DineEquity, Inc. $92.89 18.9 $1,759 1.96 5.89 6.21 - 47.4 15.8 15.0 N/M $252 $276 $281 N/A 12.3 11.2 11.0 N/M
Texas Roadhouse, Inc. $38.12 70.5 $2,687 1.23 1.38 1.67 1.96 31.0 27.6 22.9 19.4 $190 $217 $253 $284 14.0 12.3 10.5 9.4
BJ's Restaurants, Inc. $43.20 27.2 $1,174 0.97 1.50 1.80 2.10 44.5 28.8 24.0 20.6 $95 $117 $134 $150 12.8 10.5 9.1 8.1
Buffalo Wild Wings Inc. $196.75 19.1 $3,751 4.95 5.61 7.13 8.82 39.7 35.1 27.6 22.3 $238 $281 $352 $418 15.4 13.0 10.4 8.8
Denny's Corporation $11.39 86.8 $989 0.37 0.44 0.51 - 30.8 25.9 22.6 N/M $81 $92 $101 N/A 14.2 12.5 11.3 N/M
Group Average 36.9 22.8 19.6 17.4 12.3 10.7 9.7 8.5
Limited-Service LAST 1000 1001 1002 1003
MTY Food Group Inc. $31.88 19.1 $610 1.33 1.59 1.68 1.81 24.0 20.0 18.9 17.6 $43 $50 $53 $56 14.4 12.4 11.7 10.9
Imvescor Restaurant Group Inc. $2.13 53.6 $114 0.11 0.16 0.19 - 19.4 13.3 11.2 N/M $15 $15 $17 N/A 8.3 8.7 7.6 N/M
McDonald's Corp. $97.59 969.9 $94,648 4.82 4.70 5.16 5.69 20.2 20.8 18.9 17.2 $9,612 $8,633 $9,061 $9,545 11.3 12.6 12.0 11.4
Yum! Brands, Inc. $78.60 448.0 $35,213 2.32 3.52 4.08 4.51 33.9 22.3 19.3 17.4 $2,781 $2,989 $3,324 $3,622 13.7 12.7 11.4 10.5
Restaurant Brands International Inc. $37.24 268.7 $10,006 (2.34) 1.03 1.26 1.48 N/M 36.2 29.5 25.2 $439 $1,612 $1,765 $1,898 41.4 11.3 10.3 9.6
The Wendy's Company $8.90 371.7 $3,308 0.32 0.31 0.35 0.40 27.8 28.3 25.2 22.1 $360 $393 $380 $388 12.5 11.5 11.9 11.6
Jack in the Box Inc. $79.71 39.0 $3,108 2.26 3.02 3.57 3.98 35.3 26.4 22.3 20.0 $269 $293 $321 $341 13.9 12.8 11.7 11.0
Papa John's International Inc. $69.43 40.7 $2,828 1.75 1.89 2.44 - 39.7 36.8 28.4 N/M $158 $177 $196 N/A 19.3 17.1 15.5 N/M
Domino's Pizza, Inc. $112.95 56.7 $6,406 2.86 3.51 4.04 4.70 39.5 32.2 28.0 24.0 $378 $438 $479 $528 20.9 18.1 16.5 15.0
Group Average 30.0 26.3 22.4 20.5 17.3 13.0 12.1 11.4
Overall Group Average 34.6 26.7 23.0 20.2 15.9 13.1 12.0 10.9
Weighted Group Average 35.8 23.3 20.0 17.9 13.0 11.1 10.1 8.9
* Estimates for Cara Operations Ltd. are from RJL, all other estimates are consensus from Capital IQ
Earnings
Per Share Price/Earnings Ratios EBITDA ('mln)
Enterprise Value /
EBITDA Ratios
Source: Capital IQ, Raymond James Ltd.
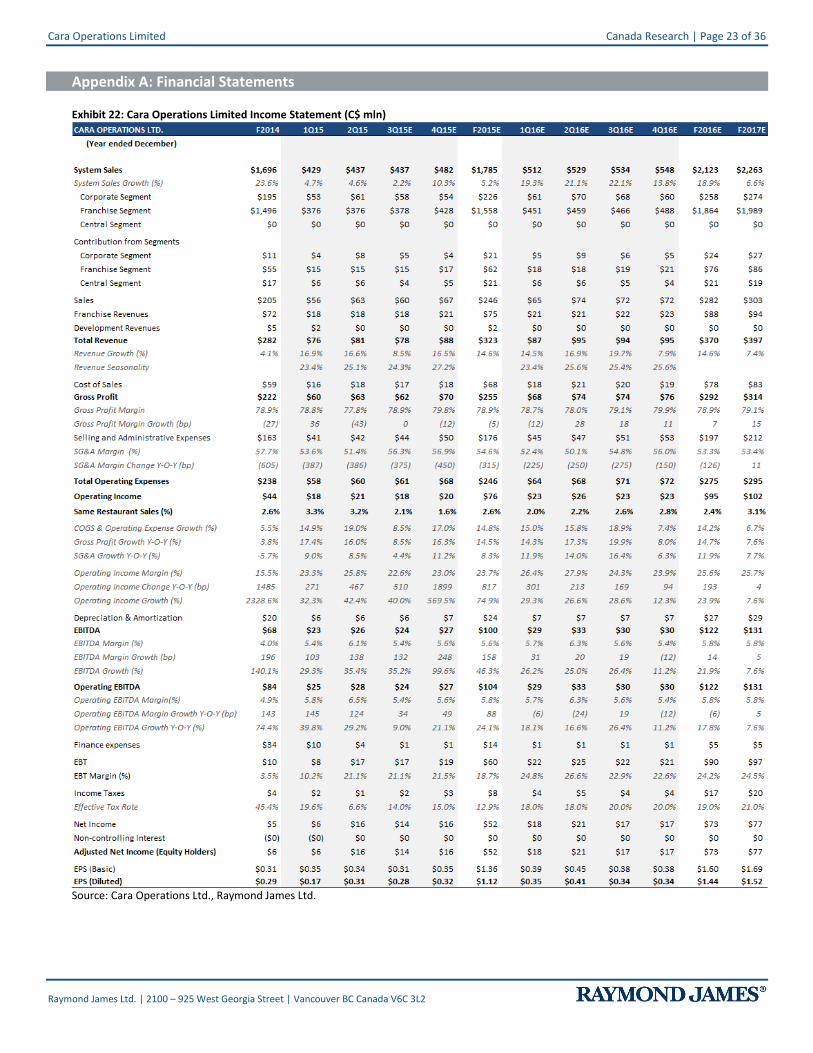
Cara Operations Limited Canada Research | Page 23 of 36
Raymond James Ltd. | 2100 – 925 West Georgia Street | Vancouver BC Canada V6C 3L2
Appendix A: Financial Statements
Exhibit 22: Cara Operations Limited Income Statement (C$ mln)
Source: Cara Operations Ltd., Raymond James Ltd.
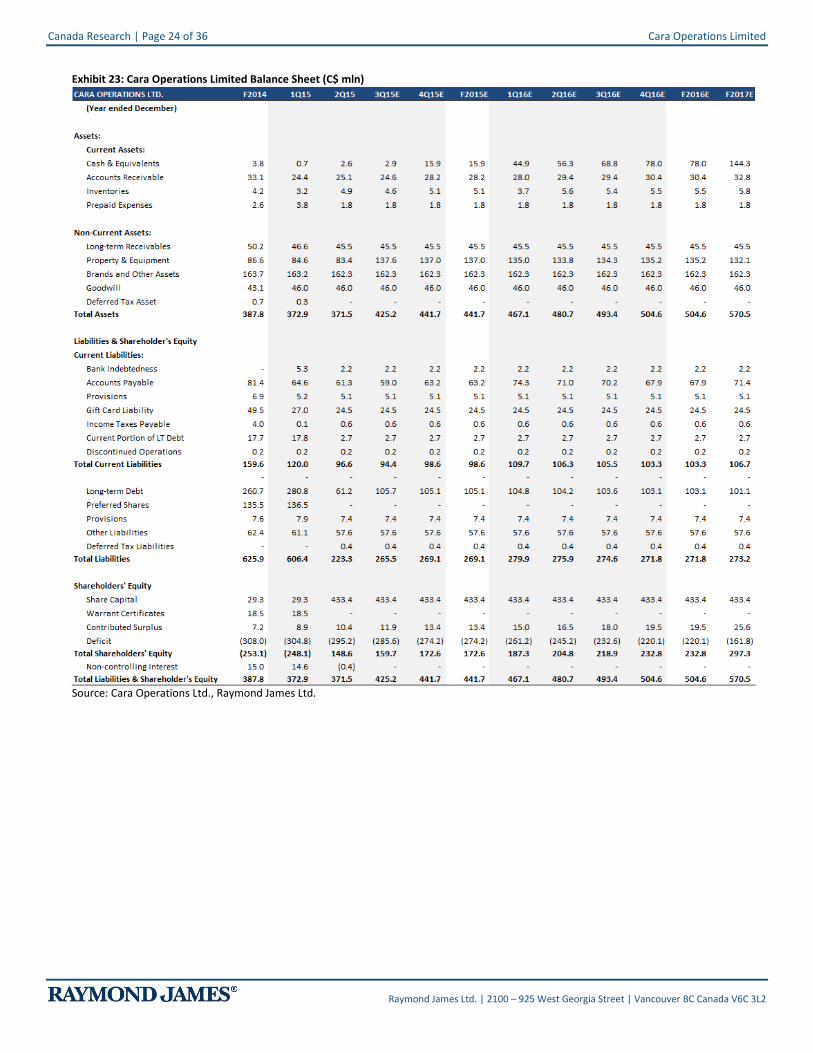
Canada Research | Page 24 of 36 Cara Operations Limited
Raymond James Ltd. | 2100 – 925 West Georgia Street | Vancouver BC Canada V6C 3L2
Exhibit 23: Cara Operations Limited Balance Sheet (C$ mln)
Source: Cara Operations Ltd., Raymond James Ltd.
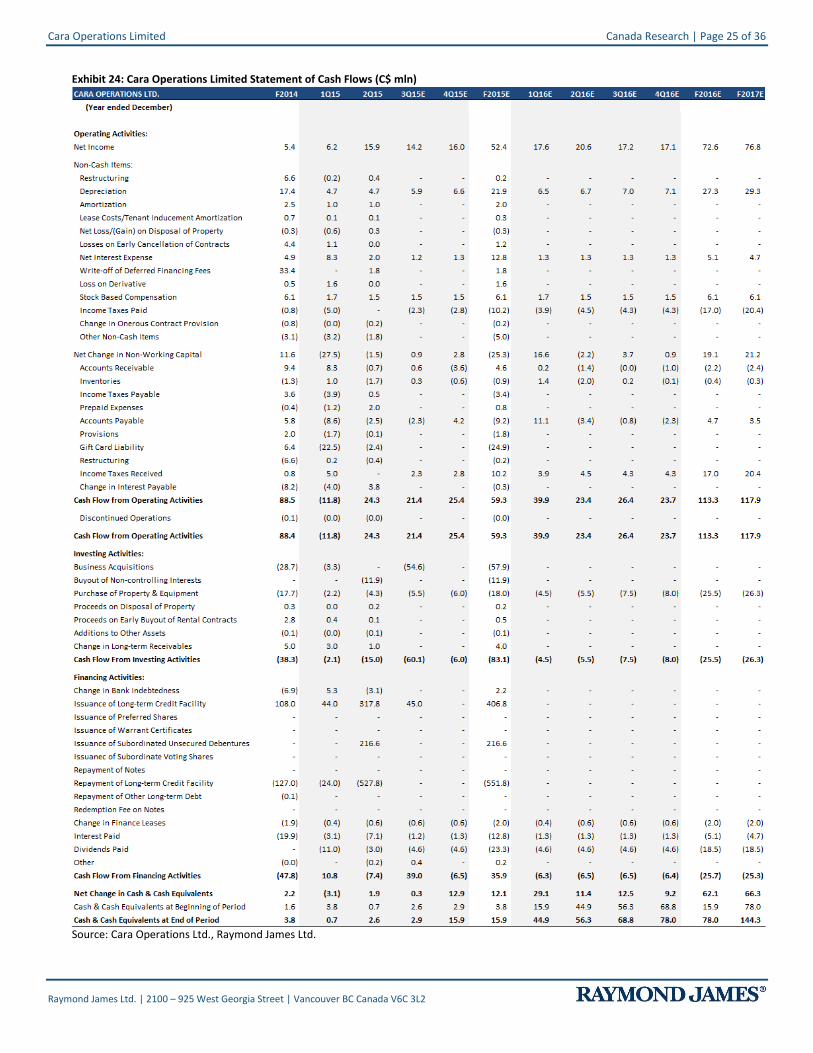
Cara Operations Limited Canada Research | Page 25 of 36
Raymond James Ltd. | 2100 – 925 West Georgia Street | Vancouver BC Canada V6C 3L2
Exhibit 24: Cara Operations Limited Statement of Cash Flows (C$ mln)
Source: Cara Operations Ltd., Raymond James Ltd.
Sleep Country Canada F201 1Q15 2Q1
Canada Research | Page 26 of 36 Cara Operations Limited
Raymond James Ltd. | 2100 – 925 West Georgia Street | Vancouver BC Canada V6C 3L2
Appendix B: Management & Board of Directors
Management Team
William (Bill) Gregson, Chief Executive Officer and Chair of the Board
Mr. Gregson has served as Cara’s Chief Executive Officer since October 2013, and following the close of the public offering also serves as Chair of the Board. Previously, Mr. Gregson served as the Executive Chair of the Board of Directors of The Brick from 2012 to 2013, and as President and Chief Executive Officer of The Brick Warehouse LP from 2009 to 2011. Prior to joining The Brick, Mr. Gregson held the position of President and Chief Operating Officer of Forzani Group Ltd. Mr. Gregson is also a Director of Keg Restaurants Ltd. Mr. Gregson holds a Bachelor of Commerce degree from the University of Toronto.
Kenneth (Ken) J. Grondin, Chief Financial Officer
Mr. Grondin has served in his current position since October 2013. Prior to joining Cara, Mr. Grondin served as Chief Financial Officer and President of Financial Operations at The Brick from August 2011 to April 2013. Previously, he held the positions of Senior Vice President and Chief Financial Officer of Parkland Fuel Corporation, Chief Financial Officer and Board Member with Nygard International, and Partner – Head of Tax Division for Arthur Andersen. Mr. Grondin is a Chartered Accountant, Certified Management Accountant, and a Chartered Business Valuator. He holds a Master of Accounting degree and Bachelor of Arts from the University of Waterloo.
Kenneth Otto, President, Family Dining Division and Chief Development Officer
Mr. Otto has served in his current position since September 2014. Mr. Otto leads Cara’s Family Dining Division (Swiss Chalet, Harvey’s, Montana’s and East Side Mario’s banners), and is responsible for franchise and real estate development, restaurant design, and construction and renovation departments. Prior to joining Cara, he served as Chief Operating Officer at Boston Pizza, where he also held various senior executive management positions. Mr. Otto previously worked for Cara from 1998 to 2004 in the role of Chief Operating Officer, Airport Terminal Restaurants Division. He has also held executive positions with Moxie’s Restaurants, and was a consultant to Canada’s hospitality industry with Price Waterhouse Ltd. and Pannell Kerr Forster. He holds a Bachelor of Commerce in Hotel and Food Administration from the University of Guelph.
Grant Cobb, Senior Vice President, Casual Dining Division
Mr. Cobb has served as Senior Vice President of Casual Dining Division since 2014. Previously, he served in various senior roles at Cara and Prime, including Senior Vice President of Brand Management, and Senior Vice President of Casey’s and Pubs. Prior to joining Cara, Mr. Cobb managed several large food service businesses, including Casey’s and Pat & Mario’s. Mr. Cobb was one of the primary shareholders at Prime prior to the acquisition by Cara. He graduated from the Hospitality Program at Centenniel College in Toronto.
Steve Pelton, CEO of the Landing Group and Senior Vice President, Milestones
Mr. Pelton is a co-founder and the current CEO of the Landing Group (Williams Landing, Hunters Landing, and Harpers Landing), and recently assumed leadership of the Milestones brand (as SVP Milestones). Mr. Pelton was a co-founder of South of Temperance (2010-2012), and has worked in the restaurant industry, in progressively more senior roles, since 1999.
Cara Operations Limited Canada Research | Page 27 of 36
Raymond James Ltd. | 2100 – 925 West Georgia Street | Vancouver BC Canada V6C 3L2
Board of Directors
Stephen K. Gunn, Director of the Board
Mr. Gunn serves as a Director of the Board. Mr. Gunn co-founded Sleep Country in 1994 and served as its Chief Executive Officer from 1997 to 2014. Prior to co-founding Sleep Country, Mr. Gunn held management consulting positions at McKinsey from 1981 to 1987, after which he co-founded Kenrick Capital. Mr. Gunn also serves on the Board of Directors at Dollarama, Golfsmith International, and Mastermind Toys. Mr. Gunn holds an MBA from University of Western Ontario, and a B.Sc. degree from Queen’s University.
Christopher D. Hodgson, Director of the Board
Mr. Hodgson serves as a Director of the Board. He is the President of the Ontario Mining Association, President of Chris Hodgson Enterprises and a Board member for Fairfax India Holding Corp. Previously, Mr. Hodgson served as Lead Director for The Brick. He was involved in provincial politics beginning in 1994, and was appointed to the Ontario Cabinet following the 1995 and 1999 general elections. He also served as Minster of Natural Resources, Minster of Northern Development and Mines, Chairman of the Management Board of Cabinet, Commissioner of the Board of Internal Economy, and Minister of Municipal Affairs and Housing. Mr. Hodgson holds an Honours Bachelor of Arts degree from Trent University.
Michel J. Norris, Director of the Board
Mr. Norris serves as a Director of the Board. Mr. Norris has been on the company’s Board of Directors since January 2012, and acted as Interim Chair of the Board from October 2013 until April 2015. Previously, he was Deputy Chair of RBC Capital Markets from 2003 until 2012. He has held various positions with RBC, including Head of the Energy Practice and Head of Global Investment Banking.
John A. Rothschild, Director of the Board
Mr. Rothschild has been a member of the Board since October 2013. Previously, he served as Senior Vice President, Restaurant Development of the company until November 2014. Mr. Rothschild served as Chief Executive Officer of Prime from 1992 to 2014. Mr. Rothschild held various positions at Claridge Inc., including Vice President of Investments and President of one of the company’s subsidiaries. He holds a Bachelor of Arts degree from the University of Toronto, an MBA from Western University, and is a DCPA/FCA.
Sean Regan, President of Cara Holdings, Director of the Board
Mr. Regan has served in his current position since 2013. Previously, he served as Senior Vice President, Corporate Development at the company, where he was responsible for acquisition and partnership opportunities, in addition to Cara’s gift card program. Mr. Regan also served in Cara’s IT Group, including the Call Centre Business from 2009 to 2013, during which he was responsible for the company’s transition to the current cloud-based computing system. Prior to joining Cara, Mr. Regan was a commercial helicopter pilot in British Columbia. He holds an MBA from The Ivey School of Business.
Canada Research | Page 28 of 36 Cara Operations Limited
Raymond James Ltd. | 2100 – 925 West Georgia Street | Vancouver BC Canada V6C 3L2
Risks
General Economic Conditions
The company’s business and operating performance may be adversely affected by economic forces beyond its control. Rising consumer debt levels and changes in consumer preferences and buying patterns, as well as changes in unemployment rate and labour costs could negatively impact the company’s performance. External factors that affect global and/or regional economies, interest rates, exchange rates, or major segments of the economy could alter investor confidence and investment prospects; an increase in minimum wage could have an adverse impact on operating costs and earnings.
Competitive Landscape
The Canadian restaurant industry is highly competitive, both in terms of price, value proposition, service, location, and overall food quality. Cara is susceptible to increased competition in the fragmented and mature restaurant industry in Canada as a result of high market saturation by various players. Recently, competition has increased in the mid-price, full-service, casual dining segment of the industry, in which many Cara banners operate. An increase in competition may result in lower prices, market share losses, and reduced sales and profitability.
In addition, the Canadian restaurant landscape is also subject to changes in demographic trends, traffic patterns, and evolution of competing restaurant offerings. Changing consumer preferences and discretionary spending patterns could force the company to adjust its restaurant contents and/or menu offerings, which may adversely impact restaurant sales.
Product Cost, Inflation, and Availability of Raw Materials
The company’s operating results may be adversely affected by food prices. These prices may fluctuate based on a number of factors outside the company’s control, such as changes in supply and demand, general economic conditions and consumer spending, labour costs, and competition.
The company’s restaurants depend on the availability and quality of raw materials. Unfavourable trends or developments in the price of raw materials, a significant reduction in the availability of quality ingredients purchased by restaurants, and the unavailability of certain products, may adversely impact the company’s operations and profitability.
New Restaurant Openings
The company’s growth plan calls for the addition of 30 to 50 new restaurants per year through 2020/2021. The company may not be able to support sustained new restaurant growth or open all of its planned new restaurants. In addition, the new restaurants may not be profitable or as profitable as its existing restaurants. New restaurants typically experience an adjustment period before sales levels and operating margins normalize. The opening of new restaurants may also have an adverse impact on existing restaurants.
Ability to Attract Franchisees and Franchise Relationships
The growth of the company is dependent upon the ability to (i) maintain and growth the current system of franchisees, (ii) locate new retail sites in prime locations, and (iii) attract qualified operators to become franchisees. The company’s inability to attract new franchisees to grow its restaurant network could negatively impact its business development.
In addition, the company’s future is dependent on its relationship with its franchisees. Any challenges in the relationship with franchisees may have an adverse impact on the company’s reputation, performance of affected restaurants, and may require increased management resources and administrative expenses. Additionally, a default by a franchisee could result in increased costs and could have an adverse impact on profitability.
Seasonality and Weather
The restaurant industry is subject to seasonal patterns. Adverse or unusual weather patterns may negatively impact the operations of the business. Favourable weather conditions generally increase customer traffic, particularly during the summer months at restaurants with patios. In addition, public holidays can also favorably and unfavorably affect customer traffic.
Cara Operations Limited Canada Research | Page 29 of 36
Raymond James Ltd. | 2100 – 925 West Georgia Street | Vancouver BC Canada V6C 3L2
Acquisition and Related Integration
The company continues to seek opportunities for future acquisitions to expand, and/or complement its existing network. In addition, acquisitions could result in one-time charges and expenses and have the potential to either dilute the interests of existing shareholders or result in the issuance/assumption of additional debt. The inability of management to successfully integrate the operations of the acquired businesses, which include the realization of expected synergies, could have a material negative impact on profitability.
Company Citations
Company Name Ticker Exchange Currency Closing Price RJ Rating RJ Entity
Bloomin' Brands, Inc. BLMN NASDAQ US$ 19.09 1 RJ & Associates Brinker International EAT NYSE US$ 52.66 2 RJ & Associates Buffalo Wild Wings, Inc. BWLD NASDAQ US$ 196.75 2 RJ & Associates Cheesecake Factory Inc. CAKE NASDAQ US$ 54.54 3 RJ & Associates Chipotle Mexican Grill, Inc. CMG NYSE US$ 730.28 3 RJ & Associates Cineplex Inc. CGX TSX C$ 47.94 2 RJ LTD. Darden Restaurants DRI NYSE US$ 70.76 2 RJ & Associates DineEquity, Inc. DIN NYSE US$ 92.89 1 RJ & Associates Dollarama DOL TSX C$ 90.45 2 RJ LTD. McDonald's Corporation MCD NYSE US$ 97.59 3 RJ & Associates Panera Bread Co. PNRA NASDAQ US$ 190.71 3 RJ & Associates Red Robin Gourmet Burgers, Inc. RRGB NASDAQ US$ 77.51 1 RJ & Associates Sleep Country Canada Holdings Inc. ZZZ TSX C$ 15.37 3 RJ LTD. Texas Roadhouse, Inc. TXRH NASDAQ US$ 38.12 2 RJ & Associates
Notes: Prices are as of the most recent close on the indicated exchange and may not be in US$. See Disclosure section for rating definitions. Stocks that do not trade on a U.S. national exchange may not be registered for sale in all U.S. states. NC=not covered.
Canada Research | Page 30 of 36 Cara Operations Limited
Raymond James Ltd. | 2100 – 925 West Georgia Street | Vancouver BC Canada V6C 3L2
IMPORTANT INVESTOR DISCLOSURES Raymond James & Associates (RJA) is a FINRA member firm and is responsible for the preparation and distribution of research created in the United States. Raymond James & Associates is located at The Raymond James Financial Center, 880 Carillon Parkway, St. Petersburg, FL 33716, (727) 567-1000. Non-U.S. affiliates, which are not FINRA member firms, include the following entities which are responsible for the creation and distribution of research in their respective areas; In Canada, Raymond James Ltd. (RJL), Suite 2100, 925 West Georgia Street, Vancouver, BC V6C 3L2, (604) 659-8200; In Latin America, Raymond James Argentina S.A., San Martin 344, 22nd Floor, Buenos Aires, C10004AAH, Argentina, +54 11 4850 2500; In Europe, Raymond James Euro Equities, SAS, 40, rue La Boetie, 75008, Paris, France, +33 1 45 61 64 90, and Raymond James Financial International Ltd., Broadwalk House, 5 Appold Street, London, England EC2A 2AG, +44 203 798 5600.
This document is not directed to, or intended for distribution to or use by, any person or entity that is a citizen or resident of or located in any locality, state, country, or other jurisdiction where such distribution, publication, availability or use would be contrary to law or regulation. The securities discussed in this document may not be eligible for sale in some jurisdictions. This research is not an offer to sell or the solicitation of an offer to buy any security in any jurisdiction where such an offer or solicitation would be illegal. It does not constitute a personal recommendation nor does it take into account the particular investment objectives, financial situations, or needs of individual clients. Information in this report should not be construed as advice designed to meet the individual objectives of any particular investor. Investors should consider this report as only a single factor in making their investment decision. Consultation with your investment advisor is recommended. Past performance is not a guide to future performance, future returns are not guaranteed, and a loss of original capital may occur.
The information provided is as of the date above and subject to change, and it should not be deemed a recommendation to buy or sell any security. Certain information has been obtained from third-party sources we consider reliable, but we do not guarantee that such information is accurate or complete. Persons within the Raymond James family of companies may have information that is not available to the contributors of the information contained in this publication. Raymond James, including affiliates and employees, may execute transactions in the securities listed in this publication that may not be consistent with the ratings appearing in this publication.
With respect to materials prepared by Raymond James Ltd. (“RJL”), all expressions of opinion reflect the judgment of the Research Department of RJL, or its affiliates, at this date and are subject to change. RJL may perform investment banking or other services for, or solicit investment banking business from, any company mentioned in this document.
All Raymond James Ltd. research reports are distributed electronically and are available to clients at the same time via the firm’s website (http://www.raymondjames.ca). Immediately upon being posted to the firm’s website, the research reports are then distributed electronically to clients via email upon request and to clients with access to Bloomberg (home page: RJLC), Capital IQ and Thomson Reuters. Selected research reports are also printed and mailed at the same time to clients upon request. Requests for Raymond James Ltd. research may be made by contacting the Raymond James Product Group during market hours at (604) 659‐8000.
In the event that this is a compendium report (i.e., covers 6 or more subject companies), Raymond James Ltd. may choose to provide specific disclosures for the subject companies by reference. To access these disclosures, clients should refer to: http://www.raymondjames.ca (click on Equity Capital Markets / Equity Research / Research Disclosures) or call toll‐free at 1‐800‐667‐2899.
ANALYST INFORMATION
Analyst Compensation: Equity research analysts and associates at Raymond James are compensated on a salary and bonus system. Several factors enter into the compensation determination for an analyst, including i) research quality and overall productivity, including success in rating stocks on an absolute basis and relative to the local exchange composite Index and/or a sector index, ii) recognition from institutional investors, iii) support effectiveness to the institutional and retail sales forces and traders, iv) commissions generated in stocks under coverage that are attributable to the analyst’s efforts, v) net revenues of the overall Equity Capital Markets Group, and vi) compensation levels for analysts at competing investment dealers.
Analyst Stock Holdings: Effective September 2002, Raymond James equity research analysts and associates or members of their households are forbidden from investing in securities of companies covered by them. Analysts and associates are permitted to hold long positions in the securities of companies they cover which were in place prior to September 2002 but are only permitted to sell those positions five days after the rating has been lowered to Underperform.
The views expressed in this report accurately reflect the personal views of the analyst(s) covering the subject securities. No part of said person's compensation was, is, or will be directly or indirectly related to the specific recommendations or views contained in this research report. In addition, said analyst has not received compensation from any subject company in the last 12 months.
RATINGS AND DEFINITIONS
Raymond James Ltd. (Canada) definitions: Strong Buy (SB1) The stock is expected to appreciate and produce a total return of at least 15% and outperform the S&P/TSX Composite Index over the next six months. Outperform (MO2) The stock is expected to appreciate and
Cara Operations Limited Canada Research | Page 31 of 36
Raymond James Ltd. | 2100 – 925 West Georgia Street | Vancouver BC Canada V6C 3L2
outperform the S&P/TSX Composite Index over the next twelve months. Market Perform (MP3) The stock is expected to perform generally in line with the S&P/TSX Composite Index over the next twelve months and is potentially a source of funds for more highly rated securities. Underperform (MU4) The stock is expected to underperform the S&P/TSX Composite Index or its sector over the next six to twelve months and should be sold.
Raymond James & Associates (U.S.) definitions: Strong Buy (SB1) Expected to appreciate, produce a total return of at least 15%, and outperform the S&P 500 over the next six to 12 months. For higher yielding and more conservative equities, such as REITs and certain MLPs, a total return of at least 15% is expected to be realized over the next 12 months. Outperform (MO2) Expected to appreciate and outperform the S&P 500 over the next 12-18 months. For higher yielding and more conservative equities, such as REITs and certain MLPs, an Outperform rating is used for securities where we are comfortable with the relative safety of the dividend and expect a total return modestly exceeding the dividend yield over the next 12-18 months. Market Perform (MP3) Expected to perform generally in line with the S&P 500 over the next 12 months. Underperform (MU4) Expected to underperform the S&P 500 or its sector over the next six to 12 months and should be sold. Suspended (S) The rating and price target have been suspended temporarily. This action may be due to market events that made coverage impracticable, or to comply with applicable regulations or firm policies in certain circumstances, including when Raymond James may be providing investment banking services to the company. The previous rating and price target are no longer in effect for this security and should not be relied upon.
Raymond James Argentina S.A. rating definitions: Strong Buy (SB1) Expected to appreciate and produce a total return of at least 25.0% over the next twelve months. Outperform (MO2) Expected to appreciate and produce a total return of between 15.0% and 25.0% over the next twelve months. Market Perform (MP3) Expected to perform in line with the underlying country index. Underperform (MU4) Expected to underperform the underlying country index. Suspended (S) The rating and price target have been suspended temporarily. This action may be due to market events that made coverage impracticable, or to comply with applicable regulations or firm policies in certain circumstances, including when Raymond James may be providing investment banking services to the company. The previous rating and price target are no longer in effect for this security and should not be relied upon.
Raymond James Europe (Raymond Euro Equities SAS & Raymond James Financial International Limited) rating definitions: Strong Buy (1) Expected to appreciate, produce a total return of at least 15%, and outperform the Stoxx 600 over the next 6 to 12 months. Outperform (2) Expected to appreciate and outperform the Stoxx 600 over the next 12 months. Market Perform (3) Expected to perform generally in line with the Stoxx 600 over the next 12 months. Underperform (4) Expected to underperform the Stoxx 600 or its sector over the next 6 to 12 months. Suspended (S) The rating and target price have been suspended temporarily. This action may be due to market events that made coverage impracticable, or to comply with applicable regulations or firm policies in certain circumstances, including when Raymond James may be providing investment banking services to the company. The previous rating and target price are no longer in effect for this security and should not be relied upon.
In transacting in any security, investors should be aware that other securities in the Raymond James research coverage universe might carry a higher or lower rating. Investors should feel free to contact their Financial Advisor to discuss the merits of other available investments.
Suitability Ratings (SR)
Medium Risk/Income (M/INC) Lower to average risk equities of companies with sound financials, consistent earnings, and dividend yields above that of the S&P 500. Many securities in this category are structured with a focus on providing a consistent dividend or return of capital.
Medium Risk/Growth (M/GRW) Lower to average risk equities of companies with sound financials, consistent earnings growth, the potential for long-term price appreciation, a potential dividend yield, and/or share repurchase program.
High Risk/Income (H/INC) Medium to higher risk equities of companies that are structured with a focus on providing a meaningful dividend but may face less predictable earnings (or losses), more leveraged balance sheets, rapidly changing market dynamics, financial and competitive issues, higher price volatility (beta), and potential risk of principal. Securities of companies in this category may have a less predictable income stream from dividends or distributions of capital.
High Risk/Growth (H/GRW) Medium to higher risk equities of companies in fast growing and competitive industries, with less predictable earnings (or losses), more leveraged balance sheets, rapidly changing market dynamics, financial or legal issues, higher price volatility (beta), and potential risk of principal.
High Risk/Speculation (H/SPEC) High risk equities of companies with a short or unprofitable operating history, limited or less predictable revenues, very high risk associated with success, significant financial or legal issues, or a substantial risk/loss of principal.
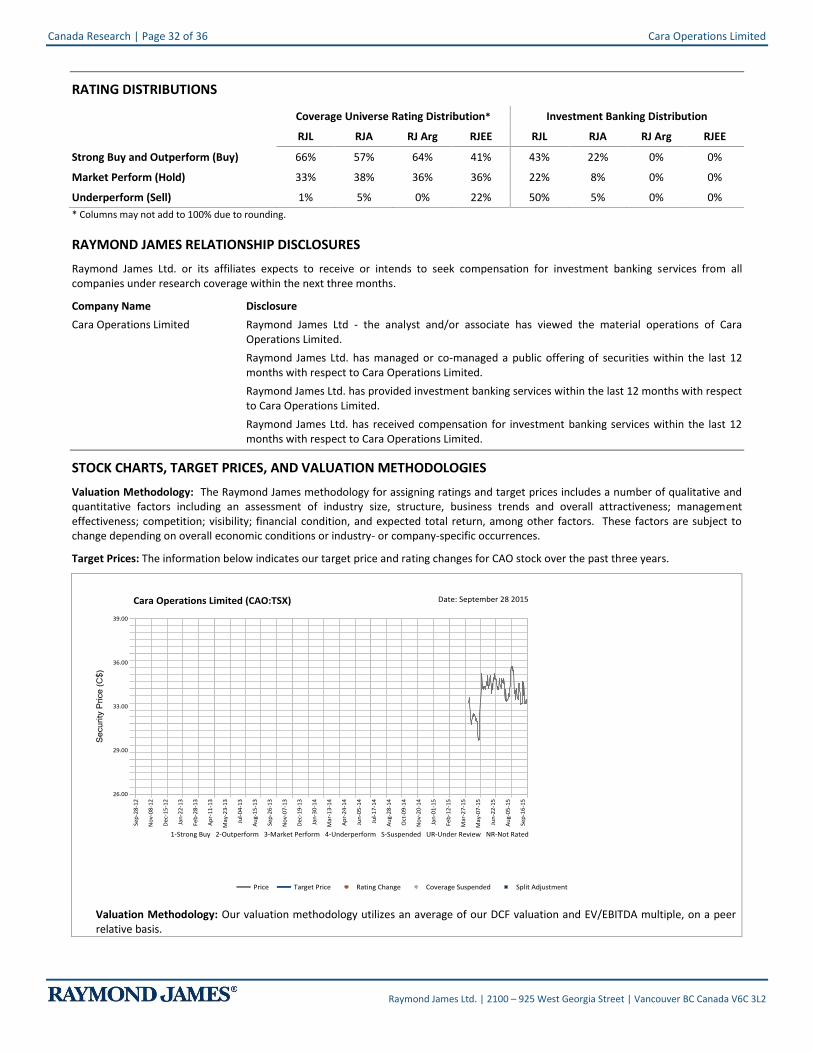
Canada Research | Page 32 of 36 Cara Operations Limited
Raymond James Ltd. | 2100 – 925 West Georgia Street | Vancouver BC Canada V6C 3L2
RATING DISTRIBUTIONS
Coverage Universe Rating Distribution* Investment Banking Distribution
RJL RJA RJ Arg RJEE RJL RJA RJ Arg RJEE
Strong Buy and Outperform (Buy) 66% 57% 64% 41% 43% 22% 0% 0%
Market Perform (Hold) 33% 38% 36% 36% 22% 8% 0% 0%
Underperform (Sell) 1% 5% 0% 22% 50% 5% 0% 0%
* Columns may not add to 100% due to rounding.
RAYMOND JAMES RELATIONSHIP DISCLOSURES
Raymond James Ltd. or its affiliates expects to receive or intends to seek compensation for investment banking services from all companies under research coverage within the next three months.
Company Name Disclosure
Cara Operations Limited Raymond James Ltd - the analyst and/or associate has viewed the material operations of Cara Operations Limited.
Raymond James Ltd. has managed or co-managed a public offering of securities within the last 12 months with respect to Cara Operations Limited.
Raymond James Ltd. has provided investment banking services within the last 12 months with respect to Cara Operations Limited.
Raymond James Ltd. has received compensation for investment banking services within the last 12 months with respect to Cara Operations Limited.
STOCK CHARTS, TARGET PRICES, AND VALUATION METHODOLOGIES
Valuation Methodology: The Raymond James methodology for assigning ratings and target prices includes a number of qualitative and quantitative factors including an assessment of industry size, structure, business trends and overall attractiveness; management effectiveness; competition; visibility; financial condition, and expected total return, among other factors. These factors are subject to change depending on overall economic conditions or industry- or company-specific occurrences.
Target Prices: The information below indicates our target price and rating changes for CAO stock over the past three years.
Valuation Methodology: Our valuation methodology utilizes an average of our DCF valuation and EV/EBITDA multiple, on a peer relative basis.
Cara Operations Limited Canada Research | Page 33 of 36
Raymond James Ltd. | 2100 – 925 West Georgia Street | Vancouver BC Canada V6C 3L2
RISK FACTORS
General Risk Factors: Following are some general risk factors that pertain to the projected target prices included on Raymond James research: (1) Industry fundamentals with respect to customer demand or product / service pricing could change and adversely impact expected revenues and earnings; (2) Issues relating to major competitors or market shares or new product expectations could change investor attitudes toward the sector or this stock; (3) Unforeseen developments with respect to the management, financial condition or accounting policies or practices could alter the prospective valuation.
Risks - Cara Operations Ltd. General Economic Conditions The company’s business and operating performance may be adversely affected by economic forces beyond its control. Rising consumer debt levels and changes in consumer preferences and buying patterns, as well as changes in unemployment rate and labour costs could negatively impact the company’s performance. External factors that affect global and/or regional economies, interest rates, exchange rates, or major segments of the economy could alter investor confidence and investment prospects; an increase in minimum wage could have an adverse impact on operating costs and earnings. Competitive Landscape The Canadian restaurant industry is highly competitive, both in terms of price, value proposition, service, location, and overall food quality. Cara is susceptible to increased competition in the fragmented and mature restaurant industry in Canada as a result of high market saturation by various players. Recently, competition has increased in the mid-price, full-service, casual dining segment of the industry, in which many Cara banners operate. An increase in competition may result in lower prices, market share losses, and reduced sales and profitability. In addition, the Canadian restaurant landscape is also subject to changes in demographic trends, traffic patterns, and evolution of competing restaurant offerings. Changing consumer preferences and discretionary spending patterns could force the company to adjust its restaurant contents and/or menu offerings, which may adversely impact restaurant sales. Product Cost, Inflation, and Availability of Raw Materials The company’s operating results may be adversely affected by food prices. These prices may fluctuate based on a number of factors outside the company’s control, such as changes in supply and demand, general economic conditions and consumer spending, labour costs, and competition. The company’s restaurants depend on the availability and quality of raw materials. Unfavourable trends or developments in the price of raw materials, a significant reduction in the availability of quality ingredients purchased by restaurants, and the unavailability of certain products, may adversely impact the company’s operations and profitability.
New Restaurant Openings
The company’s growth plan calls for the addition of 30 to 50 new restaurants per year through 2020/2021. The company may not be able to support sustained new restaurant growth or open all of its planned new restaurants. In addition, the new restaurants may not be profitable or as profitable as its existing restaurants. New restaurants typically experience an adjustment period before sales levels and operating margins normalize. The opening of new restaurants may also have an adverse impact on existing restaurants.
Ability to Attract Franchisees and Franchise Relationships
The growth of the company is dependent upon the ability to (i) maintain and growth the current system of franchisees, (ii) locate new retail sites in prime locations, and (iii) attract qualified operators to become franchisees. The company’s inability to attract new franchisees to grow its restaurant network could negatively impact its business development.
In addition, the company’s future is dependent on its relationship with its franchisees. Any challenges in the relationship with franchisees may have an adverse impact on the company’s reputation, performance of affected restaurants, and may require increased management resources and administrative expenses. Additionally, a default by a franchisee could result in increased costs and could have an adverse impact on profitability.
Seasonality and Weather
The restaurant industry is subject to seasonal patterns. Adverse or unusual weather patterns may negatively impact the operations of the business. Favourable weather conditions generally increase customer traffic, particularly during the summer months at restaurants with patios. In addition, public holidays can also favorably and unfavorably affect customer traffic.
Acquisition and Related Integration
The company continues to seek opportunities for future acquisitions to expand, and/or complement its existing network. In addition, acquisitions could result in one-time charges and expenses and have the potential to either dilute the interests of existing shareholders or result in the issuance/assumption of additional debt. The inability of management to successfully integrate the operations of the acquired businesses, which include the realization of expected synergies, could have a material negative impact on profitability.
Canada Research | Page 34 of 36 Cara Operations Limited
Raymond James Ltd. | 2100 – 925 West Georgia Street | Vancouver BC Canada V6C 3L2
Additional Risk and Disclosure information, as well as more information on the Raymond James rating system and suitability categories, is available for Raymond James at rjcapitalmarkets.com/Disclosures/index and for Raymond James Limited at www.raymondjames.ca/researchdisclosures.
INTERNATIONAL DISCLOSURES
FOR CLIENTS IN THE UNITED STATES:
Any foreign securities discussed in this report are generally not eligible for sale in the U.S. unless they are listed on a U.S. exchange. This report is being provided to you for informational purposes only and does not represent a solicitation for the purchase or sale of a security in any state where such a solicitation would be illegal. Investing in securities of issuers organized outside of the U.S., including ADRs, may entail certain risks. The securities of non-U.S. issuers may not be registered with, nor be subject to the reporting requirements of, the U.S. Securities and Exchange Commission. There may be limited information available on such securities. Investors who have received this report may be prohibited in certain states or other jurisdictions from purchasing the securities mentioned in this report. Please ask your Financial Advisor for additional details and to determine if a particular security is eligible for purchase in your state.
Raymond James Ltd. is not a U.S. broker‐dealer and therefore is not governed by U.S. laws, rules or regulations applicable to U.S. broker‐dealers. Consequently, the persons responsible for the content of this publication are not licensed in the U.S. as research analysts in accordance with applicable rules promulgated by the U.S. Self Regulatory Organizations.
Any U.S. Institutional Investor wishing to effect trades in any security should contact Raymond James (USA) Ltd., a U.S. broker‐dealer affiliate of Raymond James Ltd.
FOR CLIENTS IN THE UNITED KINGDOM:
For clients of Raymond James & Associates (London Branch) and Raymond James Financial International Limited (RJFI): This document and any investment to which this document relates is intended for the sole use of the persons to whom it is addressed, being persons who are Eligible Counterparties or Professional Clients as described in the FCA rules or persons described in Articles 19(5) (Investment professionals) or 49(2) (High net worth companies, unincorporated associations etc) of the Financial Services and Markets Act 2000 (Financial Promotion) Order 2005 (as amended) or any other person to whom this promotion may lawfully be directed. It is not intended to be distributed or passed on, directly or indirectly, to any other class of persons and may not be relied upon by such persons and is therefore not intended for private individuals or those who would be classified as Retail Clients.
For clients of Raymond James Investment Services, Ltd.: This report is for the use of professional investment advisers and managers and is not intended for use by clients.
For purposes of the Financial Conduct Authority requirements, this research report is classified as independent with respect to conflict of interest management. RJA, RJFI, and Raymond James Investment Services, Ltd. are authorised and regulated by the Financial Conduct Authority in the United Kingdom.
FOR CLIENTS IN FRANCE:
This document and any investment to which this document relates is intended for the sole use of the persons to whom it is addressed, being persons who are Eligible Counterparties or Professional Clients as described in “Code Monétaire et Financier” and Règlement Général de l’Autorité des Marchés Financiers. It is not intended to be distributed or passed on, directly or indirectly, to any other class of persons and may not be relied upon by such persons and is therefore not intended for private individuals or those who would be classified as Retail Clients.
For clients of Raymond James Euro Equities: Raymond James Euro Equities is authorised and regulated by the Autorité de Contrôle Prudentiel et de Résolution and the Autorité des Marchés Financiers.
For institutional clients in the European Economic Area (EEA) outside of the United Kingdom: This document (and any attachments or exhibits hereto) is intended only for EEA institutional clients or others to whom it may lawfully be submitted.
Raymond James Euro Equities is a French Investment Services Provider authorized by the Autorité de contrôle prudentiel et de résolution and regulated by the Autorité de contrôle prudentiel et de résolution and the Autorité des Marchés Financiers. For non-European exchanges, Raymond James Euro Equities operates under the name Raymond James International.
Proprietary Rights Notice: By accepting a copy of this report, you acknowledge and agree as follows:
This report is provided to clients of Raymond James only for your personal, noncommercial use. Except as expressly authorized by Raymond James, you may not copy, reproduce, transmit, sell, display, distribute, publish, broadcast, circulate, modify, disseminate or commercially exploit the information contained in this report, in printed, electronic or any other form, in any manner, without the prior express written consent of Raymond James. You also agree not to use the information provided in this report for any unlawful purpose.
This report and its contents are the property of Raymond James and are protected by applicable copyright, trade secret or other intellectual property laws (of the United States and other countries). United States law, 17 U.S.C. Sec.501 et seq, provides for civil and criminal penalties for copyright infringement. No copyright claimed in incorporated U.S. government works.

Cara Operations Limited Canada Research | Page 35 of 36
Raymond James Ltd. | 2100 – 925 West Georgia Street | Vancouver BC Canada V6C 3L2
Additional information is available upon request. This document may not be reprinted without permission.
RJL is a member of the Canadian Investor Protection Fund. ©2015 Raymond James Ltd.
Canada Research | Page 36 of 36 Cara Operations Limited
Raymond James Ltd. | 2100 – 925 West Georgia Street | Vancouver BC Canada V6C 3L2
RAYMOND JAMES LTD. CANADIAN INSTITUTIONAL EQUITY TEAM WWW.RAYMONDJAMES.CA EQUITY RESEARCH HEAD OF EQUITY RESEARCH
DARYL SWETLISHOFF, CFA 604.659.8246
CONSUMER
CONSUMER & RETAIL KENRIC TYGHE, MBA 416.777.7188 KRISZTINA KATAI (ASSOCIATE) 416.777.7060
ENERGY
OIL & GAS ENERGY SERVICES, HEAD OF ENERGY RESEARCH ANDREW BRADFORD, CFA 403.509.0503 TIM MONACHELLO (ASSOCIATE) 403.509.0562 MICHAEL SHAW (JR ASSOCIATE) 403.509.0534
OIL & GAS PRODUCERS KURT MOLNAR 403.221.0414 GORDON STEPPAN, CFA (SR ASSOCIATE) 403.221.0411
SR. OIL & GAS PRODUCERS | ENERGY INFRASTRUCTURE CHRIS COX, CFA 403.509.0523 MICHAEL BARTH (ASSOCIATE) 403.509.0511
INDUSTRIAL & TRANSPORTATION
INDUSTRIAL | TRANSPORTATION, HEAD OF INDUSTRIAL RESEARCH BEN CHERNIAVSKY 604.659.8244 THEONI PILARINOS, CFA 604.659.8234 EDWARD GUDEWILL (ASSOCIATE) 604.659.8280
INFRASTRUCTURE & CONSTRUCTION FREDERIC BASTIEN, CFA 604.659.8232 SAMIR GHAFIR (ASSOCIATE) 604.659.8470
TRANSPORTATION | AGRIBUSINESS & FOOD PRODUCTS STEVE HANSEN, CMA, CFA 604.659.8208 DANIEL CHEW (ASSOCIATE) 604.659.8238
MINING
BASE & PRECIOUS METALS ALEX TERENTIEW, MBA, P.GEO 416.777.4912 JEAN-CHRISTOPHE PARISIEN-LA SALLE (ASSOCIATE) 416.777.7144
PRECIOUS METALS PHIL RUSSO 416.777.7084
PRECIOUS METALS CHRIS THOMPSON, M.SC. (ENG), P.GEO 604.659.8439 BRIAN MARTIN, CFA (ASSOCIATE) 604.654.1236
URANIUM | JR EXPLORATION & DEVELOPMENT DAVID SADOWSKI 604.659.8255 MILTON-ANDRES BERNAL (ASSOCIATE) 604.659.8028
FINANCIAL SERVICES
DIVERSIFIED FINANCIALS MICHAEL OVERVELDE, CFA, CPA, CA 416.777.4943 BRENNA PHELAN, CFA, CPA, CA (ASSOCIATE) 416.777.7042
FOREST PRODUCTS
FOREST PRODUCTS DARYL SWETLISHOFF, CFA 604.659.8246 DAVID QUEZADA, CFA (ASSOCIATE ANALYST) 604.659.8257
REAL ESTATE
REAL ESTATE & REITS KEN AVALOS, MBA 727.567.1756 JOHANN RODRIGUES (ASSOCIATE ANALYST) 416.777.7189
TECHNOLOGY & COMMUNICATIONS
TECHNOLOGY, ALTERNATIVE ENERGY & CLEAN TECH STEVEN LI, CFA 416.777.4918 JONATHAN LO (ASSOCIATE) 416.777.6414
EQUITY RESEARCH PUBLISHING SENIOR SUPERVISORY ANALYST
HEATHER HERRON 403.509.0509 HEAD OF PUBLISHING | SUPERVISORY ANALYST
CYNTHIA LUI 604.659.8210
TYLER BOS (SUPERVISORY ANALYST | EDITOR) 416.777.4948 INDER GILL (RESEARCH EDITOR) 604.659.8202 KATE MAJOR (RESEARCH PRINCIPAL | EDITOR) 416.777.7173 CHRISTINE MARTE (RESEARCH EDITOR) 604.659.8200 ASHLEY RAMSAY (SUPERVISORY ANALYST |EDITOR) 604.659.8226
INSTITUTIONAL EQUITY SALES HEAD OF SALES
MIKE WESTCOTT 416.777.4935 GREG JACKSON (ECM, BUSINESS MANAGER) 416.777.7172 MICHELLE MARGUET ( ECM, INSTITUTIONAL MARKETING) 416.777.4951
TORONTO (CAN 1.888.601.6105 | USA 1.800.290.4847)
LAURA ARRELL (U.S. EQUITIES) 416.777.4920 SEAN BOYLE 416.777.4927 JEFF CARRUTHERS, CFA 416.777.4929 RICHARD EAKINS 416.777.4926 JONATHAN GREER 416.777.4930 DAVE MACLENNAN 416.777.4934 ROBERT MILLS, CFA 416.777.4945 BRADY PIMLOTT (ASSOCIATE) 416.777.4993 NICOLE SVEC-GRIFFIS, CFA (U.S. EQUITIES) 416.777.4942 NEIL WEBER 416.777.4931 ORNELLA BURNS (ASSISTANT) 416.777.4928 SATBIR CHATRATH (ASSISTANT) 416.777.4915
VANCOUVER (1.800.667.2899)
SCOT ATKINSON, CFA 604.659.8225 NICK POCRNIC 604.659.8230 TERRI MCEWAN (ASSISTANT) 604.659.8228
MONTREAL (514.350.4450 | 1.866.350.4455)
JOHN HART 514.350.4462 DAVID MAISLIN, CFA 514.350.4460 TANYA HATCHER (ASSISTANT) 514.350.4458
LONDON
ADAM WOOD 0.207.426.5612
INSTITUTIONAL EQUITY TRADING
CO-HEAD OF TRADING BOB MCDONALD, CFA 604.659.8222 ANDREW FOOTE, CFA 416.777.4924
TORONTO (CANADA 1.888.601.6105 | USA 1.800.290.4847) MARK ARMSTRONG 416.777.4981 PAM BANKS 416.777.4923 OLIVER HERBST 416.777.4947 ANDY HERRMANN 416.777.4937 ERIC MUNRO, CFA 416.777.4983 JAMES SHIELDS 416.777.4941 BOB STANDING 416.777.4921 PETER MASON (ASSISTANT) 416.777.7195
VANCOUVER (1.800.667.2899) NAV CHEEMA 604.659.8224 FRASER JEFFERSON 604.659.8218 DEREK ORAM 604.659.8223
MONTREAL (514.350.4450 | 1.866.350.4455) JOE CLEMENT 514.350.4470 PATRICK SANCHE 514.350.4465
INSTITUTIONAL EQUITY OFFICES
Calgary Suite 4250 525 8th Avenue SW Calgary, AB T2P 1G1 403.509.0500
Montreal Suite 3000 1800 McGill College Montreal, PQ H3A 3J6 514.350.4450 Toll Free: 1.866.350.4455
Vancouver Suite 2100 925 West Georgia Street Vancouver, BC V6C 3L2 604.659.8000 Toll Free: 1.800.667.2899
Toronto Suite 5400, Scotia Plaza 40 King Street West Toronto, ON M5H 3Y2 416.777.4900 Toll Free Canada: .888.601.6105 Toll Free USA: 1.800.290.4847
International Headquarters The Raymond James Financial Center 880 Carillon Parkway St.Petersburg, FL USA 33716 727.567.1000