Canada Oilseeds and Products Annual 2016 - USDA GAIN Publications... · · 2016-04-27Oilseeds and...
19
1 THIS REPORT CONTAINS ASSESSMENTS OF COMMODITY AND TRADE ISSUES MADE BY USDA STAFF AND NOT NECESSARILY STATEMENTS OF OFFICIAL U.S. GOVERNMENT POLICY Date: GAIN Report Number: Approved By: Prepared By: Report Highlights: Canada's oilseed production (canola, soybeans and sunflowers) for 2016/2017 is forecast to drop to 21.5 million metric tons (MMT), down 2.0 million tons from 2015/2016, mostly driven by lower canola production. Total crush is forecast to fall to 9.75 MMT, a 5 percent decrease from the 2015/2016 anticipated crush levels of 10.2 MMT. Crush is projected lower in 2016/17 resulting from lower projected oilseed supplies and a corresponding drop in exports. Canola crush is raised 100,000 tons in 2015/2016 as a result of large domestic supplies and greater crush capacity. In 2015/2016, healthy domestic supplies, increased domestic crush capacity, a depreciated Canadian dollar, a recovering U.S. livestock industry, and increased demand from China are all supporting greater than expected exports. Darlene Dessureault Teresa McKeivier 2016 Oilseeds and Products Annual Canada CA16020 4/22/2016 Required Report - public distribution
Transcript of Canada Oilseeds and Products Annual 2016 - USDA GAIN Publications... · · 2016-04-27Oilseeds and...
1
THIS REPORT CONTAINS ASSESSMENTS OF COMMODITY AND TRADE ISSUES MADE BY
USDA STAFF AND NOT NECESSARILY STATEMENTS OF OFFICIAL U.S. GOVERNMENT
POLICY
Date:
GAIN Report Number:
Approved By:
Prepared By:
Report Highlights:
Canada's oilseed production (canola, soybeans and sunflowers) for 2016/2017 is forecast to drop to 21.5
million metric tons (MMT), down 2.0 million tons from 2015/2016, mostly driven by lower canola
production. Total crush is forecast to fall to 9.75 MMT, a 5 percent decrease from the 2015/2016
anticipated crush levels of 10.2 MMT. Crush is projected lower in 2016/17 resulting from lower
projected oilseed supplies and a corresponding drop in exports. Canola crush is raised 100,000 tons in
2015/2016 as a result of large domestic supplies and greater crush capacity. In 2015/2016, healthy
domestic supplies, increased domestic crush capacity, a depreciated Canadian dollar, a recovering U.S.
livestock industry, and increased demand from China are all supporting greater than expected exports.
Darlene Dessureault
Teresa McKeivier
2016
Oilseeds and Products Annual
Canada
CA16020
4/22/2016
Required Report - public distribution

2
Executive Summary:
Total oilseeds production (canola, soybean and sunflower seed) in 2016/2017 is forecast at 21.505
million metric tons (MMT), down 2.034 MMT from 2015/2016.
Crush in 2016/2017 is forecast to decrease to 9.75 MMT from 10.2 MMT in 2015/16 due to decreased
canola and soybeans production and low carry-in. This represents a 4.6 percent drop.
Canadian oilseed exports are forecast to drop to 12.1 MMT in 2016/17 from 14.0 MMT in 2015/16, a 16
percent decline. A weaker Canadian dollar and increased crush capacity are supporting Canadian
oilseed exports in 2015/2016.
Total meal production in 2016/2017 is forecast to fall to 5.78 MMT from 6.05 MMT in 2015/16, a 4.5
percent decline.
Similarly, total oils production in 2016/2017 is forecast to decline to 3.8 MMT from 3.9 MMT in
2015/16, a 4 percent drop.
Total meal exports in 2016/2017 will be limited by lower domestic supplies and are forecast to fall to
4.0 MMT from 4.3 MMT in 2015/16, a 7.3 percent drop.
Total oils exports in 2016/17 are projected to fall to 2.9 MMT from 3.0 MMT in 2015/16, a 3.0 percent
decline.
OILSEEDS

3
Canada: Total Oilseeds
2016/2017 Canola (Rapeseed) Soybean Sunflower Seed TOTAL
Area Harvested 7,824 2,147 31 10,002
Production 15,750 5,700 55 21,505
Crush 8,000 1,750 0 9,750
Imports 150 330 30 510
Exports 8,089 3,965 35 12,089
2015/2016 Canola (Rapeseed) Soybean Sunflower Seed TOTAL
Area Harvested 8,083 2,185 38 10,306
Production 17,231 6,235 73 23,539
Crush 8,200 2,000 0 10,200
Imports 100 300 25 425
Exports 9,800 4,200 34 14,034
2014/2015 Canola (Rapeseed) Soybean Sunflower Seed TOTAL
Area Harvested 8,344 2,235 29 10,608
Production 16,410 6,049 55 22,514
Crush 7,357 1,787 0 9,144
Imports 76 339 30 445
Exports 9,214 3,853 34 13,101
All data in 1,000 hectares and 1,000 metric tons.
Marketing year: Aug/July except peanuts which is Oct/Sept.
Total Oilseeds:
Canadian grain and oilseed producers’ are highly dependent on export markets and therefore watch
world supplies and government policies closely. As a result of lower oilseed prices and higher returns
on pulses, area planted to oilseeds (canola, soybean and sunflower) is projected to decline by 3.4
percent, as reported by Statistics Canada seeding intentions survey results. Based on the seeding
intentions, Post forecasts total oilseeds production to fall to 21.505 MMT in 2016/2017. This decrease
is attributed to lower area seeded and a return to average yields, and represents a 2.035 MMT decrease
from 2015/2016 production. Generally, the decision to plant oilseeds has been driven by their resilience
and often offer attractive returns compared to other field crops. However, this year, lower prices
combined with higher pulse prices have resulted in some oilseed acreage, particularly canola, being
shifted to pulses,.
Lower domestic supplies will limit crush in 2016/2017, therefore, crush is forecast to fall to 9.75 MMT,
a 4.6 percent decrease from anticipated crush levels of 10.2 MMT. The high crush volume in
2015/2016 is reflective of abundant domestic supplies, good crush margins, and the increased crush
capacity. A new crush facility came on-line in July, 2015.
In 2016/2017 lower domestic supplies are expected to limit exports, which are forecast to fall to 12.09
MMT, from 14.0 MMT a 16 percent drop from 2015/2016. In 2015/2016, healthy domestic supplies,

4
continued strong world demand, and the depreciation of the Canadian dollar against the U.S. dollar have
supported strong exports.
In 2016/2017, total oilseed imports are forecast to rise to 510,000 metric tons due to lower domestic
supplies resulting from a smaller carry-in and slightly lower production than last year. This forecast
is16.7 percent higher than the anticipated 2015/2016 level of 425,000 tons.
RAPESEED (CANOLA), OILSEED
Production, Supply and Distribution Estimates:
Oilseed, Rapeseed 2014/2015 2015/2016 2016/2017
Market Begin Year Aug 2014 Aug 2015 Aug 2016
Canada USDA Official
New Post
USDA Official
New Post
USDA Official
New Post
Area Planted 8407 8407 8132 8132 0 7824
Area Harvested 8344 8344 8100 8083 0 7767

5
Beginning Stocks 3008 3008 2322 2321 0 1319
Production 16410 16410 17200 17231 0 15750
MY Imports 76 76 100 100 0 150
MY Imp. from U.S. 73 73 95 95 0 110
MY Imp. from EU 0 0 0 0 0 0
Total Supply 19494 19494 19622 19652 0 17219
MY Exports 9214 9214 9300 9800 0 8089
MY Exp. to EU 50 50 400 400 0 50
Crush 7357 7357 8100 8200 0 8000
Food Use Dom. Cons. 0 0 0 0 0 0
Feed Waste Dom. Cons.
601 602 472 333 0 130
Total Dom. Cons. 7958 7959 8572 8533 0 8130
Ending Stocks 2322 2321 1750 1319 0 1000
Total Distribution 19494 19494 19622 19652 0 17219
(1000 HA) ,(1000 MT)
According to the planting intentions survey results released by Statistics Canada on April 21, area
seeded to canola will fall nearly 4 percent from 2015/2016. Attractive returns for pulse crops are
incentivizing farmers to shift acres out of canola into pulses. Post forecasts canola production in
2016/2017 to fall 1.5 MMT from 2015/2016 production levels to 15.75 MMT. This nearly 9 percent
decrease is a result of lower area seeded and a return to average trend yields. This would be the lowest
production level since 2012/13 when production levels reached 13.9 MMT. According to Statistics
Canada, the biggest decreases are expected to occur in Alberta and Saskatchewan.
No increase in crush capacity is expected for 2016/2017, however, increased crush capacity in
2015/2016 was generated by the new plant in Camrose, Alberta and has allowed the canola industry to
increase the domestic crush significantly over 2014/2015 levels. The Camrose plant began operations in
July, 2015 and has the capacity to crush 1.0 million tons of canola annually. Reduced domestic supplies
are expected to limit the crush in 2016/2017 to 8.0 MMT. Post forecast for crush in 2015/2016 is 8.2
MMT, 100,000 tons higher than USDA official estimates, and is based on crush pace to date and higher
domestic capacity.
Canola is highly dependent on the export markets, with between fifty and sixty percent of the
production going to export. Canola seed exports in 2016/2017 will be limited by lower domestic
supplies.
The commercialization of high protein canola meal may make canola seed exports even more attractive
as the meal is currently sold at a discount product and goes mainly into feed rations in the dairy
industry. The commercialization of the high protein canola is expected to be viable for the 2017/18
planting year, but only on a limited basis and unlikely to impact acreage or demand in 2016/2017.
Currently, 15.5 percent of canola acres are seeded to high oleic and specialty canola varieties. Canola
may be facing some competition on its high oleic oil market share in the future as seed companies are
working on having high-oleic soybean varieties receive global regulatory approval for their traits. High-

6
oleic canola has been helping meet oil demand that was created by U.S. FDA transfat labelling law and
works to remove transfats from the American diet. The high oleic canola oil is popular with the food
service industry as it offers high stability and a long shelf life. High oleic canola oil is also popular in
Japan due to the fact that it is odorless.
China has delayed its implementation of a new dockage policy until September 1, 2016 to give time for
the Canadian industry and Chinese food safety regulators to work out Chinese concerns over the risk of
blackleg. Blackleg, also known as stem canker, is a fungus that progressively damages crops and
affects yields. The delay is positive news for the Canadian canola industry as Canada has exported over
4 MMT of canola seed to China in each of the last two years. .
Exports are expected to reach 9.8 MMT in 2015/2016, 500,000 tons higher than USDA official
estimates, based on a strong year-to-date pace. The pace of seed exports to the United States is lower as
a result of a higher U.S. domestic crop in 2015/2016.
Canadian exports to the EU are expected to reach 400,000 tons in 2015/2016, up from 50,000 tons in
2014/15 in response to growing demand for biofuel use.
SOYBEAN, OILSEED
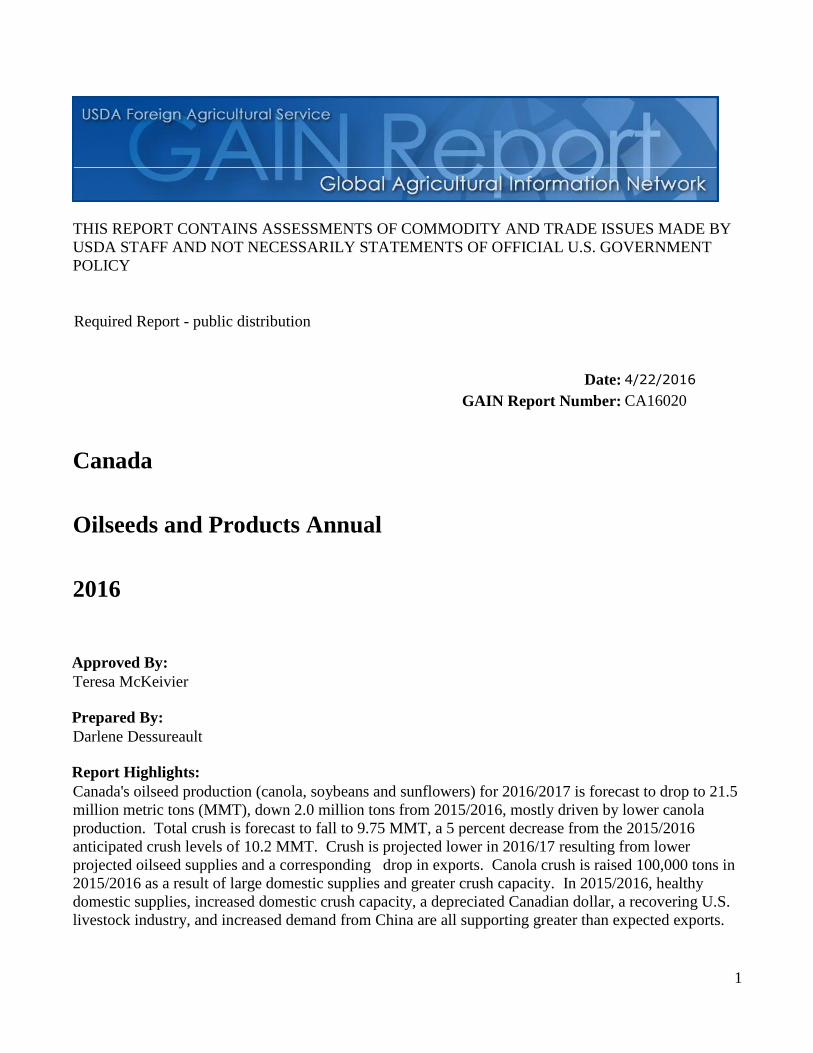
Production, Supply and Distribution Estimates:
Oilseed, Soybean 2014/2015 2015/2016 2016/2017
Market Begin Year Aug 2014 Aug 2015 Aug 2016
Canada USDA Official
New Post
USDA Official
New Post
USDA Official
New Post
Area Planted 2240 2251 2200 2190 0 2147
Area Harvested 2235 2235 2200 2185 0 2140
Beginning Stocks 246 246 466 466 0 351
Production 6049 6049 6235 6235 0 5700
7
MY Imports 339 339 320 300 0 330
MY Imp. from U.S. 256 256 260 250 0 200
MY Imp. from EU 0 0 0 0 0 0
Total Supply 6634 6634 7021 7001 0 6381
MY Exports 3853 3853 4200 4200 0 3965
MY Exp. to EU 1372 1372 1450 1450 0 1300
Crush 1787 1787 2150 2000 0 1750
Food Use Dom. Cons. 0 0 0 0 0 0
Feed Waste Dom. Cons.
528 528 450 450 0 450
Total Dom. Cons. 2315 2315 2600 2450 0 2200
Ending Stocks 466 466 221 351 0 216
Total Distribution 6634 6634 7021 7001 0 6381
(1000 HA) ,(1000 MT)
In Eastern Canada, where 80 percent of the Canadian soybean production takes place, soybean acreage
is expected to fall nearly two percent as producers reported their intention to seed more to corn.
Western Canadian farmers are showing an increased interest in growing soybeans. In 2016/2017 they
are reporting a 7 percent increase in areas to soybean compared to the previous year. Post’s forecast for
soybean production is 5.7 million metric tons reflecting a lower area planted and a return to more
average yields. This represents an 8 percent decrease over the previous year’s production levels.
While soybeans have been grown in Canada for more than 60 years, it is only in the last ten years that
area seeded to soybeans has shown significant growth in provinces outside Quebec and Ontario.
Soybean production in the Prairie Provinces has doubled over the last 5 years. In 2010, only 210
thousand hectares of soybeans were planted. In 2015, that area grew to 670 thousand hectares. The
province of Manitoba, where most of the soybeans are grown in Western Canada, currently accounts for
20% of total soybean production in Canada. This growth is mainly due to new varieties being
developed for Western Canadian climates. Like canola, the resilience and the profitability of the crop,
as well as high oilseed prices in recent years have led to growing interest in soybeans by Western
Canadian farmers. The fact that soybeans have a different disease profile than wheat and canola also
makes soybeans attractive to Western producers
While there are discussions of the value of building a soybean crush facility in the Canadian Prairies,
there are no current plans to do so. Current soybean crush capacity is 3.2 MMT. Domestic crush in
2016/2017 is forecast to fall to 1.75 MMT as a result of lower domestic supplies. Domestic crush pace
in 2015/2016 is well above average due to plentiful supplies. Post projects soybean crush to reach 2.0
MMT in 2015/2016, which is significantly higher than 2014/15, but 150,000 tons lower than USDA
official estimates.
Imports in 2016/2017 are forecast to rise marginally due to lower production. Abundant domestic
supplies in 2015/2016 are expected to result in lower imports. Post estimate for 2015/2016 imports is
300,000 tons, which is 20,000 tons lower than USDA official estimates. Post estimate is based on
import pace to date.

8
The steadily increasing soybean production in Canada has led to increased exports. In 2016/2017,
however, exports are forecast to fall to 3.965 MMT due to low carry-in and lower production. In
2015/2016, abundant domestic supplies, a weaker Canadian dollar against the U.S. dollar and strong
demand from China, Iran and Belgium are expected to result in record exports of 4.2 MMT. Year-to-
date trade data (Aug–Feb) reveals the surge of Canadian soybean exports to China, which is up 42%
over the previous year for the same time period and nearly doubled for Iran. Pace of exports of
Canadian soybean to the United States has slowed 32% from the previous year, likely due to ample
domestic U.S. soybean supplies.
The Canadian Grain Commission is trying to help meet quality assurances being requested by
consumers through its Canadian Identity Preserved Recognition System. Canadian oilseeds producers
hope to capture premiums through this program which is a traceability program that covers all aspects
of soybean production and processing from seed to export. Three quarters of soybean exports to Asia
are now classified as identity preserved (IP).
More information on the CIPRS can be found at the following website: www.grainscanada.gc.ca .
SUNFLOWER SEED, OILSEED
Production, Supply and Distribution Estimates:
Oilseed, Sunflowerseed
2014/2015 2015/2016 2016/2017
Market Begin Year Aug 2014 Aug 2015 Aug 2016
Canada USDA Official
New Post
USDA Official
New Post
USDA Official
New Post
Area Planted 29 30 38 41 0 32
Area Harvested 29 29 38 38 0 31
Beginning Stocks 8 8 10 10 0 16
Production 55 55 73 73 0 55
MY Imports 30 30 25 25 0 30

9
MY Imp. from U.S. 25 25 22 22 0 23
MY Imp. from EU 0 0 0 0 0 0
Total Supply 93 93 108 108 0 101
MY Exports 34 34 40 34 0 35
MY Exp. to EU 0 0 0 0 0 0
Crush 0 0 0 0 0 0
Food Use Dom. Cons. 8 8 8 8 0 8
Feed Waste Dom. Cons.
41 41 50 50 0 50
Total Dom. Cons. 49 49 58 58 0 58
Ending Stocks 10 10 10 16 0 8
Total Distribution 93 93 108 108 0 101
(1000 HA) ,(1000 MT)
Nearly 90 percent of Canadian sunflowers production takes place in Manitoba. The Statistics Canada
planting intentions survey has Canadian farmers reporting that they will be planting 20 percent less area
to sunflowers this year. Based on these survey results, and assuming average yields, Post forecasts
sunflower production to fall to 55 TMT. The National Sunflower Association of Canada estimates that
approximately 70 percent of national production will be of the confectionary type processed in the shell
or dehulled for the snack market and/or the baking industry.
There is currently no large scale crush facility in the province so most of the Canadian “oil” sunflower
production is either processed in the province for the birdfood market or exported as a raw product to
crush facilities in the United States.
Imports from the U.S. are forecast to lift in 2016/2017 as a result of lower domestic supplies. In
2015/2016, imports are forecast to fall slightly due to adequate domestic supplies in Canada. Exports
are forecast to rise in 2016/2017 due to high domestic supplies resulting from higher carry-in and
anticipated lower supplies in the United States. The United States is the largest export market for
Canadian sunflowers, with between 74 percent and 78 percent market share. Canadian exports are
expected to reach 34,000 tons in 2015/2016, 6,000 tons lower than the USDA official estimates, based
on lower year-to-date pace. Higher domestic supplies in the United States are limiting Canadian
sunflower seed exports. Most of the sunflower seeds exported to the United States are confectionary-
type seeds. Mexico will typically import up to 1 TMT of oil-type sunflower seeds for bird-seed use.
OILMEALS
Canada: Total Oilmeals
2016/2017 Canola (Rapeseed) Soybean TOTAL
Crush 8,000 1,750 9,750
Production 4,400 1,380 5,780
Imports 20 950 970

10
Exports 3,850 164 4,014
2015/2016 Canola (Rapeseed) Soybean TOTAL
Crush 8,200 2,000 10,200
Production 4,600 1,450 6,050
Imports 15 920 935
Exports 4,100 230 4,330
2014/2015 Canola (Rapeseed) Soybean TOTAL
Crush 7,357 1,787 9,144
Production 4,150 1,394 5,544
Imports 23 933 956
Exports 3,642 212 3,854
All data in 1,000 hectares and 1,000 metric tons.
Marketing year: Aug/July except peanuts which is Oct/Sept.
Total crush is forecast to fall to 9.75 MMT in 2016/2017 due to a decrease in domestic supplies of
oilseeds resulting from low carry-in and a return to trend yields. As a result, total meal production is
forecast to fall to 5.78 MMT, a decrease of 4.5 percent from the 2015/2016 anticipated production levels
of 6.05 MMT. High domestic canola and soybean supplies, increased crush capacity, good crush
margins, and a weaker Canadian dollar against the U.S. dollar has led to record high meal production in
2015/2016.
Meal imports in 2016/2017 are forecast to increase to 970 TMT, 3.74 percent above 2015/2016
anticipated levels due to lower domestic crush. Canola meal imports in 2015/2016 are limited by high
domestic production/supplies.
Total meal exports in 2016/2017 will be limited by lower crush levels and low carry-in. Total meal
exports are forecast to fall to 4.0 MMT from 4.33 MMT in 2014/15, a 7 percent decline from the
previous year’s level. High crush volumes due to higher domestic crush capacity and supplies,
combined with a weaker Canadian dollar against the American dollar have supported strong exports of
meal in 2015/2016.
CANOLA (RAPESEED) MEAL
Production Supply and Distribution Estimates:
Meal, Rapeseed 2014/2015 2015/2016 2016/2017
Market Begin Year Aug 2014 Aug 2015 Aug 2016
Canada USDA
Official New Post
USDA Official
New Post
USDA Official
New Post
Crush 7357 7357 8100 8200 0 8000
Extr. Rate, 999.9999 0.5641 0.5641 0.5642 0.561 0 0.55
Beginning Stocks 91 91 114 114 0 94
Production 4150 4150 4570 4600 0 4400
MY Imports 23 23 12 15 0 20

11
MY Imp. from U.S. 14 14 10 13 0 15
MY Imp. from EU 1 1 0 0 0 0
Total Supply 4264 4264 4696 4729 0 4514
MY Exports 3615 3642 4100 4100 0 3850
MY Exp. to EU 2 2 2 0 0 0
Industrial Dom. Cons. 0 0 0 0 0 0
Food Use Dom. Cons. 0 0 0 0 0 0
Feed Waste Dom. Cons.
535 508 535 535 0 530
Total Dom. Cons. 535 508 535 535 0 530
Ending Stocks 114 114 61 94 0 134
Total Distribution 4264 4264 4696 4729 0 4514
(1000 MT) ,(PERCENT)
Canola is crushed for its oil and the canola meal is sold at a discount compared to soybean meal due to
its lower protein content. The majority of the canola meal produced in Canada is exported to the United
States (California) for use in the dairy industry. Canola meal, when added to the dairy cow’s diet, has
proven to boost milk production.
Canola meal production in 2016/2017 is forecast to fall to 4.4 MMT as a result of lower domestic
supplies. Canola meal production in 2015/2016 is forecast to reach record high levels of 4.6 MMT due
to an increase in crush capacity and large domestic supplies available for crush. This is 30,000 tons
higher than USDA official estimates and is based on an expectation of higher crush.
Nearly all canola meal is exported to the United States (California dairy industry) and has been growing
as Canadian crush capacity has increased. In 2016/2017, lower domestic supplies will lead to lower
meal exports in 2016/2017. In 2015/2016, ample domestic supplies, increased domestic crush capacity
and a weaker Canadian dollar against the American dollar is expected to result in canola meal exports
reaching 4.1 MMT.
Growth in domestic demand from the Canadian dairy industry, despite canola meal proven to be a
valuable input in feed, is limited due to Canada having self-imposed regulations that put restrictions on
milk production. For these reasons, Post has forecasted domestic usage for feed in 2016/2017 and
2015/2016 at similar levels.
SOYBEAN MEAL
Production Supply and Distribution Estimates:
Meal, Soybean 2014/2015 2015/2016 2016/2017
Market Begin Year Aug 2014 Aug 2015 Aug 2016
Canada USDA
Official New Post
USDA Official
New Post
USDA Official
New Post
Crush 1787 1787 2150 2000 0 1750

12
Extr. Rate, 999.9999 0.7801 0.7801 0.7791 0.775 0 0.7886
Beginning Stocks 17 17 32 32 0 22
Production 1394 1394 1675 1550 0 1380
MY Imports 933 933 950 920 0 950
MY Imp. from U.S. 916 916 850 850 0 900
MY Imp. from EU 0 0 0 0 0 0
Total Supply 2344 2344 2657 2502 0 2352
MY Exports 212 212 275 230 0 164
MY Exp. to EU 25 25 25 25 0 25
Industrial Dom. Cons. 0 0 0 0 0 0
Food Use Dom. Cons. 0 0 0 0 0 0
Feed Waste Dom. Cons.
2100 2100 2330 2250 0 2158
Total Dom. Cons. 2100 2100 2330 2250 0 2158
Ending Stocks 32 32 52 22 0 30
Total Distribution 2344 2344 2657 2502 0 2352
(1000 MT) ,(PERCENT)
Soybean meal produced in Canada is primarily consumed in the domestic livestock industry. Soybean
meal production in 2016/2017 is forecast to fall to 1.38 MMT due to lower domestic supplies available
for crush. In 2015/2016, high domestic supplies are expected to push soybean meal production to a
record high of 1.55 MMT. This is lower than USDA official estimates of 1.675 TMT and is based on
crush pace to-date.
Imports in 2016/2017 are forecast to rise due to tighter domestic supplies. Imports in 2015/2016 are
forecast to fall to 920,000 tons as a result of ample domestic supplies and a weaker Canadian dollar.
This is 30,000 tons lower than USDA official estimates and is based on import pace to date which is
below average. Nearly all soymeal is imported from the United States.
For 2016/2017, exports are forecast to fall 66,000 tons below 2015/2016 anticipated levels of 230,000
tons due to lower supplies. In 2015/2016, higher meal production, a weaker Canadian dollar against the
U.S. dollar and strong demand from the United States led to increased exports. U.S. export pace is 42
percent above the previous year for the same time period (Aug-Feb).
Feed consumption in 2016/2017 is forecast to decrease slightly due to lower domestic supplies resulting
from lower crush. While there seems to be some loosening of provincial policies in Western Canada
that have been restricting hog expansion, any increase in hog production will be very gradual. The
repealing of the Country of Origin Labelling (COOL) legislation is also expected to have little impact
on feed consumption in the next crop year. In 2015/2016 feed use is expected to reach 2.25 MMT due
to higher domestic supplies. It is 80,000 tons lower than USDA estimate and reflects the difference in
official USDA and Post estimates for crush.
13
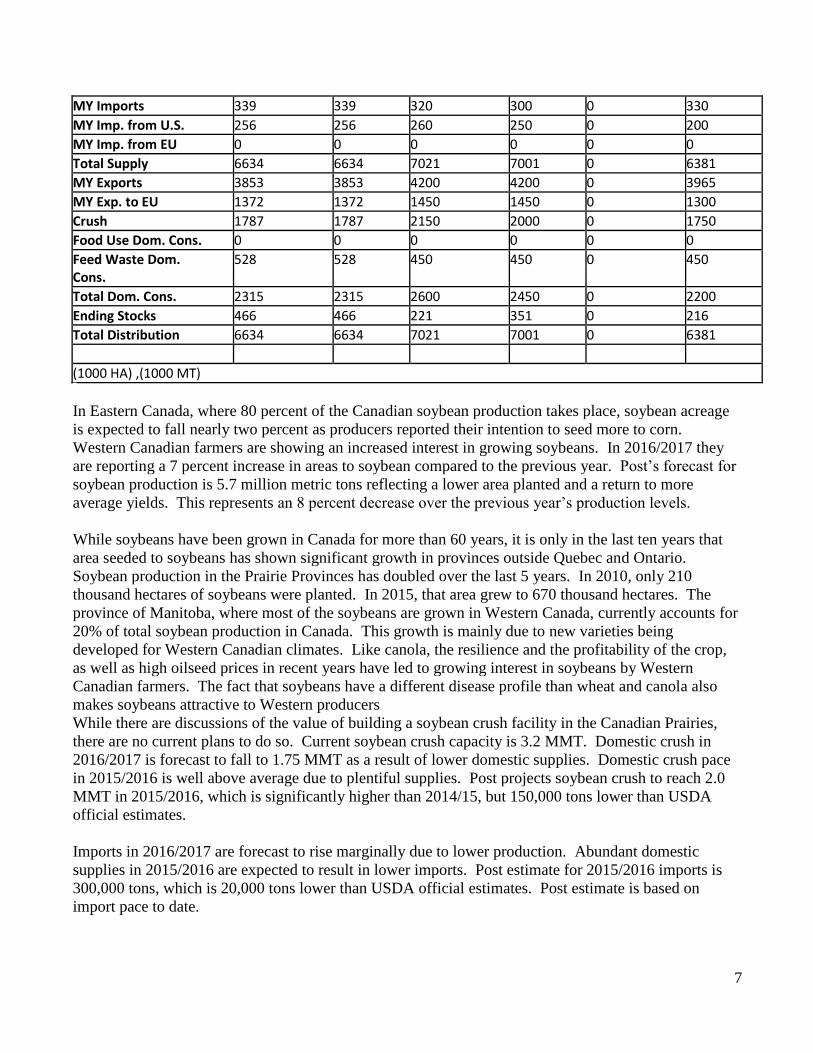
OILS
Canada: Total Oils
2016/2017 Canola (Rapeseed) Soybean TOTAL
Crush 8,000 1,750 9,750
Production 3,450 315 3,765
Imports 45 35 80
Exports 2,790 123 2,913
2015/2016 Canola (Rapeseed) Soybean TOTAL
Crush 8,200 2,000 10,200
Production 3,550 364 3,914
Imports 42 30 72
Exports 2,830 170 3,000
2014/2015 Canola (Rapeseed) Soybean TOTAL
Crush 7,357 1,787 9,144
Production 3,201 320 3,521
Imports 31 34 65
Exports 2,407 118 2,525
All data in 1,000 hectares and 1,000 metric tons.
Marketing year: Aug/July except peanuts which is Oct/Sept.
14
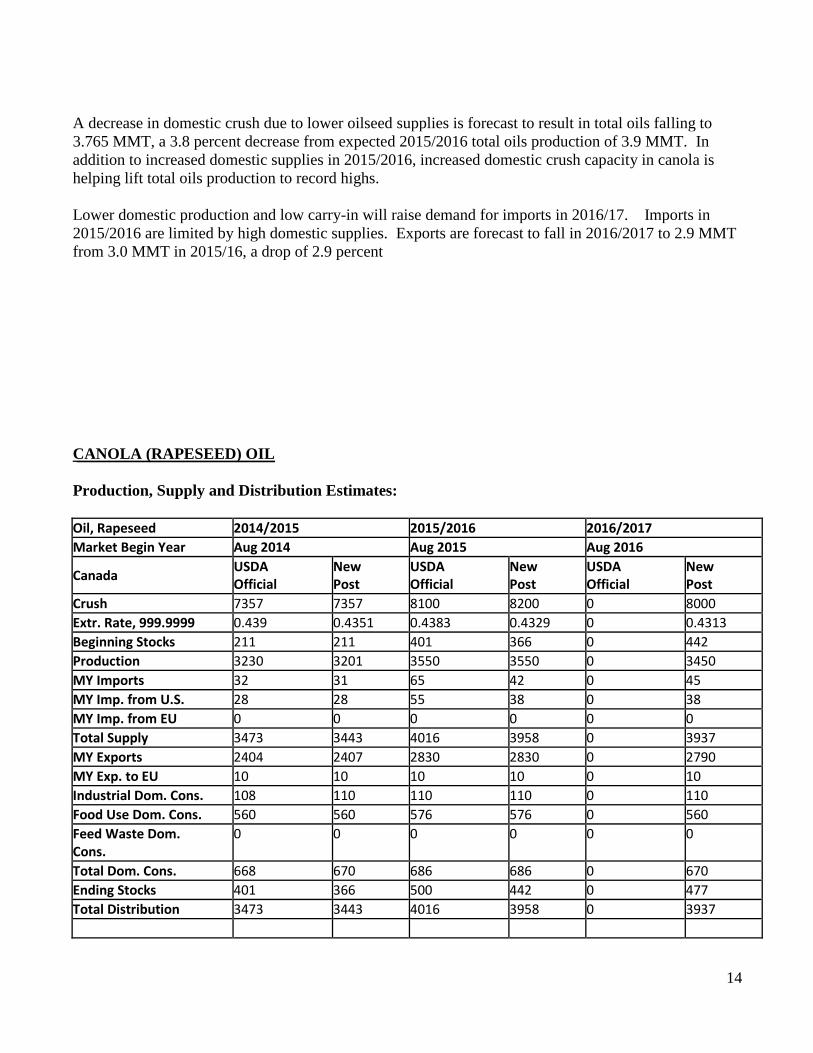
A decrease in domestic crush due to lower oilseed supplies is forecast to result in total oils falling to
3.765 MMT, a 3.8 percent decrease from expected 2015/2016 total oils production of 3.9 MMT. In
addition to increased domestic supplies in 2015/2016, increased domestic crush capacity in canola is
helping lift total oils production to record highs.
Lower domestic production and low carry-in will raise demand for imports in 2016/17. Imports in
2015/2016 are limited by high domestic supplies. Exports are forecast to fall in 2016/2017 to 2.9 MMT
from 3.0 MMT in 2015/16, a drop of 2.9 percent
CANOLA (RAPESEED) OIL
Production, Supply and Distribution Estimates:
Oil, Rapeseed 2014/2015 2015/2016 2016/2017
Market Begin Year Aug 2014 Aug 2015 Aug 2016
Canada USDA Official
New Post
USDA Official
New Post
USDA Official
New Post
Crush 7357 7357 8100 8200 0 8000
Extr. Rate, 999.9999 0.439 0.4351 0.4383 0.4329 0 0.4313
Beginning Stocks 211 211 401 366 0 442
Production 3230 3201 3550 3550 0 3450
MY Imports 32 31 65 42 0 45
MY Imp. from U.S. 28 28 55 38 0 38
MY Imp. from EU 0 0 0 0 0 0
Total Supply 3473 3443 4016 3958 0 3937
MY Exports 2404 2407 2830 2830 0 2790
MY Exp. to EU 10 10 10 10 0 10
Industrial Dom. Cons. 108 110 110 110 0 110
Food Use Dom. Cons. 560 560 576 576 0 560
Feed Waste Dom. Cons.
0 0 0 0 0 0
Total Dom. Cons. 668 670 686 686 0 670
Ending Stocks 401 366 500 442 0 477
Total Distribution 3473 3443 4016 3958 0 3937

15
(1000 MT) ,(PERCENT)
Lower area seeded to canola is forecasted for 2016/2017, and therefore less canola for crush will pull
canola oil production down to 3.45 MMT. In 2015/2016, high domestic supplies of canola seed, good
crush margins, and increased crush capacity coming on line is expected to result in canola oil production
levels of 3.55 MMT. This is in line with USDA official estimates, despite Post forecasting a higher
level of crush. Based on crush statistics to date, the oil extraction rate is higher than the rate used by
USDA official.
In 2016/2017, industrial usage of canola oil is forecast to remain unchanged from 2015/2016 levels due
to no change being anticipated in Canadian renewable fuel standard mandates.
Canola oil imports in 2016/2017 are forecast to increase slightly due to lower production and supplies.
Post forecast for canola oil imports in 2015/2016 is 42,000 tons, 23,000 tons below USDA official
estimates and is based on import pace to-date. Canola oil exports in 2016/2017 are projected down to
2.79 MMT slightly below 2015/2016’s estimate of 2.83. Year-to-date export data shows that China has
doubled its canola oil imports from Canada, while the United States, the largest export market for
Canada, is on track to import similar volumes to the previous year. Much of the canola oil shipped to the
United States goes into biodiesel production in order to meet a U.S. federal renewable fuels standard
mandate.
SOYBEAN OIL
Production, Supply and Distribution Estimates:
Oil, Soybean 2014/2015 2015/2016 2016/2017
Market Begin Year Aug 2014 Aug 2015 Aug 2016
Canada USDA
Official New Post
USDA Official
New Post
USDA Official
New Post
Crush 1787 1787 2150 2000 0 1750
Extr. Rate, 999.9999 0.1791 0.1791 0.1791 0.182 0 0.18
Beginning Stocks 9 9 20 20 0 19
Production 320 320 385 364 0 315
MY Imports 34 34 30 30 0 35
MY Imp. from U.S. 34 34 30 30 0 34
MY Imp. from EU 0 0 0 0 0 0
Total Supply 363 363 435 414 0 369
MY Exports 118 118 170 170 0 123
MY Exp. to EU 0 0 0 0 0 0
Industrial Dom. Cons. 0 0 0 0 0 0
Food Use Dom. Cons. 225 225 240 225 0 226
Feed Waste Dom. Cons.
0 0 0 0 0 0
Total Dom. Cons. 225 225 240 225 0 226
Ending Stocks 20 20 25 19 0 20
16
Total Distribution 363 363 435 414 0 369
(1000 MT) ,(PERCENT)
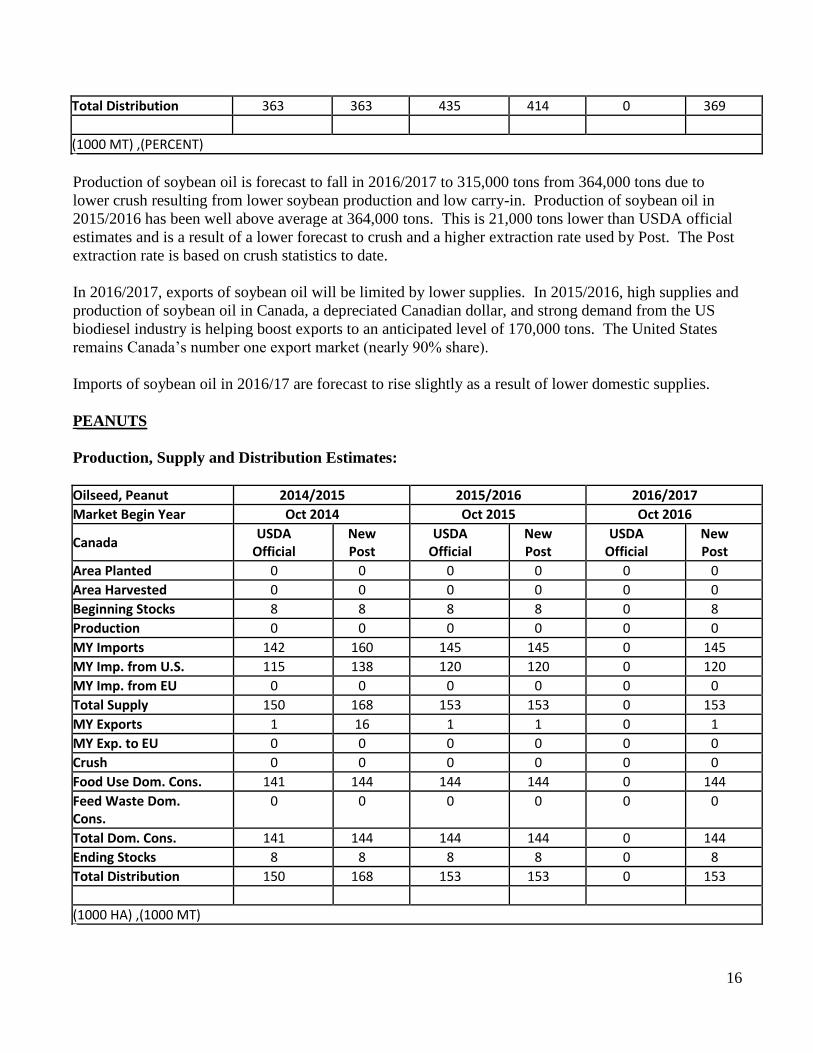
Production of soybean oil is forecast to fall in 2016/2017 to 315,000 tons from 364,000 tons due to
lower crush resulting from lower soybean production and low carry-in. Production of soybean oil in
2015/2016 has been well above average at 364,000 tons. This is 21,000 tons lower than USDA official
estimates and is a result of a lower forecast to crush and a higher extraction rate used by Post. The Post
extraction rate is based on crush statistics to date.
In 2016/2017, exports of soybean oil will be limited by lower supplies. In 2015/2016, high supplies and
production of soybean oil in Canada, a depreciated Canadian dollar, and strong demand from the US
biodiesel industry is helping boost exports to an anticipated level of 170,000 tons. The United States
remains Canada’s number one export market (nearly 90% share).
Imports of soybean oil in 2016/17 are forecast to rise slightly as a result of lower domestic supplies.
PEANUTS
Production, Supply and Distribution Estimates:
Oilseed, Peanut 2014/2015 2015/2016 2016/2017
Market Begin Year Oct 2014 Oct 2015 Oct 2016
Canada USDA
Official New Post
USDA Official
New Post
USDA Official
New Post
Area Planted 0 0 0 0 0 0
Area Harvested 0 0 0 0 0 0
Beginning Stocks 8 8 8 8 0 8
Production 0 0 0 0 0 0
MY Imports 142 160 145 145 0 145
MY Imp. from U.S. 115 138 120 120 0 120
MY Imp. from EU 0 0 0 0 0 0
Total Supply 150 168 153 153 0 153
MY Exports 1 16 1 1 0 1
MY Exp. to EU 0 0 0 0 0 0
Crush 0 0 0 0 0 0
Food Use Dom. Cons. 141 144 144 144 0 144
Feed Waste Dom. Cons.
0 0 0 0 0 0
Total Dom. Cons. 141 144 144 144 0 144
Ending Stocks 8 8 8 8 0 8
Total Distribution 150 168 153 153 0 153
(1000 HA) ,(1000 MT)

17
Peanut production in Canada is constrained by climatic conditions. Agriculture extension reports
indicate that a minimum of 3,000 corn heat units is required for normal growth and development.
Peanuts grown in areas with fewer heat units will not reach optimum maturity and generally the yield is
too low to justify commercial production. As a result, minor peanut production is limited to a few farms
in southern Ontario that plant in the range of 200-400 hectares. As a result, Canada is a net importer of
peanuts with the United States and China being the top suppliers.
POLICY DEVELOPMENTS:
Change in Government:
In October 2015, the federal Liberal Party of Canada won a majority government and the former
Conservative government now forms the official opposition. With the change of government comes a
demographic shift that has resulted in the most urban-based government in Canadian history. Some
industry observers are worried that this may make it more difficult for agricultural issues such as market
access, access to labor, low level presence and transportation to receive priority attention. Shortly after
the government took power, the Prime Minister made public the mandate letters he sent to his
Ministers. The mandate letters set the objectives that each Ministry in the government must work
towards. The new government prioritized infrastructure, trade, and climate change which may be good
for Canadian grains and oilseed producers who are heavily dependent on exports markets. The climate
change agenda does not focus on biofuels, however, there may still be opportunities within that policy
space for Canadian agricultural producers to demonstrate and market their contribution to greenhouse
gas reductions.
Transportation:
Transportation is one area where the government has signaled it will put its resources. The Canadian
Minster of Transport tabled the Canada Transportation Act (CTA) Review report in late February 2016.
The review, which was to occur in 2015, was launched ahead of schedule due to a transportation log
jam that impacted the agricultural sector heavily. The review is an exercise to identify the priorities and
actions in the transportation sector needed to support Canada's long-term economic well-being. For the
Canadian grains and oilseed sector, so heavily reliant on exports, an efficient grain handling system is
the life blood of the industry. To date, the government has made no official comment on the report
recommendations.
With the collapse of the oil prices in late 2015 and 2016, the extra capacity in the rail system, combined
with new dedicated rail programs put forth by the railway companies, has meant that railway capacity

18
has been able to meet increased demand from the oilseed sector that needs to get the crop to export
positions. Railway performance continues to be monitored very closely.
Weekly and monthly reports will be available at www.grainmonitor.ca. In addition, weekly reporting
by corridor on rail car supply is being made available by the Ag Transport Coalition at the following
URL address: www.agtransportcoalition.com.
Provincial Restrictions of Use of Neonicotinoids in Crops:
In efforts to address issues of pollinator health, Quebec and Ontario, provinces where the production of
corn and soybeans is most prominent, have both put forward regulatory approaches to restrict the use of
neonicotinoids in crops. In the western provinces, where pollinators are an important factor in canola
production, the approach to addressing issues on bee health is largely centered on best practices to
reduce exposure. In Ontario, new regulatory requirements for the sale and use of neonicotinoid-treated
seeds have been in effect since July 2015, therefore this year (2016) will be the planting season that the
seed sellers and grains producers will have to comply. In late November 2015, Quebec announced its
intentions to create regulations restricting the usage of what it has determined to be the highest risk
pesticides, defined as neonicotinoids, atrazine, and chlorpyrifos, as part of a broader pesticide strategy.
Both provinces will restrict the usage of neonicotinoid-treated corn and soybean only to cases where
there is a demonstrated pest problem and will render mandatory any neonicotinoid-coated seed use to be
justified in advance by a professional agronomist. For Ontario, the ultimate objective of the regulations
is to reduce the number of acres planted with neonicotinoid-treated corn and soybean by 80 percent by
the 2017 planting season. For Quebec, who are at the beginning of the development of their regulations,
the objective is to completely eliminate the use of what they have identified as the “highest risk”
pesticides. The regulations have been extremely unpopular with producers in both provinces and have
not gone unchallenged. The Grain Farmers of Ontario formally challenged the regulations but lost and
have recently appealed the decision. Whether or not they will win the right to appeal the decision is
unknown at the time of this report. Farmers warn that the productivity (yields) of their crops will suffer
and costs will go up as they will have to spend more on inputs to manage pests in their crops.
Most seed-corn imported from the United States is treated and approximately half of soybean seed from
the United States is also coated. The new policy may have a detrimental effect on seed imports but at
this time it is hard to determine as the differentiation between treated seed and non-treated seed cannot
be made in the trade data.
Trade Agreements:
Canada is working towards ratification of two trade deals that show promise for increased market access
in the European Union and into member countries of the Trans Pacific Partnership (TPP). Progression
towards ratification is slow however. The Canadian government has stated that it hopes to have the
trade deal implemented in early 2017 but some recent legal developments make that timeline doubtful.
The Canadian canola industry is looking forward to the implementation of the Canada-Europe
Comprehensive Economic and Trade Agreement. The industry sees two main benefits from the
agreement – the elimination of oil tariffs and provision to reduce biotechnology related non-tariff
19
barriers. Tariffs on canola oil will be eliminated immediately upon implementation and the industry
estimates that this could provide exporters the opportunity to increase sales by up to 90 million dollars.
The canola sector sees increased access into Vietnam and Japan as gains for the canola industry, should
Canada ratify the TPP. While Japan is a reliable buyer of canola seed, tariffs of 15% have limited
canola oil exports to Japan. The Canadian canola industry is hopeful that once the TPP is fully
implemented, Japan may shift from seed to importing more, higher-value products such as canola oil.
The Canadian oilseed industry, which is dependent on biotech technology, is also pleased on the
inclusion of commitments to prevent biotechnology related measures from being used as trade barriers.