Canada Dairy and Products Annual 2017 - USDA GAIN Publications/Dairy and... · ... growth and an...
12
THIS REPORT CONTAINS ASSESSMENTS OF COMMODITY AND TRADE ISSUES MADE BY USDA STAFF AND NOT NECESSARILY STATEMENTS OF OFFICIAL U.S. GOVERNMENT POLICY Date: GAIN Report Number: Approved By: Prepared By: Report Highlights: Canadian markets for milk, butter, cheese, and skim milk powder will remain unsettled in the short- term as supply and distribution patterns respond to sustained increases in consumer demand for butterfat and major policy changes. Implementation of the Comprehensive Economic and Trade Agreement, in late 2017, would create additional market access for European dairy products and further uncertainty in the Canadian market. FAS/Ottawa anticipates that Canada will export record high volumes of skim milk powder in 2017 and 2018. Keywords: Canada, GAIN CA17043, Dairy Megan Francic, Agricultural Attaché Evan Mangino, Agricultural Attaché 2017 Dairy and Products Annual Canada CA17043 11/29/2017 Required Report - public distribution
Transcript of Canada Dairy and Products Annual 2017 - USDA GAIN Publications/Dairy and... · ... growth and an...
THIS REPORT CONTAINS ASSESSMENTS OF COMMODITY AND TRADE ISSUES MADE
BY USDA STAFF AND NOT NECESSARILY STATEMENTS OF OFFICIAL U.S.
GOVERNMENT POLICY
Date:
GAIN Report Number:
Approved By:
Prepared By:
Report Highlights:
Canadian markets for milk, butter, cheese, and skim milk powder will remain unsettled in the short-
term as supply and distribution patterns respond to sustained increases in consumer demand for
butterfat and major policy changes. Implementation of the Comprehensive Economic and Trade
Agreement, in late 2017, would create additional market access for European dairy products and
further uncertainty in the Canadian market. FAS/Ottawa anticipates that Canada will export record
high volumes of skim milk powder in 2017 and 2018.
Keywords: Canada, GAIN CA17043, Dairy
Megan Francic, Agricultural Attaché
Evan Mangino, Agricultural Attaché
2017
Dairy and Products Annual
Canada
CA17043
11/29/2017
Required Report - public distribution
Commodities:
Executive Summary:
Due to the structure of the supply management system and its reduced ability to rapidly adjust to
the changing market, increased domestic production of cream and butter has created an excess of
skim milk powder (SMP). Following the recent introduction of Class 7, Canadian SMP exports
increased. FAS/Ottawa forecasts that calendar years (CY) 2017 and 2018 will be record years
for Canadian SMP exports, with exports climbing to 75,000 metric tons (MT) and 80,000 MT,
respectively. SMP exports are predicted to follow Canadian demand for butterfat, which has
been growing at a faster pace than increases in production quota. As butter stocks stabilize and
Canada draws down SMP stocks, SMP export growth is expected to taper off. However,
FAS/Ottawa predicts that Canadian SMP exports will continue to exceed historical levels.
Canadian SMP exports to Mexico and Algeria have grown considerably and are expected to
expand into new markets in 2018.
Sources anticipate the opening of the Comprehensive Economic and Trade Agreement (CETA)
cheese quota in 2017 could reduce domestic production of specialty cheeses, as more cheese is
imported from the EU. While consumer demand for specialty cheese remains robust, the effects
of CETA should gradually build over time, as the EU quota is phased in over five years.
MILK:
Dairy, Milk, Fluid 2016 2017 2018
Canada USDA Official
New Post USDA Official
New Post USDA Official
New Post
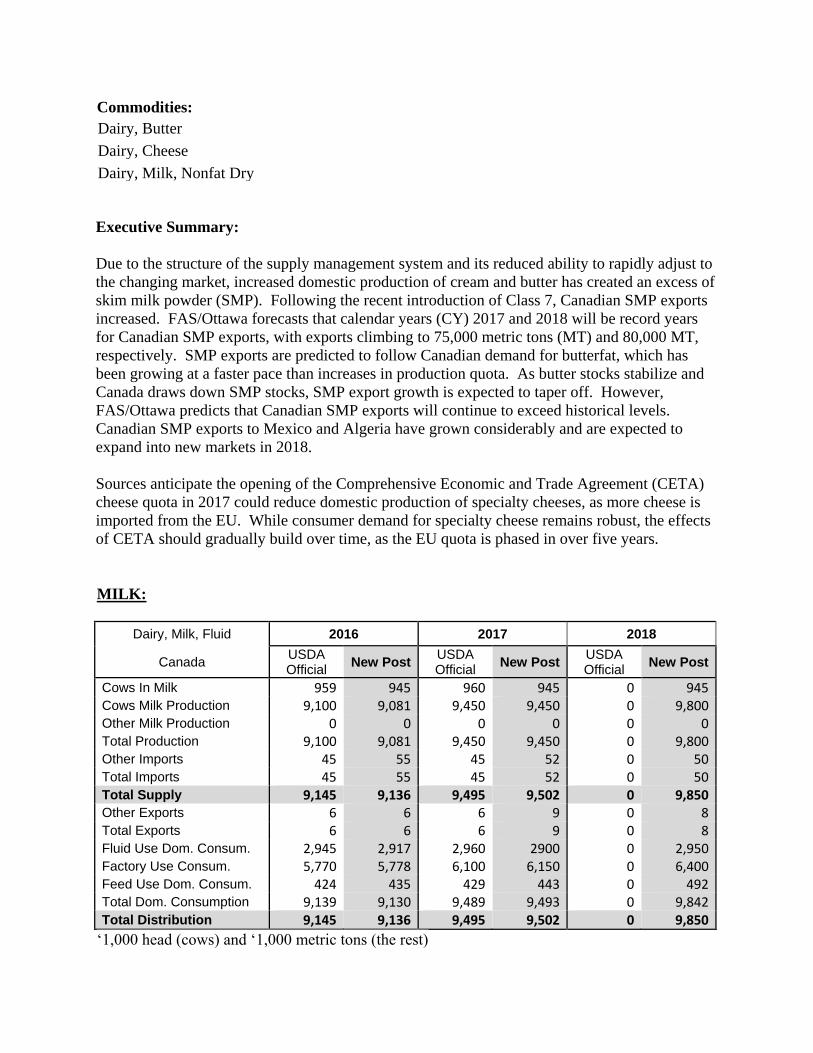
Cows In Milk 959 945 960 945 0 945 Cows Milk Production 9,100 9,081 9,450 9,450 0 9,800 Other Milk Production 0 0 0 0 0 0 Total Production 9,100 9,081 9,450 9,450 0 9,800 Other Imports 45 55 45 52 0 50 Total Imports 45 55 45 52 0 50 Total Supply 9,145 9,136 9,495 9,502 0 9,850 Other Exports 6 6 6 9 0 8 Total Exports 6 6 6 9 0 8 Fluid Use Dom. Consum. 2,945 2,917 2,960 2900 0 2,950 Factory Use Consum. 5,770 5,778 6,100 6,150 0 6,400 Feed Use Dom. Consum. 424 435 429 443 0 492 Total Dom. Consumption 9,139 9,130 9,489 9,493 0 9,842 Total Distribution 9,145 9,136 9,495 9,502 0 9,850
‘1,000 head (cows) and ‘1,000 metric tons (the rest)
Dairy, Milk, Nonfat Dry
Dairy, Cheese
Dairy, Butter
Production:
Milk produced in Canada supplies two markets. The fluid milk market includes fluid milk for
direct consumption, creams, and flavored milks. The industrial milk market is milk used to
make products such as butter, cheese, yogurt, ice cream, and milk powders. In recent years, the
fluid milk market accounted for about one third of total milk produced in Canada, and the
industrial milk market for just over 60 percent. On-farm use is estimated to account for
approximately five percent of total milk produced.
Quota is allocated on a butterfat basis. The national Canadian Milk Supply Management
Committee (CMSMC) sets the Total Quota based on the recommendations of the Canadian
Dairy Commission (CDC). The CDC monitors the trends in Canadian dairy requirements and
makes recommendations for adjustments to reflect changes in demand for milk. The CMSMC
also applies the terms of the National Milk Marketing Plan (a federal-provincial agreement) to
establish each province’s share. Quota increases and decreases are shared among regional pools,
the P5, or Eastern Canadian Milk Pool, which includes Prince Edward Island, Nova Scotia, New
Brunswick, Quebec, and Ontario, and the Western Milk Pool, which is made up of Manitoba,
Saskatchewan, Alberta, and British Columbia. Each pool is then responsible for distributing
shares of the quota to producers according to provincial policies and in accordance with pooling
agreements.
Recently, there have been a series of quota increases to address the growing demand for butterfat
and short butter stocks. On November 1, 2017, the P5 Board approved a one percent producer
saleable quota increase because butter stocks had not reached the targeted level. This followed a
July 1, 2017 increase where the Board approved a five percent producer saleable quota increase
in order to “ensure P5 milk production continues to fill all current demand, as butter stocks have
not surpassed their updated target level of 35,000 MT.”1 The P5 board also approved a two
percent producer saleable quota increase effective December 1, 2016. The P5 board cited strong
demand growth (between 3-5 percent annually) and the need to rebuild butter stocks as the
reason for the increase. In addition, the Board approved that one incentive day be issued per
month on a non-cumulative basis to conventional (i.e., non-organic) producers for every month
from December 2016 to June 2017, two days in August, three days each from September to
November 2017, and one day each from December 2017 to March 2018.2 Incentive days issued
in milk marketing year (MY) 2017/2018 are roughly on par with those issued in MY 2016/2017.
The Western Milk Pool has also agreed to eliminate the solids-not-fat to butter fat ratio
requirement by August 1, 2018 to further encourage increased butterfat production. In addition,
the Western Pool approved a 1.5 percent quota increase in January 2017, a 2 percent increase in
both February and March 2017, and a 2 percent per month quota issuance increase for
September, October, and November 2017.
1 Dairy Farmers of New Brunswick, “Milk Matters.” https://www.nbmilk.org/downloads/milk-
matters/July%202017%20Milk%20Matters.pdf 2 According to the Dairy Farmers of Ontario, “to encourage increased production in the fall months, all producers
may be given additional fall incentive credits based on their daily quota allotment. The level of fall incentive credits
is announced each year prior to the fall period. In addition, incentive days may also be used to encourage milk
production in response to market conditions.” Source:
https://www.milk.org/Corporate/View.aspx?Content=Farmers/ProgramsAndPolicies. During one incentive day, a
producer can produce the equivalent of one extra day of his/her quota.

More on the Canadian supply management system can be found at the following website:
http://www.cdc-ccl.gc.ca/CDC/index-eng.php?id=3806
Based on eight months of production data of milk produced for the fluid and industrial milk
markets, 2017 total milk production is estimated to reach 9.45 million metric tons (MMT). In
2018, total milk production is forecast to reach a record 9.8 MMT in order to meet the growing
demand for butterfat from the dairy processing industry on the industrial side, as well as the
growing demand for table cream.
According to industry, processors are running at near capacity, though processing capacity is
growing.
Trade:
The total milk import level is set at 64.5 thousand metric tons (TMT). Due to market proximity
and the perishable nature of fluid milk and cream, the United States is the primary source for
imports. Milk and cream imports enter Canada under personal use exemptions (General Import
Permit No. 1 - Dairy Products for Personal Use). The volume of milk purchased through cross-
border shopping is not expected to change significantly due to ingrained shopping habits and the
attractiveness of U.S. milk prices compared to those in Canada.
Commercial milk imports are also eligible under Global Affairs Canada’s Import for Re-Export
Program (IREP) and under Canada Border Service Agency’s Duties Relief Program (DRP).
Because of program regulations, imports, and therefore re-exports, are limited.
Total milk imports are estimated to decrease slightly from 55 TMT in 2016 to 52 TMT in 2017
due to expanded Canadian production and stable demand. In 2018, imports are forecast to
continue to fall to 50 TMT. However, since August 1, 2017, supplementary imports of cream
have reached 10,816 MT as retail and food service demand remains strong.
Total milk exports from Canada are small due to export subsidy limitations and the supply
management system which limits the transportation of milk across provincial borders. In 2017,
milk exports are expected to rise to 9 TMT on increased sales to the United States during the
first eight months of the year, but fall to 8 TMT in 2018, as market balance is restored.
Consumption:
While per capita consumption of drinking milk has fallen about one percent in 2017, population
growth and an increase in cream consumption has resulted in total consumption of fluid milk
remaining unchanged. Cream consumption has increased due to the popularity of coffee culture
and the changing consumer preference for higher fat content products. For example, industry
sources have observed an increase in sales of whipping cream, which has 32-35 percent
butterfat. In addition, consumers are switching from skim milk to higher fat content drinking
milk, following the trend in the Canadian market to return to higher fat diets.

BUTTER:
Dairy, Butter 2016 2017 2018
Canada USDA Official
New Post USDA Official
New Post USDA Official
New Post
Beginning Stocks 10 10 15 12 0 30 Production 95 93 100 120 0 127 Other Imports 27 26 30 25 0 25 Total Imports 27 26 30 25 0 25 Total Supply 132 129 145 157 0 182 Other Exports 1 1 1 1 0 1 Total Exports 1 1 1 1 0 1 Domestic Consumption 116 116 127 126 0 143 Total Use 117 117 128 127 0 144 Ending Stocks 15 12 17 30 0 38 Total Distribution 132 129 145 157 0 182
‘1,000 metric tons
Production:
FAS/Ottawa forecasts an increase in butter production in both 2017 and 2018 to meet the strong
demand for butterfat and to continue to rebuild butter stocks.
Based on 8 months of production data, FAS/Ottawa estimates that butter production will reach
120 TMT in 2017. This is an almost 30 percent increase in butter production over 2016.
FAS/Ottawa forecasts butter production to climb to 127 TMT in 2018, a 6 percent increase over
2017 levels.
Trade:
Butter imports span three HS codes: 0405.10.00 for butter; 0405.90.00 for fats and oils derived
from milk; and, 0405.20.00 for dairy spreads which contain butter. The butter import access
level is determined on a dairy year basis (August 1-July 31). The access quota of 3,274 MT
applies only to the butter and fats and oils from milk. Nearly two-thirds of the 2,000 MT World
Trade Organization (WTO) tariff rate quota (TRQ) is allocated as a country-specific allocation
to New Zealand.
FAS/Ottawa estimates 2017 butter imports at 25 TMT, and forecasts the same level in 2018, as
Canadian butter supplies remain tight. By 2018, stock levels should rebound and increased
Canadian production should offset the need for increased imports. 2017 butter import levels are
down slightly from 2016, as Canada policies have driven increased butter production, rather than
expanding imports, through production quota growth. However, domestic shortages of butter
continue and, since August 1, 2017, supplementary imports of butter have reached 5,876 MT.
Utilization of IREP and DRP programs also impact butter import levels.
Canadian butter exports are limited by export subsidy commitments of 3.5 TMT or C$11.025
million, whichever is reached first in a 12-month period. Butter exports tend to be small due to
the fact that supply management is structured around meeting domestic needs for butterfat first,

resulting in little surplus to export. Exports to the United States remain constant, and
FAS/Ottawa estimates that butter exports in 2017 will remain at 1 TMT. In 2018, exports are
forecast to remain unchanged at 1 TMT.
Consumption:
Butter consumption has been growing rapidly over the past 5 years, and is estimated to increase
an additional 8 percent from 2016 to 2017, reaching 126 TMT. In 2018, another robust increase
in consumption is forecast, as butter demand will remain strong. FAS/Ottawa forecasts
consumption will expand by 13 percent to reach 143 TMT.
Stocks:
Stocks were at low levels in late 2016 and early 2017, as butterfat demand outstripped the
production levels set by the CMSMC. Industry sources estimate that butter stocks will continue
to be rebuilt over the next 6 to 8 months, topping at approximately 40 TMT.
The CDC has a target level of 35 TMT for butter stocks for 2017. However, based on stocks
data through August, and anticipating seasonal fluctuation around the holiday period, when
butter demand traditionally increases, FAS/Ottawa estimates that stocks will reach 30 TMT in
2017 and will grow to 38 TMT in 2018.
CHEESE:
Dairy, Cheese 2016 2017 2018
Canada USDA Official
New Post USDA Official
New Post USDA Official
New Post
Beginning Stocks 78 81 80 80 0 80 Production 427 445 435 445 0 450 Other Imports 27 27 26 30 0 33 Total Imports 27 27 26 30 0 33 Total Supply 532 553 541 555 0 563 Other Exports 13 13 12 12 0 12 Total Exports 13 13 12 12 0 12 Human Dom. Consumption
439 460 444 463 0 466
Other Use, Losses 0 0 0 0 0 0 Total Dom. Consumption 439 460 444 463 0 466 Total Use 452 473 456 475 0 478 Ending Stocks 80 80 85 80 0 85 Total Distribution 532 553 541 555 0 563
‘1,000 metric tons

Production:
Cheese production has been slowly increasing in response to consumer demand.
In 2017, FAS/Ottawa estimates that cheese production will remain unchanged at 445 TMT, but
forecasts that production will increase 1 percent to 450 TMT in 2018. This increase would be
driven in part by the increased supply of milk proteins, generated as butter and cream production
expands, and the ease of storing cheese for longer periods of time. However, industry sources
have indicated that production of Canadian specialty cheeses, which make up a small portion of
the market, could be significantly offset by the opening of the CETA quota.
Trade:
The commercial quota on cheese is 20,411 MT. Most cheese enters Canada either through the
import quota system, which is filled every year, or through IREP and DRP. Under these two
programs, the cheese is further processed and then re-exported.
The European Union has had country-specific access to 66 percent of the global WTO quota.
The remainder of the quota is non-EU cheese, which is mostly filled by the United States. Due
to the entry into force of the CETA quota and the strong demand, imports will rise to 30 TMT in
2017 and to 33 TMT in 2018. Under CETA, the 2017 quota for industrial cheese is 79 MT, and
the quota for specialty cheese is 745 MT. CETA cheese access will be phased in over 6 years,
and reach 16 TMT in 2022. Please see GAIN CA17032 for a further discussion of CETA cheese
TRQ administration policy and GAIN CA17033 for an overview of support programs to the
dairy sector to prepare for CETA implementation.
Canadian processors and cheese producers are concerned with the opening of the CETA quota,
as they believe it will offset growth in sales of domestic specialty cheeses. In addition, under
CETA, processors and retailers are each allocated half of the quota. However, processors have
expressed dissatisfaction with the rule that any unused quota be reallocated to retailers. While
quota data for 2017 has not yet been published, Canadian industry believes that both processors
and retailers will fill their quota; any unused quota in the first year will likely be a result of
navigating the new program.
Cheese exports are forecast to remain stable in 2017 and 2018, at 12 TMT.
Consumption:
In 2017, cheese consumption levels are estimated at 463 TMT. FAS/Ottawa forecasts this will
increase one percent to 466 TMT in 2018. This is on par with Canadian population growth.
Industry sources indicate that the Canadian market for specialty cheeses is growing, though the
market for all cheese remains stable. Recent immigration patterns have expanded the market for
specialty cheeses from the Middle East and Latin America.
Stocks:
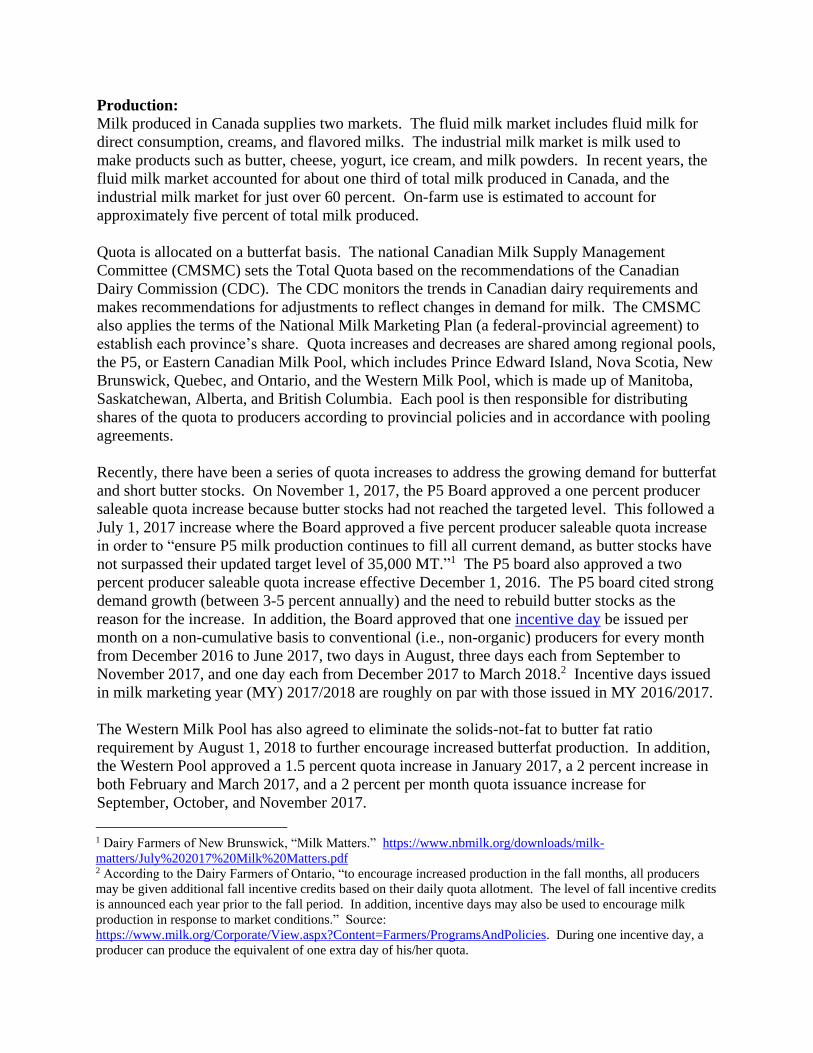
Stocks are estimated to remain stable at 80 TMT in 2017, but are forecast to grow modestly in
2018 and rise to 85 TMT. This change in stocks will be primarily driven by increased lower
quality cheese production, intended to use up excess skim milk solids.
SKIM MILK POWDER:
Dairy, Milk, Nonfat Dry 2016 2017 2018
Canada USDA Official
New Post
USDA Official
New Post
USDA Official
New Post
Beginning Stocks 57 60 80 72 0 45 Production 110 103 115 125 0 140 Other Imports 4 4 2 4 0 4 Total Imports 4 4 2 4 0 4 Total Supply 171 167 197 201 0 189 Other Exports 24 24 45 75 0 80 Total Exports 24 24 45 75 0 80 Human Dom. Consumption
65 69 80 79 0 80
Other Use, Losses 2 2 2 2 0 1 Total Dom. Consumption 67 71 82 81 0 81 Total Use 91 95 127 156 0 161 Ending Stocks 80 72 70 45 0 28 Total Distribution 171 167 197 201 0 189
Production:
Skim milk powder production is expected to rise 21 percent to 125 TMT in 2017, and rise a
further 12 percent to a record 140 TMT in 2018 as a direct result of increased milk production to
meet the need for increased demand for butter and cream.
Quota is assigned based on forecasted domestic butterfat demand. Increases in quota over last
twelve months indicate that Canada would produce its way out of the current butterfat shortage,
rather than increasing imports to meet market demand. As a result of the associated expansion
in butter and cream production, Canadian processors are also generating significantly more
SMP.
As part of Canada’s “National Ingredient Strategy,” Class 7 became effective on February 1,
2017. Class 7, also called the National Ingredient Class, includes milk processed for specific
ingredients, including SMP and whole milk powder. For a further discussion of the introduction
of Class 7 and its effects, please see the current Dairy: World Markets and Trade, published by
the Foreign Agricultural Service.
Industry reports indicate that the new ingredient strategy has supported increased investment by
the Canadian processing sector to help meet growing domestic demand. This has included
additional capacity to process butter, SMP, as well as investments in capacity to create other
milk protein products. However, while industry sources indicate that the Canadian market can
absorb more SMP, processors are constrained in their ability to use the product.
A Chinese manufacturer is building an infant formula plant in Kingston, Ontario, which is
scheduled to open in 2019. The plant would have the capacity to produce 60,000 MT of dry
infant formula. It is estimated that 85 percent of the infant formula would be exported to China.
News reports state that the CDC has been in discussions with the company since April 2016.
A new plant opened in October 2017 in Winnipeg, Manitoba. The facility will create high-value
milk proteins, including MPC 85, MPI 90, and buttermilk powders. The company estimates the
plant will increase Manitoba’s provincial production capacity by 40 percent.
In late 2016, the same company also announced that it would embark on a four-year update of its
processing plants. The first stage would be updating dryers at the Teeswater, Ontario facility to
allow for production of milk protein concentrates and isolates, which are in higher demand than
SMP.
Trade:
SMP enters Canada under the IREP and DRP programs and total volumes vary between 3 and 5
TMT per year. Imports in 2017 are estimated at 4 TMT and are forecast to remain at 4 TMT in
2018.
In its 2016 outlook, the CDC stated that, “Canada’s exports of skim milk and whole milk
powders will not face any challenges in finding markets. South Korea and in particular, Mexico,
are favourable markets for Canadian milk powder exports.”
Following the introduction of Class 7, Canadian SMP exports are estimated to grow to a record
high 75 TMT in 2017, and are forecast to climb to a new record of 80 TMT in 2018 (See Figure
1).
In previous years, SMP exports had been limited by annual export subsidy commitment levels of
45 TMT or outlays of $31 million, whichever came first in a 12-month period. Exports have
increased to record levels and are likely to continue. It is forecast that exports will increase in
the short-term as SMP stocks, built up since 2015, are gradually unwound, and remain above
historical levels.
Consumption:
Following the introduction of Class 7, Canadian processors have been able to access
domestically produced non-fat milk solids at lower prices. Canadian utilization of SMP is
estimated to reach 79 TMT in 2017, which is a 14 percent increase over 2016. SMP
consumption is forecast to remain at similar levels in 2018, reaching 80 TMT.

Stocks:
Recent butter production growth has generated considerable stocks of SMP. However,
following the introduction of Class 7, processors have been able to sell SMP on the world
market at lower prices, allowing Canada to unwind SMP stocks. In 2017, stocks are estimated to
drop to 45 TMT, a decrease of almost 40 percent from 2016. Stocks are forecast to fall even
further in 2018 to 28 TMT.
The CDC stopped purchasing SMP in February 2017, and subsequent SMP stocks have been
privately held. Tracking Canada’s SMP stocks has become difficult as CDC continues to
unwind its stocks, as recent stocks levels are privately held and as Statistics Canada does not
have monthly stocks data for an 18-month period from July 2015 to January 2017.
TRADE:
Import Controls:
In 2017, due to domestic market shortages for butterfat, the Canadian government authorized
supplementary imports of cream and butter. The volumes imported are included in the table
found at the following link:
https://www.eics-scei.gc.ca/report-rapport/APRMT61C-D-DY.htm
Quantitative restrictions in ten categories of dairy products were converted to TRQs to support
supply management of industrial milk under the Canadian Dairy Commission Act and as a result
of the agreement at the WTO in 1994. Canada undertook an Article XXVIII action in 2008 to
create a new TRQ for milk protein substances in chapter 35. Due to the North American Free
Trade Agreement (NAFTA), the United States has duty-free access.
Information on the tariff utilization rates and quota holders for various dairy products can be
found at the following:
http://www.international.gc.ca/controls-controles/prod/agri/dairy-laitiers/index.aspx?lang=eng
The legislation and regulations that underpin the import controls can be found at the following:
http://laws-lois.justice.gc.ca/eng/regulations/SOR-95-196/index.html (Export and Import
Permits Act)
The market access given to dairy products in Canada are presented in the table below.
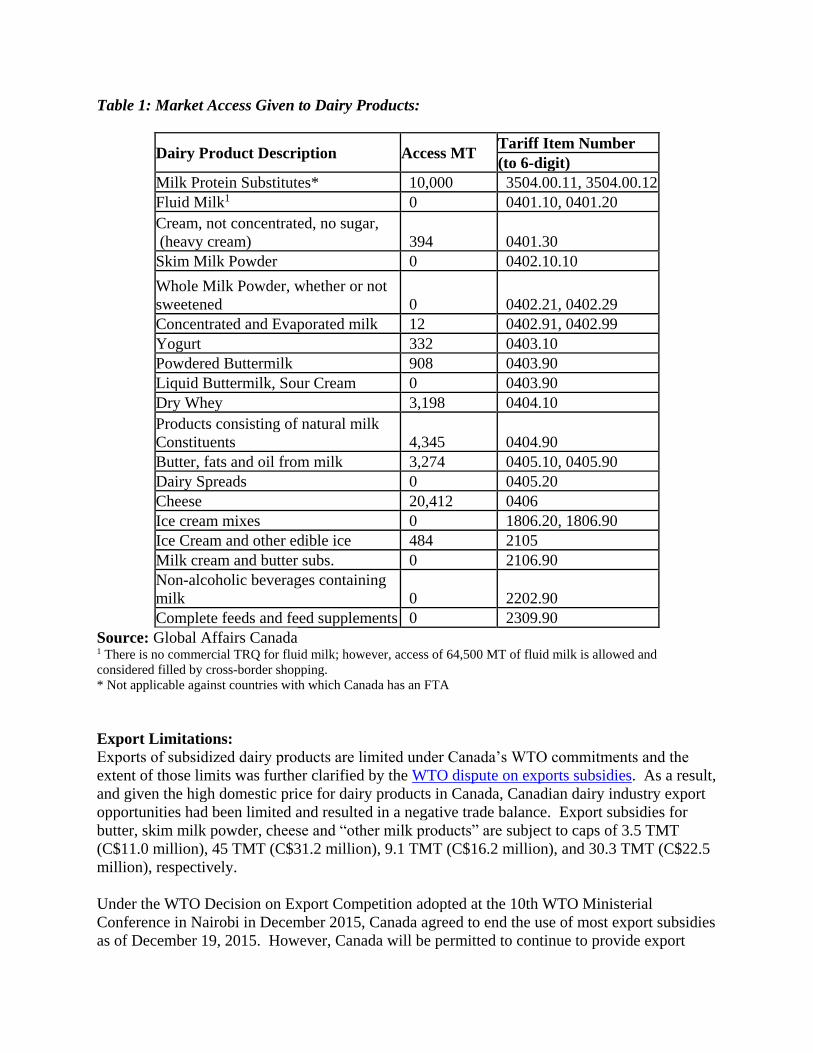
Table 1: Market Access Given to Dairy Products:
Dairy Product Description Access MT Tariff Item Number
(to 6-digit)
Milk Protein Substitutes* 10,000 3504.00.11, 3504.00.12
Fluid Milk1 0 0401.10, 0401.20
Cream, not concentrated, no sugar,
(heavy cream) 394 0401.30
Skim Milk Powder 0 0402.10.10
Whole Milk Powder, whether or not
sweetened 0 0402.21, 0402.29
Concentrated and Evaporated milk 12 0402.91, 0402.99
Yogurt 332 0403.10
Powdered Buttermilk 908 0403.90
Liquid Buttermilk, Sour Cream 0 0403.90
Dry Whey 3,198 0404.10
Products consisting of natural milk
Constituents 4,345 0404.90
Butter, fats and oil from milk 3,274 0405.10, 0405.90
Dairy Spreads 0 0405.20
Cheese 20,412 0406
Ice cream mixes 0 1806.20, 1806.90
Ice Cream and other edible ice 484 2105
Milk cream and butter subs. 0 2106.90
Non-alcoholic beverages containing
milk 0 2202.90
Complete feeds and feed supplements 0 2309.90
Source: Global Affairs Canada 1 There is no commercial TRQ for fluid milk; however, access of 64,500 MT of fluid milk is allowed and
considered filled by cross-border shopping.
* Not applicable against countries with which Canada has an FTA
Export Limitations:
Exports of subsidized dairy products are limited under Canada’s WTO commitments and the
extent of those limits was further clarified by the WTO dispute on exports subsidies. As a result,
and given the high domestic price for dairy products in Canada, Canadian dairy industry export
opportunities had been limited and resulted in a negative trade balance. Export subsidies for
butter, skim milk powder, cheese and “other milk products” are subject to caps of 3.5 TMT
(C$11.0 million), 45 TMT (C$31.2 million), 9.1 TMT (C$16.2 million), and 30.3 TMT (C$22.5
million), respectively.
Under the WTO Decision on Export Competition adopted at the 10th WTO Ministerial
Conference in Nairobi in December 2015, Canada agreed to end the use of most export subsidies
as of December 19, 2015. However, Canada will be permitted to continue to provide export
subsidies for certain processed products and dairy products until the end of 2020. Canada has
not yet notified its revised export subsidy schedule to the WTO, but has stated that it will likely
do so before the end of the year.
Trade Agreements:
NAFTA: The United States, Canada, and Mexico are currently renegotiating NAFTA.
In the recently updated negotiating objectives, the Office of the United States Trade
Representative has stated that the United States will seek to “[e]xpand competitive market
opportunities for U.S. agricultural goods in NAFTA countries, substantially equivalent to the
competitive opportunities afforded foreign exports into the U.S. market, including by eliminating
remaining Canadian tariffs on imports of U.S. dairy, poultry, and egg products.”
Senior Canadian officials have continued to affirm their support for supply management.
Trans-Pacific Partnership: On January 23, 2017, the United States withdrew from the Trans-
Pacific Partnership (TPP). Canada, as well as Australia and New Zealand, both major dairy
producers, remain part of the recently re-named Comprehensive and Progressive Trans Pacific
Partnership (CPTPP) and negotiations are continuing.
Please see the 2016 Dairy and Products Annual for a discussion of dairy market access
concessions negotiated in the TPP, in which Canada granted access equivalent to 3.25 percent of
its 2016 milk production.