Unit 2: The United States and Canada Human Geography of Canada.

Canada and the United States
TCI5 425 GA_LM_02_1.epsFirst Proof

2 Canada and the United States © Teachers’ Curriculum Institute
CANADA AND THE UNITED STATES MAPPING LAB
Draw an outline map of Canada and the United States on the next page or on a separate sheet of paper. Add a compass rose to your map, showingwhere north, south, east, and west are. Then draw and label these featureswhere you think they are located:
• the Arctic Circle
• two large bodies of water that are not oceans
• a mountain range
• a large river
• the political boundaries of the two countries in this region
• political boundaries for any states, provinces, or territories you thinkyou know
Preview
Making a Mental Map of the Region

© Teachers’ Curriculum Institute Lab Manual 3
CANADA AND THE UNITED STATES MAPPING LAB
Draw your mental map of Canada and the United States below.

4 Canada and the United States © Teachers’ Curriculum Institute
Challenge 1Learning About the Physical Geography of
Canada and the United States
30°N
40°N
50°N
20°N
Tropic of Cancer
50°W
40°W
60°W
70°W
30°W
20°W
10°W
10°N
60°N
Arc
tic
Cir
cle
70°N
80°W
70°W
90°W100°W110°W130°W 120°W
140°W
150°W
160°W
170°W
170°E
180°
10°N
Tropic of Cancer
30°N
20°N
40°N
50°N
60°N
Arctic C
ircle
70°N
80°N
80°N
N
S
EW
0 1,000 kilometers
0 1,000 miles
Lambert Azimuthal Equal-Area projection500
500
TCI5 426North America PhysicalGA_LM_02-CH-1.epsSecond proof
CANADA AND THE UNITED STATES MAPPING LAB

© Teachers’ Curriculum Institute Lab Manual 5
Challenge 2Learning About the Human Geography of
Canada and the United States
WashingtonWashington
YukonYukonTerritoryTerritory
Northwest TerritoriesNorthwest Territories
SaskatchewanSaskatchewanManitobaManitoba QuebecQuebec
NewfoundlandNewfoundlandand Labradorand Labrador
NewNewBrunswickBrunswick
Nova ScotiaNova Scotia
NevadaNevada
IdahoIdaho
NorthNorthDakotaDakota
SouthSouthDakotaDakota
NebraskaNebraska
KansasKansas
OklahomaOklahoma
TexasTexas
MinnesotaMinnesota
IowaIowa
WisconsinWisconsin
IllinoisIllinoisIndianaIndiana OhioOhio
PennsylvaniaPennsylvania
MaineMaine
New HampshireNew Hampshire
VermontVermont
ConnecticutConnecticutRhode IslandRhode Island
MarylandMarylandWashington, D.C.Washington, D.C.
DelawareDelawareNew JerseyNew Jersey
KentuckyKentucky
TennesseeTennessee
MississippiMississippi
AlabamaAlabama
SouthSouthCarolinaCarolina
NorthNorthCarolinaCarolina
VirginiaVirginia
WestWestVirginiaVirginia
MissouriMissouri
ArkansasArkansas
LouisianaLouisiana
WyomingWyoming
UtahUtah ColoradoColorado
NewNewMexicoMexico
U N I T E D S T A T E SU N I T E D S T A T E S
C A N A D AC A N A D A
AT L A N T I C
O C E A NO C E A N
AT L A N T I C
O C E A N
P A C I F I C
O C E A N
A R C T I C O C E A N
U N I T E D S T A T E S
C A N A D A
Washington
YukonTerritory
Northwest Territories
SaskatchewanManitoba Quebec
Newfoundlandand Labrador
NewBrunswick
Nova Scotia
Nevada
Idaho
NorthDakota
SouthDakota
Nebraska
Kansas
Oklahoma
Texas
Minnesota
Iowa
Wisconsin
IllinoisIndiana Ohio
Pennsylvania
Maine
New Hampshire
Vermont
ConnecticutRhode Island
MarylandWashington, D.C.
DelawareNew Jersey
Kentucky
Tennessee
Mississippi
Alabama
SouthCarolina
NorthCarolina
Virginia
WestVirginia
Missouri
Arkansas
Louisiana
Wyoming
Utah Colorado
NewMexico
N
S
EW
0 1,000 kilometers
0 1,000 miles
Lambert Azimuthal Equal-Area projection500
500
30°N
40°N
50°N
20°N
Tropic of Cancer
50°W
40°W
60°W
70°W
30°W
20°W
10°W
10°N
60°N
Arc
tic
Cir
cle
70°N
140°W
150°W
160°W
170°W
170°E
180°
10°N
Tropic of Cancer
30°N
20°N
40°N
50°N
60°N
Arctic C
ircle
70°N
80°N
80°N
80°W
70°W
90°W100°W110°W130°W 120°W
TCI5 427GA_LM_02-CH-2.epsThird proof
CANADA AND THE UNITED STATES MAPPING LAB
6 Canada and the United States © Teachers’ Curriculum Institute
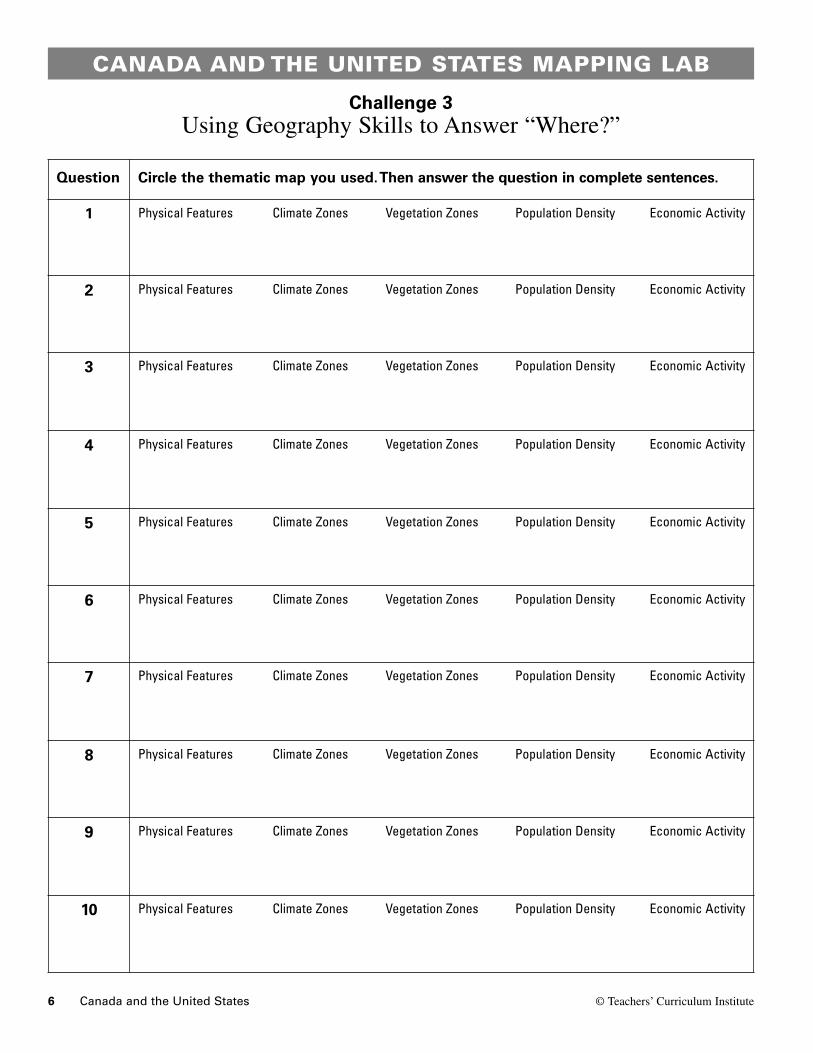
Challenge 3Using Geography Skills to Answer “Where?”
Question Circle the thematic map you used.Then answer the question in complete sentences.
1 Physical Features Climate Zones Vegetation Zones Population Density Economic Activity
2 Physical Features Climate Zones Vegetation Zones Population Density Economic Activity
3 Physical Features Climate Zones Vegetation Zones Population Density Economic Activity
4 Physical Features Climate Zones Vegetation Zones Population Density Economic Activity
5 Physical Features Climate Zones Vegetation Zones Population Density Economic Activity
6 Physical Features Climate Zones Vegetation Zones Population Density Economic Activity
7 Physical Features Climate Zones Vegetation Zones Population Density Economic Activity
8 Physical Features Climate Zones Vegetation Zones Population Density Economic Activity
9 Physical Features Climate Zones Vegetation Zones Population Density Economic Activity
10 Physical Features Climate Zones Vegetation Zones Population Density Economic Activity
CANADA AND THE UNITED STATES MAPPING LAB

© Teachers’ Curriculum Institute Lab Manual 7
Challenge 4Using Geography Skills to Answer “Why There?”
Question Circle the thematic maps you used.Then answer the question in complete sentences.
1 Physical Features Climate Zones Vegetation Zones Population Density Economic Activity
2 Physical Features Climate Zones Vegetation Zones Population Density Economic Activity
3 Physical Features Climate Zones Vegetation Zones Population Density Economic Activity
4 Physical Features Climate Zones Vegetation Zones Population Density Economic Activity
5 Physical Features Climate Zones Vegetation Zones Population Density Economic Activity
6 Physical Features Climate Zones Vegetation Zones Population Density Economic Activity
CANADA AND THE UNITED STATES MAPPING LAB

8 Canada and the United States © Teachers’ Curriculum Institute
Location A (40° north, 74° west)
Location B (76° north, 80° west)
Location C (60° north, 147° west)
PhysicalFeatures
ClimateZones
VegetationZones
PopulationDensity
EconomicActivity
Challenge 5Using Maps to Analyze a Field Photograph
CANADA AND THE UNITED STATES MAPPING LAB

© Teachers’ Curriculum Institute Lab Manual 9
Challenge 5Using Maps to Analyze a Field Photograph
We think the field photograph best matches Location ____ .
Supporting-Evidence Statements
1. From the ______________ map, we learned that this location
_____________________________________________________
_______________________________________________ .
In the field photograph, we see ___________________________
_____________________________________________________
______________________________________________ .
2. From the ______________ map, we learned that this location
_____________________________________________________
_______________________________________________ .
In the field photograph, we see ___________________________
_____________________________________________________
______________________________________________ .
3. From the ______________ map, we learned that this location
_____________________________________________________
_______________________________________________ .
In the field photograph, we see ___________________________
_____________________________________________________
______________________________________________ .
4. From the ______________ map, we learned that this location
_____________________________________________________
_______________________________________________ .
In the field photograph, we see ___________________________
_____________________________________________________
______________________________________________ .
CANADA AND THE UNITED STATES MAPPING LAB