Canada and the United States combined would make the world's largest economy together.
18
Financial System of USA and Canada Canada and the United States combined would make the world's largest economy together
-
Upload
kristian-wells -
Category
Documents
-
view
215 -
download
0
Transcript of Canada and the United States combined would make the world's largest economy together.

Financial System of USA and Canada
Canada and the United States combined would make the world's largest economy together

America Canada
Rank at number one of GDP – with 13,811,200 million.
USA has a slightly better ten-year growth rate level.
Unemployment and public debt have lower percentage in the USA.
US dollar is a reserve currency of the world and remains higher.
USA spends more on social security
USA spends more on the military, research and development, social security, education, and health care.
Rank at number nine on top ten list of GDP – with 1,326,376 million.
Canada is projected to grow faster over a one-year period with boasted industrial growth rate.
Larger government per capita and Canada only spends 1.5% more as a % of GDP than the USA.
Single largest expenditure Canada has is its social services.

U.S. Dollar vs. the Canadian dollar
In June 2011, one U.S. Dollar was equal to $0.9645 Canadian. Whereas in 2002 exchange rate for one U.S. dollar was $1.62 Canadian.
In 2009, it was an interesting year, that the U.S. Dollar peaked at about $1.28 CAD, but dropped to $1.05 by the end of the year.

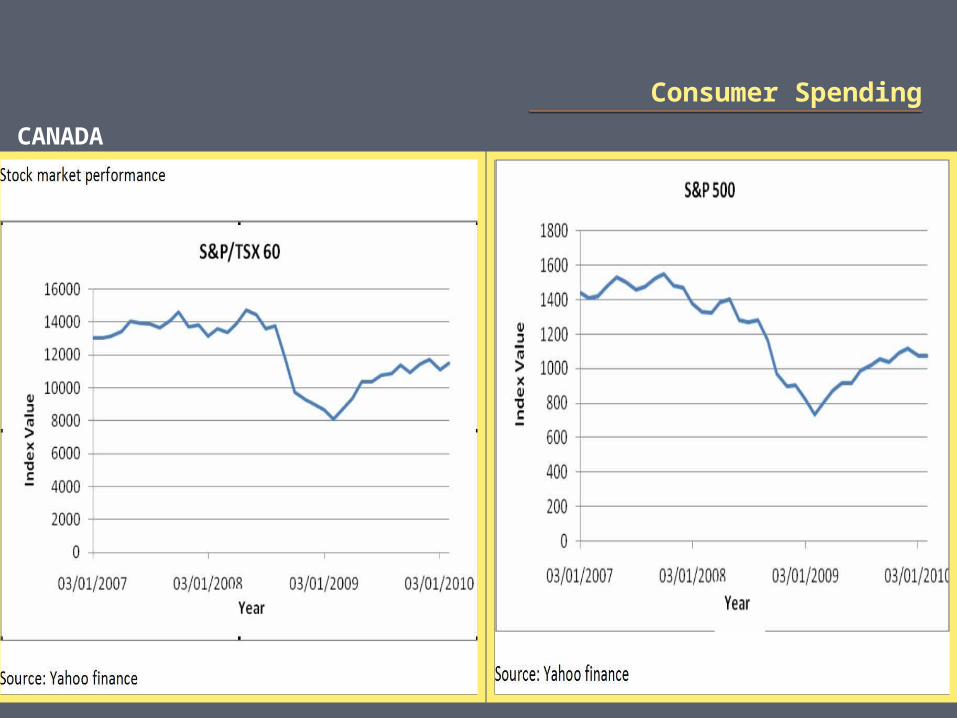
Consumer spending
Rising unemployment and job insecurity coupled with worries about the economy are likely to dampen growth in consumer spending in the USA.
The Global Forecast Update by Scotia Economics forecasts a 3% growth in Canadian consumer spending and 2.1% growth in the USA.
Meanwhile Mark Carney, the governor of the Bank of Canada said consumers would be at the “heart” of the economic recovery in Canada. Consumer spending is expected to contribute half of the growth in final domestic demand in 2010.
Consumer spending was a strong support for Canada’s economy in 2010 and accounted for two-thirds of the rise in GDP. Consumers pulled back in early 2011, therein reflecting the high level of debt that was put on their balance sheets
Consumer Spending
CANADA AMERICA

General government net financial liabilities and budget balances as a percentage of nominal GDP
Country2007 2010 2015 (IMF projection)
Net financial Liabilities
Budget Balance
Net financial Liabilities
Budget Balance Net financial Liabilities
Budget Balance
Canada 22.9 1.6 32.2 -5.5 34.4 -0.2
America 42.6 -2.7 64.8 -10.6 83.4 -5.5
Fiscal positions, which were already under pressure from secular factors such as demographic trends, deteriorated further during the recession as a result of reduced tax revenues and increased government spending to support the economic recovery. According to data compiled by the IMF; the average net financial liabilities of governments in advanced economies rose from 45 per cent of GDP in 2007 to almost 65 per cent in 2010 (Table)GDP in the slide is defined as “all financial liabilities minus all financial assets of general
government “
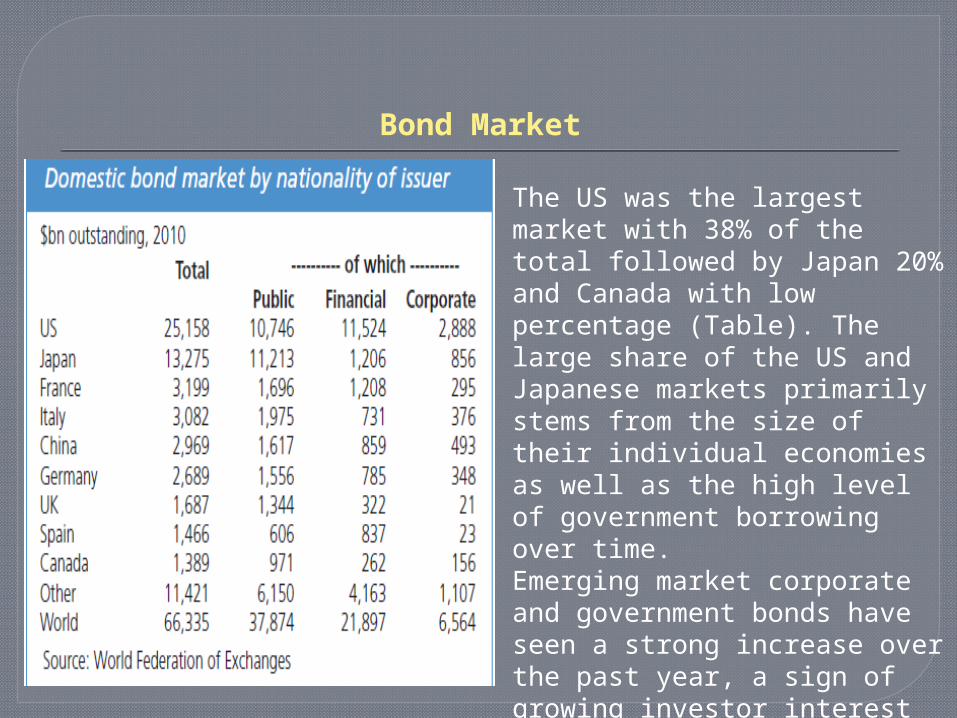
Bond Market
The US was the largest market with 38% of the total followed by Japan 20% and Canada with low percentage (Table). The large share of the US and Japanese markets primarily stems from the size of their individual economies as well as the high level of government borrowing over time. Emerging market corporate and government bonds have seen a strong increase over the past year, a sign of growing investor interest in opportunities outside the more developed markets.
Late-2000s financial crisis- the Global
Recession.Economist consider the latest Global Financial Crisis or the
Credit Crunch, even worse than1930s

The emergence of the crisis associated with the following factors: 1. General economic cycles; 2. Overheated credit market and its effect appears before the mortgage crisis; 3. High prices of commodities (including oil); 4. Overheating stock market;
What Caused Global recession
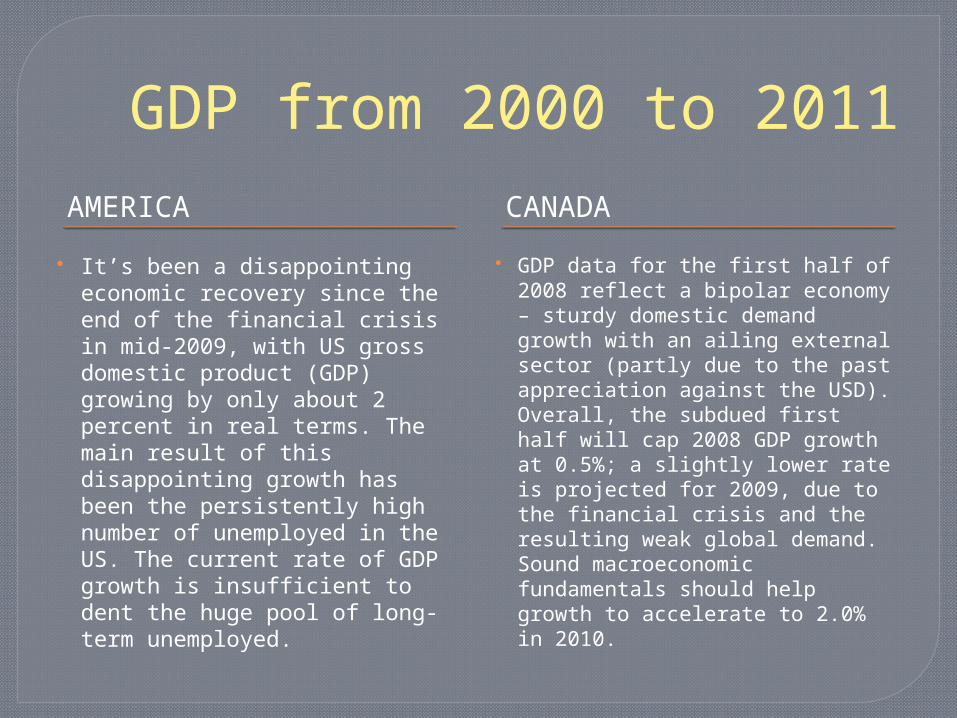
GDP from 2000 to 2011AMERICA CANADA
It’s been a disappointing economic recovery since the end of the financial crisis in mid-2009, with US gross domestic product (GDP) growing by only about 2 percent in real terms. The main result of this disappointing growth has been the persistently high number of unemployed in the US. The current rate of GDP growth is insufficient to dent the huge pool of long-term unemployed.
GDP data for the first half of 2008 reflect a bipolar economy – sturdy domestic demand growth with an ailing external sector (partly due to the past appreciation against the USD). Overall, the subdued first half will cap 2008 GDP growth at 0.5%; a slightly lower rate is projected for 2009, due to the financial crisis and the resulting weak global demand. Sound macroeconomic fundamentals should help growth to accelerate to 2.0% in 2010.

GDP COMPARISON - 2010As the chart illustrates, growth in real GDP is positive in 2010. The IMF forecasts 2.125% real GDP growth in Canada and 1.518% in the USA. A survey carried out by the Federal Reserve Bank of Philadelphia forecasts the US economy will expand at an annualized rate of 2.7% in the next five quarters.
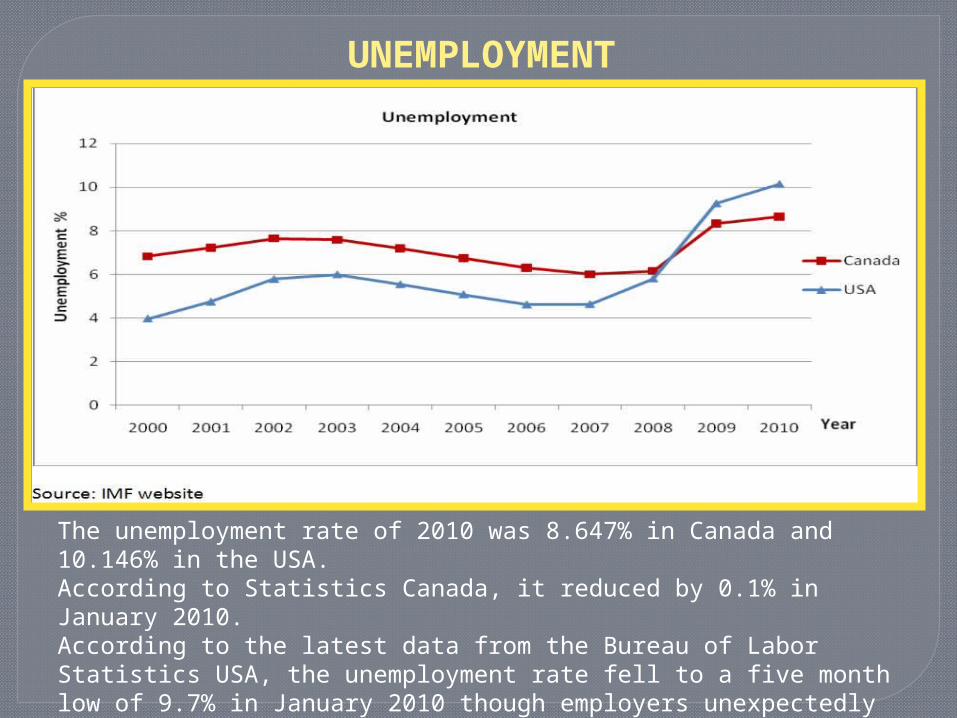
UNEMPLOYMENT
The unemployment rate of 2010 was 8.647% in Canada and 10.146% in the USA.According to Statistics Canada, it reduced by 0.1% in January 2010. According to the latest data from the Bureau of Labor Statistics USA, the unemployment rate fell to a five month low of 9.7% in January 2010 though employers unexpectedly cut 20,000 jobs in January.

Canada America
Over the last months (June onwards) the number of private and public sector employees has been rising while self-employment has been little changed.
The largest employment increases in January occurred in business, building and other support services, and retail and wholesale trade.
These were partially offset by losses in professional, scientific, and technical services, as well as agriculture.
17,900 new jobs were created in Canada in the November
Employment results for the past 12 months (October 2009 – October 2010, seasonally adjusted, in thousands):Civilian non-institutional population 16 or older: +0.8%Employed: +0.6% (corrected value)Unemployed: down 4.9% (mostly though people dropping out of the labor force)Not in the labor force (neither working nor looking): +2.3%162,000 jobs were created in the United States, unemployment rate held steady at 9.7%
UNEMPLOYMENT

General government gross debt
Country
Subject
Units 2004 2005 2006 2007 2008 2009
Canada Gross Debt
% GDP 72.361
70.471
67.902
64.208 60.656
58.447
America
Gross Debt
% GDP 60.361
60.657
59.917
60.746 61.506
65.363
Canada General government net debtThe General government net debt in the United States was reported at 8315.50 billions of U.S. Dollars in 2009, according to the International Monetary Fund (IMF).
Canada General government net debt
The General government net debt in Canada was reported at 436.23 billions Canadian Dollar in 2009, according to the International Monetary Fund (IMF).

US Debt and Economy The budget deficit for 2009 is estimated to be 11.2% of GDP
as of August 2009, according to the Congressional Budget Office, the highest level since 1945.
US national debt is projected to stay above 60% of GDP from 2010 until 2019.
Government revenues are at 15% of GDP while expenditures are estimated to be at 24.1% in 2010.
Net interest costs as a percentage of government revenues had been under 10% in the first decade of this century but are now projected to reach 17% by 2019.
Even with GDP growth rates of 3% to 4% from 2012 onward, given unfunded liabilities in major programs such as Medicaid and Social Security, US debt will continue to rise.
The cost of borrowing and risk of inflation are expected to put upward pressure on US interest rates

Canada Debt and Economy Deficit for 2009-10 fiscal year is C$33.7 billion, followed by a
2010-11 deficit of C$29.8 billion and smaller deficits the two following years.
Canada’s national debt peaked at $562.8 billion. In just five years – and after previous Liberal governments spent years wiping out our debt – Stephen Harper’s government has returned Canada to its all-time-high 1996-97 debt load level.
Government revenues are at 22% of GDP while expenditures are estimated to be at 39.1% in 2010.
Canada Interest Rate last reported at 1%, interest rate decisions are taken by the Bank of Canada's (BoC) Governing Council.. From 1990 until 2010, Canada's average interest rate was 6.12 percent reaching an historical high of 16.00 percent in February of 1991 and a record low of 0.25 percent in April of 2009.
FUTURECANADA
Completing Canada’s Economic Action Plan to protect incomes, create jobs, ease credit markets, and help workers and communities get back on their feet.
Returning to fiscal balance by winding down stimulus spending as economic activity rebounds and by restraining federal program spending overall while protecting growth in transfers that directly benefit Canadians, such as pensions, health care and education.
Continuing to work on job creation and job protection, recognizing that too many Canadians are still looking for work, the Government is helping young Canadians entering today’s job market for the first time make the transition to work.
Building the jobs and industries of the future by investing in Canadians’ skills and education, keeping taxes low, opening markets to Canadian goods and services, and creating the conditions for continued success of industries that are the foundation of Canada’s prosperity.
AMERICA
America remains the World Power.
Job creation. Inflation

References Canada (2011). The world fact book. Central Intelligence Agency. Retrieved on
4th December 2011 from https://www.cia.gov/library/publications/the-world-factbook/geos/ca.html
Canadian Dollars (CAD) to 1 US Dollar (USD) (2011). Exchange-Rates.org. Retrieved on 4th December 2011 from http://www.exchange-rates.org/history/CAD/USD/G/30
Kavoussi, B. (2011). Consumer Spending Slows As Incomes Increase. The Huffington Post. Retrieved on 6th December 2011 from http://www.huffingtonpost.com/2011/11/23/consumer-spending-slows-income-increases_n_1110043.html
United States of America (2011). The world fact book. Central Intelligence Agency. Retrieved on 4th December 2011 from https://www.cia.gov/library/publications/the-world-factbook/geos/us.html
Moen, A. (2010). Skating on thin ice- Canada Us Relations in 2010 -2011. Studies in US Canada Relations. Fraser Institute. Retrieved o 3rd December 2011 from www.fraserinstitute.org/WorkArea/DownloadAsset.aspx?id... – Canada
Nanto, K. D. (2009) The Global Financial Crisis: Analysis and Policy Implications. Congressional Research Service. Retrieved o 3rd December 2011 from www.fas.org/sgp/crs/misc/RL34742.pdf