Canada 2040: No Immigration Versus More Immigration · The Conference Board of Canada’s National...
46
REPORT MAY 2018 Canada 2040. No Immigration Versus More Immigration National Immigration Centre
Transcript of Canada 2040: No Immigration Versus More Immigration · The Conference Board of Canada’s National...

REPORT MAY 2018
Canada 2040.No Immigration Versus More Immigration
National Immigration Centre

Canada 2040: No Immigration Versus More Immigration Kareem El-Assal and Daniel Fields
Preface
Following the November 2017 announcement of Canada’s 2018–2020 Immigration Levels Plan, this report forecasts the economic and fiscal impacts of gradually increasing immigration levels through to 2040. It also asks: What would happen to the economy if Canada shut its doors to immigrants completely? It then delineates between the contributions to economic growth of Canada’s three immigration classes. The report concludes by taking a closer look at the economic impacts of the family class given its sizable role in total immigrant admissions.
To cite this report: El-Assal, Kareem and Daniel Fields. Canada 2040: No Immigration Versus More Immigration. Ottawa: The Conference Board of Canada, 2018.
©2018 The Conference Board of Canada* Published in Canada | All rights reserved | Agreement No. 40063028 | *Incorporated as AERIC Inc.
An accessible version of this document for the visually impaired is available upon request. Accessibility Officer, The Conference Board of Canada Tel.: 613-526-3280 or 1-866-711-2262 E-mail: [email protected]
®The Conference Board of Canada and the torch logo are registered trademarks of The Conference Board, Inc. Forecasts and research often involve numerous assumptions and data sources, and are subject to inherent risks and uncertainties. This information is not intended as specific investment, accounting, legal, or tax advice. The findings and conclusions of this report do not necessarily reflect the views of the external reviewers, advisors, or investors. Any errors or omissions in fact or interpretation remain the sole responsibility of The Conference Board of Canada.
CONTENTSCONTENTS
i EXECUTIVE SUMMARY
5 Introduction 6 Our Forecast Assumptions 13 No Immigration Versus More Immigration 17 One Per Cent Immigration Scenario Results 23 Forecasting the Contributions to Economic Growth of the Three Immigration Classes 25 The Economic Impacts of Family Reunification 33 Conclusion
Appendix A 36 Our Forecast Assumptions
Appendix B 38 Bibliography
© The Conference Board of Canada. All rights reserved. Please contact cboc.ca/ip with questions or concerns about the use of this material.

AcknowledgmentsThis National Immigration Centre report was prepared by The Conference Board of Canada. It was researched and written by Kareem El-Assal, Senior Research Associate, Immigration, and Daniel Fields, Economist, National Forecast. The authors thank Craig Alexander, Senior Vice-President and Chief Economist; Pedro Antunes, Deputy Chief Economist; and Matthew Stewart, Director, National Forecast, for conducting internal reviews of the report. Thank you also to the following external reviewers for their feedback: Howard Ramos, Professor, Department of Sociology and Social Anthropology, Dalhousie University; Ather Akbari, Professor, Economics, Saint Mary’s University; and, Ontario’s Ministry of Citizenship and Immigration.
National Immigration Centre
The Conference Board of Canada’s National Immigration Centre (NIC) is a research-intensive initiative that examines the immigration challenges and opportunities facing Canada today. Through independent, evidence-based, objective research and analysis, NIC makes recommendations for action to help improve Canada’s immigration system.
The following members are thanked for financially supporting NIC research.
The findings and conclusions of this report are entirely those of The Conference Board of Canada. NIC members do not necessarily endorse the contents of this report. Any errors or omissions in fact or interpretation remain the sole responsibility of The Conference Board of Canada.
Follow us on Twitter: @ImmigrationCBoC

Find Conference Board research at www.e-library.ca.
EXECUTIVE SUMMARY
Canada 2040: No Immigration Versus More Immigration
At a Glance
• A no-immigration world would result in weak economic growth and fiscal strain—a situation that would reduce the motivation for private investment. Productivity-enhancing investments would not fully compensate for the negative impacts of a shrinking workforce.
• Increasing annual immigration to 1 per cent of Canada’s population by the early 2030s, when we forecast that immigration will account for 100 per cent of population growth, would support modest labour force and economic growth.
• Family class immigration has a role in supporting economic development and Canada has taken additional steps in recent years to ensure this class does not pose an undue economic burden. It is also important for Canada to boost the labour market outcomes of family class immigrants as it becomes more dependent on immigrants to support its economic growth.
© The Conference Board of Canada. All rights reserved. Please contact cboc.ca/ip with questions or concerns about the use of this material.

CANADA 2040No Immigration Versus More Immigration
Find Conference Board research at www.e-library.ca. ii
The purpose of this report is to assess the economic implications of no immigration in Canada, and to quantify the impacts of gradually increasing immigration. We also assess the economic impacts of Canada’s three immigrant admissions classes (economic, family, and refugee).
How Would Stopping Immigration Affect Canada’s Economy?A scenario in which Canada stops immigration completely is implausible
given the country’s need for immigrants to mitigate the negative
consequences of its aging population and low birth rate. But, building
this counterfactual scenario allows us to assess the current and future
contributions of immigration to Canada’s economic growth. This scenario
would result in a shrinking labour force which would significantly
constrain growth in the Canadian economy. Canada would likely need to
increase tax rates to compensate for the dwindling number of taxpayers
and would face significant difficulties funding key social services such as
health care.
To help offset the negative economic and fiscal impacts of a shrinking
labour force, Canada would need to rely more on productivity enhancing
investments to substitute workers. However, to replicate the potential
output it could otherwise achieve by having immigration add to labour
force growth, Canada would need to see an increase in private
and public investments to significantly lift productivity—a situation
that is unlikely in a low-economic-growth and (potentially) higher-
tax environment.
Executive Summary | The Conference Board of Canada
Find Conference Board research at www.e-library.ca. iii
The Case for Boosting Immigration to 1 Per CentOur forecasts suggest that bumping the immigration rate to 1 per cent of
the population (up from 0.8 per cent in 2017) by the early 2030s would
help mitigate the anticipated challenges of population aging and a low
birth rate on the country’s economic and fiscal standing. This scenario
would yield an estimated average annual real GDP growth rate of 1.9 per
cent through to 2040 (compared with 1.3 per cent annually if immigration
was stopped). In recent decades, Canada’s population has grown at a
rate of about 1 per cent per year. At present, natural increase (births
minus deaths) comprises an estimated 29 per cent of Canada’s annual
population growth. However, with Canada’s natural increase expected to
decline, we forecast that immigration’s share of annual population growth
will rise from about 71 per cent today to 100 per cent by 2034—when the
number of deaths is forecast to exceed the number of births. Canada is
already at a point where it is almost entirely dependent on immigration
for its labour force growth. As such, based on current demographic
trends, increasing the immigration rate to 1 per cent by the early 2030s
will allow Canada to maintain its population growth rate of recent
decades (1 per cent) and support modest labour force and economic
growth over the long term.
The Economic Contributions of the Family ClassUnsurprisingly, the economic class accounts for most of immigration’s
contribution to economic growth given that its main purpose is to help
address Canada’s labour force needs, unlike the family and refugee
classes, which exist for social and humanitarian reasons. Nonetheless,
the family and refugee classes do contribute to the economy and, in
particular, it is worth evaluating the family class through an economic
lens given that it accounts for a large share of Canada’s newcomer
admissions. Our findings suggest that while Canada has prioritized
economic class admissions since the mid-1990s to address its labour
market needs, family reunification should also be viewed as part of
Family reunification should also be viewed as part of economic development policy.
© The Conference Board of Canada. All rights reserved. Please contact cboc.ca/ip with questions or concerns about the use of this material.

CANADA 2040No Immigration Versus More Immigration
Find Conference Board research at www.e-library.ca. iv
economic development policy. Immigrant families fare well in relation
to Canadian-born families in important economic metrics such as
household income and homeownership—not to mention other benefits of
family reunification, such as boosting immigrant retention rates, which is
especially key to economic growth in Atlantic Canada.
Low earnings and the prevalence of chronic low income among the
family class are issues of concern that need to be addressed to help
boost the living standards of immigrant families and for Canada to
benefit from their human capital in the labour market as it becomes more
dependent on immigrants to support its economic growth. Moreover, one
of Canada’s policy goals is to ensure the family class does not impose
an undue economic burden on the country, and Canada has taken
several additional steps in recent years to achieve this objective, such as
limiting the intake of parents and grandparents.

The Conference Board of Canada
Find Conference Board research at www.e-library.ca. 5
IntroductionIn November 2017, Canada tabled its “2018–2020 Immigration Levels Plan” that will see its immigrant admissions rise to 340,000 by 2020—up from a target of 300,000 in 2017 and about 260,000 per year over the previous decade.1 With Canada’s immigrant intake on the rise, this report draws upon the 2018–20 plan to estimate the economic and fiscal impacts of immigration between 2017–40. We chose this period to allow us to compare the findings of this report with those of our October 2017 report 450,000 Immigrants Annually? Integration is Imperative to Growth.
We begin this report by outlining our forecast methodology. We then
run two immigration scenarios to evaluate how they could impact key
economic and fiscal indicators, such as real GDP, real GDP per capita,
the share of the population aged 65 and over, the worker to retiree
ratio, and health care costs as a share of provincial revenues. The
first scenario assesses what would happen to Canada’s economy if
it stopped immigration completely. While this counterfactual scenario
is implausible given Canada’s need for immigration to mitigate the
negative consequences of its aging population and low birth rate, the
benefit of running it is that it helps us better understand the importance
of immigration to Canada’s economic and fiscal standing. In addition,
this scenario allows us to assess the individual contributions of each
immigration class to Canada’s real GDP growth. The second scenario
draws upon Canada’s 2018–2020 Immigration Levels Plan to assess
the ramifications of slowly increasing immigrant admissions over the
coming decades.
1 Immigration, Refugees and Citizenship Canada, “Supplementary Information 2018–2020 Immigration Levels Plan.”
© The Conference Board of Canada. All rights reserved. Please contact cboc.ca/ip with questions or concerns about the use of this material.

CANADA 2040No Immigration Versus More Immigration
Find Conference Board research at www.e-library.ca. 6
Third, we forecast the contributions to economic growth of Canada’s
three admissions classes (economic, family, and refugees). Only
economic class immigrants are admitted based on their human capital
characteristics, such as age, education, language skills, occupation, and
work experience. Immigrants under the other two classes are admitted
for social and humanitarian reasons, and so they can’t be expected to
fare as well as the economic class in terms of labour market success.
Nonetheless, we explore the economic benefits and challenges of the
family class given that it accounts for a sizable amount of Canada’s
total admissions.
Our Forecast AssumptionsWe make every effort to make our forecasts as realistic as possible by
including key assumptions that are based on current immigration policy
and the recent economic outcomes of Canada’s immigrants. Detailed
below (and in Appendix A), these include assumptions on immigration
levels and composition, Canada’s demographic trends, and immigrant
employment and wage characteristics.
Immigration LevelsWe run two scenarios. The no immigration scenario assumes that
Canada does not welcome any immigrants between 2017 and 2040.
The 1 per cent scenario assumes Canada will gradually increase its
immigration levels over the coming decades to replenish its rising wave
of retirees and to grow its labour force. We assume Canada welcomed
300,000 immigrants in 20172 and will achieve its 2018–20 immigration
levels targets of welcoming 310,000 immigrants in 2018, 330,000 in 2019,
and 340,000 in 2020. We hold Canada’s projected immigration rate in
2020 (0.90 per cent of the population) constant until bumping it up to
0.95 per cent of the population in 2025. We increase the rate again to
1 per cent of the population in 2030 and then hold it constant until 2040.
2 The 2017 data remain preliminary at the time of writing this report. Any discrepancy in Canada’s actual intake and our 2017 intake assumption is unlikely to be statistically significant.
The Conference Board of Canada
Find Conference Board research at www.e-library.ca. 7
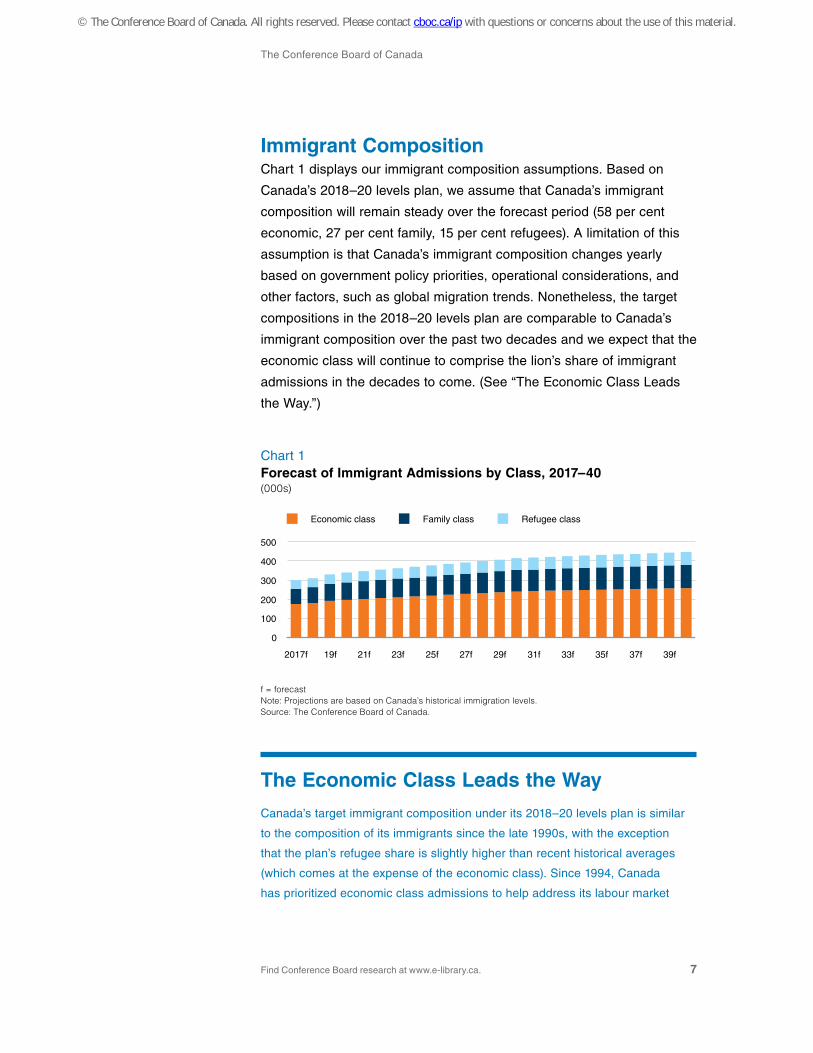
Immigrant Composition Chart 1 displays our immigrant composition assumptions. Based on
Canada’s 2018–20 levels plan, we assume that Canada’s immigrant
composition will remain steady over the forecast period (58 per cent
economic, 27 per cent family, 15 per cent refugees). A limitation of this
assumption is that Canada’s immigrant composition changes yearly
based on government policy priorities, operational considerations, and
other factors, such as global migration trends. Nonetheless, the target
compositions in the 2018–20 levels plan are comparable to Canada’s
immigrant composition over the past two decades and we expect that the
economic class will continue to comprise the lion’s share of immigrant
admissions in the decades to come. (See “The Economic Class Leads
the Way.”)
The Economic Class Leads the Way
Canada’s target immigrant composition under its 2018–20 levels plan is similar
to the composition of its immigrants since the late 1990s, with the exception
that the plan’s refugee share is slightly higher than recent historical averages
(which comes at the expense of the economic class). Since 1994, Canada
has prioritized economic class admissions to help address its labour market
Chart 1Forecast of Immigrant Admissions by Class, 2017–40(000s)
f = forecastNote: Projections are based on Canada’s historical immigration levels.Source: The Conference Board of Canada.
2017f 19f 21f 23f 25f 27f 29f 31f 33f 35f 37f 39f
0
100
200
300
400
500
Economic class Family class Refugee class
© The Conference Board of Canada. All rights reserved. Please contact cboc.ca/ip with questions or concerns about the use of this material.

CANADA 2040No Immigration Versus More Immigration
Find Conference Board research at www.e-library.ca. 8
needs. (See Chart 2.) The economic class’ share of total immigration steadily
increased from 46 per cent in 1994 to 60 per cent in 2000 and peaked at 67 per
cent in 2010. While the economic class hovered around the 60 per cent range
throughout the 2000s, the family class accounted for about 27 per cent of annual
immigrant admissions and the refugee class comprised about 12 per cent. The
totals do not add up due to rounding and about 1 per cent of annual admissions
being recorded as “other immigrants.”
Demographics Our demographic assumptions are based on recent historical trends
reported by Statistics Canada. For example, over the forecast period,
we assume that Canada’s fertility rate remains constant at 1.5. Death
rates are held at historical trends, by age and gender. Our assumption
regarding annual emigration as a share of the population is based on
Chart 2Immigrant Admissions by Class, 1980–2017(admissions, 000s; share of total, per cent)
Sources: Immigration, Refugees and Citizenship Canada; The Conference Board of Canada.
1980 82 84 86 88 90 92 94 96 98 00 02 04 06 08 10 12 14 16
0
50,000
100,000
150,000
200,000
250,000
300,000
0
10
20
30
40
50
60
70
Economic class (left)
Family class (left)
Refugee class (left)
Other immigrants (left)
Economic class as % of total (right)
Family class as % of total (right)
Refugees class as % of total (right)
Other immigrants as % of total (right)

The Conference Board of Canada
Find Conference Board research at www.e-library.ca. 9
the 2016 rate (0.2 per cent of the population leaving Canada each year
throughout the forecast).
Employment CharacteristicsWe draw from the most recent Statistics Canada census data, which
contains employment data based on immigrant landing cohorts (i.e.,
those who arrived in Canada during the 2011–16, 2001–10, and
1991–2000 periods). We incorporate the average trajectory of immigrant
employment rates (based on their length of time in Canada) into
our methodology.
The employment rates for economic class immigrants (which we weight
based on our immigrant composition assumption) are 69.9 per cent
for those who have resided in Canada for less than five years, 78.4
per cent for those who have lived in Canada for between five and 15
years, and just under 79 per cent for those who have lived in Canada
for between 15 and 25 years. We have adopted this data into our
methodology by assuming that immigrants who arrive in Canada will
see their employment rates follow a similar trajectory. For example, we
assume that economic class immigrants who arrive in Canada between
2017 and 2022 will have the same employment rate as their counterparts
who have been in Canada for under five years (69.9 per cent), and that it
will increase at a similar rate over 2023–32 and 2033–40 (these intervals
are based on the most recent census data intervals highlighted above).
We use the same employment rate methodology for the family and
refugee classes. That is, we draw on recent census data to project the
employment characteristics of these classes over a 23-year period since
our forecast period is over the same length of time (2017–40). Hence,
we assume that family class immigrants who landed in Canada between
2017 and 2022 will have an employment rate of 59.2 per cent, and it
will gradually increase to 71 per cent for 2023–32, and 76.7 per cent for
2033–40. Employment rates for refugees are assumed to be 45.3 per
cent during the 2017–22 period, rising to 67.1 per cent for 2023–32, and
73.6 per cent for 2033–40.
© The Conference Board of Canada. All rights reserved. Please contact cboc.ca/ip with questions or concerns about the use of this material.

CANADA 2040No Immigration Versus More Immigration
Find Conference Board research at www.e-library.ca. 10
When we weigh the three immigrant classes according to Canada’s
immigrant composition over our forecast period, the overall immigrant
employment rate is 63.3 per cent for 2017–22, 74.7 per cent for 2023–32,
and 77.6 per cent for 2033–40. Immigrants have high employment rates
compared with the rest of Canada’s working-age population since most
of them arrive in Canada during their prime working years, which is
especially the case for the main admissions group—the economic class.
In comparison, the average employment rate in Canada is currently
61.7 per cent,3 and is set to decrease over the next 23 years as Canada’s
population ages (dipping to about 58 per cent by 2040).
WagesUsing the most recent Statistics Canada data, we compare the wages
of employed immigrants who landed in Canada between 1991 and 2015
with the average wages of those employed in Canada. Immigrants rarely
achieve wage parity with the Canadian average and their relative wages
vary significantly depending on their entry stream. Principal applicants
under the economic class (federal and provincial nominees) tend to
reach the average Canadian wage within five years of landing, and then
earn higher than average wages in subsequent post-landing years. This
is due to the fact they are screened under Canada’s merit-based system
and, hence, have a much higher likelihood than immigrants arriving
under all other streams of faring well in the Canadian economy. Spouses
and dependants of principal applicants earn well below the average
Canadian wage. For instance, spouses and dependants of federal
skilled workers who are in the labour force earn about 58 per cent of the
average wage even a decade after arriving. Even after 23 years, they
earn 89 per cent of the average Canadian wage. Immigrants who arrive
under the family class earn 61 per cent of the average wage a decade
after arriving. After 23 years they earn about 81 per cent of the average
wage. The refugee class has the lowest earnings among immigrants
since they are admitted to Canada solely on their need for humanitarian
assistance. Their earnings reach 50 per cent of the average wage a
decade after landing and about 69 per cent after 23 years.
3 Statistics Canada, CANSIM table 282-0087.
Principal applicants under the economic class tend to reach the average Canadian wage within five years of landing.

The Conference Board of Canada
Find Conference Board research at www.e-library.ca. 11
To calculate our immigrant income results, we weigh the annual evolution
of immigrant wages over this period by entry class. (See Chart 3.) We
stagger immigrant earnings based on the year they land in Canada.
For instance, the earnings of an economic class principal applicant that
arrives in Canada in 2025 rises to above 105 per cent of the average
Canadian wage in 2040. This means only a fraction of immigrants in
our forecast achieve their estimated peak earnings (i.e., those who land
during the early years of our forecast period). When we weigh all classes
as outlined above, immigrants earn just over 83 per cent of the average
Canadian wage after 23 years. (See Chart 4.) Our assumptions and their
limitations are summarized below and in Appendix A.
Chart 3Forecast of Immigrant Wages by Number of Years Post-Landing and Entry Stream(share of Canadian average wage, per cent; years since landing)
Note: We keep Principal Nominee Program (PNP) income constant after year 17 due to data limitations. Since the PNP launched in 1998, data are only available for the years between 1998 and 2015.Sources: The Conference Board of Canada; Statistics Canada.
0 1 2 3 4 5 6 7 8 9 10 11 12 13 14 15 16 17 18 19 20 21 22 23
0
20
40
60
80
100
120
140
Skilled principal applicant (PA)
Skilled spouse/dependant (SD)
Principal nominee program (PA)
Principal nominee program (SD)
Family
Government refugees
Private refugees
Refugees landed
Refugees dependants
© The Conference Board of Canada. All rights reserved. Please contact cboc.ca/ip with questions or concerns about the use of this material.

CANADA 2040No Immigration Versus More Immigration
Find Conference Board research at www.e-library.ca. 12
Limitations of our Assumptions
The limitations of our assumptions include:
• We do not assume that immigrant wages and employment rates improve despite
recent policy reforms aimed at enhancing the labour market performance of
newcomers. Newcomer wages may also rise given the increasing demand for
immigrants to fill labour shortages created by an aging population. Moreover,
immigrant employment rates and wages were weighed down by the 2008–09
recession, which makes our forecast somewhat conservative. As such, we may
be understating the economic benefits of immigration over our forecast period.
• Conversely, we do not assume that immigrant wages and employment rates
deteriorate, which is also possible if the labour market integration challenges that
immigrants commonly face are not adequately addressed. This would reduce the
economic benefits of immigration.
• We do not account for the costs of higher immigration levels in key areas such
as settlement services, education, and infrastructure, though we assume that
the higher costs will be offset by the contributions of immigrants to the economy
(i.e., paying taxes and stimulating demand).
Chart 4Forecast of Immigrant Wages by Number of Years Post-Landing and Entry Class(share of Canadian average wage, per cent; years since landing)
Sources: The Conference Board of Canada; Statistics Canada.
0 1 2 3 4 5 6 7 8 9 10 11 12 13 14 15 16 17 18 19 20 21 22 23
0
20
40
60
80
100
Family class
Economic class
Refugee class
Total wages, weighted by immigrant composition

The Conference Board of Canada
Find Conference Board research at www.e-library.ca. 13
No Immigration Versus More Immigration
No Immigration Scenario Results What would happen to the economy if Canada shut its doors to
immigrants completely? The economic and fiscal consequences would
be negative. As shown in Table 1, Canada’s real GDP growth would slow
to an average of 1.3 per cent annually between 2017 and 2040, which
is 0.6 percentage points lower than the 1 per cent scenario’s average.
(See Chart 5.) Canada’s population would age more rapidly, with the
share of the 65 and over population reaching 26.9 per cent by 2040
(4.5 percentage points higher than under the 1 per cent scenario). As the
size of the labour force plummets, the ratio of workers to retirees drops
from 3.6 to 2.0 by 2040 (compared with a ratio of 2.6 under the 1 per
cent scenario).
Table 1No Immigration Scenario Results
Immigration rate (per cent)
Immigration (number) Population
Real GDP (2007 $ millions)
Annual real GDP growth (per cent)
Real GDP per capita (2007 $ 000s)
Workers per retiree ratio (20-64/65+)
Health care as a share of
provincial revenue
2017f 0.00 0 36,779,667 1,848,242 2.9 50,252 3.6 35.4
18f 0.00 0 36,830,395 1,878,479 1.6 51,003 3.5 35.3
19f 0.00 0 36,867,325 1,903,694 1.3 51,636 3.4 35.5
20f 0.00 0 36,890,873 1,930,033 1.4 52,317 3.3 35.8
21f 0.00 0 36,900,900 1,955,511 1.3 52,994 3.1 36.0
22f 0.00 0 36,897,173 1,980,742 1.3 53,683 3.0 36.3
23f 0.00 0 36,879,264 2,005,584 1.3 54,382 2.9 36.5
24f 0.00 0 36,846,754 2,030,258 1.2 55,100 2.8 36.7
25f 0.00 0 36,798,994 2,055,142 1.2 55,848 2.7 36.9
26f 0.00 0 36,735,475 2,080,530 1.2 56,635 2.6 37.2
27f 0.00 0 36,656,086 2,106,141 1.2 57,457 2.5 37.4
28f 0.00 0 36,560,648 2,131,553 1.2 58,302 2.4 37.6
29f 0.00 0 36,449,139 2,157,356 1.2 59,188 2.3 37.8
30f 0.00 0 36,321,821 2,183,144 1.2 60,106 2.3 38.0
31f 0.00 0 36,178,988 2,209,077 1.2 61,060 2.2 38.2
32f 0.00 0 36,021,568 2,235,884 1.2 62,071 2.2 38.4
(continued …)
© The Conference Board of Canada. All rights reserved. Please contact cboc.ca/ip with questions or concerns about the use of this material.
CANADA 2040No Immigration Versus More Immigration
Find Conference Board research at www.e-library.ca. 14
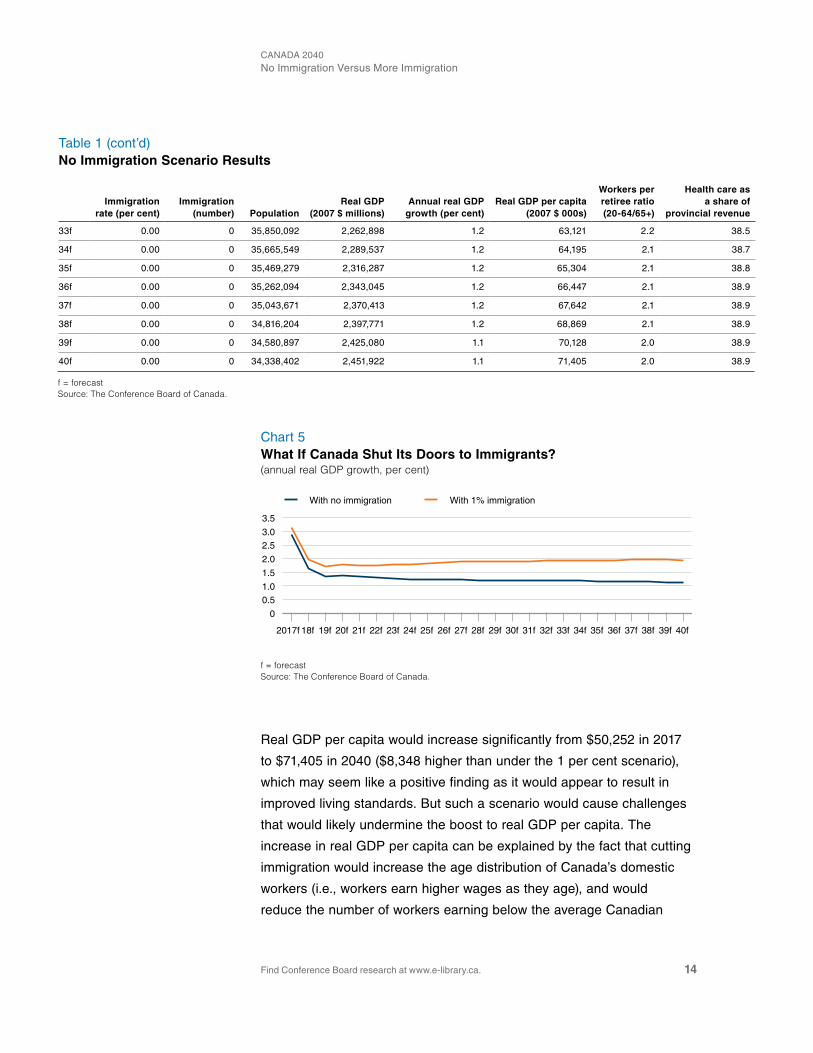
Table 1 (cont’d)No Immigration Scenario Results
Immigration rate (per cent)
Immigration (number) Population
Real GDP (2007 $ millions)
Annual real GDP growth (per cent)
Real GDP per capita (2007 $ 000s)
Workers per retiree ratio (20-64/65+)
Health care as a share of
provincial revenue
33f 0.00 0 35,850,092 2,262,898 1.2 63,121 2.2 38.5
34f 0.00 0 35,665,549 2,289,537 1.2 64,195 2.1 38.7
35f 0.00 0 35,469,279 2,316,287 1.2 65,304 2.1 38.8
36f 0.00 0 35,262,094 2,343,045 1.2 66,447 2.1 38.9
37f 0.00 0 35,043,671 2,370,413 1.2 67,642 2.1 38.9
38f 0.00 0 34,816,204 2,397,771 1.2 68,869 2.1 38.9
39f 0.00 0 34,580,897 2,425,080 1.1 70,128 2.0 38.9
40f 0.00 0 34,338,402 2,451,922 1.1 71,405 2.0 38.9
f = forecastSource: The Conference Board of Canada.
Real GDP per capita would increase significantly from $50,252 in 2017
to $71,405 in 2040 ($8,348 higher than under the 1 per cent scenario),
which may seem like a positive finding as it would appear to result in
improved living standards. But such a scenario would cause challenges
that would likely undermine the boost to real GDP per capita. The
increase in real GDP per capita can be explained by the fact that cutting
immigration would increase the age distribution of Canada’s domestic
workers (i.e., workers earn higher wages as they age), and would
reduce the number of workers earning below the average Canadian
Chart 5What If Canada Shut Its Doors to Immigrants?(annual real GDP growth, per cent)
f = forecastSource: The Conference Board of Canada.
2017f 18f 19f 20f 21f 22f 23f 24f 25f 26f 27f 28f 29f 30f 31f 32f 33f 34f 35f 36f 37f 38f 39f 40f
0
0.51.0
1.5
2.0
2.53.0
3.5
With no immigration With 1% immigration

The Conference Board of Canada
Find Conference Board research at www.e-library.ca. 15
wage. However, the existing literature does not suggest that immigrants
place downward pressures on the wages of domestic workers (i.e., the
Canadian-born and immigrants already in Canada).4
Another seemingly positive finding of this scenario is that the drastic
drop in Canada’s population to 34.3 million people by 2040 would see
average health care costs increase at a slower annual rate of 3.5 per
cent between 2017–40 (about 0.6 percentage points lower than under the
1 per cent scenario). But, all told, this scenario is likely to hurt Canadian
living standards since weak economic growth and a shrinking labour
force would result in declining public and private sector investments.
Moreover, Canada would likely need to increase tax rates to compensate
for the dwindling number of taxpayers.
The Atlantic region is a glaring example of the perils of weak population
growth. The region has experienced a vicious cycle of slow economic
growth, low public and private sector investment, and difficulties
retaining its own residents and immigrants.5 Moreover, as shown in
Atlantic Canada, weak population growth makes it more difficult for
governments to fund vital social services—especially as a population
ages and requires more costly services such as health care. The same
would occur across Canada if immigration was cut to zero, as a smaller
tax base would pressure governments across Canada to make tough
decisions, such as cutting social services in small and rural communities
where it would become difficult to justify making social investments in the
wake of population decline.
Can Productivity-Enhancing Investments Replace Immigrants?To help offset the negative economic and fiscal impacts of a shrinking
labour force, Canada would need to rely on more productivity growth6
through technological advancement (e.g., automation and artificial
4 Peri, “Do Immigrant Workers Depress the Wages of Native Workers?”
5 El-Assal and Goucher, Immigration to Atlantic Canada: Toward a Prosperous Future.
6 We are referring to total factor productivity (TFP) in this discussion (not labour productivity). TFP reflects technological change and is the portion of potential economic growth that is unexplained after accounting for labour and capital. On the other hand, labour productivity is calculated by dividing total output by the number of workers or hours worked.
Weak population growth makes it more difficult for governments to fund vital social services.
© The Conference Board of Canada. All rights reserved. Please contact cboc.ca/ip with questions or concerns about the use of this material.

CANADA 2040No Immigration Versus More Immigration
Find Conference Board research at www.e-library.ca. 16
intelligence) to substitute workers—which could be prompted by rapidly
increasing wages in a labour-constrained world. Productivity growth is
important because it is among the three components that allow Canada
to increase its potential output and the living standard of its citizens.
Potential output measures the highest sustainable level of real GDP
that an economy can attain based on its productivity, labour supply, and
capital stock (the total value of physical capital within an economy used
to produce goods and services).
We use optimistic forecasts on Canada’s future total factor productivity
growth based on the assumption that the rate of technological
advancement will be much faster moving forward. (See charts 6 and 7.)
Labour force growth is forecast to have a smaller impact on potential
output than it did between 2000 and 2010 and in previous decades,
since the arrival of Generation Z (those born after 1993) into the labour
market will not be enough to replenish the wave of baby boomers set to
retire—which will constrain Canada’s economic growth potential. To help
offset the negative economic and fiscal impacts of a shrinking labour
force in a no-immigration world, Canada would need to rely more on
productivity-enhancing investments to substitute workers. However, to
replicate the potential output it could otherwise achieve by having labour
force growth contribute positively to its potential output, Canada would
need to see an increase in private and public investments to significantly
lift productivity—a situation that is unlikely in an environment of low
economic growth and (potentially) higher taxes.
Chart 6Canada’s Total Factor Productivity, 1980–2040(per cent)
f = forecastSource: The Conference Board of Canada.
1980 85 90 95 100500 15 20f 25f 30f 35f 40f
30
35
40
45
50Forecast

The Conference Board of Canada
Find Conference Board research at www.e-library.ca. 17
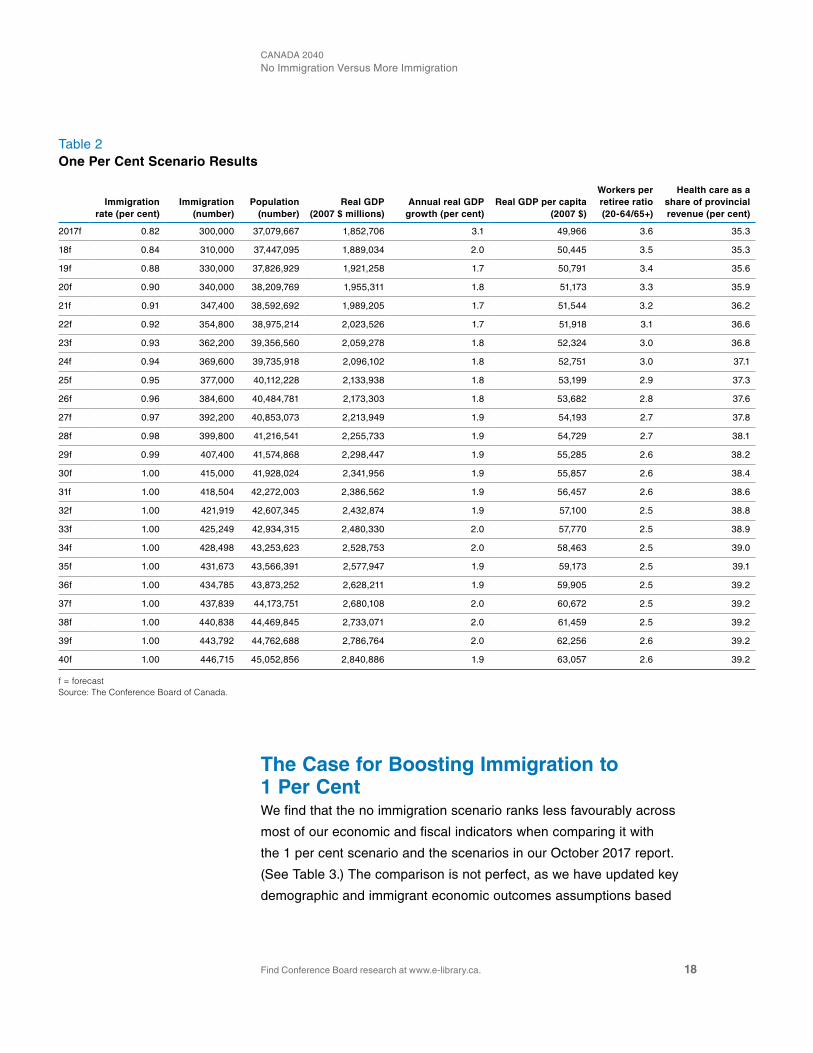
One Per Cent Immigration Scenario ResultsUnder the 1 per cent scenario, real GDP grows at an average annual
rate of 1.9 per cent over 2017–40. Despite the increase in immigration
over this period, Canada’s population continues to age significantly, with
the share of the population 65 and over reaching 22.4 per cent by 2040
(up from 16.9 per cent in 2017). The ratio of workers to retirees declines
from 3.6 to 2.6 by 2040. Real GDP per capita improves from $49,966 in
2017 to $63,057 in 2040, and Canada’s population grows from 37 million
to just over 45 million. (See Table 2.) Aging causes health care costs
to rise significantly—by an average of 4.1 per cent annually between
2017–40—and accounts for 39.2 per cent of provincial revenues in 2040
(up from 35.3 per cent in 2017).
Chart 7Components of Potential Output Growth, 1 Per Cent Scenario(contribution to annual growth, percentage point)
f = forecastSource: The Conference Board of Canada.
2000−10 17f 20f 30f 40f
0
0.5
1.0
1.5
2.0
2.5
Capital Labour Productivity
Forecast
© The Conference Board of Canada. All rights reserved. Please contact cboc.ca/ip with questions or concerns about the use of this material.
CANADA 2040No Immigration Versus More Immigration
Find Conference Board research at www.e-library.ca. 18
Table 2One Per Cent Scenario Results
Immigration rate (per cent)
Immigration (number)
Population (number)
Real GDP (2007 $ millions)
Annual real GDP growth (per cent)
Real GDP per capita (2007 $)
Workers per retiree ratio (20-64/65+)
Health care as a share of provincial revenue (per cent)
2017f 0.82 300,000 37,079,667 1,852,706 3.1 49,966 3.6 35.3
18f 0.84 310,000 37,447,095 1,889,034 2.0 50,445 3.5 35.3
19f 0.88 330,000 37,826,929 1,921,258 1.7 50,791 3.4 35.6
20f 0.90 340,000 38,209,769 1,955,311 1.8 51,173 3.3 35.9
21f 0.91 347,400 38,592,692 1,989,205 1.7 51,544 3.2 36.2
22f 0.92 354,800 38,975,214 2,023,526 1.7 51,918 3.1 36.6
23f 0.93 362,200 39,356,560 2,059,278 1.8 52,324 3.0 36.8
24f 0.94 369,600 39,735,918 2,096,102 1.8 52,751 3.0 37.1
25f 0.95 377,000 40,112,228 2,133,938 1.8 53,199 2.9 37.3
26f 0.96 384,600 40,484,781 2,173,303 1.8 53,682 2.8 37.6
27f 0.97 392,200 40,853,073 2,213,949 1.9 54,193 2.7 37.8
28f 0.98 399,800 41,216,541 2,255,733 1.9 54,729 2.7 38.1
29f 0.99 407,400 41,574,868 2,298,447 1.9 55,285 2.6 38.2
30f 1.00 415,000 41,928,024 2,341,956 1.9 55,857 2.6 38.4
31f 1.00 418,504 42,272,003 2,386,562 1.9 56,457 2.6 38.6
32f 1.00 421,919 42,607,345 2,432,874 1.9 57,100 2.5 38.8
33f 1.00 425,249 42,934,315 2,480,330 2.0 57,770 2.5 38.9
34f 1.00 428,498 43,253,623 2,528,753 2.0 58,463 2.5 39.0
35f 1.00 431,673 43,566,391 2,577,947 1.9 59,173 2.5 39.1
36f 1.00 434,785 43,873,252 2,628,211 1.9 59,905 2.5 39.2
37f 1.00 437,839 44,173,751 2,680,108 2.0 60,672 2.5 39.2
38f 1.00 440,838 44,469,845 2,733,071 2.0 61,459 2.5 39.2
39f 1.00 443,792 44,762,688 2,786,764 2.0 62,256 2.6 39.2
40f 1.00 446,715 45,052,856 2,840,886 1.9 63,057 2.6 39.2
f = forecastSource: The Conference Board of Canada.
The Case for Boosting Immigration to 1 Per CentWe find that the no immigration scenario ranks less favourably across
most of our economic and fiscal indicators when comparing it with
the 1 per cent scenario and the scenarios in our October 2017 report.
(See Table 3.) The comparison is not perfect, as we have updated key
demographic and immigrant economic outcomes assumptions based

The Conference Board of Canada
Find Conference Board research at www.e-library.ca. 19
on the most recent data. One notable change is that we have improved
our immigrant employment rate assumptions compared with the October
2017 report, which strengthens the 1 per cent scenario’s real GDP and
GDP per capita results. As such, the 1 per cent scenario is superior
across most economic and fiscal metrics when compared with the
other scenarios.
Table 3Comparing the Scenario Results in 2040
Canada (end of 2017) 1 per cent scenario No immigration
scenario Status quo
scenario* Medium immigration
scenario*High immigration
scenario*
Immigration (number) 300,000 446,715 0 361,824 450,000 528,466
Immigration rate (per cent) n.a. 1.00 0.00 0.82 0.99 1.11
Population (number) 37,079,667 45,052,856 34,388,402 44,290,842 45,624,736 47,929,010
Population share aged 65 and over (per cent)
16.9 22.4 26.9 24 23.2 22.5
Workers per retiree ratio 3.6 2.6 2.0 2.4 2.4 2.5
Real GDP (2007 $ millions) 1,852,706 2,840,886 2,451,922 2,785,941 2,844,593 2,924,989
Average annual real GDP growth (2017–40)
3.1 1.9 1.3 1.9 1.9 2.1
Real GDP per capita (2007 $) 49,966 63,057 71,405 62,901 62,348 61,628
Health care costs as share of provincial revenues (per cent)
35.0 39.2 38.9 42.6 40.7 40.5
n.a. = not applicable*results from The Conference Board of Canada’s October 2017 report 450,000 Immigrants Annually? Integration Is Imperative to GrowthNote: We have improved our immigrant employment rate assumptions compared with the October 2017 report, which strengthens this report’s real GDP and GDP per capita results.Source: The Conference Board of Canada.
Our forecasts suggest that bumping the immigration rate to 1 per cent of
the population by the early 2030s is a worthwhile policy measure to help
mitigate the anticipated challenges of population aging and a low birth
rate on the country’s economic and fiscal standing. Since the mid-1990s,
Canada’s population has grown at a rate of about 1 per cent per year. At
present, natural increase (births minus deaths) accounts for an estimated
29 per cent of the Canada’s annual population growth. (See Chart
8.) However, with the natural increase declining, immigration’s share
of annual population growth will rise from about 71 per cent today to
100 per cent by 2034, when the number of deaths is forecast to exceed
births. (See Chart 9.)
© The Conference Board of Canada. All rights reserved. Please contact cboc.ca/ip with questions or concerns about the use of this material.

CANADA 2040No Immigration Versus More Immigration
Find Conference Board research at www.e-library.ca. 20
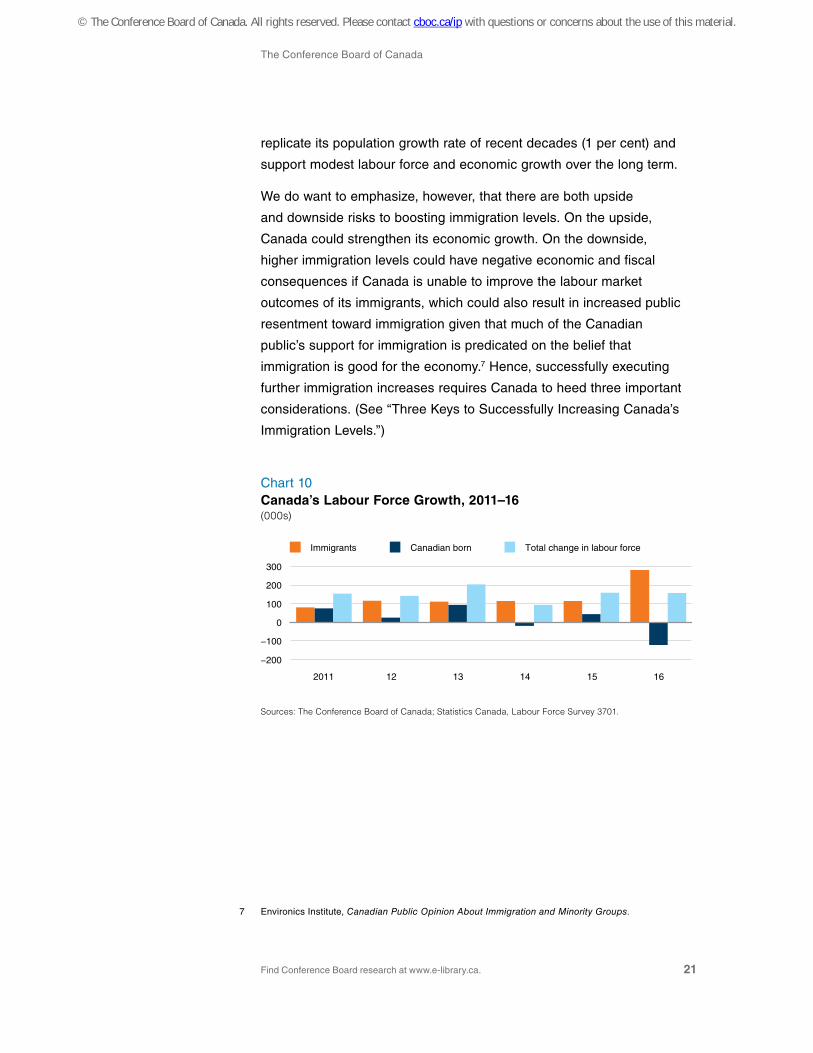
Canada is already at a point where it is almost entirely dependent on
immigration for its labour force growth. Between 2011 and 2016, Canada
added some 902,100 workers to its labour force, 90 per cent of whom
were immigrants. (See Chart 10.) On two recent occasions (in 2014
and 2016), immigration accounted for over 100 per cent of labour force
growth. As such, based on current demographic trends, increasing the
immigration rate to 1 per cent by the early 2030s will allow Canada to
Chart 8Natural Increase to Become a Declining Component of Population Growth(growth, 000s; share of growth, per cent)
f = forecastSources: The Conference Board of Canada; Statistics Canada.
2000 02 04 06 08 10 12 14 16f 18f 20f 22f 24f 26f 28f 30f 32f 34f 36f 38f 40f
−50
0
50
100
150
−15
0
15
30
45
Births minus deaths (left)
Births minus deaths as a share of total population growth (right)
Forecast
Chart 9Immigration Will Be Key to Growing Canada’s Population(immigration, 000s; share of population change, per cent)
f = forecastSources: The Conference Board of Canada; Statistics Canada.
1991 94 97 00 03 06 09 12 15 18f 21f 24f 27f 30f 33f 36f 39f
0
100
200
300
400
0
30
60
90
120
Net immigration (left)
Net immigration as a share of total population change (right)
Forecast
The Conference Board of Canada
Find Conference Board research at www.e-library.ca. 21
replicate its population growth rate of recent decades (1 per cent) and
support modest labour force and economic growth over the long term.
We do want to emphasize, however, that there are both upside
and downside risks to boosting immigration levels. On the upside,
Canada could strengthen its economic growth. On the downside,
higher immigration levels could have negative economic and fiscal
consequences if Canada is unable to improve the labour market
outcomes of its immigrants, which could also result in increased public
resentment toward immigration given that much of the Canadian
public’s support for immigration is predicated on the belief that
immigration is good for the economy.7 Hence, successfully executing
further immigration increases requires Canada to heed three important
considerations. (See “Three Keys to Successfully Increasing Canada’s
Immigration Levels.”)
7 Environics Institute, Canadian Public Opinion About Immigration and Minority Groups.
Chart 10Canada’s Labour Force Growth, 2011–16(000s)
Sources: The Conference Board of Canada; Statistics Canada, Labour Force Survey 3701.
2011 12 13 14 15 16
−200
−100
0
100
200
300
Immigrants Canadian born Total change in labour force
© The Conference Board of Canada. All rights reserved. Please contact cboc.ca/ip with questions or concerns about the use of this material.

CANADA 2040No Immigration Versus More Immigration
Find Conference Board research at www.e-library.ca. 22
Three Keys to Successfully Increasing Canada’s Immigration Levels
It is essential for Canada to pursue three measures to ensure that it
benefits from more immigration and to mitigate the downside risks of higher
immigration levels.
First, Canada must continue to identify solutions to improve the labour market
integration of immigrants so that it can reap greater economic and fiscal rewards
from immigration. The vast majority of Canada’s immigrants are not admitted
based on their human capital characteristics, so it is understandable that they
have weaker labour market outcomes (e.g., earnings) than the national average.
At the same time, there remains plenty of room for improvement to enhance
immigrants’ labour market performance, which would benefit them, their families,
and Canada as a whole.
Second, Canada’s population will continue to grow as it welcomes more
immigrants, which requires proactive measures to maintain the country’s
prosperity. As such, Canada will need to expand its capacity to absorb more
immigrants by identifying how to grow its economy so that the Canadian-born
population and newcomers alike can access good job opportunities and social
services such as education, health care, affordable housing, and the other
necessities that contribute to Canada’s high living standards.
Third, in the wake of rising anti-immigrant sentiments around the world, Canada
must be proactive in its efforts to maintain public support for its immigration
system. Otherwise, it risks seeing anti-immigrant sentiments undermine its ability
to welcome more newcomers in support of the country’s economic growth. To
do this, Canada needs to preserve strong management of its borders and the
integrity of its immigration and temporary resident programs (e.g., the Temporary
Foreign Worker Program), provide good job opportunities and social services
to its citizens, and promote safe spaces for open debate on the merits and
drawbacks of immigration. The last point is especially important, as increased
scrutiny could enhance public support of the immigration system.

The Conference Board of Canada
Find Conference Board research at www.e-library.ca. 23
Forecasting the Contributions to Economic Growth of the Three Immigration ClassesOne of the benefits of testing the no immigration scenario is that it also
allows us to control for the economic impact of each immigration class.
Canada’s economy grew at a healthy rate in 2017. This was the fastest
pace of growth since 2011 and was due to key factors such as strong
consumer spending, a hot housing market, and the fastest labour force
growth in a decade.8 As such, immigration had a relatively muted impact
on GDP growth in 2017, contributing about 0.25 percentage points
to estimated total growth of 3.1 per cent. (See Table 4.) However, we
forecast that Canada’s economic growth will slow in the decades to
come, in large part due to unfavourable demographic forces, including
population aging, a low birth rate, and weaker labour force growth.
Immigration’s economic impact will swell if Canada continues to up its
admissions. By 2030, under the 1 per cent scenario, we estimate that
immigration will account for over one-third of Canada’s annual real GDP
growth. (See Table 5.)
Table 4Immigration’s Contribution to Canada’s Economic Growth(average annual contribution to real GDP growth, percentage point)
Real GDP growth All immigration Economic class Family class Refugee class
2017f 3.1 0.25 0.19 0.05 0.01
20f 2.1 0.33 0.24 0.07 0.02
25f 1.9 0.43 0.30 0.09 0.03
30f 1.9 0.51 0.36 0.11 0.04
35f 1.9 0.57 0.40 0.13 0.05
40f 1.9 0.62 0.44 0.15 0.06
f = forecastNote: We compared the status quo scenario results with the no immigration scenario results to arrive at these figures. The totals may not add up due to rounding.Source: The Conference Board of Canada.
8 Stewart, Canadian Outlook Bulletin: Winter 2018.
Immigration’s economic impact will swell if Canada continues to up its admissions.
© The Conference Board of Canada. All rights reserved. Please contact cboc.ca/ip with questions or concerns about the use of this material.

CANADA 2040No Immigration Versus More Immigration
Find Conference Board research at www.e-library.ca. 24
Table 5Immigration’s Contribution to Canada’s Economic Growth, by Admissions Class(percentage share contribution to real GDP growth)
All immigration As percentage of all immigration
Economic class Family class Refugee class
2017f 7.9 74.6 19.4 6.0
20f 22.0 71.1 21.5 7.4
25f 32.4 69.6 21.7 8.8
30f 37.5 68.4 22.3 9.3
35f 41.1 65.7 23.4 10.9
40f 44.7 62.9 25.4 11.7
f = forecastNote: The totals may not add up due to rounding.Source: The Conference Board of Canada.
The results of the economic impact of each immigration class are
unsurprising given that only one class is admitted based on ability
to contribute to the economy. In 2017, of the 0.25 percentage points
that immigration contributed to real GDP growth, the economic class
accounted for nearly three-quarters of it. This despite the fact that the
economic class accounts for 58 per cent of Canada’s total immigrant
admissions. The family and refugee classes punch below their weight
relative to their share of Canada’s total immigrant admissions. In
2017, the family class made up about one-fifth of immigration’s total
contribution to real GDP growth even though it accounted for just
over one-quarter of total immigrant admissions. Over the forecast, the
economic class disproportionately accounts for the majority (just under
three-quarters) of immigration’s total contribution to Canada’s real
GDP growth.
At first blush, the contributions of the family and refugee classes
to economic growth are underwhelming, but there are several
considerations that we need to keep in mind. Second-generation
immigrants tend to have comparable economic outcomes to those of the
Canadian-born population, which is something we do not account for in
our forecasts since it ends in 2040, but is another factor that likely boosts
the economic impact of all three immigration classes. In addition, it would

The Conference Board of Canada
Find Conference Board research at www.e-library.ca. 25
be a mistake to judge the family and refugee classes only through an
economic lens given that Canada welcomes immigrants under these two
classes for social and humanitarian reasons. Moreover, while refugees
certainly do contribute to the Canadian economy—as evidenced by the
fact that refugees who have lived in Canada for over five years have a
higher employment rate than the national average—the primary motive
for Canada’s admissions of refugees is to provide them sanctuary.
As such, while we do not delve deeper into the economic impact of
the refugee class, we believe it is reasonable to also evaluate family
reunification through an economic lens—and not just a social one—
given how prominent a role it plays in total immigrant admissions.
The Economic Impacts of Family ReunificationWe want to preface our analysis by noting that the economic impacts
of the family class can’t be fully assessed by focusing on the average
employment and wage characteristics of members of this class. Families
are social units by definition.9 Other metrics, that take this consideration
into account, need to be analyzed to better understand how family class
immigrants fare in, and contribute to, the Canadian economy. (See
“Defining the Family Class.”)
Defining the Family Class
Canadian citizens and permanent residents are eligible to sponsor certain family
members for immigration to the country, including:
• spouses, partners, and dependent children;
• parents and grandparents;
• close relatives related by blood or adoption.10
Sponsors must meet various conditions, including minimum income
requirements and agreeing to provide any required financial support to their
9 VanderPlaat, Ramos, and Yoshida, “What do Sponsored Parents and Grandparents Contribute?”
10 Immigration, Refugees and Citizenship Canada, “Sponsor Your Relatives — Who Can Sponsor.”
© The Conference Board of Canada. All rights reserved. Please contact cboc.ca/ip with questions or concerns about the use of this material.

CANADA 2040No Immigration Versus More Immigration
Find Conference Board research at www.e-library.ca. 26
relative so that the relative does not draw upon Canadian social assistance
(we discuss this further below). Canadians and permanent residents may only
sponsor one other close relative if they do not have another living relative that
they could sponsor instead.
Supplementing Household IncomeFamily class immigrants earn significantly less on average than
economic class principal applicants and than the average Canadian
wage, but a major benefit of family reunification is that it helps to boost
household income. For example, it can allow immigrants to work longer
hours if they have family in Canada to help with child care. In 2014,
Immigration, Refugees and Citizenship Canada (IRCC) conducted an
evaluation of its family reunification program, which included surveying
immigrants to better understand how family reunification affects them
economically and socially.11 Eighty-five per cent of respondents said
that their parents/grandparents provided child care.12 Among those
who sponsored a relative for immigration to Canada, 66 per cent said
that their spouse/partner contributed to the household income often,
while an additional 14 per cent said they contribute sometimes. Another
15 per cent of sponsors said that their parents/grandparents contribute
to the household income often, while 21 per cent said they contribute
sometimes. This means that family reunification not only helps to boost
household incomes of immigrants but can also reduce costly expenses
such as child care.
Family reunification’s role in supplementing household income is
reflected in Table 6,13 which shows the extent to which household
incomes of immigrant families increase with each subsequent earner.
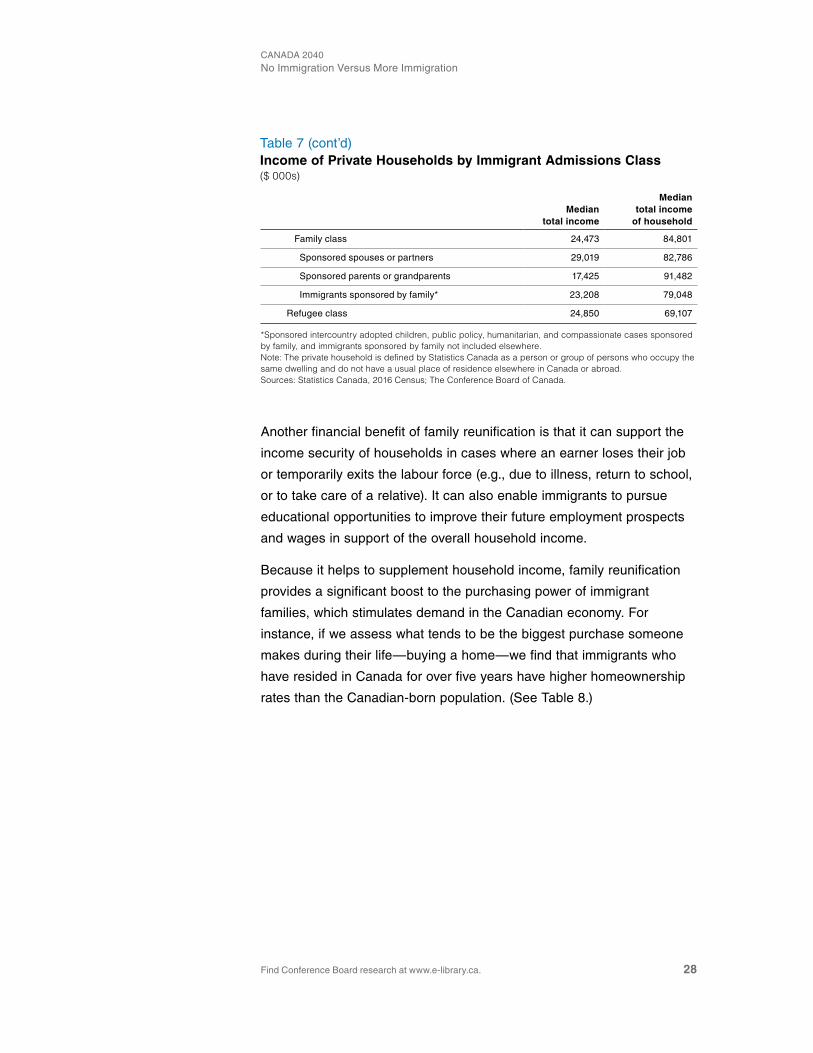
Moreover, Table 7 highlights that although individual members of the
family class earn below the average Canadian wage, the fact that they
are earning some form of income enables immigrant families to have
household incomes comparable with those of Canadian-born families.
11 Immigration, Refugees and Citizenship Canada, Evaluation of the Family Reunification Program.
12 Ibid.
13 Note that Table 6 evaluates the incomes of economic families, while Table 7 evaluates private households. The definitions for these units are contained in each table.
A major benefit of family reunification is that it helps to boost household income.

The Conference Board of Canada
Find Conference Board research at www.e-library.ca. 27
(See Table 7.) This suggests that one of the challenges of assessing the
individual economic outcomes of family class immigrants is it does not
take into account the behavioural dimensions of immigrant households.
Because immigrant families are seeking reunification, individuals within
the family may be willing to sacrifice their career prospects to facilitate
the reunification.14 As such, immigrant families are more likely to make
decisions based on their objective of having a satisfactory household
income rather than on individuals within the family seeking to maximize
their personal earnings.
Table 6Income of Economic Families, Immigrants and Non-Immigrants(median total income, $)
Immigrant families Canadian-born families
Total earners 84,612 90,126
No earners 38,392 42,323
1 earner 60,663 62,569
2 earners 94,940 103,370
3 or more earners 127,022 142,728
Note: Statistics Canada defines an economic family as a group of two or more persons who live in the same dwelling and are related to each other by blood, marriage, common-law union, adoption, or a foster relationship.Sources: Statistics Canada, 2016 Census; The Conference Board of Canada.
Table 7Income of Private Households by Immigrant Admissions Class($ 000s)
Median
total income
Median total income
of household
TOTAL (CANADA-BORN AND IMMIGRANT HOUSEHOLDS) 34,205 85,950
Canadian-born household 36,305 88,310
Immigrant household 29,768 81,335
Total (immigrant admissions class and applicant type) 28,151 83,350
Economic class 32,321 87,578
Principal applicants 40,839 85,221
Secondary applicants 24,939 89,468
(continued …)
14 Bonikowska and Hou, Labour Market Outcomes of Immigrant Women.
© The Conference Board of Canada. All rights reserved. Please contact cboc.ca/ip with questions or concerns about the use of this material.
CANADA 2040No Immigration Versus More Immigration
Find Conference Board research at www.e-library.ca. 28
Table 7 (cont’d)Income of Private Households by Immigrant Admissions Class($ 000s)
Median
total income
Median total income
of household
Family class 24,473 84,801
Sponsored spouses or partners 29,019 82,786
Sponsored parents or grandparents 17,425 91,482
Immigrants sponsored by family* 23,208 79,048
Refugee class 24,850 69,107
*Sponsored intercountry adopted children, public policy, humanitarian, and compassionate cases sponsored by family, and immigrants sponsored by family not included elsewhere.Note: The private household is defined by Statistics Canada as a person or group of persons who occupy the same dwelling and do not have a usual place of residence elsewhere in Canada or abroad.Sources: Statistics Canada, 2016 Census; The Conference Board of Canada.
Another financial benefit of family reunification is that it can support the
income security of households in cases where an earner loses their job
or temporarily exits the labour force (e.g., due to illness, return to school,
or to take care of a relative). It can also enable immigrants to pursue
educational opportunities to improve their future employment prospects
and wages in support of the overall household income.
Because it helps to supplement household income, family reunification
provides a significant boost to the purchasing power of immigrant
families, which stimulates demand in the Canadian economy. For
instance, if we assess what tends to be the biggest purchase someone
makes during their life—buying a home—we find that immigrants who
have resided in Canada for over five years have higher homeownership
rates than the Canadian-born population. (See Table 8.)

The Conference Board of Canada
Find Conference Board research at www.e-library.ca. 29
Table 8Homeownership Rates(per cent)
Immigration status Homeownership rate
All households 68.7
Non-immigrants 69.3
All immigrants 68.7
Landed before 2011 72.3
Newcomers (landed 2011–16) 34.6
Note: Totals exclude non-permanent residents.Sources: Canada Housing and Mortgage Corporation; Statistics Canada, 2016 Census; The Conference Board of Canada.
Settlement and IntegrationOne of the key benefits of family reunification is it helps promote
the settlement and integration of immigrants, including of sponsors
themselves. For instance, immigrants reported in the IRCC evaluation
that they felt happy and settled in their careers and personal lives after
being reunited with their spouse/partner.15 This is an especially important
point to keep in mind as Canada continues to recruit more immigrants
in support of its economic growth. While the economic class—namely
principal applicants—are highly coveted due to the skills they add to the
labour market, the family class is crucial to Canada’s overall efforts to
attract, settle, integrate, and retain members of the economic class—and
immigrants as a whole. Consider an economic class principal applicant
who gets married to a spouse living abroad—Canada is able to boost its
odds of benefiting from the principal applicant’s human capital over the
long run by facilitating an efficient reunification process with their spouse.
15 Immigration, Refugees and Citizenship Canada, Evaluation of the Family Reunification Program.
Family class immigrants have higher retention rates in their province of landing than the economic class.
© The Conference Board of Canada. All rights reserved. Please contact cboc.ca/ip with questions or concerns about the use of this material.
CANADA 2040No Immigration Versus More Immigration
Find Conference Board research at www.e-library.ca. 30
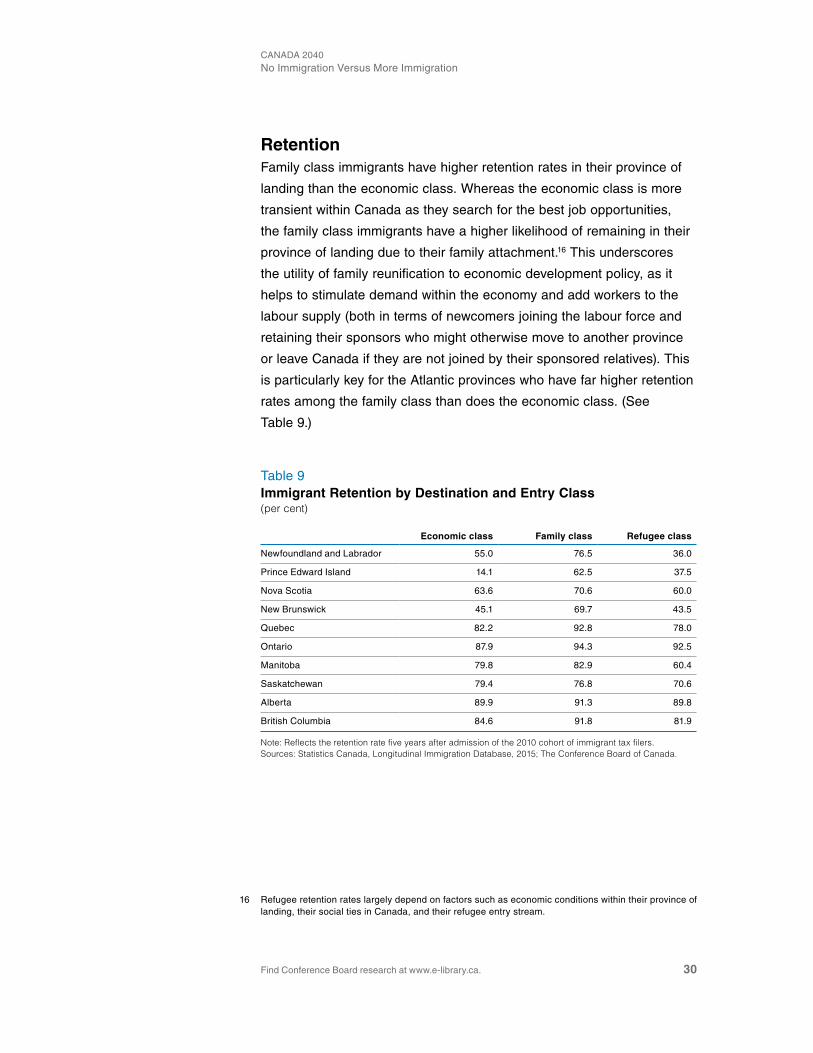
Retention Family class immigrants have higher retention rates in their province of
landing than the economic class. Whereas the economic class is more
transient within Canada as they search for the best job opportunities,
the family class immigrants have a higher likelihood of remaining in their
province of landing due to their family attachment.16 This underscores
the utility of family reunification to economic development policy, as it
helps to stimulate demand within the economy and add workers to the
labour supply (both in terms of newcomers joining the labour force and
retaining their sponsors who might otherwise move to another province
or leave Canada if they are not joined by their sponsored relatives). This
is particularly key for the Atlantic provinces who have far higher retention
rates among the family class than does the economic class. (See
Table 9.)
Table 9Immigrant Retention by Destination and Entry Class(per cent)
Economic class Family class Refugee class
Newfoundland and Labrador 55.0 76.5 36.0
Prince Edward Island 14.1 62.5 37.5
Nova Scotia 63.6 70.6 60.0
New Brunswick 45.1 69.7 43.5
Quebec 82.2 92.8 78.0
Ontario 87.9 94.3 92.5
Manitoba 79.8 82.9 60.4
Saskatchewan 79.4 76.8 70.6
Alberta 89.9 91.3 89.8
British Columbia 84.6 91.8 81.9
Note: Reflects the retention rate five years after admission of the 2010 cohort of immigrant tax filers.Sources: Statistics Canada, Longitudinal Immigration Database, 2015; The Conference Board of Canada.
16 Refugee retention rates largely depend on factors such as economic conditions within their province of landing, their social ties in Canada, and their refugee entry stream.

The Conference Board of Canada
Find Conference Board research at www.e-library.ca. 31
Social and Cultural BenefitsWhile it is beyond the scope of this study, we note that the value of
family reunification can’t be fully assessed without recognizing its
social and cultural merits. As others have observed, social benefits
include family class immigrants volunteering, enhancing cohesion
within communities, and providing emotional and household support
(e.g., performing chores).17 Family class immigrants also impart their
cultural heritage to younger family members (e.g., their children and
grandchildren), which can help strengthen Canada’s business and
cultural ties with the rest of the world (e.g., family members helping
children develop foreign language proficiency, which can be used in
future Canadian business settings).
Family Class Economic ChallengesDespite the overall benefits of family reunification to the Canadian
economy, it presents several challenges that require attention. While the
family class has comparable labour force characteristics when compared
with Canada’s total population, the data suggest there remains room for
improvement in terms of boosting the economic outcomes of members
within this class. According to a recent Statistics Canada study, the
family class has a higher rate of chronic low income18 than the economic
and refugee classes.19 However, on the bright side, chronic low income
among the family class declined from 18.5 per cent in 2000 to 14.6 per
cent in 2012. Family class immigrants face labour market barriers (as do
members of the other two immigrant classes) that hinder their ability to
reach their economic potential in Canada. One challenge we identified
in a recent study is that immigrant spouses may struggle to participate
in the labour market because they do not have access to affordable
child care.20 This is one of several factors21 that can help explain why
17 Immigration, Refugees and Citizenship Canada, Evaluation of the Family Reunification Program; VanderPlaat, Ramos and Yoshida, “What Do Sponsored Parents and Grandparents Contribute?”
18 Defined as having a family income below Statistic Canada’s low-income cut-off for five consecutive years or more.
19 Picot and Lu, Chronic Low Income Among Immigrants in Canada and Its Communities.
20 El-Assal and Goucher, Immigration to Atlantic Canada: Toward a Prosperous Future.
21 Other factors include the human capital characteristics of immigrant women, cultural gender norms, and the number of social connections. See Hudon, “Immigrant Women.”
Immigrant spouses may struggle to participate in the labour market because they do not have access to affordable child care.
© The Conference Board of Canada. All rights reserved. Please contact cboc.ca/ip with questions or concerns about the use of this material.

CANADA 2040No Immigration Versus More Immigration
Find Conference Board research at www.e-library.ca. 32
immigrant women have a lower labour force participation rate22 than
Canadian-born women (immigrant and Canadian-born men have
identical rates). Addressing labour market barriers is important given that
Canada is becoming increasingly reliant on immigration for its labour
force growth and overall prosperity. Doing so is also crucial as it will help
improve the living standards of immigrant households.
One of the reasons for the high rate of chronic low income among
family class immigrants is the prevalence of immigrant seniors with very
low earnings,23 which ties into another challenge. Immigrants admitted
under the sponsored parent and grandparent stream have been subject
to criticism that they present an economic burden to Canada.24 Some
public opinion polls have found that the majority of respondents disagree
with allowing immigrants to sponsor their parents and grandparents.25
Since they are older, immigrants admitted under this stream have lower
labour force participation rates, earnings, and are more likely to require
health care.
It is important to note that one of the federal government’s family
reunification objectives is to ensure that the family class does not present
an undue economic burden by relying upon social assistance.26 (See
“Family Class Undertakings.”) While the stream has some economic
benefits when we analyze how parents and grandparents contribute
to their families and communities (i.e., supplementing the household
income, provision of child care, volunteering), Canada, in recent years,
has taken several steps to reduce the parent and grandparent stream’s
potential economic burden. In 2014, the federal government doubled
the length of the undertaking period for this stream to 20 years.27 In
2011, it introduced the super visa program, which provides parents and
grandparents with Canadian temporary residence for a period of up to
22 Hudon, “Immigrant Women.”
23 Picot and Lu, Chronic Low Income Among Immigrants in Canada and Its Communities.
24 VanderPlaat, Ramos and Yoshida, “What Do Sponsored Parents and Grandparents Contribute?”
25 Immigration, Refugees and Citizenship Canada, Evaluation of the Family Reunification Program; Forum Research, “Federal – Immigration (Forum Research).”
26 Immigration, Refugees and Citizenship Canada, Evaluation of the Family Reunification Program.
27 Immigration, Refugees and Citizenship Canada, “Parent and Grandparent Program Sponsorship.”
The Conference Board of Canada
Find Conference Board research at www.e-library.ca. 33
10 years as long as they purchase Canadian medical insurance and their
sponsor earns the minimum necessary income.28
Recent and future immigration levels suggest that Canada has given
less priority to parent and grandparent admissions, which is also likely
part of the country’s efforts to mitigate the potential economic burden of
this stream. This is indicated by this stream’s intake holding constant at
about 20,000 admissions per year for more than a decade (and during
the 2018–20 levels plan), even as Canada’s overall immigrant intake
continues to rise.
Family Class Undertakings
To mitigate the possibility that family class immigrants will pose a burden to the
economy, Canada requires an undertaking agreement in which the Canadian
sponsor commits to reimbursing any social assistance that the person arriving
under the family class claims within a certain length of time (e.g., three years for
spouses and dependants, 20 years for parents and grandparents). The purpose
of the undertaking agreement is to encourage members of the family class to
integrate economically and to ensure that any social assistance claimed within
the undertaking period comes at the expense of a private resident (the sponsor)
rather than at the expense of the Canadian public.
ConclusionThe no immigration scenario underscores the importance of immigration
to Canada’s future prosperity. In the absence of immigration, Canada
would face constrained economic growth and greater challenges
funding rising social costs in health care and other important areas. If it
stopped immigration, Canada would need to see very rapid technological
advancement to replicate the potential output it could otherwise achieve
if it continued to rely on immigration to grow its labour force. Assuming
it increases to 1 per cent of Canada’s population, immigration will
28 Immigration, Refugees and Citizenship Canada, “Applying for a Parent and Grandparent Super Visa.”
© The Conference Board of Canada. All rights reserved. Please contact cboc.ca/ip with questions or concerns about the use of this material.

CANADA 2040No Immigration Versus More Immigration
Find Conference Board research at www.e-library.ca. 34
contribute to more than one-third of the country’s annual real GDP
growth by 2030. Boosting the immigration rate to 1 per cent by the early
2030s—when we project that immigration will account for 100 per cent
of Canada’s population growth—would help sustain modest population,
labour force, and economic growth over the long term. In addition, the
1 per cent scenario ranks favourably across most economic and fiscal
scenarios when compared with our other scenarios.
The economic class unsurprisingly accounts for most of immigration’s
total contribution to real GDP growth (nearly three-quarters of it). The
family and refugee classes have less of an economic impact, but this
is due to members of these classes being admitted for social and
humanitarian reasons rather than for their human capital. Hence, under
our forecasting model, which uses individual labour force characteristics
to project the impacts of immigration and the three classes on the
economy, the family and refugee classes under-contribute relative to
their share of Canada’s total immigrant admissions. But it would be a
mistake to assess their economic impact only this way, which is why use
other metrics to evaluate the economic contributions of the family class.
Low earnings and the prevalence of chronic low income among the
family class are issues of concern that need to be addressed to help
boost the living standards of immigrant families, and to help Canada
benefit from their human capital in the labour market as it becomes more
dependent on immigrant support for its economic growth. Our findings
emphasize the importance of assessing the economic impact of the
family class as social units (e.g., by looking at their household incomes)
rather than as individuals. This is a key consideration as Canada
continues to evaluate the distribution of its immigrant composition in the
years and decades to come. While Canada has prioritized economic
class admissions since the mid-1990s, family class admissions should
also be viewed as part of economic development policy. Immigrant
families are faring well in relation to Canadian-born families in important
economic metrics such as household income and homeownership.
Immigrant families bring other benefits as well, such as boosting
immigrant retention rates, important to population and economic growth
in Atlantic Canada, and to all other provinces as well.

The Conference Board of Canada
Find Conference Board research at www.e-library.ca. 35
Immigration has been vital to Canada’s prosperity throughout the
country’s history and is poised to play an even bigger role moving
forward. Canada needs to remain proactive in its efforts to benefit
from immigration. This means enhancing the labour market outcomes
of immigrants, increasing the country’s capacity to absorb more
newcomers so that Canadians and newcomers have access to
opportunity, and working hard to maintain robust public support for
the immigration system—which is fundamental to Canada’s continued
immigration success.
Rate this publication for a chance to win a prize!
www.conferenceboard.ca/e-Library/abstract.aspx?did=9678
© The Conference Board of Canada. All rights reserved. Please contact cboc.ca/ip with questions or concerns about the use of this material.
CANADA 2040No Immigration Versus More Immigration
Find Conference Board research at www.e-library.ca. 36
APPENDIX A
Our Forecast Assumptions
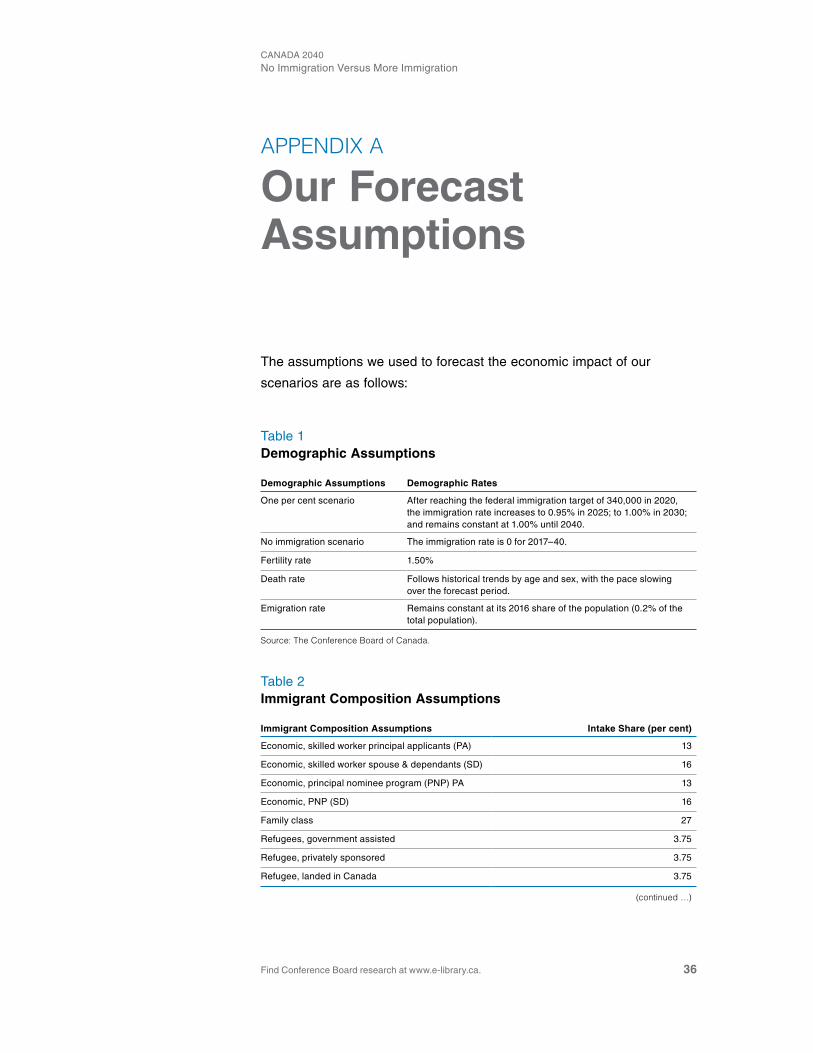
The assumptions we used to forecast the economic impact of our
scenarios are as follows:
Table 1Demographic Assumptions
Demographic Assumptions Demographic Rates
One per cent scenario After reaching the federal immigration target of 340,000 in 2020, the immigration rate increases to 0.95% in 2025; to 1.00% in 2030; and remains constant at 1.00% until 2040.
No immigration scenario The immigration rate is 0 for 2017–40.
Fertility rate 1.50%
Death rate Follows historical trends by age and sex, with the pace slowing over the forecast period.
Emigration rate Remains constant at its 2016 share of the population (0.2% of the total population).
Source: The Conference Board of Canada.
Table 2Immigrant Composition Assumptions
Immigrant Composition Assumptions Intake Share (per cent)
Economic, skilled worker principal applicants (PA) 13
Economic, skilled worker spouse & dependants (SD) 16
Economic, principal nominee program (PNP) PA 13
Economic, PNP (SD) 16
Family class 27
Refugees, government assisted 3.75
Refugee, privately sponsored 3.75
Refugee, landed in Canada 3.75
(continued …)

Find Conference Board research at www.e-library.ca. 37
Appendix A | The Conference Board of Canada
Table 2 (cont’d)Immigrant Composition Assumptions
Immigrant Composition Assumptions Intake Share (per cent)
Refugee, landed in Canada (SD) 3.75
Total 100
Source: The Conference Board of Canada.
Table 3Immigrant Wages Post-Landing(per cent)
Immigrant Wages Post-Landing* 1 Year 5 Years 10 Years 23 Years
Economic 55 69 83 88
Family 42 53 61 81
Refugees 31 41 50 69
Weighted total 48 60 72 83
*Wages are drawn from the most recent Statistics Canada data (1991–2015). They are compared with the Canadian average and are weighted by our immigrant composition assumptions. See charts 3 and 4 for the full breakdown of wage assumptions.Source: The Conference Board of Canada.
Table 4Employment Assumptions* (employment rate, per cent)
2017–22 2023–32 2033–40
Economic* 69.9 78.4 79.0
Family 59.2 71.0 76.7
Refugee* 45.3 67.1 73.6
Weighted total** 63.3 74.7 77.6
*Drawn from Census data; only ages 25-64 are available. The data are available in three intervals. The data indicates immigrant employment rates in 2016, based on the period in which they arrived to Canada. The three interval periods are 1991–2000; 2001–10; and 2011–16.**Weighted according to immigrant composition.Source: The Conference Board of Canada.
© The Conference Board of Canada. All rights reserved. Please contact cboc.ca/ip with questions or concerns about the use of this material.

CANADA 2040No Immigration Versus More Immigration
Find Conference Board research at www.e-library.ca. 38
APPENDIX B
Bibliography
Bonikowska, Aneta, and Feng Hou. Labour Market Outcomes of
Immigrant Women Who Arrive as Dependants of Economic Immigrant
Principal Applicants. Ottawa: Statistics Canada, February 2017.
Canada Mortgage and Housing Corporation, Newcomers—
Homeownership Rates of Immigrants Rise Over Time. Ottawa: CMHC,
2015. Accessed February 27, 2018. https://www.cmhc-schl.gc.ca/en/
hoficlincl/observer/observer_005.cfm.
Carter, Tom, Manish Pandey, and James Townsend. IRPP Study, No. 10:
The Manitoba Provincial Nominee Program. Montreal: Institute for
Research on Public Policy, 2010.
El-Assal, Kareem, and Daniel Fields. 450,000 Immigrants Annually?
Integration Is Imperative to Growth. Ottawa: The Conference Board of
Canada, 2017.
El-Assal, Kareem, and Sam Goucher. Immigration to Atlantic Canada:
Toward a Prosperous Future. Ottawa: The Conference Board of
Canada, 2017.
Environics Institute. Canadian Public Opinion About Immigration and
Minority Groups. Toronto: Environics Institute, 2018.
Forum Research. “Federal - Immigration (Forum Research).”
March 8, 2013. http://www.forumresearch.com/polls.asp?query=&scope=
search&p=18&o=Write.
Government of Canada. “Attracting Skilled Newcomers to Canada.”
News release, March 18, 2014. Accessed February 28, 2018.
https://www.canada.ca/en/news/archive/2014/03/attracting-skilled-
newcomers-canada.html.

Find Conference Board research at www.e-library.ca. 39
Appendix B | The Conference Board of Canada
Hudon, Tamara. “Immigrant Women” in Women in Canada: A Gender-
Based Statistical Report. Ottawa: Statistics Canada, 2015.
Immigration, Refugees and Citizenship Canada. “Applying for a Parent
and Grandparent Super Visa.” Backgrounder, December 1, 2011.
Accessed March 2, 2018. https://www.canada.ca/en/immigration-
refugees-citizenship/news/archives/backgrounders-2011/applying-parent-
grandparent-super-visa.html.
—. “Parent and Grandparent Program Sponsorship Forms Now Available
Online.” Notice, December 31, 2013. Accessed March 2, 2018. https://
www.canada.ca/en/immigration-refugees-citizenship/news/notices/
parent-grandparent-program-sponsorship-forms-available-online.html.
—. Evaluation of the Family Reunification Program. Ottawa: IRCC, 2014.
—. “Supplementary Information 2017 Immigration Levels Plan.” Notice,
October 31, 2016. Accessed May 15, 2017. http://www.cic.gc.ca/english/
department/media/notices/2016-10-31.asp.
—. “Supplementary Information 2018-2020 Immigration Levels Plan.”
Notice, November 1, 2017. Accessed February 23, 2018. https://
www.canada.ca/en/immigration-refugees-citizenship/news/notices/
supplementary-immigration-levels-2018.html.
—. Canada - Admissions of Permanent Residents by Province/Territory
and Census Metropolitan Area (CMA) of Intended Destination (2016
Ranking), January 2015 – December 2017. December 31, 2017.
—. “Sponsor Your Relatives — Who Can Sponsor.” Last modified
April 17, 2018. https://www.canada.ca/en/immigration-refugees-
citizenship/services/immigrate-canada/family-sponsorship/other-relatives/
eligibility.html.
Peri, Giovanni. “Do Immigrant Workers Depress the Wages of Native
Workers?” IZA World of Labor 42 (May 2014). https://wol.iza.org/articles/
do-immigrant-workers-depress-the-wages-of-native-workers/long.
Picot, Garnett, and Yuqian Lu. Chronic Low Income Among Immigrants
in Canada and Its Communities. Ottawa: Statistics Canada, 2017.
© The Conference Board of Canada. All rights reserved. Please contact cboc.ca/ip with questions or concerns about the use of this material.

CANADA 2040No Immigration Versus More Immigration
Find Conference Board research at www.e-library.ca. 40
Statistics Canada. Annual Demographic Estimates: Canada, Provinces
and Territories. Ottawa: Statistics Canada, 2016.
—. “Immigration and Ethnocultural Diversity: Key Results From the 2016
Census.” The Daily, October 25, 2017. Accessed November 28, 2017.
http://www.statcan.gc.ca/daily-quotidien/171025/dq171025b-eng.htm.
—. CANSIM table 051-0001, Estimates of Population, by Age
Group and Sex for July 1, Canada, Provinces and Territories.
Accessed May 4, 2018. http://www5.statcan.gc.ca/cansim/
a26?lang=eng&id=510001.
—. CANSIM table 282-0014, Labour Force Survey Estimates (LFS),
Part-Time Employment by Reason for Part-Time Work, Sex and Age
Group. Accessed May 4, 2018. http://www5.statcan.gc.ca/cansim/
a26?lang=eng&id=2820014.
—. CANSIM table 282-0087, Labour Force Survey Estimates (LFS),
by Sex and Age Group, Seasonally Adjusted and Unadjusted.
Accessed May 4, 2018. http://www5.statcan.gc.ca/cansim/
a26?lang=eng&id=2820087.
Stewart, Matthew. Canadian Outlook Bulletin: Winter 2018. Ottawa: The
Conference Board of Canada, 2017.
VanderPlaat, Madine, Howard Ramos, and Yoko Yoshida. “What Do
Sponsored Parents and Grandparents Contribute?” Canadian Ethnic
Studies 44, no. 3 (2012): 79-96.
Van Huystee, Monica. Interprovincial Mobility: Retention Rates and Net
Inflow Rates 2008-2013 Landings. Ottawa: Immigration, Refugees and
Citizenship Canada, 2016.
Wrzesnewskyj, Borys. Family Reunification: Report of the Standing
Committee on Citizenship and Immigration. Ottawa: House of Commons
Canada, 2017.

About The Conference Board of Canada
We are:
• The foremost independent, not-for-profit, applied research organization in Canada.
• Objective and non-partisan. We do not lobby for specific interests.• Funded exclusively through the fees we charge for services to the
private and public sectors.• Experts in running conferences but also at conducting, publishing,
and disseminating research; helping people network; developing individual leadership skills; and building organizational capacity.
• Specialists in economic trends, as well as organizational performance and public policy issues.
• Not a government department or agency, although we are often hired to provide services for all levels of government.
• Independent from, but affiliated with, The Conference Board, Inc. of New York, which serves nearly 2,000 companies in 60 nations and has offices in Brussels and Hong Kong.
© The Conference Board of Canada. All rights reserved. Please contact cboc.ca/ip with questions or concerns about the use of this material.

Insights. Understanding. Impact.
255 Smyth Road, Ottawa ON
K1H 8M7 Canada
Tel. 613-526-3280
Fax 613-526-4857
Inquiries 1-866-711-2262
conferenceboard.ca
PUBLICATION 9678
PRICE: Complimentary