Can Structured Reading Questions Impact Test Performance?
12
1 Can Structured Reading Questions Impact Test Performance? Elizabeth Dzwonczyk & David Leydet This paper was completed and submitted in partial fulfillment of the Master Teacher Program, a 2-year faculty professional development program conducted by the Center for Faculty Excellence, United States Military Academy, West Point, NY, 2018 Abstract Having students complete required course preparation and assigned readings prior to class has frustrated professors for decades. In this study, we used the pedagogical tool of structured reading questions in an entry-level geography course to examine if students would perform better on three major exams. Two versions of structured reading question handouts were tested; one a detailed reading guide and the other encompassing only the lesson objectives and key terms. Overall performance on the exams did not correlate with the presence of structured reading handouts, regardless of handout version. This indicates that the structure reading question handouts neither improved nor detracted from test performance. When considering the student's college entrance examination rank (CEER), an admissions tool, the authors identified a correlation between CEER score and academic performance. However, there was no correlation between handout presence or handout version when comparing among different CEER score groups. This study highlights that structured reading notes do not have a quantifiable effect on test performance. Background EV203, Introduction to Physical Geography, is a required course for all students (cadets) at the United States Military Academy (USMA). This course teaches cadets the fundamental scientific principles and processes of earth science while thinking critically and spatially. Like many introductory courses, EV203 covers a wide breadth of material that is generally unfamiliar to many students. Cadets typically take this course during their freshman or sophomore year. Instructors had found that many cadets, especially freshmen, had trouble preparing for class. Cadets especially struggle to prioritize and focus specific topics and concepts. Previous research conducted by Christopher Nixon for the Master Teacher Program examined the role of instructor-provided structured reading question handouts to help cadets focus their class preparation. Nixon found that the presence of structure reading questions positively influenced freshman's median examination score and reduced rate of failure. Nixon also identified cadets with lower college entrance examination rank (CEER) scores 1 received the largest benefit from the structure reading questions. In most college disciplines, students are required to complete reading assignments prior to coming to class. However, research shows that most students spend less time reading than their instructors prefer (Sikorski et al. 2002; Clump, Bauer, and Bradley 2004) In order to promote active learning in the classroom, students must prepare for class, which includes actively engaging with the text (Gray and Madson 2007). There are multiple studies illustrating how preparation before class and 1 Sophomores with a CEER Score below 600 and Plebe CEER Scores between 600 and 699 received the most benefit from the note sheets.
Transcript of Can Structured Reading Questions Impact Test Performance?
1
Can Structured Reading Questions Impact Test Performance?
Elizabeth Dzwonczyk & David Leydet
This paper was completed and submitted in partial fulfillment of the Master Teacher Program, a 2-year faculty
professional development program conducted by the Center for Faculty Excellence, United States Military Academy,
West Point, NY, 2018
Abstract
Having students complete required course preparation and assigned readings prior to class has
frustrated professors for decades. In this study, we used the pedagogical tool of structured reading
questions in an entry-level geography course to examine if students would perform better on three
major exams. Two versions of structured reading question handouts were tested; one a detailed
reading guide and the other encompassing only the lesson objectives and key terms. Overall
performance on the exams did not correlate with the presence of structured reading handouts,
regardless of handout version. This indicates that the structure reading question handouts neither
improved nor detracted from test performance. When considering the student's college entrance
examination rank (CEER), an admissions tool, the authors identified a correlation between CEER score
and academic performance. However, there was no correlation between handout presence or handout
version when comparing among different CEER score groups. This study highlights that structured
reading notes do not have a quantifiable effect on test performance.
Background
EV203, Introduction to Physical Geography, is a required course for all students (cadets) at the
United States Military Academy (USMA). This course teaches cadets the fundamental scientific
principles and processes of earth science while thinking critically and spatially. Like many introductory
courses, EV203 covers a wide breadth of material that is generally unfamiliar to many students. Cadets
typically take this course during their freshman or sophomore year. Instructors had found that many
cadets, especially freshmen, had trouble preparing for class. Cadets especially struggle to prioritize and
focus specific topics and concepts. Previous research conducted by Christopher Nixon for the Master
Teacher Program examined the role of instructor-provided structured reading question handouts to help
cadets focus their class preparation. Nixon found that the presence of structure reading questions
positively influenced freshman's median examination score and reduced rate of failure. Nixon also
identified cadets with lower college entrance examination rank (CEER) scores1 received the largest
benefit from the structure reading questions.
In most college disciplines, students are required to complete reading assignments prior to
coming to class. However, research shows that most students spend less time reading than their
instructors prefer (Sikorski et al. 2002; Clump, Bauer, and Bradley 2004) In order to promote active
learning in the classroom, students must prepare for class, which includes actively engaging with the
text (Gray and Madson 2007). There are multiple studies illustrating how preparation before class and
1 Sophomores with a CEER Score below 600 and Plebe CEER Scores between 600 and 699 received the most benefit from the note sheets.
2
pre-class requirements, such as discussion handouts, guided reading questions, and online discussion
forums promotes active learning strategies within the classroom and better in-class discussion (Green
and Rose 1996; Trudeau 2005; Brown, Danvers, and Doran 2016). Active learning environments curate
an environment that promotes higher-order question which, in turn, fosters understanding in college-
level science courses (Marbach-Ad and Sokolove 2000). McElwee (2009) found that students completed
more reading prior to class when they completed a participation preparation assignment. In addition,
the students felt better prepared for class and performed better on the day’s in-class quiz.
In addition to preparing for class, research shows that by taking notes ahead of class, the burden
on the student during the lecture can be reduced. Note-taking is cognitively effortful (Piolat, Olive, and
Kellogg 2005), so if a student comes to class already prepared with notes, they can be more attentive to
the lecture and potentially absorb more material. Jansen et al. (2017) concludes that based on cognitive
load theory, students can only handle so much information. Therefore, lower performing students are
better served focusing on comprehending the lecture, instead of note-taking.
This research focuses on providing structured reading questions in the form of a handout prior
to each lesson. Koontz and Plank (2011) found that providing optional structured reading questions to
undergraduate and graduate students prior to class were beneficial to class performance. In this study,
students reported using these guides to prepare for class and study for exams. Lower performing
students were most likely to feel that the reading questions were helpful. While Koontz and Plank
(2011) conducted a multi-year qualitative and quantitative study, they did not have a control group.
Brown, Danvers and Doran (2016) also found that guided reading questions positively impacted
student’s motivation in preparing for class, reading comprehension, and understanding of the material
before attending class. Sibold (2010) presents three stages of reading to help students engage with the
text. Her pre-reading strategy is similar to the methods presented in the EV203 syllabus - each lesson
has objectives and key terms that are designed to help the student digest the required reading. By
providing these objectives, students can focus on specific aspects of the text.
This research project aims to answer the following research questions: Are structured reading
questions beneficial to performance on graded events? Additionally, does the style of such structured
reading questions impact the performance on graded events?
Methodology
Building on Nixon's (2017) research, we utilized three instructors' sections with a total sample
size of 207 cadets for semester 18-1 (August-December 2017). Each instructor had four sections and
taught all sections without varying material or presentation style. Utilizing multiple instructors helped
address confounding variables such as teaching style, so results could be linked to the structured
questions, not to a particular instructor. The first section received version 1, the same structured
question handout previously used in Nixon's experiment. This handout included a series of outlines with
short answer and fill in the blank content, designed to guide the cadet through the reading with a focus
on the key objectives. The second and third sections received version 2, a new structure question
handout that only included lesson objectives and key terms in the form of short answer questions.
These student performance objective questions and key terms were also listed on the course syllabus.
The second section was given the handouts all semester, the third only received handouts through the
first major exam, Written Partial Review (WPR) 1 which occurred on lesson 21. The fourth section
served as the control section and did not receive any handouts. Handouts were distributed in class
3
during for the next lesson for example, lesson 3 handouts were distributed during lesson 2. This enabled
students to complete the handouts prior to class. Instructors encouraged cadets to complete handouts
but they did not make it mandatory.
EV203 sections are randomly populated by the USMA registrar's office. The EV203 Course
Director can artificially level sections as needed to mitigate administrative issues. This redistribution
does not take into account academic indicators including previous performance or CEER score. A typical
EV203 section consists of 16-18 cadets. During Term 18-1, the EV203 Course Director re-sectioned a
minimal number of the total population, 616 cadets, throughout a total of 35 sections.
Sample Population
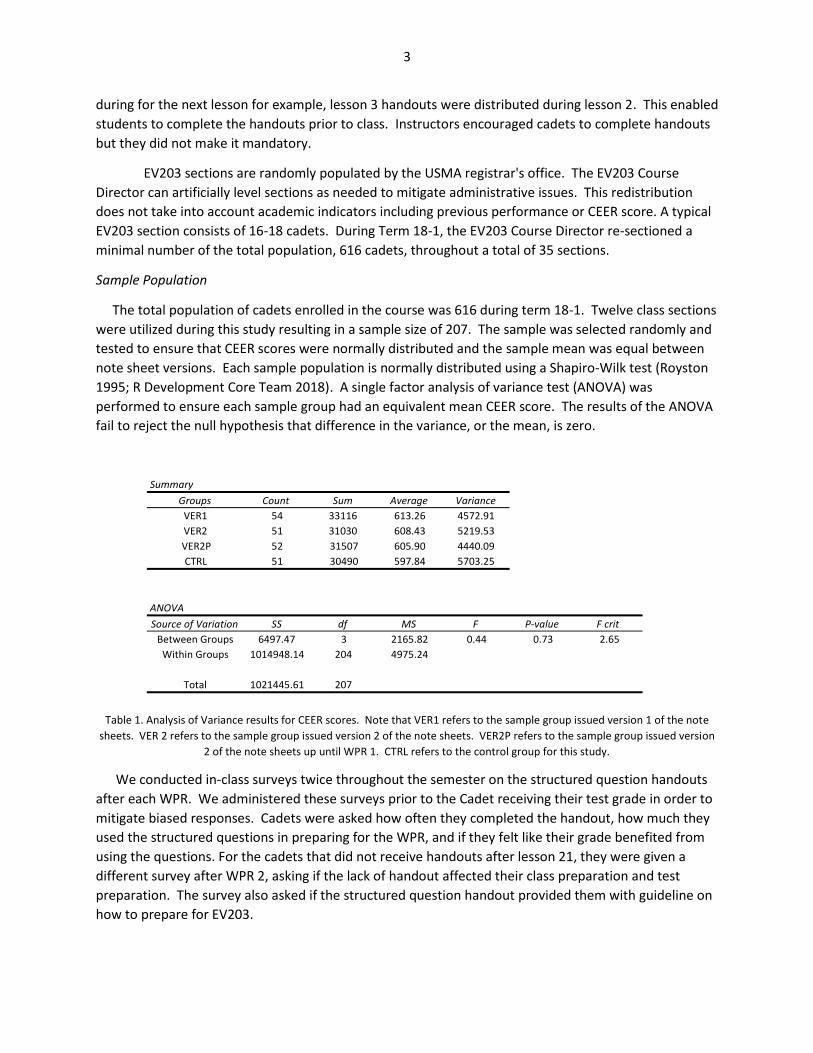
The total population of cadets enrolled in the course was 616 during term 18-1. Twelve class sections
were utilized during this study resulting in a sample size of 207. The sample was selected randomly and
tested to ensure that CEER scores were normally distributed and the sample mean was equal between
note sheet versions. Each sample population is normally distributed using a Shapiro-Wilk test (Royston
1995; R Development Core Team 2018). A single factor analysis of variance test (ANOVA) was
performed to ensure each sample group had an equivalent mean CEER score. The results of the ANOVA
fail to reject the null hypothesis that difference in the variance, or the mean, is zero.
Table 1. Analysis of Variance results for CEER scores. Note that VER1 refers to the sample group issued version 1 of the note
sheets. VER 2 refers to the sample group issued version 2 of the note sheets. VER2P refers to the sample group issued version
2 of the note sheets up until WPR 1. CTRL refers to the control group for this study.
We conducted in-class surveys twice throughout the semester on the structured question handouts
after each WPR. We administered these surveys prior to the Cadet receiving their test grade in order to
mitigate biased responses. Cadets were asked how often they completed the handout, how much they
used the structured questions in preparing for the WPR, and if they felt like their grade benefited from
using the questions. For the cadets that did not receive handouts after lesson 21, they were given a
different survey after WPR 2, asking if the lack of handout affected their class preparation and test
preparation. The survey also asked if the structured question handout provided them with guideline on
how to prepare for EV203.
Summary
Groups Count Sum Average Variance
VER1 54 33116 613.26 4572.91
VER2 51 31030 608.43 5219.53
VER2P 52 31507 605.90 4440.09
CTRL 51 30490 597.84 5703.25
ANOVA
SourceofVariation SS df MS F P-value Fcrit
BetweenGroups 6497.47 3 2165.82 0.44 0.73 2.65
WithinGroups 1014948.14 204 4975.24
Total 1021445.61 207
4
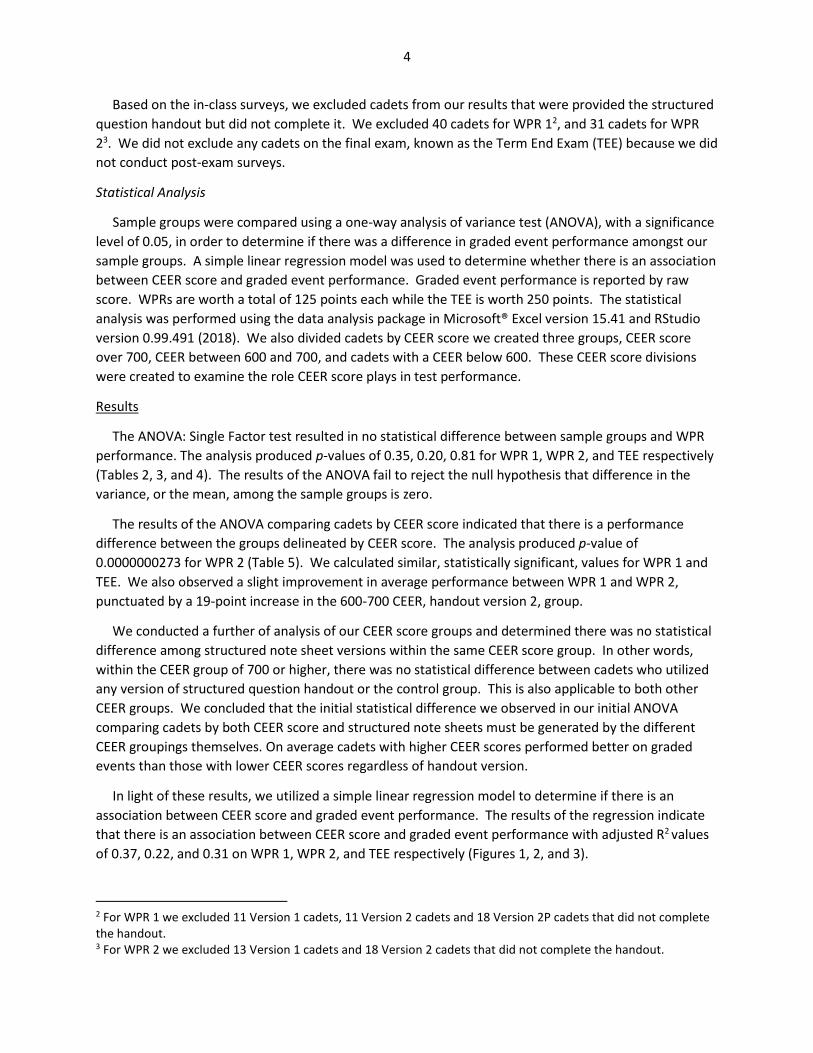
Based on the in-class surveys, we excluded cadets from our results that were provided the structured
question handout but did not complete it. We excluded 40 cadets for WPR 12, and 31 cadets for WPR
23. We did not exclude any cadets on the final exam, known as the Term End Exam (TEE) because we did
not conduct post-exam surveys.
Statistical Analysis
Sample groups were compared using a one-way analysis of variance test (ANOVA), with a significance
level of 0.05, in order to determine if there was a difference in graded event performance amongst our
sample groups. A simple linear regression model was used to determine whether there is an association
between CEER score and graded event performance. Graded event performance is reported by raw
score. WPRs are worth a total of 125 points each while the TEE is worth 250 points. The statistical
analysis was performed using the data analysis package in Microsoft® Excel version 15.41 and RStudio
version 0.99.491 (2018). We also divided cadets by CEER score we created three groups, CEER score
over 700, CEER between 600 and 700, and cadets with a CEER below 600. These CEER score divisions
were created to examine the role CEER score plays in test performance.
Results
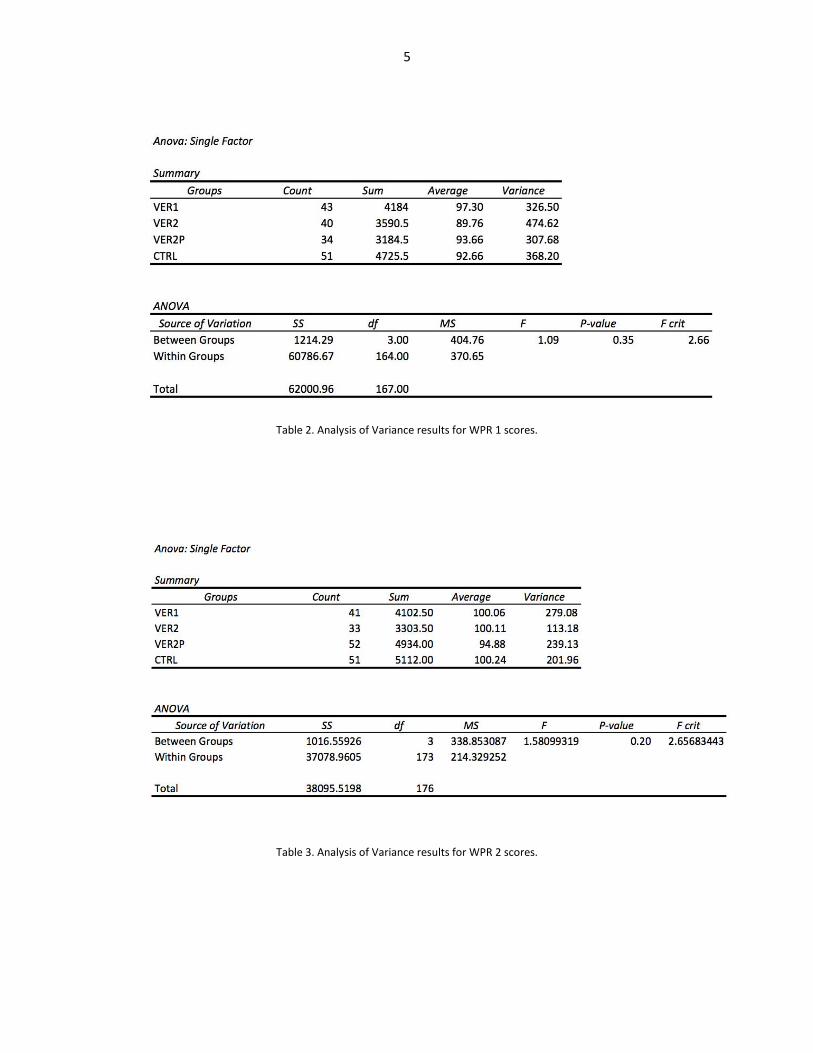
The ANOVA: Single Factor test resulted in no statistical difference between sample groups and WPR
performance. The analysis produced p-values of 0.35, 0.20, 0.81 for WPR 1, WPR 2, and TEE respectively
(Tables 2, 3, and 4). The results of the ANOVA fail to reject the null hypothesis that difference in the
variance, or the mean, among the sample groups is zero.
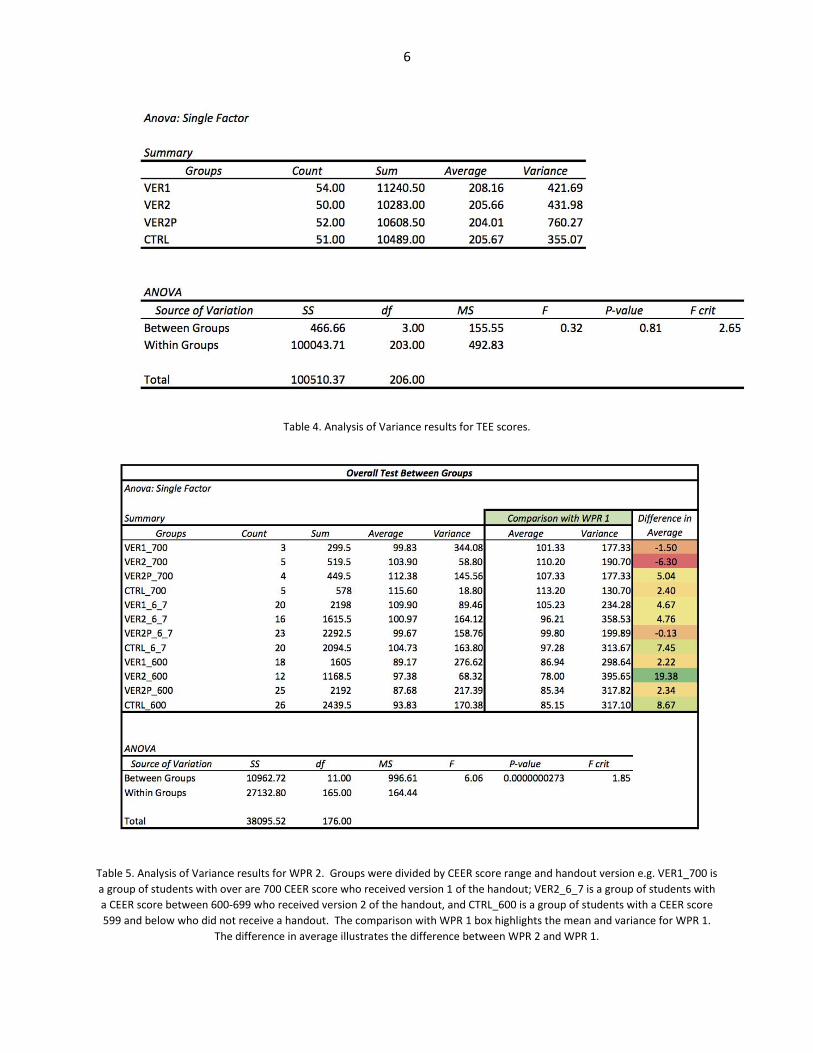
The results of the ANOVA comparing cadets by CEER score indicated that there is a performance
difference between the groups delineated by CEER score. The analysis produced p-value of
0.0000000273 for WPR 2 (Table 5). We calculated similar, statistically significant, values for WPR 1 and
TEE. We also observed a slight improvement in average performance between WPR 1 and WPR 2,
punctuated by a 19-point increase in the 600-700 CEER, handout version 2, group.
We conducted a further of analysis of our CEER score groups and determined there was no statistical
difference among structured note sheet versions within the same CEER score group. In other words,
within the CEER group of 700 or higher, there was no statistical difference between cadets who utilized
any version of structured question handout or the control group. This is also applicable to both other
CEER groups. We concluded that the initial statistical difference we observed in our initial ANOVA
comparing cadets by both CEER score and structured note sheets must be generated by the different
CEER groupings themselves. On average cadets with higher CEER scores performed better on graded
events than those with lower CEER scores regardless of handout version.
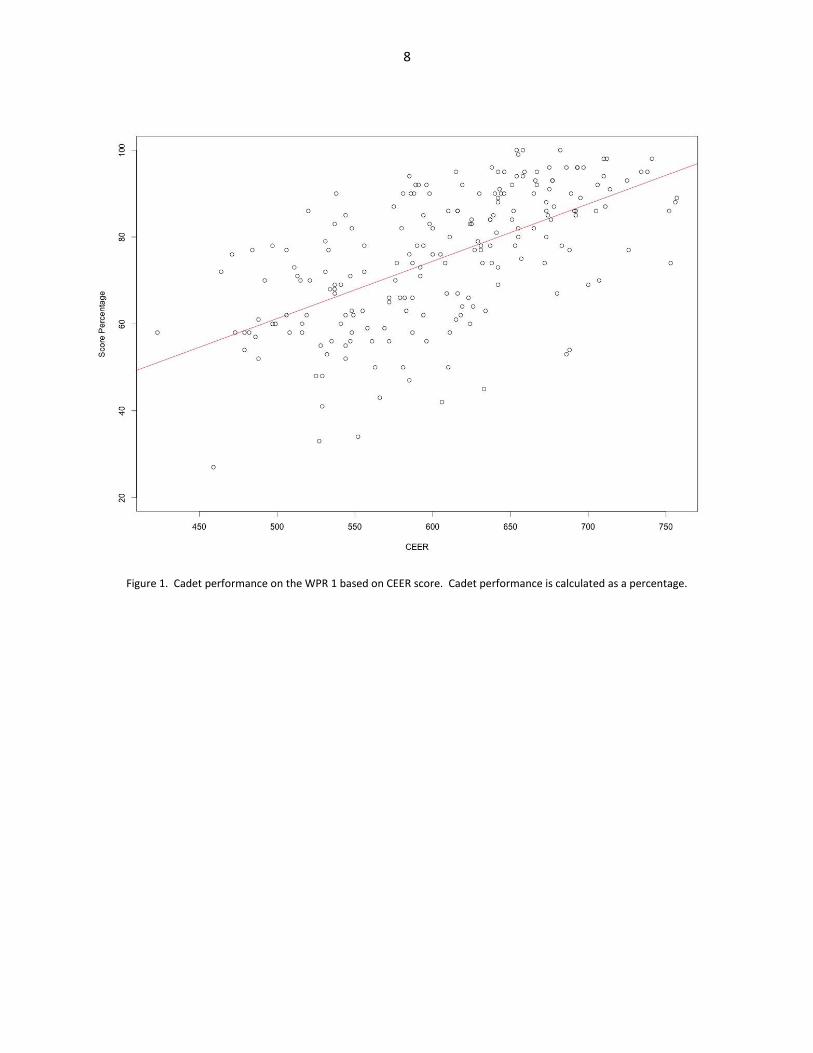
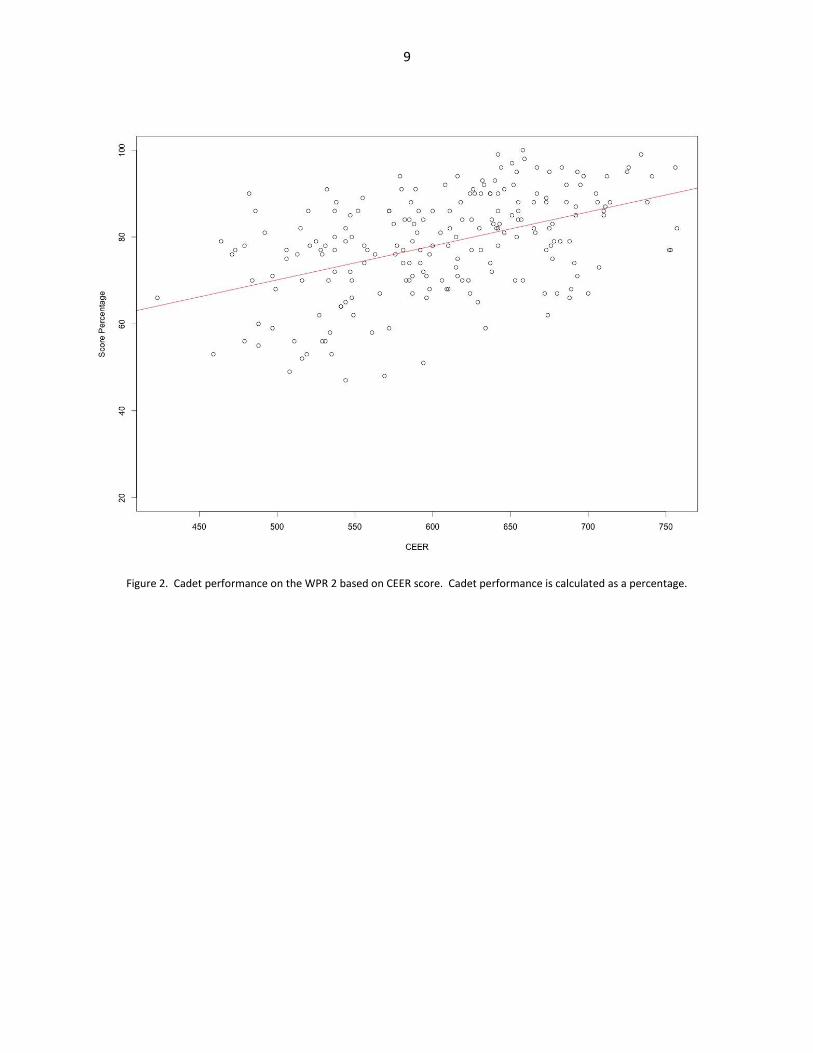
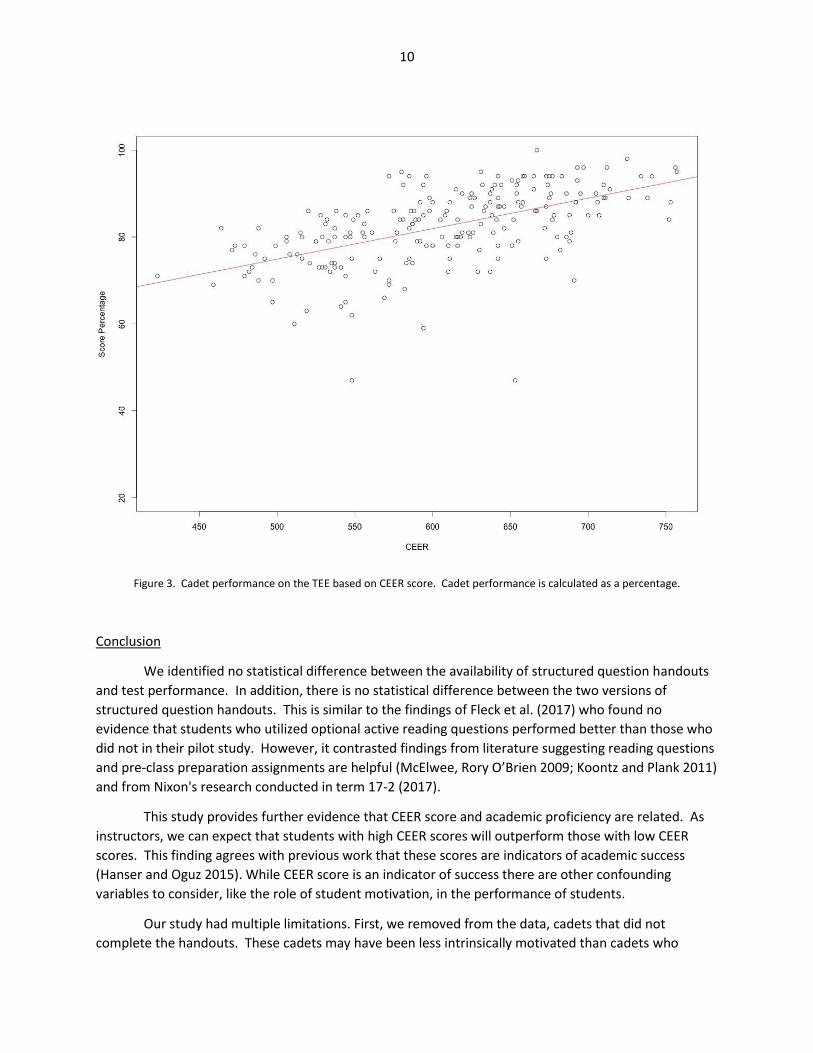
In light of these results, we utilized a simple linear regression model to determine if there is an
association between CEER score and graded event performance. The results of the regression indicate
that there is an association between CEER score and graded event performance with adjusted R2 values
of 0.37, 0.22, and 0.31 on WPR 1, WPR 2, and TEE respectively (Figures 1, 2, and 3).
2 For WPR 1 we excluded 11 Version 1 cadets, 11 Version 2 cadets and 18 Version 2P cadets that did not complete the handout. 3 For WPR 2 we excluded 13 Version 1 cadets and 18 Version 2 cadets that did not complete the handout.
5
Table 2. Analysis of Variance results for WPR 1 scores.
Table 3. Analysis of Variance results for WPR 2 scores.
6
Table 4. Analysis of Variance results for TEE scores.
Table 5. Analysis of Variance results for WPR 2. Groups were divided by CEER score range and handout version e.g. VER1_700 is
a group of students with over are 700 CEER score who received version 1 of the handout; VER2_6_7 is a group of students with
a CEER score between 600-699 who received version 2 of the handout, and CTRL_600 is a group of students with a CEER score
599 and below who did not receive a handout. The comparison with WPR 1 box highlights the mean and variance for WPR 1.
The difference in average illustrates the difference between WPR 2 and WPR 1.
7
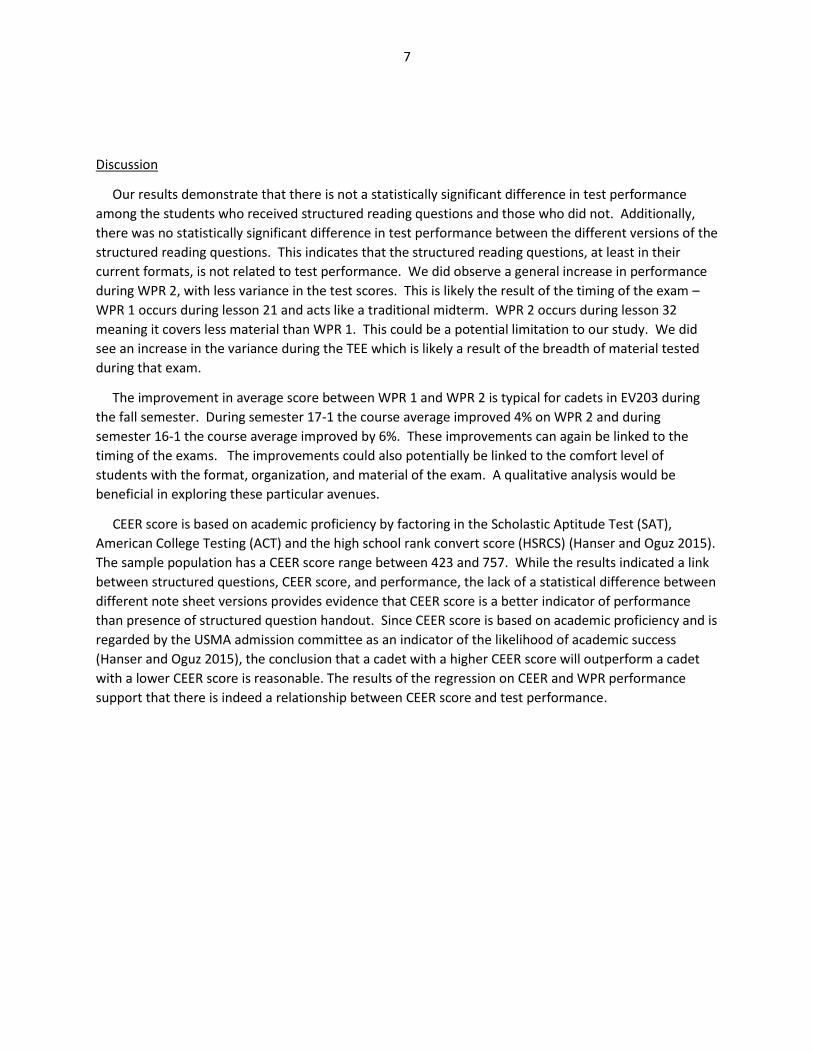
Discussion
Our results demonstrate that there is not a statistically significant difference in test performance
among the students who received structured reading questions and those who did not. Additionally,
there was no statistically significant difference in test performance between the different versions of the
structured reading questions. This indicates that the structured reading questions, at least in their
current formats, is not related to test performance. We did observe a general increase in performance
during WPR 2, with less variance in the test scores. This is likely the result of the timing of the exam –
WPR 1 occurs during lesson 21 and acts like a traditional midterm. WPR 2 occurs during lesson 32
meaning it covers less material than WPR 1. This could be a potential limitation to our study. We did
see an increase in the variance during the TEE which is likely a result of the breadth of material tested
during that exam.
The improvement in average score between WPR 1 and WPR 2 is typical for cadets in EV203 during
the fall semester. During semester 17-1 the course average improved 4% on WPR 2 and during
semester 16-1 the course average improved by 6%. These improvements can again be linked to the
timing of the exams. The improvements could also potentially be linked to the comfort level of
students with the format, organization, and material of the exam. A qualitative analysis would be
beneficial in exploring these particular avenues.
CEER score is based on academic proficiency by factoring in the Scholastic Aptitude Test (SAT),
American College Testing (ACT) and the high school rank convert score (HSRCS) (Hanser and Oguz 2015).
The sample population has a CEER score range between 423 and 757. While the results indicated a link
between structured questions, CEER score, and performance, the lack of a statistical difference between
different note sheet versions provides evidence that CEER score is a better indicator of performance
than presence of structured question handout. Since CEER score is based on academic proficiency and is
regarded by the USMA admission committee as an indicator of the likelihood of academic success
(Hanser and Oguz 2015), the conclusion that a cadet with a higher CEER score will outperform a cadet
with a lower CEER score is reasonable. The results of the regression on CEER and WPR performance
support that there is indeed a relationship between CEER score and test performance.
8
Figure 1. Cadet performance on the WPR 1 based on CEER score. Cadet performance is calculated as a percentage.
9
Figure 2. Cadet performance on the WPR 2 based on CEER score. Cadet performance is calculated as a percentage.
10
Figure 3. Cadet performance on the TEE based on CEER score. Cadet performance is calculated as a percentage.
Conclusion
We identified no statistical difference between the availability of structured question handouts
and test performance. In addition, there is no statistical difference between the two versions of
structured question handouts. This is similar to the findings of Fleck et al. (2017) who found no
evidence that students who utilized optional active reading questions performed better than those who
did not in their pilot study. However, it contrasted findings from literature suggesting reading questions
and pre-class preparation assignments are helpful (McElwee, Rory O’Brien 2009; Koontz and Plank 2011)
and from Nixon's research conducted in term 17-2 (2017).
This study provides further evidence that CEER score and academic proficiency are related. As
instructors, we can expect that students with high CEER scores will outperform those with low CEER
scores. This finding agrees with previous work that these scores are indicators of academic success
(Hanser and Oguz 2015). While CEER score is an indicator of success there are other confounding
variables to consider, like the role of student motivation, in the performance of students.
Our study had multiple limitations. First, we removed from the data, cadets that did not
complete the handouts. These cadets may have been less intrinsically motivated than cadets who
11
completed the handouts and could have altered the results. Alternately, these cadets could have had
another means of note taking and preparing for class that did not include the handout, so the availability
of the handout did not benefit or detract from their performance in EV203. Our second limitation is
sample size. For this study, the majority of cadets had a CEER score below 700. This is indicative of the
USMA population but could have altered results of the tests comparing CEER score. Furthermore,
although the sample size is 207, this population was divided into four groups. The last limitation of this
study is that this study only encompasses one term of students, a longer-term study could be beneficial
to contrast the availability and role of structured questions throughout multiple semesters.
Based on this study, we recommend further research on the role of structured handout in
introductory science courses especially qualitative analysis on the perceived benefits of preparing for
individual classes and the use of structured question handouts as a test-preparation tool.

12
Bibliography Brown, Charles A., Kreag Danvers, and David T. Doran. 2016. “Student Perceptions on Using Guided
Reading Questions to Motivate Student Reading in the Flipped Classroom.” Accounting Education 25 (3): 256–71. https://doi.org/10.1080/09639284.2016.1165124.
Clump, Michael A., Heather Bauer, and Catherine Bradley. 2004. “The Extent to Which Psychology Students Read Textbooks: A Multiple Class Analysis of Reading across the Psychology Curriculum.” Journal of Instructional Psychology 31 (3): 227.
Fleck, Bethany, Aaron S. Richmond, Hannah M. Rauer, Lisa Beckman, and Alexandra Lee. 2017. “Active Reading Questions as a Strategy to Support College Students’ Textbook Reading.” Scholarship of Teaching and Learning in Psychology 3 (3): 220–32. https://doi.org/10.1037/stl0000090.
Gray, Tara, and Laura Madson. 2007. “Ten Easy Ways to Engage Your Students.” College Teaching 55 (2): 83–97.
Green, Andrew, and William Rose. 1996. “The Professor’s Dream: Getting Students to Talk and Read Intelligently.” PS: Political Science and Politics 29 (4): 687. https://doi.org/10.2307/420793.
Hanser, Lawrence M., and Mustafa Oguz. 2015. United States Service Academy Admissions: Selecting for Success at the Military Academy/West Point and as an Officer. Santa Monica, Calif: RAND Corporation.
Jansen, Renée S., Daniel Lakens, and Wijnand A. IJsselsteijn. 2017. “An Integrative Review of the Cognitive Costs and Benefits of Note-Taking.” Educational Research Review 22 (November): 223–33. https://doi.org/10.1016/j.edurev.2017.10.001.
Koontz, Tomas M., and Kathryn M. Plank. 2011. “Can Reading Questions Foster Active Learning? A Study of Six College Courses.” Journal on Excellence in College Teaching 22 (3): 23–46.
Marbach-Ad, Gili, and Phillip G. Sokolove. 2000. “Can Undergraduate Biology Students Learn to Ask Higher Level Questions?” Journal of Research in Science Teaching 37 (8): 854–870.
McElwee, Rory O’Brien. 2009. “Facilitating Students’ Preperation for Class: Discussion of and Evidence for Effective Participation Preparation Assignments.” Journal on Exellence in College Teaching 20 (4): 105–20.
Nixon, Christopher. 2017. “Introduction to Physical Geography: Improving Our Ability to Teach Plebes.” United States Military Academy.
Piolat, Annie, Thierry Olive, and Ronald T. Kellogg. 2005. “Cognitive Effort during Note Taking.” Applied Cognitive Psychology 19 (3): 291–312. https://doi.org/10.1002/acp.1086.
R Development Core Team. 2018. R: A Language and Environment for Statistical Computing (version 0.99.491). R Foundation for Statistical Computing. https://www.R-project.org.
Royston, Patrick. 1995. “Remark AS R94: A Remark on Algorithm AS 181: The W test for Normality.” Journal of the Royal Statistical Society. Series C (Applied Statistics) 44 (4): 547–51. https://doi.org/10.2307/2986146.
Sibold, Claire. 2010. “Rules of Engagement: Modeling and Implementing Literacy Activities in the College Classroom.” Journal of College Literacy and Learning 36: 14.
Sikorski, Jason F., Kelly Rich, Bryan K. Saville, William Buskist, Oksana Drogan, and Stephen F. Davis. 2002. “Student Use of Introductory TextsL Comparative Survey Findings from Two Universities.” Teaching of Psychology 29 (4): 312–13.
Trudeau, Robert H. 2005. “Get Them to Read, Get Them to Talk: Using Discussion Forums to Enhance Student Learning.” Journal of Political Science Education 1 (3): 289–322. https://doi.org/10.1080/15512160500261178.