CAN SLIM Stocks Analysis CAN SLIM principles and information included in this presentation are...
21
CAN SLIM Stocks Analysis CAN SLIM principles and information included in this presentation are described in Investors Business Daily publications and on their website: http://www.investors.com/default.htm As well as in William J. O'Neil’s books such as: How to Make Money in Stocks: A Winning System in Good Times and Bad, Fourth Edition Paperback – Jun 8 2009 by William O'Neil (Author) 24 Essential Lessons for Investment Success: Learn the Most Important Investment Techniques by William O'Neil (Author) An additional source of information used in this presentation is the Stock Screens based on CAN SLIM criteria developed and available at the American Association of Individual Investors website: http://www.aaii.com/ PPI 2, S2, Fall 2015, Presented by Greg Shtock 1
-
Upload
thomasina-blair -
Category
Documents
-
view
217 -
download
0
Transcript of CAN SLIM Stocks Analysis CAN SLIM principles and information included in this presentation are...

CAN SLIM Stocks Analysis
CAN SLIM principles and information included in this presentation are described in Investors Business Daily publications and on their website:http://www.investors.com/default.htm
As well as in William J. O'Neil’s books such as:How to Make Money in Stocks:A Winning System in Good Times and Bad, Fourth Edition Paperback – Jun 8 2009 by William O'Neil (Author)
24 Essential Lessons for Investment Success: Learn the Most Important Investment Techniquesby William O'Neil (Author)
An additional source of information used in this presentation is the Stock Screens based on CAN SLIM criteria developed and available at the American Association of Individual Investors website: http://www.aaii.com/
PPI 2, S2, Fall 2015, Presented by Greg Shtock 1

CAN SLIM Stocks Analysis
CAN SLIM methodology was developed by William O'Neil, founder of Investor's Business Daily and O'Neil & Co. Inc.
Mr. O'Neil began his career as a stockbroker in 1958 with Hayden, Stone & Company, where his passion for stock picking led him to develop his own computerized study of successful stocks based on historical precedent. He documented his findings as The Model Book of Greatest Stock Market Winners, a pioneering study that became the foundation of the method William O'Neil + Company uses today.
In 1963, he founded William O'Neil + Co. Incorporated where he continued his work developing securities databases and providing independent research for institutional investment managers. The O'Neil Database™ currently encompasses over 70,000 stocks and funds covering over 70 countries.
In 1984, he launched Investor's Daily (later renamed Investor's Business Daily®) to fill an information gap for individual investors and the business community.
PPI 2, S2, Fall 2015, Presented by Greg Shtock 2
CAN SLIM Stocks Analysis
Mr. O'Neil’s approach to investing stems from an analysis covering 40 years of market data which examined each year's stocks with the largest percentage price increase to find the common characteristics of the "most successful stocks." These common characteristics include both fundamental factors, inherent in the nature of the firm and industry, and technical factors from observing the price patterns of the stocks.
This investment approach is often classified as either "value-based" or "growth-based" strategies that focus on fundamental company characteristics. It also combines both fundamental and technical factors.
PPI 2, S2, Fall 2015, Presented by Greg Shtock 3

CAN SLIM Stocks Analysis
What is the CAN SLIM methodology?
Well… it’s not Canadian and it is not really “Slim.”
CAN SLIM is the acronym for William J. O'Neil's investment strategy based on the seven common characteristics found in his study of the greatest stock market winners.
C = Current Earnings Growth A = Annual Earnings Growth N = New Products, New Services, New Management, New Price Highs
S = Supply & Demand L = Leader or LaggardI = Institutional Sponsorship M = Market
PPI 2, S2, Fall 2015, Presented by Greg Shtock 4

C = Current Earnings Growth
PPI 2, S2, Fall 2015, Presented by Greg Shtock 5
O'Neil's study of winning stocks highlights the strong quarterly earnings increase per share of the securities prior to their significant price run-ups.
A minimum increase in quarterly earnings of 18% to 20% over the same quarterly period one year ago is recommended.
Many companies have seasonal earnings patterns. Therefore, comparing current quarter results relative to the previous quarter results does not represent the real growth.
Another item to look for when screening for percentage changes is a meaningless figure created by having a very small base number or change from negative to positive earnings.
The issue of how to handle extraordinary earnings comes into play. One-time events can distort the actual trend in earnings and make company performance look better or worse.

C = Current Earnings Growth
PPI 2, S2, Fall 2015, Presented by Greg Shtock 6
Buying shares back or issuing new shares can also distort the actual trend in earnings. all non-recurring items should be excluded from the analysis. The stock screener system based on CAN SLIM methodology examines growth in earnings from continuing operations only.
O'Neil also likes to see an increasing rate of growth.
Growth rate from the quarter one year ago to the latest quarter must be higher than the previous quarter's increase from its counterpart one year prior. Basically, the current quarter's growth over the past 12-months must exceed the growth in previous 12-month period.
As a confirmation of the quarterly earnings screen O'Neil recommends that you check the industry group and locate at least one other noteworthy stock. Strong industry fundamentals should show up for a number of companies.

A = Annual Earnings Growth
PPI 2, S2, Fall 2015, Presented by Greg Shtock 7
The primary screen for annual earning increases that O'Neil uses is growth in earnings per share in each of the last five years.
In applying this screen we specify that earnings per share from continuing operations must be higher for each year when compared to the previous year.
Earnings over the last 12 months should be greater than or equal to earnings from the latest fiscal year.
The winning companies in O'Neil's study had a median growth rate of 21%. The O'Neil screen in Stock Investor specifies a minimum annual growth rate of 25% in earnings per share from continuing operations over the last five years.

N = New Products, New Services, New Management, New Price Highs
PPI 2, S2, Fall 2015, Presented by Greg Shtock 8
95% of the winning stocks had some sort of fundamental spark to push the company ahead of the pack. This catalyst could be a new product or service, a new management team after a period of lackluster performance or even a structural change in a company's industry such as a new technology.
A second consideration that O'Neil emphasizes is that investors should pursue stocks showing strong upward price movements.
O'Neil says that stocks that appear too high-priced and/or risky most often go even higher while stocks that appear low priced often go even lower. A stock making a new high after undergoing a period of price correction and consolidation is especially interesting.
Investor's Business Daily highlights stocks within 10% of their 52-week high and this is the criterion established for stocks screen. Used independently the screen allows about one-third of the companies to pass the filter.

PPI 2, S2, Fall 2015, Presented by Greg Shtock 9
S = Supply and Demand: Small Capitalization Plus Volume Demand
Companies with a smaller number of shares outstanding should increase more quickly than those with a large number of outstanding shares.
O'Neil found that 95% of the winning stocks had fewer than 25 million shares outstanding, while the median for the group was 4.6 million.
O'Neil suggests that investors consider looking at the actual "float" of the stock. The float is the number of shares in the hands of the public—determined by subtracting the number of shares held by management from the number of shares outstanding. Thus we establish a screen requiring stock with fewer than 20 million shares available through the float.
Share buyback, which reduces the public float of company's stock, is positive because it reduces the supply of the company's stock while boosting per share earnings.

PPI 2, S2, Fall 2015, Presented by Greg Shtock 10
L = Leader or Laggard
Scan for rapidly growing companies that are market leaders in rapidly expanding industries. O'Neil advocates buying among the best two or three stocks in a group.
O'Neil suggests using relative strength to identify market leaders. Relative strength compares the performance of a stock relative to the market as a whole.
Investor's Business Daily presents the percentage ranking of stocks and O'Neil recommends only looking for stocks with a percentage rank of 70% or better.
When monitoring your portfolio, O'Neil recommends that you sell off your worst-performing stocks and keep your best-performing stocks a little longer. You should try to avoid letting your ego dictate your actions. It is best to recognize a mistake early, before it becomes a major problem.
PPI 2, S2, Fall 2015, Presented by Greg Shtock 11
I = Institutional Sponsorship
O'Neil warns against selecting low-priced stocks with small capitalization and no institutional ownership, because these stocks have poor liquidity and often carry a lower-grade rating.
A stock needs a few institutional sponsors for it to show above-market performance. Three to 10 institutional owners are suggested as a reasonable minimum number.
IBD as well as the Stock Investor Pro, which is an American Association of Individual Investors Stocks Screening tool, reports the percentage of shares held by institutions and the number of institutions. They established a screen for stocks to have at least five institutional owners.

PPI 2, S2, Fall 2015, Presented by Greg Shtock 12
M = Market Direction
The trend of the overall market has a tremendous impact on the performance of your portfolio.
O'Neil finds it difficult to fight the trend so it is important to determine if you are in a bull or bear market.
When the market peaks and begins a major reversal, O'Neil recommends that you try to put 25% of your portfolio into cash.
If the last four or five stocks you purchased after a careful analysis are not showing a profit, it may signal a negative shift in the general market.
Market top also includes heavy volume without
significant price progress and the divergence of key averages. At market tops, you often find stocks that were past market leaders faltering while poor-quality stocks are showing up on the most active lists.
PPI 2, S2, Fall 2015, Presented by Greg Shtock 13
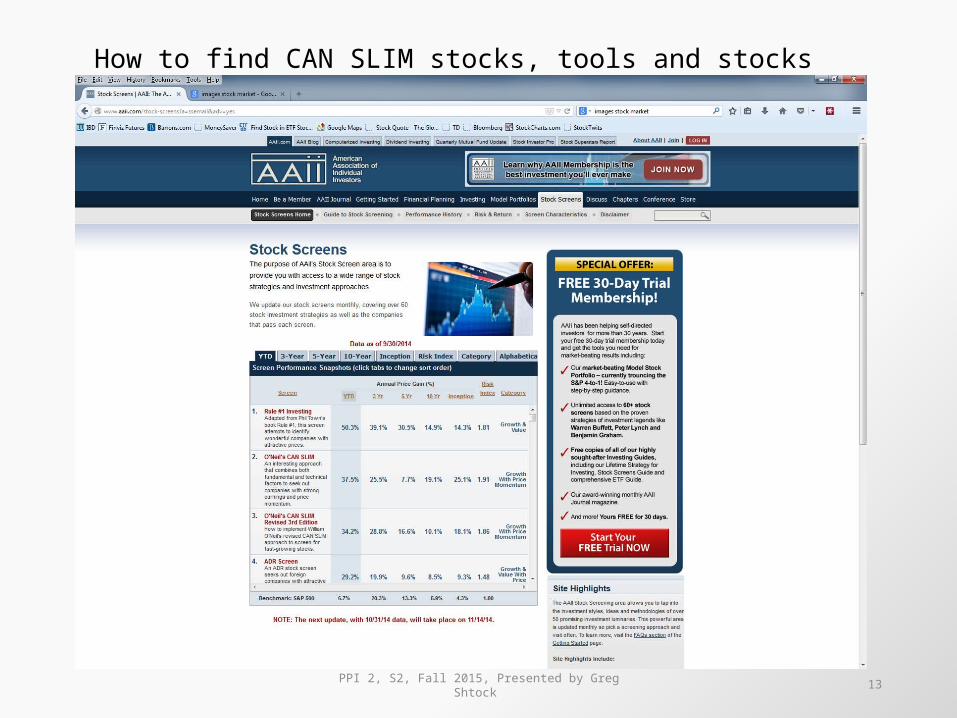
How to find CAN SLIM stocks, tools and stocks screens.

PPI 2, S2, Fall 2015, Presented by Greg Shtock 14
How to find CAN SLIM stocks, tools and stocks screens.
This chart is for illustration purposes only.

PPI 2, S2, Fall 2015, Presented by Greg Shtock 15
How to find CAN SLIM stocks, tools and stocks screens.
This chart is for illustration purposes only.

PPI 2, S2, Fall 2015, Presented by Greg Shtock 16
How to find CAN SLIM stocks, tools and stocks screens.
This chart is for illustration purposes only.

PPI 2, S2, Fall 2015, Presented by Greg Shtock 17
How to find CAN SLIM stocks, tools and stocks screens.
This chart is for illustration purposes only.

PPI 2, S2, Fall 2015, Presented by Greg Shtock 18
IBD SMART NYSE + NASDAQ Tables With 10 Vital Ratings.
1. IBD Composite Rating has 5 Smart- Select Ratings, 1 -99, with 99 the best. Ratings of 98 or more are boldfaced.
2. Earnings Per Share (EPS) rating compares your stock's last 2 quarters and 3 years EPS growth to all stocks. Ratings of 90 mean earns outperformed 90% of all stocks
3. Relative Strength (RS) Stock's relative price change in last 12 months vs. all stocks. Best rate 80 or more
4. Sales+Profit Margins+ROE Rating combines recent sales, profit margins and return on equity into an A to E rating. ROE over 17% is preferred
5. Accumulation/Distribution Our price and vol. formula shows if your stock is under accumulation (buying) or distribution (selling) last 3 months. A buying; E selling
6. Vol % Change is volume traded yesterday vs. average daily volume last 50 days. Vol % chg. + 50% & up bolded
7. 52-Week High is boldfaced if closing price within 10% of new high.
8. Boldfaced stocks are up 1 or more or new high. Underlined stocks are down 1 or more or at a new low.
9. Stocks have EPS & RS Ratings of 80 or more and were IPOs in the last 15 years
10. * after stock symbol means stock story at Investors.co

PPI 2, S2, Fall 2015, Presented by Greg Shtock 19
How to find CAN SLIM stocks, tools and stocks screens.

PPI 2, S2, Fall 2015, Presented by Greg Shtock 20
How to find CAN SLIM stocks, tools and stocks screens.
This chart is for illustration purposes only.

PPI 2, S2, Fall 2015, Presented by Greg Shtock 21
http://www.innovatorfunds.com/fundETF.php