
Can sleep protect memories from catastrophic forgetting?€¦ · 2 Oscar C. González1,2,, Yury...
42
1 Can sleep protect memories from catastrophic forgetting? 1 Oscar C. González 1,2, , Yury Sokolov 2, , Giri P. Krishnan 2 , Maxim Bazhenov 1,2,* 2 1 Neuroscience Graduate Program, 2 Department of Medicine University of California, San 3 Diego, CA 92093 4 * Correspondence: [email protected] (M.B.) 5 Contributed equally to this work 6 7 Abbreviated Title: Sleep protects memories from catastrophic forgetting 8 Abstract: 268 words; Introduction: 799 words; Discussion: 1812 words 9 Pages: 29 (not including references); Figures: 10 10 11 12 . CC-BY 4.0 International license certified by peer review) is the author/funder. It is made available under a The copyright holder for this preprint (which was not this version posted August 7, 2019. . https://doi.org/10.1101/569038 doi: bioRxiv preprint
Transcript of Can sleep protect memories from catastrophic forgetting?€¦ · 2 Oscar C. González1,2,, Yury...

1
Can sleep protect memories from catastrophic forgetting? 1
Oscar C. González1,2,☯, Yury Sokolov2, ☯, Giri P. Krishnan2, Maxim Bazhenov1,2,* 2
1 Neuroscience Graduate Program, 2 Department of Medicine University of California, San 3
Diego, CA 92093 4
*Correspondence: [email protected] (M.B.) 5
☯Contributed equally to this work 6
7
Abbreviated Title: Sleep protects memories from catastrophic forgetting 8
Abstract: 268 words; Introduction: 799 words; Discussion: 1812 words 9
Pages: 29 (not including references); Figures: 10 10
11
12
.CC-BY 4.0 International licensecertified by peer review) is the author/funder. It is made available under aThe copyright holder for this preprint (which was notthis version posted August 7, 2019. . https://doi.org/10.1101/569038doi: bioRxiv preprint
2
Abstract: 13
Continual learning remains to be an unsolved problem in artificial neural networks. Biological 14
systems have evolved mechanisms by which they can prevent catastrophic forgetting of old 15
knowledge during new training and allow lifelong learning. Building upon data suggesting the 16
importance of sleep in learning and memory, here we test a hypothesis that sleep protects 17
memories from catastrophic forgetting. We found that training in a thalamocortical network 18
model of a “new” memory that interferes with previously stored “old” memory may result in 19
degradation and forgetting of the old memory trace. Simulating NREM sleep immediately after 20
new learning leads to replay, which reverses the damage and ultimately enhances both old and 21
new memory traces. Surprisingly, we found that sleep replay goes beyond recovering old 22
memory traces that were damaged by new learning. When a new memory competes for the 23
neuronal/synaptic resources previously allocated to the old memory, sleep replay changes the 24
synaptic footprint of the old memory trace to allow for the overlapping populations of neurons to 25
store multiple memories. Different neurons become preferentially supporting different memory 26
traces to allow successful recall. We compared synaptic weight dynamics during sleep replay 27
with that during interleaved training – a common approach to overcome catastrophic forgetting 28
in artificial networks – and found that interleaved training promotes synaptic competition and 29
weakening of reciprocal synapses, effectively reducing an ensemble of neurons contributing to 30
memory recall. This leads to suboptimal recall performance compared to that after sleep. 31
Together, our results suggest that sleep provides a powerful mechanism to achieve continual 32
learning by combining consolidation of new memory traces with reconsolidation of old memory 33
traces to minimize memory interference. 34
35
Keywords: 36
Sleep, memory consolidation, continual learning, neural network, interleaved training, 37
catastrophic forgetting 38
39
Introduction: 40
.CC-BY 4.0 International licensecertified by peer review) is the author/funder. It is made available under aThe copyright holder for this preprint (which was notthis version posted August 7, 2019. . https://doi.org/10.1101/569038doi: bioRxiv preprint

3
Animals and humans are capable of continuous, sequential learning. In contrast, modern 41
artificial neural networks suffer from the inability to perform continual learning (French, 1999; 42
Hassabis et al., 2017; Hasselmo, 2017; Kirkpatrick et al., 2017; Ratcliff, 1990). Training new 43
task results in interference and catastrophic forgetting of old memories (French, 1999; Hasselmo, 44
2017; McClelland et al., 1995; Ratcliff, 1990). Several attempts have been made to overcome 45
this problem including (1) explicit retraining of all previously learned memories – interleaved 46
training (Hasselmo, 2017), (2) using generative models to reactivate previous inputs (Kemker 47
and Kanan, 2017), (3) artificially “freezing” subsets of synapses critical for the old memories 48
(Kirkpatrick et al., 2017). These solutions help prevent new memories from interfering with the 49
previously stored old memories, however they either require explicit retraining of all old 50
memories using the original data or have limitations on the types of trainable new memories and 51
network architectures (Kemker et al., 2017). How biological systems avoid catastrophic 52
forgetting and reduce interference of the old and new memories supporting continuous learning 53
remains to be understood. In this paper, we propose a mechanism for how sleep modifies the 54
synaptic connectivity matrix to minimize interference of competing memory traces enabling 55
continual learning. 56
Sleep has been suggested to play an important role in memory and learning (Oudiette and 57
Paller, 2013; Paller and Voss, 2004; Rasch and Born, 2013; Stickgold, 2013; Walker and 58
Stickgold, 2004; Wei et al., 2016; Wei et al., 2018). Specifically, the role of stage 2 (N2) and 59
stage 3 (N3) of Non-Rapid Eye Movement (NREM) sleep has been shown to help with the 60
consolidation of newly encoded memories (Paller and Voss, 2004; Rasch and Born, 2013; 61
Stickgold, 2013; Walker and Stickgold, 2004). The mechanism by which memory consolidation 62
is influenced by sleep is still debated, however, a number of hypotheses have been put forward. 63
Sleep may enable memory consolidation through repeated reactivation or replay of specific 64
memory traces during characteristic sleep rhythms such as spindles and slow oscillations 65
(Clemens et al., 2005; Ladenbauer et al., 2017; Marshall et al., 2006a; Oudiette et al., 2013; 66
Paller and Voss, 2004; Rasch and Born, 2013; Wei et al., 2016; Wei et al., 2018; Xu et al., 2019). 67
Memory replay during NREM sleep could help strengthen previously stored memories, map 68
memory traces between brain structures and prevent interference. Previous work using electrical 69
(Ladenbauer et al., 2017; Marshall et al., 2006a; Marshall et al., 2004) or auditory (Ngo et al., 70
2013) stimulation showed that increasing neocortical sleep oscillations during NREM sleep 71
.CC-BY 4.0 International licensecertified by peer review) is the author/funder. It is made available under aThe copyright holder for this preprint (which was notthis version posted August 7, 2019. . https://doi.org/10.1101/569038doi: bioRxiv preprint

4
resulted in improved consolidation of declarative memories. Similarly, spatial memory 72
consolidation has been shown to improve following cued reactivation of memory traces during 73
slow-wave NREM sleep (Oudiette et al., 2013; Oudiette and Paller, 2013; Paller and Voss, 2004; 74
Papalambros et al., 2017). Our recent computational studies found that slow-wave sleep 75
dynamics can lead to replay and strengthening of the recently learned memory traces (Wei et al., 76
2016; Wei et al., 2018). These studies point to the critical role of sleep in memory consolidation. 77
Can neuroscience inspired ideas help solve the catastrophic forgetting problem in 78
artificial neuronal networks? The most common machine learning training algorithm – 79
backpropagation (Kriegeskorte, 2015; Rumelhart et al., 1986) – is very different from plasticity 80
rules utilized by the brain networks. Nevertheless, we have recently seen a number of successful 81
attempts to implement high level principles of biological learning in artificial network designs, 82
including implementation of the ideas from “Complementary Learning System Theory” 83
(McClelland et al., 1995), according to which the hippocampus is responsible for the fast 84
acquisition of new information, while the neocortex would more gradually learn a generalized 85
and distributed representation. These ideas led to interesting attempts of solving catastrophic 86
forgetting problem in artificial neural networks (Kemker and Kanan, 2017). While few attempts 87
have been made to implement sleep in artificial networks, one study suggested that sleep-like 88
activity can increase storage capacity in artificial networks (Fachechi et al., 2019). We recently 89
found that implementation of the sleep-like phase in the artificial networks trained using 90
backpropagation can dramatically reduce catastrophic forgetting, as well as improve 91
generalization performance and transfer of knowledge (Krishnan, 2019). 92
In this new study, we used a biophysically realistic thalamocortical network model to 93
identify the network level mechanisms of how sleep promotes consolidation of newly encoded 94
memory traces and reverses damage to older memories. We considered a scenario of procedural 95
memories which are directly encoded in the populations of neocortical neurons. Our model 96
predicts that a period of slow-wave sleep, following training of a new memory in awake, can 97
promote replay of both old and new memory traces thereby preventing forgetting and increasing 98
recall performance. We show that sleep replay results in the fine tuning of the synaptic 99
connectivity matrix representing the interfering memory traces to allow for the overlapping 100
populations of neurons to store multiple competing memories. 101
.CC-BY 4.0 International licensecertified by peer review) is the author/funder. It is made available under aThe copyright holder for this preprint (which was notthis version posted August 7, 2019. . https://doi.org/10.1101/569038doi: bioRxiv preprint
5
102
Results: 103
The thalamocortical network model included two main structures (cortex and thalamus), 104
each comprised of excitatory and inhibitory cell populations (figure 1A). Both populations 105
included well characterized excitatory-inhibitory circuits. In the thalamus, excitatory 106
thalamocortical neurons (TCs) received excitatory connections from cortical excitatory neurons 107
(PYs), and inhibitory connections from thalamic reticular neurons (REs). RE neurons were 108
interconnected by inhibitory synapses and received excitatory connections from PYs and TCs. 109
PYs in the cortex received excitatory input from thalamus as well as excitatory inputs from other 110
PYs and inhibitory inputs from cortical inhibitory interneurons (INs). INs received excitatory 111
inputs from PYs in addition to the excitatory connections from TCs. All PYs had a 60% 112
probability of connecting to neighboring PYs (PY-PY radius was set to 20 neurons). Figure 1D 113
(left) shows the adjacency matrix for the cortical PYs that arise from these two restrictions. The 114
initial strength of the synaptic connections between PYs was Gaussian distributed (figure 1D 115
right). The model simulated transitions between awake and sleep (figure 1B/C) by modeling 116
effects of neuromodulators (Krishnan et al., 2016). PY-PY connections were plastic and 117
regulated by spike-timing dependent plasticity (STDP) that was biased for potentiation during 118
awake state to simulate the higher level of acetylcholine (Blokland, 1995; Shinoe et al., 2005; 119
Sugisaki et al., 2016). 120
121
Sequential training of spatially separated memory sequences does not lead to interference 122
We trained two memory sequences sequentially (first S1 and then S2) in spatially distinct 123
regions of the network as shown in figure 2A. Each memory sequence was represented by the 124
spatio-temporal pattern of 5 sequentially activated groups of 10 neurons per group. In the 125
following we will use labels – A, B, C, D, E – assigned to each group of neurons, so each 126
sequence could be labeled by a unique “word” of such “letters.” The first sequence (S1) was 127
trained in the population of neurons 200-249 (figure 2B) with groups of 10 neurons that were 128
ordered by increasing neuron numbers (A-B-C-D-E). Training S1 resulted in an increase of 129
synaptic weights between participating neurons (figure 2D, top) and an increase in performance 130
.CC-BY 4.0 International licensecertified by peer review) is the author/funder. It is made available under aThe copyright holder for this preprint (which was notthis version posted August 7, 2019. . https://doi.org/10.1101/569038doi: bioRxiv preprint

6
on sequence completion, which was defined as a probability to complete the entire sequence 131
(word) after only the first group of neurons (first letter) was activated (figure 2B/C, top). While 132
the strength of the synapses in the direction of S1 increased, synapses in the opposite direction 133
showed a reduction of strength consistent with the STDP rule used in this network (see Methods 134
and Materials). The second sequence (S2) was trained for an equal amount of time as S1 in the 135
neuron population 350-399 (W-V-X-Y-Z, figure 2B bottom). Training of S2 also resulted in 136
synaptic weight changes (figure 2D, middle) and improvement in performance (figure 2B/C, 137
bottom). Importantly, training of S2 did not interfere with the weight changes encoding S1 138
because both sequences involved spatially distinct populations of neurons (compare figure 2D, 139
top and middle). 140
After successful training of both memories, the network went through a period of slow-141
wave (N3) sleep when no stimulation was applied. After sleep, synaptic weights for both 142
memory sequences revealed strong increases in the direction of their respective patterns and 143
further decreases in the opposing directions (figure 2D, bottom). In line with our previous work 144
(Wei et al., 2018), these changes were a result of memory sequence replays during Up states of 145
slow-waves. Synaptic strengthening increased the performance on sequence completion after 146
sleep (figure 2B, right; 2C, red bar). 147
148
Training overlapping memory sequences results in interference 149
We next tested whether our network model shows interference when a new sequence 150
(S1*) (figure 3A) is trained in the same population of neurons as the earlier old sequence (S1). 151
S1* included the exact same population of neurons as S1, but was trained in the opposite 152
direction to S1, that is, the stimulation group order was E-D-C-B-A (figure 3B). S2 was once 153
again trained in a spatially distinct region of the network (figure 3A/B). Testing for sequence 154
completion was performed immediately after each training period. This protocol can represent 155
two somewhat different learning scenarios: (a) two competing memory traces (older S1 and 156
newer S1*) are trained sequentially; (b) the first (old S1) memory is trained and then 157
consolidated during sleep (as in figure 2) followed by the training of the second (new S1*) 158
memory. We explicitly tested both scenarios and they behaved identically, so in the following we 159
discuss the simpler case of two sequentially trained memories. 160
.CC-BY 4.0 International licensecertified by peer review) is the author/funder. It is made available under aThe copyright holder for this preprint (which was notthis version posted August 7, 2019. . https://doi.org/10.1101/569038doi: bioRxiv preprint

7
Similar to the previous results, training of S1 increased performance of S1 completion 161
(figure 3C, top/left). It also led to decrease in performance for S1* below its baseline level in the 162
“naive” network (figure 3C, bottom/left). (Note that even a naive network displayed some above 163
zero probability to complete a sequence depending on the initial strength of synapses and 164
spontaneous network activity). Training S2 led to increase in S2 performance. S1 performance 165
also increased, probably because of the random reactivation of S1 in awake, but it was not 166
significant. Subsequent training of S1* resulted in both a significant increase in S1* performance 167
and a significant reduction of S1 performance (figure 3C). To evaluate the impact of S1* training 168
on S1 performance, we varied the duration of S1* training (figure 3D). Increasing length of S1* 169
training correlated with a reduction of S1 performance up to the point when S1 performance was 170
reduced back to baseline level (Fig 3D, 400 s training duration of S1*). This suggests that 171
sequential training of two memories competing for the same populations of neurons results in 172
memory interference and catastrophic forgetting of the earlier memory sequence. 173
174
Interleaved training can recover the old memory after damage 175
One well known solution to avoid catastrophic forgetting in neural networks is to use a 176
new training dataset that includes both old and new training patterns (McClelland et al., 1995). 177
Thus, we next examined if an interleaved presentation of S1 and S1* can reverse the damage and 178
rescue S1. In the interleaved training protocol, S1 and S1* stimulation patterns are interleaved at 179
subsequent trails (S1->S1*->S1->S1*->…) (figure 4 A/B). 180
First, using the same protocol as described in the figure 3, we trained the sequences 181
sequentially (S1->S1->…->S2->S2->…->S1*->S1*->…). This, once again, resulted in initial 182
increase in both S1 and S2 performance followed by a reduction of S1 performance after training 183
of S1* (figure 4C). Analysis of the synaptic connectivity matrix revealed the synaptic weight 184
dynamics behind the change in performance (figure 4D). After S1 training, synaptic weights 185
between neurons representing S1 increased in the direction of S1 training and decreased in the 186
opposite network direction (figure 4D, top). Training of S1* resulted in an increase of synaptic 187
weight in the direction of S1* while reducing the strength of synapses in the direction of S1 188
(figure 4D, middle). After this initial sequential training phase, interleaved training was applied. 189
Interleaved training led to further changes in the synaptic connectivity and performance increase 190
.CC-BY 4.0 International licensecertified by peer review) is the author/funder. It is made available under aThe copyright holder for this preprint (which was notthis version posted August 7, 2019. . https://doi.org/10.1101/569038doi: bioRxiv preprint

8
for both S1 and S1* sequences (figure 4C, green). We observed an increase of synaptic strength 191
in subsets of synapses representing S1 and S1* patterns (figure 4D, bottom). These results 192
suggest that in the thalamocortical model, similar to the artificial neural networks, interleaved 193
training of the interfering patterns can enable successful learning of the both patterns. 194
195
Sleep enables replay and performance improvement for overlapping memories 196
To test if replay of the memory traces during simulated sleep can protect them from 197
interference, we next modeled slow-wave sleep (N3) after the patterns S1/S2/S1* were trained 198
sequentially in awake state (S1->S1->…->S2->S2->…->S1*->S1*->…) (figure 5A, red bar), as 199
described in the previous sections (figures 2A, 4A). During the sleep phase, no stimulation was 200
applied and the network properties were changed by increasing K+ leak currents and AMPA 201
synaptic currents in all cortical neurons (ref: (Krishnan et al., 2016)) to generate spontaneous 202
slow-waves. Figure 5B shows raster plots of the spiking activity before vs after the sleep, which 203
revealed improvements in sequence completion after sleep. We found that sleep was not only 204
able to reverse the damage caused to S1 following S1* training, but it was also able to enhance 205
all previously trained memory sequences S1/S2/S1* (figure 5C, red bar). Analysis of the 206
cumulative sum of full sequence replays throughout the course of sleep, defined as a total count 207
of all events when a given sequence was spontaneously completed (e.g., A->B->C->D->E), 208
revealed similar number of replays for either S1 or S1* (figure 5D, top). Importantly, for each 209
two populations of neurons (each two letters) within a sequence, the number of single transitions 210
in one direction (e.g., A->B) was similar to that in opposite direction (B->A), which ensured 211
similar amounts of synaptic weight changes for both sequences during sleep (figure 5D, bottom). 212
213
Synaptic weights dynamics during sleep replay vs interleaved training 214
In order to understand how sleep replay affects S1* and S1 memory traces to allow 215
enhancement of both memories, we analyzed the dynamics of synaptic weights within the 216
population of neurons containing the overlapping memory sequences (i.e. neurons 200-249). 217
Figure 6A, C, E shows distributions of synaptic weights for synapses pointing in the direction of 218
S1 (top row) and in the direction of S1* (bottom row) before (blue) and after (red) specific 219
.CC-BY 4.0 International licensecertified by peer review) is the author/funder. It is made available under aThe copyright holder for this preprint (which was notthis version posted August 7, 2019. . https://doi.org/10.1101/569038doi: bioRxiv preprint

9
events. Different columns correspond to different events, i.e. after S1 training (figure 6A, left), 220
after S1* training (figure 6A, right), after sleep (figure 6C) or after interleaved training (figure 221
6E). Prior to any training, synaptic weights in the direction of either memory sequence were 222
Gaussian distributed (figure 6A, blue histogram, left). After S1 training, the weights for S1 223
strengthened (shifted to the right), while the weights for S1* weakened (shifted to the left). As 224
expected, this trend was reversed when S1* was trained (figure 6A, right). During sleep, for each 225
sequence (S1 or S1*) there was a subset of synapses that were further strengthened, while the 226
rest of synapses were weakened (figure 6C, red histogram). This suggests that sleep promotes 227
competition between synapses, so specific subsets of synapses uniquely representing each 228
memory trace can reach the upper bound to maximize recall performance while other synapses 229
would become extinct to minimize interference. During interleaved training, we also observed 230
separation of synapses but to a lesser extent than during sleep (figure 6E). 231
Because of the random anatomical connectivity, this cortical network model included two 232
classes of synapses: recurrent/bidirectional, when a pair of neurons (e.g., n1 and n2) were 233
connected by two synapses (n1->n2 and n2->n1) and unidirectional (n1->n2 or n2->n1). In the 234
following we looked separately at these two classes to analyze the dynamics of synaptic weights 235
during sleep vs interleaved training. In the scatter plots of S1*/S1 weights (figure 6B, D, F), for 236
each pair of neurons (e.g., n1-n2), we plotted a point with the X-coordinate representing the 237
weight of n1->n2 synapse and the Y-coordinate representing the weight of n2->n1 synapse. 238
Therefore, any point with X- (Y-) coordinate close to zero would indicate a pair of neurons with 239
functionally unidirectional coupling in S1* (S1) direction. 240
The initial Gaussian distribution of weights was pushed towards the bottom right corner 241
of the plot (K10, purple box) indicating increases in S1 weights and relative decrease of S1* 242
weights in response to S1 training (figure 6B, middle). Training of S1* caused an upward/left 243
shift representing strengthening of S1* weights and weakening of S1 weights (figure 6B, right). 244
For very long S1* training (not shown) almost all the weights would be pushed to the upper left 245
corner (K01, green box). Sleep appears to have taken most of the weights located in the center of 246
the plots (i.e., strongly bidirectional synapses) and separated them by pushing them to the 247
opposite corners (K01, green box, and K10, purple box) (figure 6D). In doing so, sleep effectively 248
converted strongly bidirectional connections into strongly unidirectional connections which 249
preferentially contributed to the one memory sequence or another. During interleaved training, 250
.CC-BY 4.0 International licensecertified by peer review) is the author/funder. It is made available under aThe copyright holder for this preprint (which was notthis version posted August 7, 2019. . https://doi.org/10.1101/569038doi: bioRxiv preprint

10
we also observed a trend for synaptic weights to move to the corners (i.e., to represent either one 251
memory or another) but a much larger fraction of the weights remained in the middle of the 252
diagram, and was even pushed towards (0,0) point indicating overall weakening of recurrent 253
connections (figure 6F). 254
To further illustrate the dynamics of the recurrent synaptic weights, we projected the 255
distributions of the weights from figure 6B, D, F to the “diagonal” K01-K10. We repeated this 256
analysis for the model with interleaved training and compared the results with the sleep condition 257
(figure 7). Before any training, the projection of synaptic weights exhibited a Gaussian 258
distribution (figure 7A, left), reflecting the existence of functional recurrent synaptic connections 259
in both sequence directions for most neuron pairs. Following S1 training, the distribution of the 260
weights shifted in the direction of S1 indicating strengthening of synaptic weights in direction of 261
S1 and a weakening of those in direction of S1* (figure 7A, middle). Next, S1* training 262
strengthened recurrent weights in direction of S1* as indicated by the shift in the peak of 263
distribution back towards the center (figure 7A, right). After a period of sleep, the distribution of 264
synaptic weights became strongly bimodal. Almost complete lack of weights in the middle of 265
distribution again suggests that most recurrent synaptic connections became functionally 266
unidirectional thereby contributing to the storage of one sequence or the other but not both 267
(figure 7C). 268
The averaged dynamics of the synaptic weight changes are summarized in the vector 269
plots (figure 7B, D, F). Note, these plots also include unidirectional connections before training – 270
see vectors along the X- or Y-axis. The vector plots specific to the sleep phase revealed a 271
separation of recurrent synaptic weights (figure 7D). Even relatively weak unidirectional 272
synaptic weights were recruited for the storage of one sequence or another during sleep. This, 273
however, was not the case for interleaved training. Figure 7E and F show that interleaved 274
training also resulted in separation of recurrent synaptic weights. Unlike sleep, however, 275
interleaved training preserved many more recurrent connections indicated by the thick band of 276
weights seen in the middle of the weight projection (figure 7E). Increasing the duration of the 277
interleaved training did not result in better separation of weights (data not shown). Interleaved 278
training also suppressed weak unidirectional synaptic weights as shown in the vector plots (note 279
arrows pointing to (0,0) in the bottom left area of the figure 7F. This was in stark contrast to the 280
recruitment of the weak synaptic weights during sleep (compare to the figure 7D). 281
.CC-BY 4.0 International licensecertified by peer review) is the author/funder. It is made available under aThe copyright holder for this preprint (which was notthis version posted August 7, 2019. . https://doi.org/10.1101/569038doi: bioRxiv preprint
11
282
Characteristic trends for the overall synaptic weights changes during sleep replay vs 283
interleaved training 284
Figure 8 illustrates overall dynamics of synaptic weights in two models. During sleep, 285
unidirectional connections increased in strength (note increase of mean strength and relatively 286
small standard deviation in figure 8A1) while during interleaved training some unidirectional 287
connections increased and others were suppressed (note no change of mean strength and large 288
increase in standard deviation in figure 8A2). The mean strength of recurrent connections 289
decreased slightly during both sleep and interleaved training (figure 8B), however the standard 290
deviation increased much more during sleep (compare dashed lines in figure 8B1 vs B2). As 291
discussed previously, the last could reflect strong asymmetry of the connections within recurrent 292
pairs after sleep. To confirm this, we counted the total number of functionally recurrent and 293
unidirectional connections after training and after sleep or after interleaved training (figure 8C). 294
In this analysis if one branch of a recurrent pair reduced in strength below the threshold, it was 295
counted as unidirectional. After sleep, the number of recurrent connections dropped to just about 296
15% of what it was after training (figure 8C1, green line), while after interleaved training it 297
remained relatively high - about 50% of what it was initially (figure 8C2, green line). Decrease 298
in the number of recurrent connections during sleep led to an increase in the number of 299
functionally unidirectional connections (figure 8C, blue and red lines). Together these results 300
indicate again that sleep decreases the density of recurrent connections and increases the density 301
of unidirectional connections, both by increasing the strength of anatomical unidirectional 302
connections and by converting anatomical recurrent connections to functionally unidirectional 303
connections. This would minimize competition between synapses during recall of the 304
overlapping S1 and S1* sequences. In contrast, interleaved training preserves but suppresses in 305
strength a large fraction of the recurrent connections; it also cannot take full advantage of 306
strengthening unidirectional connections. Below we show that this kind of dynamics leads to 307
reduced transmission between populations of neurons representing different “letters” within a 308
sequence and ultimately reduces performance. 309
310
Sleep replay “fine tunes” synaptic connectivity to maximize separation of memory traces 311
.CC-BY 4.0 International licensecertified by peer review) is the author/funder. It is made available under aThe copyright holder for this preprint (which was notthis version posted August 7, 2019. . https://doi.org/10.1101/569038doi: bioRxiv preprint

12
To understand why different synaptic weight dynamics during sleep vs interleaved 312
training lead to the difference in recall performance, we next evaluated the contribution of 313
individual neurons to the recall of S1 vs S1* sequences. We assumed that a given neuron 314
supports S1 if it receives strong input from the left (lower letter in sequence) and projects 315
strongly to the right (higher letter in sequence); that is if a neuron n2 belongs to group B then it 316
would support S1 if connections n1->n2 and n2->n3 are strong, for some n1 from group A and 317
some n3 from group C. It would be opposite for neurons supporting S1*. For each neuron, we 318
calculated the total “from left” + “to right” and “from right” + “to left” synaptic weights (see 319
Methods and Materials) and plotted one against the other (figure 9A-C). On those plots, neurons 320
placed closer to X (Y)-axis would be strongly supporting S1 (S1*) sequence and those in the 321
middle, if they are sufficiently far from the origin, would support both sequences. As expected, 322
initial training in awake had a tendency to create neurons supporting the most recently trained 323
sequence. After training S1 the majority of neurons shifted to the right; S1* training reversed this 324
trend (compare Fig 9 A left and right). After sufficiently long S1* training (not shown) the 325
majority of neurons began supporting S1*. Both sleep and interleaved training had a tendency to 326
“stretch” the neurons along the -45o diagonal (diagonal from coordinates (0,2) (2,0)) making 327
both sequence specific and generic neurons (figures 9B, C), but sleep had larger fraction of 328
“specialists” (neurons located close to X or Y axis) while interleaved training preserved more 329
“generalist” neurons (located in the middle). Importantly, after interleaved training these neurons 330
were moved on average closer to (0,0) point (weaker synaptic weights). 331
The high sum of synaptic weights in one specific direction (figure 9A) may be driven by 332
strong weights from one side and very weak weights from another (e.g., the sum of “from left” + 333
“to right” synapses could be high because “from left” total synaptic weight is high but “to right” 334
total synaptic weight is weak). To address this point, we looked at the evolution of the graph 335
obtained by thresholding the weighted subgraph (see Methods and Materials) for neurons 200-336
249 from the region where interfering memory sequences were trained (figures 9D-F). To 337
identify the role of each neuron, we colored neurons according to the following rule: a neuron 338
was colored blue if both the total strength of “from left” and “to right” synapses was above the 339
threshold defined by the strength value before any training. It was colored red if both the total 340
strength of “from right” and “to left” synapses was above the threshold. It was colored green if 341
both red and blue conditions were satisfied and it was colored black if none of the conditions 342
.CC-BY 4.0 International licensecertified by peer review) is the author/funder. It is made available under aThe copyright holder for this preprint (which was notthis version posted August 7, 2019. . https://doi.org/10.1101/569038doi: bioRxiv preprint

13
were satisfied. The last would mean that the neuron was a “dead end” for both S1 and S1* 343
sequences since at least one of two synaptic weights was below threshold for both directions. 344
Snapshots of the subgraph after S1 / S1* training and after sleep vs. interleaved training 345
are shown in the figure 9D-F. S1 training first allocated all available connections for the purpose 346
of S1 sequence completion (figure 9D, left panel, blue connections) and the majority of neurons 347
became specialists for S1 (blue circles). The number of relatively strong recurrent synaptic 348
connections increased after subsequent S1* training (figure 9D, right panel, green connections) 349
and some connection became exclusively allocated to S1* (figure 9D, right panel, red 350
connections). Many neurons changed their type to became generalists (green circles). After 351
sufficiently long S1* training, all synaptic connectivity became reallocated to support S1* and 352
the neurons became specialists for memory S1* (not shown), which would imply complete 353
forgetting of S1. Sleep, presented after partial S1* training, enhanced both memories by 354
decreasing recurrent connectivity in favor of either S1 (blue) or S1* (red) connections (figure 355
9E). Most of the neurons became specialists for one memory sequence or the other (red or blue 356
circles) with some neurons remaining generalists (figure 9E). This trend was very different when 357
interleaved training was applied, in place of sleep, as many connections remained recurrent 358
(green lines; figure 9F). Furthermore, many neurons failed the test to support either one sequence 359
or the other (see above) and were labeled black (especially in the middle group C). Those 360
neurons had a reduced ability to support either one of the two memory sequences. This explains 361
relatively lower memory completion performance after interleaved training (figure 4C) vs that 362
after sleep (figure 5C). 363
It can be also noted that within each group, the neurons could be further separated into 364
leaders and followers with respect to their response times (data is not shown). This suggests that 365
once activity propagates from one group to another through a sequence specific set of inter-group 366
connections, the rest of the group could be entrained through intra-group connectivity. 367
368
Sleep forms memory specific synaptic connectivity profiles while preserving global 369
communication between neurons 370
Previous observations led to our hypothesis that sleep attempts to reorganize network 371
connectivity to an extreme configuration, where underlying connectivity is split into multiple 372
.CC-BY 4.0 International licensecertified by peer review) is the author/funder. It is made available under aThe copyright holder for this preprint (which was notthis version posted August 7, 2019. . https://doi.org/10.1101/569038doi: bioRxiv preprint
14
separate groups: each representing only one memory sequence. To test this hypothesis, we first 373
checked if the unweighted graphs obtained after thresholding of synaptic connectivity among 374
neurons 200-249 had multiple maximal strongly connected components (MSCCs). Two neurons 375
belong to the same MSCC if there is a directed path from one neuron to another along the 376
directed edges of the unweighted graph. So, a single MSCC implies that there is a strong path 377
between any two neurons in the network. We counted the evolution of the number of MSCCs for 378
different threshold values on synaptic weights as shown in figure 10A. For a medium/high 379
threshold (0.08), every neuron constituted an MSCC before training (figure 10A, orange) as the 380
number of relatively strong connections was negligible because the mean of the initial synaptic 381
weights was smaller than the threshold (see Methods and Materials). As training of S1 382
progressed, relatively strong connections were formed, which decreased the number of MSCCs. 383
However, by the end of S1 training the number of MSCCs increased back to a value similar to 384
that prior to training. This corresponded to an extreme reorganization of the connectivity in the 385
trained region, where most of the relatively strong connections had a direction similar to the 386
direction of S1. Therefore, the network became effectively disconnected in the opposite direction 387
(hence low performance for S1*). After subsequent S1* training, there was a single MSCC again 388
as there were many relatively strong connections in the network going in both directions, and this 389
remained to be true after either sleep or interleaved training. If, however, S1* training continues 390
in awake long enough, it would reallocate all connections to S1* and we would observe multiple 391
MSCCs again (because the network is effectively disconnected in S1 direction) (not shown). 392
For a higher threshold value (0.14), which was equal to the upper bound on synaptic 393
weights, the qualitative picture changed (figure 10A, yellow). At this level of granulation, the 394
edges present in the unweighted graph after thresholding depict synapses that uniquely 395
represented the trained sequences. There were not enough of these strong edges in the underlying 396
graph after training of S1 or S1*, but they were created during sleep. While the unweighted 397
graph had a small number of MSCCs for this threshold after sleep (figure 10A, left), the 398
unweighted graph that resulted after interleaved training had a number of MSCCs exceeding the 399
group size of a sequence, leading to segmentation of the connectivity profile into multiple 400
MSCCs (figure 10A, right). Color-coded MSCC membership of each neuron from the trained 401
region over the whole simulation duration is shown in figure 10B, and the region of significant 402
connectivity reorganization is expanded in figure 10C. Figure 10B ruled out the possibility of a 403
.CC-BY 4.0 International licensecertified by peer review) is the author/funder. It is made available under aThe copyright holder for this preprint (which was notthis version posted August 7, 2019. . https://doi.org/10.1101/569038doi: bioRxiv preprint
15
connectivity profile split into two subnetworks after sleep as MSCCs consisted of a giant MSCC, 404
where most of the neurons belonged, and a small number of isolated neurons in remote parts of 405
the trained region. That is, our model predicts that after sleep the cortical network reaches a state 406
when memories are stored efficiently, i.e. without destroying communication between almost all 407
neurons in the trained region, and at the same time, avoiding interference. The presence of a 408
large number of relatively strong recurrent connections along with the segmentation of the 409
connectivity profile formed by the strong edges into multiple MSCCs after interleaved training, 410
and absence of these properties after sleep, may explain the difference in the performance of the 411
two networks shown in figures 4C and 5C, respectively. 412
413
Discussion 414
We report here that sleep can reverse catastrophic forgetting of previously trained (old) 415
memories after damage by new training. Sleep was able to accomplish this task by spontaneous 416
reactivation (replay) of both old and new memories without use of the original training data. The 417
mechanism by which intrinsic network activity during sleep was able to recover and enhance 418
memories was through reorganization and fine-tuning of the synaptic connectivity. In doing so, 419
sleep created distinct synaptic weight representations of the overlapping memories that allow co-420
existence of the different memory traces without interference within overlapping ensembles of 421
neurons. Thus, if without competition, a memory is represented by the entire available 422
population of neurons, in the presence of competition, its representation is reduced to a subset of 423
neurons who selectively and efficiently represents a given memory trace. This was achieved 424
through memory replay during sleep, which (a) reduced reciprocal synaptic connectivity in favor 425
of the functional unidirectional connections supporting one memory or another, and (b) increased 426
strength of the anatomical unidirectional connections to better support individual memories. Our 427
study predicts that after each new episode of training followed by sleep, representation of the old 428
memories, sharing neurons with the new task, may change to achieve optimal separation of the 429
old and new memory traces. 430
We compared sleep replay with interleaved training, that was previously proposed as a 431
solution for catastrophic forgetting problem. Memory performance after interleaved training 432
improved but was inferior to that after sleep replay. Our study suggests that sleep, by being able 433
.CC-BY 4.0 International licensecertified by peer review) is the author/funder. It is made available under aThe copyright holder for this preprint (which was notthis version posted August 7, 2019. . https://doi.org/10.1101/569038doi: bioRxiv preprint
16
to directly reactivate memory traces encoded in synaptic weights patterns, provides a powerful 434
mechanism to prevent catastrophic forgetting and enable continual learning. 435
436
Catastrophic forgetting and continual learning 437
The work on catastrophic forgetting or interference in connectionist networks was 438
pioneered by McCloskey and Cohen (Mccloskey and Cohen, 1989) and Ratcliff (Ratcliff, 1990). 439
Catastrophic interference is observed when a previously trained network is required to learn new 440
data, e.g., a new set of patterns. When learning new data, the network can suddenly erase the 441
memory of the old, previously learned patterns (French, 1999; Hasselmo, 2017; Kirkpatrick et 442
al., 2017). This type of forgetting of previously learned data occurs only after sufficient 443
presentations of the new patterns. Catastrophic interference is thought to be related to the so-444
called “plasticity-stability” problem. The problem comes from the difficulty of creating a 445
network with connections which are plastic enough to learn new data, while stable enough to 446
prevent interference between old and new training sets. Due to the inherent trade-off between 447
plasticity and memory stability, catastrophic interference and forgetting remains to be a difficult 448
problem to overcome in connectionist networks (French, 1999; Hasselmo, 2017; Kirkpatrick et 449
al., 2017). 450
A number of attempts have been made to overcome catastrophic interference (French, 451
1999; Hasselmo, 2017; Kirkpatrick et al., 2017). Early attempts included changes to the 452
backpropagation algorithm, implementation of a “sharpening algorithm” in which a decrease in 453
the overlap of internal representations was achieved by making hidden-layer representations 454
sparse, or changes to the internal structure of the network (French, 1999; Hasselmo, 2017; 455
Kirkpatrick et al., 2017). These attempts were able to reduce the severity of catastrophic 456
interference in specific cases but could not provide a complete and generic solution to the 457
problem. Another popular method for preventing interference or forgetting is to explicitly retrain 458
or rehearse all the previously learned pattern sets while training the network on the new patterns 459
– interleaved training (Hasselmo, 2017). This idea recently led to the number of successful 460
algorithms to constrain the catastrophic forgetting problem, including generative algorithms to 461
generate previously experienced stimuli during the next training period (Li and Hoiem, 2018; 462
van de Ven and Tolias, 2018) and generative models of the hippocampus and cortex to generate 463
.CC-BY 4.0 International licensecertified by peer review) is the author/funder. It is made available under aThe copyright holder for this preprint (which was notthis version posted August 7, 2019. . https://doi.org/10.1101/569038doi: bioRxiv preprint
17
examples from a distribution of previously learned tasks in order to retrain (replay) these tasks 464
during a sleep phase (Kemker and Kanan, 2017). 465
In agreement with these previous studies, we show that interleaved training can prevent 466
catastrophic forgetting resulted from training of the overlapping spike patterns sequentially. This 467
method, however, does not change synaptic representations of the old memories to achieve 468
optimal separation between old and new overlapping memory traces. Indeed, interleaved training 469
requires repetitive activation of the entire memory patterns, so if different memory patterns 470
compete for synaptic resources (as for the sequences studied here) each phase of interleaved 471
training will enhance one memory trace but damage the others. This is in contrast to replay 472
during sleep when only memory specific subsets of neurons are involved in each replay episode. 473
On the synapse/cell level, we found that interleaved training preserved many recurrent synaptic 474
pairs, however synaptic weights were reduced, leading to some fraction of “dead end” neurons 475
which could not effectively contribute to memory recall. As a result, recall performance after 476
interleaved training was saturated below that after sleep regardless of the training duration. 477
Another primary concern with interleaved training is that it becomes increasingly 478
difficult/cumbersome to retrain all the memories as the number of stored memories continues to 479
increase and access to the earlier training data may no longer be available. As previously 480
mentioned, biological systems have evolved a mechanism to prevent this form of forgetting 481
without the need to explicitly retrain the network on all previously encoded memories. Studying 482
how these systems overcome this issue can provide insights into novel techniques to combat 483
catastrophic forgetting in artificial neural networks. 484
485
Sleep and memory consolidation 486
Though a variety of sleep functions remains to be understood, there is growing evidence 487
for the role of sleep in consolidation of newly encoded memories (Oudiette and Paller, 2013; 488
Paller and Voss, 2004; Rasch and Born, 2013; Stickgold, 2013; Walker and Stickgold, 2004; Wei 489
et al., 2016; Wei et al., 2018). The mechanism by which memory consolidation is influenced by 490
sleep is still largely debated, however a number of hypotheses have been put forward. One such 491
hypothesis is the “Active System Consolidation Hypothesis” (Rasch and Born, 2013). Central to 492
this hypothesis is the idea of repeated memory reactivation (Mednick et al., 2013a; Oudiette et 493
.CC-BY 4.0 International licensecertified by peer review) is the author/funder. It is made available under aThe copyright holder for this preprint (which was notthis version posted August 7, 2019. . https://doi.org/10.1101/569038doi: bioRxiv preprint

18
al., 2013; Oudiette and Paller, 2013; Paller and Voss, 2004; Rasch and Born, 2013; Stickgold, 494
2013; Wei et al., 2016). Although NREM sleep was shown to be particularly important for 495
consolidating declarative (hippocampus-dependent) memories (Marshall et al., 2006b; Mednick 496
et al., 2013b), human studies suggest that NREM sleep may be involved in the consolidation of 497
the procedural (hippocampus-independent) memories. This includes, e.g. simple motor tasks 498
(Fogel and Smith, 2006), or finger-sequence tapping tasks (Laventure et al., 2016; Walker et al., 499
2002). Selective deprivation of N2 sleep, but not REM sleep, reduced memory improvement for 500
the rotor pursuit task (Smith and MacNeill, 1994). Following a period of motor task learning, the 501
duration of NREM sleep (Fogel and Smith, 2006) and the number of sleep spindles (Morin et al., 502
2008) increased. The amount of performance increase in the finger tapping task correlated with 503
the amount of NREM sleep (Walker et al., 2002), spindle density (Nishida and Walker, 2007) 504
and delta power (Tamaki et al., 2013). In a recent animal study (Ramanathan et al., 2015) 505
consolidation of the procedural (skilled upper-limb) memory depended on the bursts of spindle 506
activity and the waves of slow oscillation during NREM sleep. 507
508
Model limitations and predictions 509
The model of training and sleep consolidation proposed in our new study has a close 510
resemblance to learning and consolidation of procedural memory tasks, such that training a new 511
task directly affects cortical synaptic connectivity that may be already allocated for other (older) 512
memories. We found that as long as a damage to the older memory is not sufficient to completely 513
erase its synaptic traces, sleep can enable replay of both older and newer memory traces and 514
reverse the damage while improving performance. Thus, to avoid irreversible damage, new 515
learning in our model is assumed to be slow which may correspond to learning a new motor skill 516
over multiple days allowing sleep to recover older memory traces that are damaged by each new 517
episode of learning. 518
We suggest that our model predictions, at least at the level of individual synapses and 519
neurons, are not limited to specific type of memory (procedural) or specific type of sleep (NREM 520
sleep). Indeed, we found that performance changes after sleep in the model were not dependent 521
on the number of slow-waves but directly correlated with a total time in Up states. This suggests 522
that replay during REM sleep (Louie and Wilson, 2001) may trigger synaptic weight dynamics 523
similar to that we described here. While this model lacks hippocampal input, we showed 524
.CC-BY 4.0 International licensecertified by peer review) is the author/funder. It is made available under aThe copyright holder for this preprint (which was notthis version posted August 7, 2019. . https://doi.org/10.1101/569038doi: bioRxiv preprint
19
previously (Sanda et al., 2019; Wei et al., 2016) that sharp wave-ripple like input to the cortical 525
network would trigger replay of previously learned cortical sequences. This suggests, in 526
agreement with the hippocampal indexing theory (Skelin et al., 2019), that replay driven by 527
hippocampal inputs could reorganize the cortical synaptic connectivity in a matter similar to 528
spontaneous replay we described here. 529
Our model of sleep consolidation predicts that the critical synaptic weights information 530
from the previous learning is still preserved after new training even if recall performance for the 531
older tasks is significantly reduced. Because of that, spontaneous activity during sleep can trigger 532
reactivation of the previously learned memory patterns reversing damage. It further suggests that 533
apparent loss of performance for older tasks in the artificial neuronal networks after new training 534
– catastrophic forgetting - may not imply irreversible loss of information as it is generally 535
assumed. Indeed, our recent work (Krishnan, 2019) revealed that simulating a sleep-like phase in 536
artificial networks trained using backpropagation can provide a solution for catastrophic 537
forgetting problem in agreement with our results from the biophysical model presented here. Few 538
changes to the network properties, normally associated with transition to sleep, were critical to 539
accomplish this goal: relative hyperpolarization of the pyramidal neurons and increasing strength 540
of excitatory synaptic connectivity. Both are associated with known effects of neuromodulators 541
during wake-sleep transitions (McCormick, 1992) and were implemented in the thalamocortical 542
model (Krishnan et al., 2016) that we used in our new study. Interestingly, these changes would 543
make neurons relatively less excitable and, at the same time, increase contribution of the 544
strongest synapses, effective enhancing the dynamical range for the trained synaptic patterns and 545
reducing contribution of synaptic noise; together this would promote replay of the previously 546
learned memories during sleep. 547
To summarize, our model predicts that slow-wave sleep could prevent catastrophic 548
forgetting and reverse memory damage through replay of the old and new memory traces. By 549
selectively replaying new and competing old memories, sleep dynamics not only achieve 550
consolidation of the new memories but also provides a mechanism for reorganizing synaptic 551
connectivity responsible for the previously learned memories – re-consolidation of the old 552
memory traces – to maximize separation between memories. By assigning different subsets of 553
neurons to primarily represent different memory traces, sleep tends to orthogonalize memory 554
.CC-BY 4.0 International licensecertified by peer review) is the author/funder. It is made available under aThe copyright holder for this preprint (which was notthis version posted August 7, 2019. . https://doi.org/10.1101/569038doi: bioRxiv preprint
20
representations to allow for the overlapping populations of neurons to store competing memories 555
and to enable continual learning in the biological systems. 556
557
558
Acknowledgements: 559
This work was supported by the Lifelong Learning Machines program from DARPA/MTO 560
(HR0011-18-2-0021) and ONR (MURI: N00014-16-1-2829). 561
562
Author Contributions: 563
O.C.G, Y.S., G.P.K, and M.B conceived the work. O.C.G, Y.S., and G.P.K performed the 564
simulations and analysis. O.C.G, Y.S., G.P.K, and M.B wrote the manuscript. 565
566
Declaration of Interests: 567
The authors declare no competing interests. 568
569
Figure Legends: 570
Figure 1. Network architecture and baseline behavior. A, Network schematic shows the basic 571
network architecture (PY: excitatory pyramidal neurons; IN: inhibitory interneurons; TC: 572
excitatory thalamocortical neurons; RE: inhibitory reticular neurons). Excitatory synapses are 573
represented by lines terminating in a dot, while inhibitory synapses are represented by lines 574
terminating in horizontal bars. B, Behavior of a control network exhibiting wake-sleep 575
transitions. Color represents the voltage of a neuron at a given time during the simulation (dark 576
blue – hyperpolarized potential; light – depolarized potential; red - spike). C, Zoom-in of a 577
subset of neurons in the network in B (time indicated by arrows). Left and right panels show 578
spontaneous activity during awake-like state before and after sleep, respectively. Middle panel 579
shows example of slow wave like activity during sleep. D, Left panel shows adjacency matrix for 580
the network in B. Black spots represent synaptic connections, while white represents a lack of 581
synaptic connection between the source and target neuron. Right panel shows the initial synaptic 582
weight matrix for the network in B. The X-axis indicates index of a post-synaptic neuron onto 583
which the connection is made, while the Y-axis indicates the relative index of the presynaptic 584
.CC-BY 4.0 International licensecertified by peer review) is the author/funder. It is made available under aThe copyright holder for this preprint (which was notthis version posted August 7, 2019. . https://doi.org/10.1101/569038doi: bioRxiv preprint
21
neuron. The sign of the presynaptic relative index (negative or positive) corresponds to the 585
neurons to the left or right of the post-synaptic neuron, respectively. The color in this plot 586
represented the strength of the AMPA connection between neurons, with white indicating lack of 587
synaptic connections. 588
Figure 2. Two spatially separated memory sequences show no interference during training 589
and both can be strengthened by subsequent sleep. A, Network activity shows periods of 590
testing (T), training of two spatially separated memory sequences (S1/S2), and sleep (N3). Color 591
indicates voltage of neurons at a given time. B, Left panels show an example of training of 592
sequence 1 (S1, top) and sequence 2 (S2, bottom). Middle panels show examples of testing of 593
both sequences prior to sleep. Right panels show examples of testing after sleep. Note, after 594
sleep, both sequences show better sequence completion. C, Performance of sequences 1 and 2 595
before any training (baseline), after sequence 1 training (after S1), after sequence 2 training (after 596
S2), and after sleep (red). D, Synaptic weight matrices show changes in synaptic weights in the 597
regions trained for sequences 1 and 2. Top panel shows weights after training S1; middle panel 598
shows weights after training S2; bottom one shows weights after sleep. Color indicates strength 599
of AMPA synaptic connections. 600
Figure 3. Training of overlapping memory sequences results in catastrophic interference. 601
A, Network activity during training and testing periods for three memory sequences in awake-602
like state. Note, sequence 1 (S1) and sequence 1* (S1*) are trained over the same population of 603
neurons. Color indicates the voltage of the neurons at a given time. B, Examples of sequence 604
training protocol for S1 (left), S2 (middle), and S1* (right). C, Performances for the three 605
sequences at baseline, and after S1, S2 and S3 training. Training of S1* leads to reduction of S1 606
performance. D, Performance of S1 (black) and S1* (red) as a function of S1* training duration. 607
Note that longer S1* training increases degradation of S1 performance. 608
Figure 4. Interleaved training of the “old” and “new” memory sequences recovers the 609
“old” sequence and improves performance for both memories. A, Network activity during 610
sequential training of the memory sequences S1->S2->S1* (blue bars) followed by interleaved 611
training of S1/S1* (green bar). B, Example of stimulation protocol used for interleaved training 612
of S1/S1*. C, Testing of S1, S2, and S1* shows significant increase in performance of S1 and 613
.CC-BY 4.0 International licensecertified by peer review) is the author/funder. It is made available under aThe copyright holder for this preprint (which was notthis version posted August 7, 2019. . https://doi.org/10.1101/569038doi: bioRxiv preprint

22
S1* after interleaved training (green). D, Weight matrices show changes after initial sequential 614
training of S1 and S1* and after interleaved S1/S1* training. 615
Figure 5. Sleep recovers the “old” memory sequence and improves performance for all 616
three memories. A, Network activity during sequential training S1->S2->S1* (blue bars) 617
followed by N3 sleep (red bar). No stimulation was applied during sleep. B, Examples of testing 618
periods for each trained memory at different times. The top row corresponds to the testing of 619
sequence 1 (S1), middle is testing of sequence 2 (S2), and bottom is testing of sequence 1* 620
(S1*). C, Testing of S1, S2, and S1* shows damage to S1 after training S1*, and increase in 621
performance of all three sequences after sleep (red bar). D, Top, Cumulative sum of the total 622
number of full sequence replays during sleep. Solid lines indicate means and broken lines are 623
SEM; Bottom, Average number of single transition replays between adjacent population of 624
neurons (letters) over the total duration of sleep for both sequences. 625
Figure 6. Sleep promotes unidirectional synaptic connectivity with different subsets of 626
synapses becoming specific to the “old” and “new” memory sequences. A, Histogram of 627
synaptic weights for all neuronal pairs (e.g., n1-n2) contributing to the memory sequences S1 628
and S1* after training of both memory sequences. Top row shows strength of synapses 629
contributing to S1 only (e.g., n1->n2). Bottom row shows strength of synapses contributing to 630
S1* only (e.g., n2->n1). Blue shows the starting points for weights, and red shows new weights. 631
B, Scatter plots show synaptic weights for all pairs of neurons contributing to both S1 and S1* 632
before and after training. For each pair of neurons (e.g., n1-n2), X-axis shows the strength of 633
Wn1->n2 synapse and Y-axis shows the strength of Wn2->n1 synapse. The green (K01) and purple 634
(K10) boxes represent the locations in the scatter plot where synaptic pairs which are strongly 635
preferential for S1* (green) or S1 (purple) exist. C/D, Histograms of synaptic weights and scatter 636
plots after sleep. E/F, Histograms of synaptic weights and scatter plots after interleaved training. 637
Figure 7. Both sleep and interleaved training lead to separation of synapses contributing to 638
the “old” and “new” memory traces. A/C/E, Mean projection of synaptic weights for all pairs 639
of neurons from the S1/S1* training region plotted in figure 6 B/D/E. X-axis – relative strength 640
of S1 and S1* specific synapses for each pair of neurons. Middle of X-axis represents pairs with 641
equal strength of S1 and S1* synapses. Extreme left (right) are pairs with functionally 642
unidirectional synapses. Effects of either sleep or interleaved training are shown in C and E, 643
.CC-BY 4.0 International licensecertified by peer review) is the author/funder. It is made available under aThe copyright holder for this preprint (which was notthis version posted August 7, 2019. . https://doi.org/10.1101/569038doi: bioRxiv preprint

23
respectively. Note the sharpening of the representation. B/D/F, Averaged synaptic dynamics 644
showing evolution of synaptic weights during S1 and S1* training (B), sleep (D) and interleaved 645
training (F). 646
Figure 8. Overall synaptic weight changes during sleep vs interleaved training. In all panels 647
index 1 corresponds to sleep condition, and index 2 corresponds to interleaved training. A, The 648
evolution of the mean synaptic weight (solid line) and the standard deviation (dashed line) of 649
unidirectional connections going along S1 (blue) and along S1* (red) in the trained region. Note 650
overall increase in synaptic strength after sleep but not after interleaved training. B, The 651
evolution of the mean synaptic strength (solid line) and the standard deviation (dashed line) of 652
recurrent connections going along S1 (blue) and along S1* (red) in the trained region. Note large 653
standard deviation after sleep indicating strong synaptic weight separation, so each recurrent 654
neuronal pair supports either S1 or S1*. C, The number of recurrent and unidirectional 655
connections in the trained region of the network as a function of time obtained after thresholding 656
the network with threshold 0.065, which is smaller than the initial mean synaptic weight. Note 657
decrease of functionally recurrent connections and increase of unidirectional connections after 658
sleep. 659
Figure 9. Sleep optimizes connectivity to reduce memory interference. The sum of weights 660
of all incoming and outgoing connections to a neuron along S1 and S1* directions after training 661
(A), after sleep (B), or, alternatively, after interleaved training (C). Each open circle corresponds 662
to a neuron, and all neurons from the same group are colored alike; linear fit is obtained for each 663
group separately and colored as neurons from the group. Dashed lines define boundaries of the 664
regions, where neurons tend to represent a single sequence (bottom and top corners) or have a 665
shared representation of both sequences (middle segment). D, Intergroup connectivity obtained 666
after thresholding the network with threshold 0.08. Nodes are colored based on both total input 667
and total output past a threshold for one sequence or the other (blue for S1 and red for S1*). If 668
conditions are satisfied for both sequences, then the node is colored green. Otherwise, threshold 669
conditions are failed for both directions, the node is colored black. Intergroup connectivity after 670
sleep (E) and interleaved training (F). 671
Figure 10. Reorganization of the cortical connectivity profile during sleep and interleaved 672
training. Panels on the left correspond to sleep condition, while panels on the right correspond 673
.CC-BY 4.0 International licensecertified by peer review) is the author/funder. It is made available under aThe copyright holder for this preprint (which was notthis version posted August 7, 2019. . https://doi.org/10.1101/569038doi: bioRxiv preprint

24
to interleaved training. A, The number of maximal strongly connected components (MSCC) in 674
unweighted directed graphs obtained by thresholding the connectivity of the trained region in the 675
cortex at every second of the simulation with thresholds 0.06 (blue), 0.08 (red), and 0.14 676
(orange). B, Neuronal MSCC membership in network color-coded in time through the entire 677
duration of the simulations. C, Zoom-in of neuronal MSCC membership showing a drastic 678
decrease in the number of MSCCs. 679
680
Methods and Materials: 681
Thalamocortical network model: 682
Network architecture. The thalamocortical network model used in this study has been 683
previously described in detail (Krishnan et al., 2016; Wei et al., 2016; Wei et al., 2018). Briefly, 684
our network was comprised of a thalamus which contained 100 thalamocortical relay neurons 685
(TC) and 100 reticular neurons (RE), and a cortex containing 500 pyramidal neurons (PY) and 686
100 inhibitory interneurons (IN). Our model contained only local network connectivity as 687
described in figure 1. Excitatory synaptic connections were mediated by AMPA and NMDA 688
connections, while inhibitory synapses were mediated through GABAA and GABAB. Starting 689
with the thalamus, TC neurons formed AMPA connections onto RE neurons with a connection 690
radius of 8 (RAMPA(TC-RE) = 8). RE neurons then projected inhibitory GABAA and GABAB 691
connections onto TC neurons with RGABA-A(RE-TC) = 8 and RGABA-B(RE-TC) = 8. Inhibitory 692
connections between RE-RE neurons were mediated by GABAA connections with RGABA-A(RE-RE) 693
= 5. Within the cortex, PY neurons formed AMPA and NMDA connections onto PYs and INs 694
with RAMPA(PY-PY) = 20, RNMDA(PY-PY) = 5, RAMPA(PY-IN) = 1, and RNMDA(PY-IN) = 1. PY-PY AMPA 695
connections had a 60% connection probability, while all other connections were deterministic. 696
Cortical inhibitory IN-PY connections were mediated by GABAA with RGABA-A(IN-PY) = 5. 697
Finally, connections between thalamus and cortex were mediated by AMPA connections with 698
RAMPA(TC-PY) = 15, RAMPA(TC-IN) = 3, RAMPA(PY-TC) = 10, and RAMPA(PY-RE) = 8. 699
Intrinsic currents. All neurons were modeled with Hodgkin-Huxley kinetics. Cortical PY 700
and IN neurons contained dendritic and axo-somatic compartments as previously described (Wei 701
et al., 2018). The membrane potential dynamics were modeled by the following equation: 702
.CC-BY 4.0 International licensecertified by peer review) is the author/funder. It is made available under aThe copyright holder for this preprint (which was notthis version posted August 7, 2019. . https://doi.org/10.1101/569038doi: bioRxiv preprint
25
��
����� � ����� � ����� � ���� � ����� � ������ � ��� � � ��� � ���� � �� � ����
���� � �� � ����� � ����� � ���
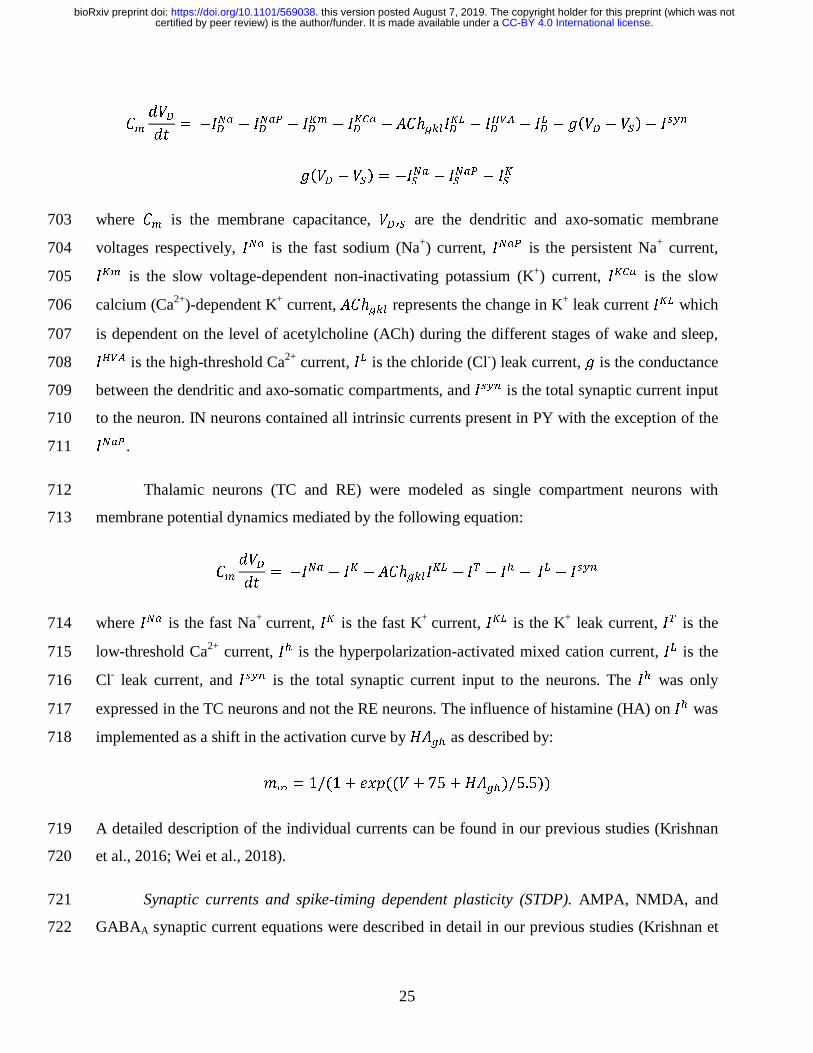
where �� is the membrane capacitance, ��,� are the dendritic and axo-somatic membrane 703
voltages respectively, ��� is the fast sodium (Na+) current, ���� is the persistent Na+ current, 704
��� is the slow voltage-dependent non-inactivating potassium (K+) current, ���� is the slow 705
calcium (Ca2+)-dependent K+ current, �� represents the change in K+ leak current ��� which 706
is dependent on the level of acetylcholine (ACh) during the different stages of wake and sleep, 707
�� � is the high-threshold Ca2+ current, �� is the chloride (Cl-) leak current, � is the conductance 708
between the dendritic and axo-somatic compartments, and ���� is the total synaptic current input 709
to the neuron. IN neurons contained all intrinsic currents present in PY with the exception of the 710
���� . 711
Thalamic neurons (TC and RE) were modeled as single compartment neurons with 712
membrane potential dynamics mediated by the following equation: 713
��
����� � ���� � �� � ����� � �� � �� � �� � ����
where ��� is the fast Na+ current, �� is the fast K+ current, ��� is the K+ leak current, �� is the 714
low-threshold Ca2+ current, �� is the hyperpolarization-activated mixed cation current, �� is the 715
Cl- leak current, and ���� is the total synaptic current input to the neurons. The �� was only 716
expressed in the TC neurons and not the RE neurons. The influence of histamine (HA) on �� was 717
implemented as a shift in the activation curve by ��� as described by: 718
�� � 1/�1 � ������ � 75 � ��� /5.5
A detailed description of the individual currents can be found in our previous studies (Krishnan 719
et al., 2016; Wei et al., 2018). 720
Synaptic currents and spike-timing dependent plasticity (STDP). AMPA, NMDA, and 721
GABAA synaptic current equations were described in detail in our previous studies (Krishnan et 722
.CC-BY 4.0 International licensecertified by peer review) is the author/funder. It is made available under aThe copyright holder for this preprint (which was notthis version posted August 7, 2019. . https://doi.org/10.1101/569038doi: bioRxiv preprint

26
al., 2016; Wei et al., 2018). The effects of ACh on GABAA and AMPA synaptic currents in our 723
model are described by the following equations: 724
�������� � ������ ���� ����� � ����
�������� � ����� ���� ����� � ����
where ���� is the maximal conductance at the synapse, ��� is the fraction of open channels, and 725
���� is the channel reversal potential (EGABA-A = -70 mV, EAMPA = 0 mV, and ENMDA = 0 mv). 726
Parameter ������ modulates the GABA synaptic currents for IN-PY, RE-RE, and RE-TC 727
connections. For IN neurons ������ was 0.22 and 0.44 for awake and N3 sleep, respectively; 728
������ for RE was 0.6 and 1.2 for awake and N3 sleep. ����� defines the influence of ACh 729
levels on AMPA synaptic currents for PY-PY, TC-PY, and TC-IN. ����� for PY was 0.133 730
and 0.4332 for awake and N3 sleep. ����� for TC is 0.6 and1.2 for awake and N3 sleep. 731
Potentiation and depression of synaptic weights between PY neurons were regulated by 732
spike-timing dependent plasticity (STDP). The changes in synaptic strength (gAMPA) and the 733
amplitude of miniature EPSPs (AmEPSP) have been described previously (Wei et al., 2018): 734
����� � ����� � ���� �∆�
����� � ����� � "����� �∆� where ���� is the maximal conductance of �����, and f = 0.01 represents the slower change of 735
STDP on ����� as compared to �����. The STDP function F is dependent on the relative 736
timing (Δt) of the pre- and post-synaptic spikes and is defined by: 737
�� � $ � ��|� |/"� , %" � & 0�� ��|� |/"� , %" � ( 0)
where A+/- set the maximum amplitude of synaptic change. A+/- = 0.002 and τ+/- = 20 ms. A- was 738
reduced to 0.001 during training to reflect the effects of changes in acetylcholine concentration 739
during focused attention on synaptic depression during task learning observed experimentally 740
(Blokland, 1995; Shinoe et al., 2005; Sugisaki et al., 2016). 741
Sequence training and testing. Training and testing of memory sequences was performed 742
similar to our previous study (Wei et al., 2018). Briefly, trained sequences were comprised of 5 743
.CC-BY 4.0 International licensecertified by peer review) is the author/funder. It is made available under aThe copyright holder for this preprint (which was notthis version posted August 7, 2019. . https://doi.org/10.1101/569038doi: bioRxiv preprint
27
groups of 10 sequential PY neurons. Each group of 10 were sequentially activated by a 10 ms 744
DC pulse with 5 ms delay between subsequent group pulses. This activation scheme was applied 745
every 1 s throughout the duration of the training period. Sequence 1 (S1) consisted of PY groups 746
(in order of activation): A(200-209), B(210-219), C(220-229), D(230-239), E(240-249). 747
Sequence 2 (S2) consisted of PY groups (in order of activation): W(360-369), V(350-359), 748
X(370-379), Y(380-389), Z(390-399) and can be referred as non-linear due to the non-spatially 749
sequential activations of group W, V, and X. Sequence 1* (S1*) was trained over the same 750
population of neurons trained on S1 but in the reverse activation order (i.e. E-D-C-B-A). During 751
testing, the network was presented with only the activation of the first group of a given sequence 752
(A for S1, W for S2, and E for S1*). Performance was measured based on the network’s ability 753
to recall/complete the remainder of the sequence (i.e. A-B-C-D-E for S1) within a 350 ms time 754
window. Similar to training, test activation pulses were applied every 1 s throughout the testing 755
period. Training and testing of the sequences occurred sequentially as opposed to simultaneously 756
as in our previous study (Wei et al., 2018). 757
Data analysis: 758
All analyses were performed with custom built Matlab and Python scripts. Data are 759
presented as mean ± standard error of the mean (SEM) unless otherwise stated. For each 760
experiment a total of 10 simulations with different random seeds were used for statistical 761
analysis. 762
Sequence performance measure. A detailed description of the performance measure used 763
during testing can be found in (Wei et al., 2018). Briefly, the performance of the network on 764
recalling a given sequence following activation of the first group of that sequence (see Methods 765
and Materials: Sequence training and testing) was measured by the percent of successful 766
sequence recalls. We first detected all spikes within the predefined 350 ms time window for all 5 767
groups of neurons in a sequence. The firing rate of each group was then smoothed by convolving 768
the average instantaneous firing rate of the group’s 10 neurons with a Gaussian kernel with 769
window size of 50 ms. We then sorted the peaks of the smoothed firing rates during the 350 ms 770
window to determine the ordering of group activations. Next, we applied a string match (SM) 771
method to determine the similarity between the detected sequences and an ideal sequence (ie. A-772
B-C-D-E for S1). SM was calculated using the following equation: 773
.CC-BY 4.0 International licensecertified by peer review) is the author/funder. It is made available under aThe copyright holder for this preprint (which was notthis version posted August 7, 2019. . https://doi.org/10.1101/569038doi: bioRxiv preprint
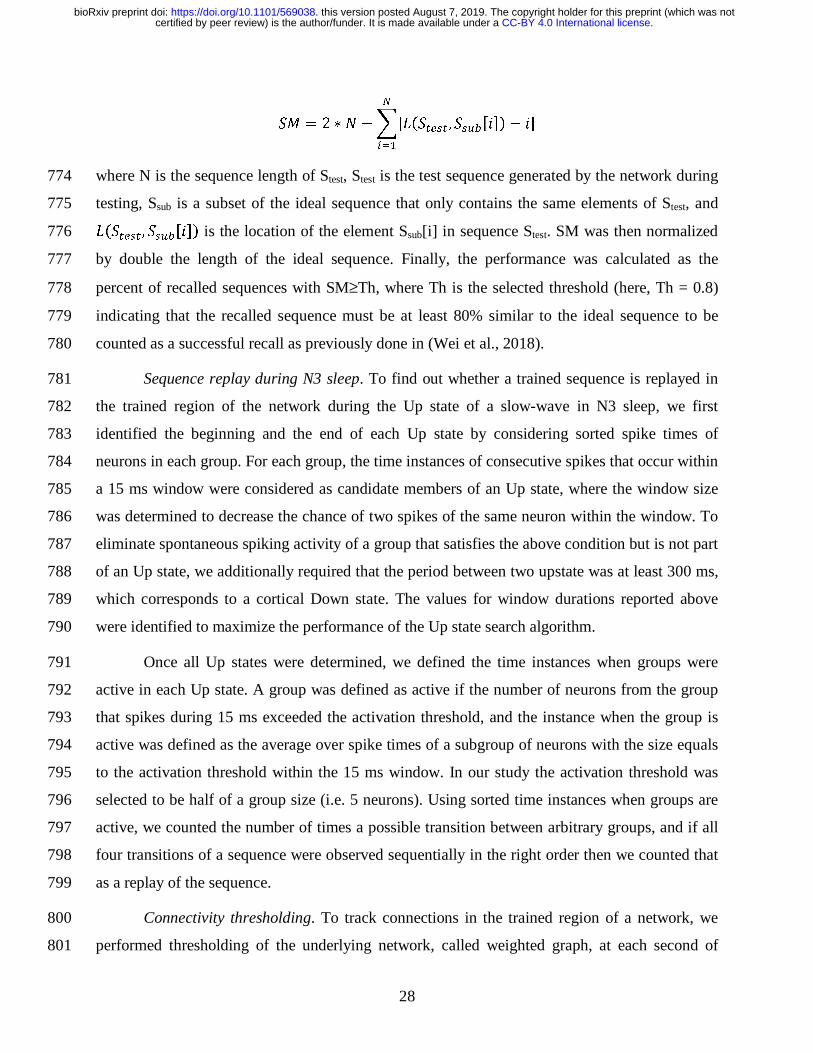
28
*+ � 2 - . � /|1�* #� , *�$%�%� � %|�
&'(
where N is the sequence length of Stest, Stest is the test sequence generated by the network during 774
testing, Ssub is a subset of the ideal sequence that only contains the same elements of Stest, and 775
1�* #� , *�$%�%� is the location of the element Ssub[i] in sequence Stest. SM was then normalized 776
by double the length of the ideal sequence. Finally, the performance was calculated as the 777
percent of recalled sequences with SM≥Th, where Th is the selected threshold (here, Th = 0.8) 778
indicating that the recalled sequence must be at least 80% similar to the ideal sequence to be 779
counted as a successful recall as previously done in (Wei et al., 2018). 780
Sequence replay during N3 sleep. To find out whether a trained sequence is replayed in 781
the trained region of the network during the Up state of a slow-wave in N3 sleep, we first 782
identified the beginning and the end of each Up state by considering sorted spike times of 783
neurons in each group. For each group, the time instances of consecutive spikes that occur within 784
a 15 ms window were considered as candidate members of an Up state, where the window size 785
was determined to decrease the chance of two spikes of the same neuron within the window. To 786
eliminate spontaneous spiking activity of a group that satisfies the above condition but is not part 787
of an Up state, we additionally required that the period between two upstate was at least 300 ms, 788
which corresponds to a cortical Down state. The values for window durations reported above 789
were identified to maximize the performance of the Up state search algorithm. 790
Once all Up states were determined, we defined the time instances when groups were 791
active in each Up state. A group was defined as active if the number of neurons from the group 792
that spikes during 15 ms exceeded the activation threshold, and the instance when the group is 793
active was defined as the average over spike times of a subgroup of neurons with the size equals 794
to the activation threshold within the 15 ms window. In our study the activation threshold was 795
selected to be half of a group size (i.e. 5 neurons). Using sorted time instances when groups are 796
active, we counted the number of times a possible transition between arbitrary groups, and if all 797
four transitions of a sequence were observed sequentially in the right order then we counted that 798
as a replay of the sequence. 799
Connectivity thresholding. To track connections in the trained region of a network, we 800
performed thresholding of the underlying network, called weighted graph, at each second of 801
.CC-BY 4.0 International licensecertified by peer review) is the author/funder. It is made available under aThe copyright holder for this preprint (which was notthis version posted August 7, 2019. . https://doi.org/10.1101/569038doi: bioRxiv preprint

29
simulation time. Thresholding results in a directed unweighted graph, where directed edges 802
define significant edges of the weighted graph for storing the memories. The initial values of 803
synaptic weights are drawn from the same Gaussian distribution with mean 0.0707 and variance 804
10% of the mean. A synaptic connection that encodes a sequence should undergo potentiation, 805
and, hence, its strength should increase in such an event. With this in mind, we selected a 806
threshold to be 0.08 in figure 9D, E, and F and figure 10 that would guarantee that a specific 807
synapse has taken part in storing a memory. Using this relatively high threshold we looked at the 808
connectivity profile of a directed unweighted graph. We dropped the directions of connections in 809
figure 9D, E, and F, and instead, colored connections depending on whether they are 810
unidirectional and go in one or the opposite direction, or there is a recurrent connection going in 811
the opposite direction. To avoid a runaway of synaptic strength over entire simulation protocols, 812
an upper bound on synaptic strength was imposed, which was selected to be twice the mean of 813
initial weight. This upper bound was also used as a threshold. The directed unweighted graph 814
obtained with this threshold value should identify connections which strongly support a memory, 815
and this value was used in figure 10A-C. 816
Total synaptic weight analysis. For every neuron from a group we computed the total 817
synaptic weight “from left” and “to right”, by considering the sum of all weights of synapses 818
projecting on the neuron from neurons in preceding group, with respect to propagation of activity 819
within a memory sequence if such a group exists, and the sum of all weights of synaptic 820
connections from the neuron to the following group, if there is such a group. We omitted all 821
synaptic connections within the group to which the neuron, for which the total synaptic weight is 822
computed, belongs. 823
824
.CC-BY 4.0 International licensecertified by peer review) is the author/funder. It is made available under aThe copyright holder for this preprint (which was notthis version posted August 7, 2019. . https://doi.org/10.1101/569038doi: bioRxiv preprint
30
References: 825 References 826
827 Blokland, A. (1995). Acetylcholine: a neurotransmitter for learning and memory? Brain Res 828 Brain Res Rev 21, 285-300. 829 Clemens, Z., Fabo, D., and Halasz, P. (2005). Overnight verbal memory retention correlates with 830 the number of sleep spindles. Neuroscience 132, 529-535. 831 Fachechi, A., Agliari, E., and Barra, A. (2019). Dreaming neural networks: Forgetting spurious 832 memories and reinforcing pure ones. Neural Networks 112, 24-40. 833 Fogel, S.M., and Smith, C.T. (2006). Learning-dependent changes in sleep spindles and Stage 2 834 sleep. J Sleep Res 15, 250-255. 835 French, R.M. (1999). Catastrophic forgetting in connectionist networks. Trends Cogn Sci 3, 128-836 135. 837 Hassabis, D., Kumaran, D., Summerfield, C., and Botvinick, M. (2017). Neuroscience-Inspired 838 Artificial Intelligence. Neuron 95, 245-258. 839 Hasselmo, M.E. (2017). Avoiding Catastrophic Forgetting. Trends Cogn Sci 21, 407-408. 840 Kemker, R., and Kanan, C. (2017). FearNet: Brain-Inspired Model for Incremental Learning. In 841 arXiv e-prints. 842 Kemker, R., McClure, M., Abitino, A., Hayes, T., and Kanan, C. (2017). Measuring Catastrophic 843 Forgetting in Neural Networks. In arXiv e-prints. 844 Kirkpatrick, J., Pascanu, R., Rabinowitz, N., Veness, J., Desjardins, G., Rusu, A.A., Milan, K., 845 Quan, J., Ramalho, T., Grabska-Barwinska, A., et al. (2017). Overcoming catastrophic forgetting 846 in neural networks. Proc Natl Acad Sci U S A 114, 3521-3526. 847 Kriegeskorte, N. (2015). Deep Neural Networks: A New Framework for Modeling Biological 848 Vision and Brain Information Processing. Annu Rev Vis Sci 1, 417-446. 849 Krishnan, G.P., Chauvette, S., Shamie, I., Soltani, S., Timofeev, I., Cash, S.S., Halgren, E., and 850 Bazhenov, M. (2016). Cellular and neurochemical basis of sleep stages in the thalamocortical 851 network. Elife 5. 852 Krishnan, G.P., Tadros, T., Ramyaa, R., Bazhenov, M. (2019). Biologically inspired sleep 853 algorithm for artificial neural networks. In arXiv e-prints. 854 Ladenbauer, J., Ladenbauer, J., Kulzow, N., de Boor, R., Avramova, E., Grittner, U., and Floel, 855 A. (2017). Promoting Sleep Oscillations and Their Functional Coupling by Transcranial 856 Stimulation Enhances Memory Consolidation in Mild Cognitive Impairment. J Neurosci 37, 857 7111-7124. 858 Laventure, S., Fogel, S., Lungu, O., Albouy, G., Sévigny-Dupont, P., Vien, C., Sayour, C., 859 Carrier, J., Benali, H., and Doyon, J. (2016). NREM2 and Sleep Spindles Are Instrumental to the 860 Consolidation of Motor Sequence Memories. PLoS Biol 14, e1002429. 861 Li, Z.Z., and Hoiem, D. (2018). Learning without Forgetting. Ieee T Pattern Anal 40, 2935-2947. 862 Louie, K., and Wilson, M.A. (2001). Temporally structured replay of awake hippocampal 863 ensemble activity during rapid eye movement sleep. Neuron 29, 145-156. 864 Marshall, L., Helgadottir, H., Molle, M., and Born, J. (2006a). Boosting slow oscillations during 865 sleep potentiates memory. Nature 444, 610-613. 866 Marshall, L., Helgadottir, H., Molle, M., and Born, J. (2006b). Boosting slow oscillations during 867 sleep potentiates memory. Nature 444, 610-613. 868 Marshall, L., Molle, M., Hallschmid, M., and Born, J. (2004). Transcranial direct current 869 stimulation during sleep improves declarative memory. J Neurosci 24, 9985-9992. 870
.CC-BY 4.0 International licensecertified by peer review) is the author/funder. It is made available under aThe copyright holder for this preprint (which was notthis version posted August 7, 2019. . https://doi.org/10.1101/569038doi: bioRxiv preprint

31
McClelland, J.L., McNaughton, B.L., and O'Reilly, R.C. (1995). Why there are complementary 871 learning systems in the hippocampus and neocortex: insights from the successes and failures of 872 connectionist models of learning and memory. Psychol Rev 102, 419-457. 873 Mccloskey, M., and Cohen, N.J. (1989). CATASTROPHIC INTERFERENCE IN 874 CONNECTIONIST NETWORKS: THE SEQUENTIAL LEARNING PROBLEM. The 875 Psychology of Learning and Motivation 24, 109-165. 876 McCormick, D.A. (1992). Neurotransmitter actions in the thalamus and cerebral cortex and their 877 role in neuromodulation of thalamocortical activity. Prog Neurobiol 39, 337-388. 878 Mednick, S.C., McDevitt, E.A., Walsh, J.K., Wamsley, E., Paulus, M., Kanady, J.C., and 879 Drummond, S.P. (2013a). The critical role of sleep spindles in hippocampal-dependent memory: 880 a pharmacology study. J Neurosci 33, 4494-4504. 881 Mednick, S.C., McDevitt, E.A., Walsh, J.K., Wamsley, E., Paulus, M., Kanady, J.C., and 882 Drummond, S.P.A. (2013b). The critical role of sleep spindles in hippocampal-dependent 883 memory: a pharmacology study. J Neurosci 33, 4494-4504. 884 Morin, A., Doyon, J., Dostie, V., Barakat, M., Hadj Tahar, A., Korman, M., Benali, H., Karni, 885 A., Ungerleider, L.G., and Carrier, J. (2008). Motor sequence learning increases sleep spindles 886 and fast frequencies in post-training sleep. Sleep 31, 1149-1156. 887 Ngo, H.V., Martinetz, T., Born, J., and Molle, M. (2013). Auditory closed-loop stimulation of 888 the sleep slow oscillation enhances memory. Neuron 78, 545-553. 889 Nishida, M., and Walker, M.P. (2007). Daytime naps, motor memory consolidation and 890 regionally specific sleep spindles. PLoS One 2, e341. 891 Oudiette, D., Antony, J.W., Creery, J.D., and Paller, K.A. (2013). The role of memory 892 reactivation during wakefulness and sleep in determining which memories endure. J Neurosci 33, 893 6672-6678. 894 Oudiette, D., and Paller, K.A. (2013). Upgrading the sleeping brain with targeted memory 895 reactivation. Trends Cogn Sci 17, 142-149. 896 Paller, K.A., and Voss, J.L. (2004). Memory reactivation and consolidation during sleep. Learn 897 Mem 11, 664-670. 898 Papalambros, N.A., Santostasi, G., Malkani, R.G., Braun, R., Weintraub, S., Paller, K.A., and 899 Zee, P.C. (2017). Acoustic Enhancement of Sleep Slow Oscillations and Concomitant Memory 900 Improvement in Older Adults. Front Hum Neurosci 11, 109. 901 Ramanathan, D.S., Gulati, T., and Ganguly, K. (2015). Sleep-Dependent Reactivation of 902 Ensembles in Motor Cortex Promotes Skill Consolidation. PLOS Biology 13, e1002263. 903 Rasch, B., and Born, J. (2013). About sleep's role in memory. Physiol Rev 93, 681-766. 904 Ratcliff, R. (1990). Connectionist models of recognition memory: constraints imposed by 905 learning and forgetting functions. Psychol Rev 97, 285-308. 906 Rumelhart, D.E., Hinton, G.E., and Williams, R.J. (1986). LEARNING REPRESENTATIONS 907 BY BACK-PROPAGATING ERRORS. Nature 323, 533-536. 908 Sanda, P., Malerba, P., Jiang, X., Krishnan, G.P., Cash, S., Halgren, E., and Bazhenov, M. 909 (2019). Interaction of Hippocampal Ripples and Cortical Slow Waves Leads to Coordinated 910 Large-Scale Sleep Rhythm. bioRxiv, 568881. 911 Shinoe, T., Matsui, M., Taketo, M.M., and Manabe, T. (2005). Modulation of synaptic plasticity 912 by physiological activation of M1 muscarinic acetylcholine receptors in the mouse hippocampus. 913 J Neurosci 25, 11194-11200. 914 Skelin, I., Kilianski, S., and McNaughton, B.L. (2019). Hippocampal coupling with cortical and 915 subcortical structures in the context of memory consolidation. Neurobiol Learn Mem 160, 21-31. 916
.CC-BY 4.0 International licensecertified by peer review) is the author/funder. It is made available under aThe copyright holder for this preprint (which was notthis version posted August 7, 2019. . https://doi.org/10.1101/569038doi: bioRxiv preprint

32
Smith, C., and MacNeill, C. (1994). Impaired motor memory for a pursuit rotor task following 917 Stage 2 sleep loss in college students. J Sleep Res 3, 206-213. 918 Stickgold, R. (2013). Parsing the role of sleep in memory processing. Curr Opin Neurobiol 23, 919 847-853. 920 Sugisaki, E., Fukushima, Y., Fujii, S., Yamazaki, Y., and Aihara, T. (2016). The effect of 921 coactivation of muscarinic and nicotinic acetylcholine receptors on LTD in the hippocampal 922 CA1 network. Brain Res 1649, 44-52. 923 Tamaki, M., Huang, T.-R., Yotsumoto, Y., Hämäläinen, M., Lin, F.-H., Náñez, J.E., Watanabe, 924 T., and Sasaki, Y. (2013). Enhanced spontaneous oscillations in the supplementary motor area 925 are associated with sleep-dependent offline learning of finger-tapping motor-sequence task. 926 Journal of Neuroscience 33, 13894-13902. 927 van de Ven, G.M., and Tolias, A.S. (2018). Generative replay with feedback connections as a 928 general strategy for continual learning. In arXiv e-prints. 929 Walker, M.P., Brakefield, T., Morgan, A., Hobson, J.A., and Stickgold, R. (2002). Practice with 930 sleep makes perfect: sleep-dependent motor skill learning. Neuron 35, 205-211. 931 Walker, M.P., and Stickgold, R. (2004). Sleep-dependent learning and memory consolidation. 932 Neuron 44, 121-133. 933 Wei, Y., Krishnan, G.P., and Bazhenov, M. (2016). Synaptic Mechanisms of Memory 934 Consolidation during Sleep Slow Oscillations. J Neurosci 36, 4231-4247. 935 Wei, Y., Krishnan, G.P., Komarov, M., and Bazhenov, M. (2018). Differential roles of sleep 936 spindles and sleep slow oscillations in memory consolidation. PLoS Comput Biol 14, e1006322. 937 Xu, W., de Carvalho, F., and Jackson, A. (2019). Sequential neural activity in primary motor 938 cortex during sleep. J Neurosci. 939 940
.CC-BY 4.0 International licensecertified by peer review) is the author/funder. It is made available under aThe copyright holder for this preprint (which was notthis version posted August 7, 2019. . https://doi.org/10.1101/569038doi: bioRxiv preprint

195
255Neu
ron
Inde
x
SleepBefore Sleep After Sleep
1
500N
euro
n In
dex
mV-70 -50
Awake Sleep (N3) Awake
500 sCor
tex
Tha
lam
us
A
200 ms 200 ms 200 ms
B
C
D
Figure 1.
Initial Synaptic Weights
Pre-
syna
ptic
Neu
ron
Rel
ativ
e In
dex
0
-20
20
Post-synaptic Neuron Index1 250 500
0.06 0.08Synaptic Weight
PY PY PY PY PY
IN
TC TC TC TC TC
RE RE RE RE RE
IN
Target
Sour
ce.CC-BY 4.0 International licensecertified by peer review) is the author/funder. It is made available under a
The copyright holder for this preprint (which was notthis version posted August 7, 2019. . https://doi.org/10.1101/569038doi: bioRxiv preprint

1
500
Neu
ron
Inde
x
mV
-70
-50
T TS1 S2 T N3 T
500 s
Seq
uenc
e 1
Seq
uenc
e 2
ABCDE
VW
XYZ
195
255
345
405
Neu
ron
Inde
xN
euro
n In
dex
0.02 s
Training Test Before Sleep Test After Sleep195
255
195
255
345
405
345
4051 s 1 s
Neu
ron
Inde
x
Neu
ron
Inde
xN
euro
n In
dex
Neu
ron
Inde
x
Sequence 1
Sequence 2
Per
form
ance
(%
)P
erfo
rman
ce (
%)
20
60
100
20
60
100
Baseline AfterS1
AfterS2
AfterSleep
Baseline AfterS1
AfterS2
AfterSleep
A
B
C
Figure 2.
Pre
-syn
apti
c N
euro
nR
elat
ive
Inde
x
0
-20
20
0
-20
20
0
-20
20
200 300 400
200 300 400
200 300 400
After Sequence 1 Training
After Sequence 2 Training
After Sleep
Post-synaptic Neuron Index
D
0
0.15
Syn
apti
cW
eigh
t
.CC-BY 4.0 International licensecertified by peer review) is the author/funder. It is made available under aThe copyright holder for this preprint (which was notthis version posted August 7, 2019. . https://doi.org/10.1101/569038doi: bioRxiv preprint
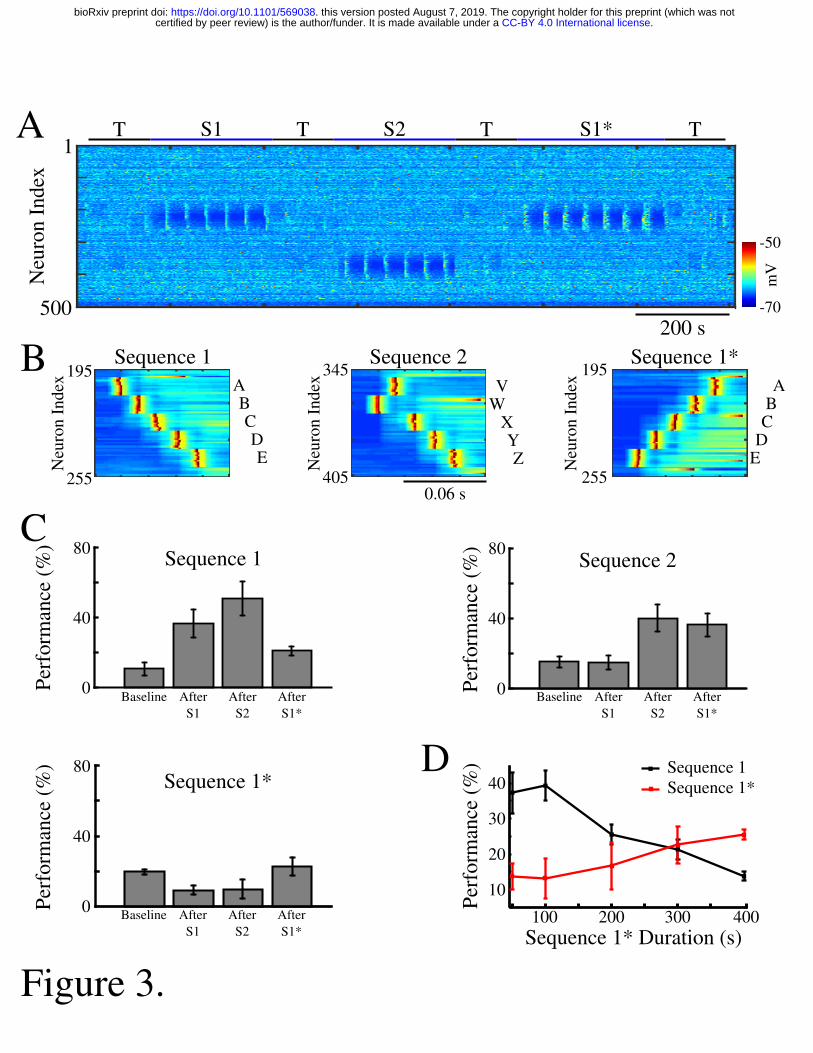
1
500
Neu
ron
Inde
x
mV
-70
-50
T TS1 S2 T T
200 sSequence 2
VW
XYZ
345
405
Neu
ron
Inde
x
Sequence 1ABCDE
195
255
Neu
ron
Inde
x
0.06 s
A
B
C
Figure 3.
S1*
195
255
Neu
ron
Inde
x
BC
E
A
D
Sequence 1*
Sequence 1
Perf
orm
ance
(%)
0
40
80
Baseline AfterS1
AfterS2
AfterS1*
Perf
orm
ance
(%)
0
40
80
Baseline AfterS1
AfterS2
Sequence 2
AfterS1*
Perf
orm
ance
(%)
0
40
80Sequence 1*
Baseline AfterS1
AfterS2
AfterS1*
D
10
20
30
40
100 200 300 400Sequence 1* Duration (s)
Perf
orm
ance
(%) Sequence 1
Sequence 1*
.CC-BY 4.0 International licensecertified by peer review) is the author/funder. It is made available under aThe copyright holder for this preprint (which was notthis version posted August 7, 2019. . https://doi.org/10.1101/569038doi: bioRxiv preprint

1
500
Neu
ron
Inde
x
mV
-70
-50
T TS1 S2 T Interleaved Training T
500 s195
255Neu
ron
Inde
x
Interleaved Training
Sequence 1
Sequence 2
Perf
orm
ance
(%
)Pe
rfor
man
ce (
%)
40
60
Baseline AfterS1
AfterS2
AfterInter.
A
B
C
Figure 4.
Pre-
syna
ptic
Neu
ron
Rel
ativ
e In
dex
0
-20
20
0
-20
20
200 300 400
200 300 400
After Sequence 1 Training
After Interleaved Training
Post-synaptic Neuron Index
D
0
0.15
Syna
ptic
Wei
ght
S1*
0.2 s
20
0 AfterS1*
Baseline AfterS1
AfterS2
AfterInter.
AfterS1*
40
60
20
0
Baseline AfterS1
AfterS2
AfterInter.
AfterS1*
Perf
orm
ance
(%
)
40
60
20
0
Sequence 1*
0
-20
20200 300 400
After Sequence 1* Training
.CC-BY 4.0 International licensecertified by peer review) is the author/funder. It is made available under aThe copyright holder for this preprint (which was notthis version posted August 7, 2019. . https://doi.org/10.1101/569038doi: bioRxiv preprint

Figure 5.
T TS1 S2 T N3 TTS1*
mV
-70
-50
500 s
1
500
Neu
ron
Inde
x
195
255
345
405Neu
ron
Inde
x
195
255
Sequ
ence
1Se
quen
ce 2
Sequ
ence
1*
195
255
345
405195
255
195
255
345
405195
255
195
255
345
405195
255
1
500
Neu
ron
Inde
x
1 s 1 s
A
B
Perf
orm
ance
(%) Sequence 180
40
0Baseline After
S1After
S2AfterSleep
AfterS1*
C0.2 s
Baseline AfterS1
AfterS2
AfterSleep
AfterS1*
80
40
0
Sequence 2
Sequence 1*80
40
0Baseline After
S1After
S2AfterSleep
AfterS1*
Perf
orm
ance
(%)
Perf
orm
ance
(%)
200
600
0 100 200 300Up-State Index
D
Cum
ulat
ive
Sum
of
Full
Rep
lays
Sequence 1*Sequence 1
1000
Ave
rage
Num
of
Sing
le T
rans
ition
s
30
50
10AB BC CD DE AC BD CE
Sequence 1*Sequence 1
.CC-BY 4.0 International licensecertified by peer review) is the author/funder. It is made available under aThe copyright holder for this preprint (which was notthis version posted August 7, 2019. . https://doi.org/10.1101/569038doi: bioRxiv preprint
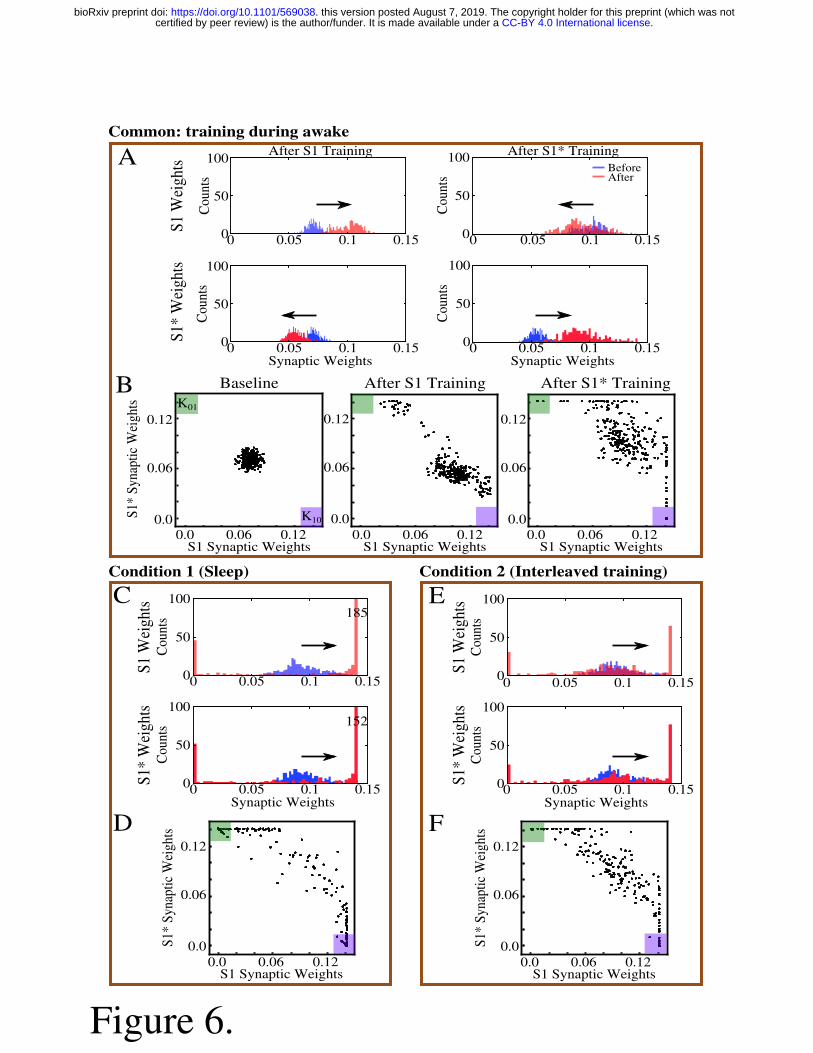
B
C
AS1
* W
eigh
tsS1
Wei
ghts
Synaptic Weights Synaptic Weights
After S1 Training After S1* Training
0
50
100
0
50
100
0
50
100
0
50
100
Cou
nts
Cou
nts
Cou
nts
Cou
nts
0 0.05 0.1 0.15
0 0.05 0.1 0.15 0 0.05 0.1 0.15
0 0.05 0.1 0.15
BeforeAfter
Synaptic Weights0
50
100
0
50
100
Cou
nts
Cou
nts
0 0.05 0.1 0.15
0 0.05 0.1 0.15
152
185
S1*
Syna
ptic
Wei
ghts
0.0
0.06
0.12
0.0 0.06 0.12S1 Synaptic Weights
0.0
0.06
0.12
0.0 0.06 0.12S1 Synaptic Weights
After S1* Training
S1*
Syna
ptic
Wei
ghts
0.0
0.06
0.12
0.0 0.06 0.12S1 Synaptic Weights
Baseline
0.0
0.06
0.12
0.0 0.06 0.12S1 Synaptic Weights
After S1 Training
K10
K01
0
50
100
Cou
nts
0
50
100
Cou
nts
Synaptic Weights0 0.05 0.1 0.15
0 0.05 0.1 0.15
S1*
Syna
ptic
Wei
ghts
0.0
0.06
0.12
0.0 0.06 0.12S1 Synaptic Weights
Common: training during awake
Condition 1 (Sleep) Condition 2 (Interleaved training)
S1*
Wei
ghts
S1 W
eigh
ts
S1*
Wei
ghts
S1 W
eigh
tsE
D F
Figure 6.
.CC-BY 4.0 International licensecertified by peer review) is the author/funder. It is made available under aThe copyright holder for this preprint (which was notthis version posted August 7, 2019. . https://doi.org/10.1101/569038doi: bioRxiv preprint

S1 S1*S1 S1*
Figure 7.
A
B
C
D
Sequence 1Weights
0
0.05
0.1
0.15
0 0.05 0.1 0.15
Sequ
ence
1*
Wei
ghts
0
0.1
0.2
Baseline
S1 S1*
After S1
S1 S1*
After S1*
S1 S1*
After S1 After S1*
0 0.050
0.1 0.15
0.05
0.1
0.15
0 0.05 0.1 0.15
Sequence 1Weights
Sequ
ence
1*
Wei
ghts
Sequence 1Weights
Common: training during awake
Condition 1 (Sleep) Condition 2 (Interleaved training)
0 0.05 0.1 0.15
0
0.05
0.1
0.15
Sequence 1Weights
Sequ
ence
1*
Wei
ghts
0
0.1
0.2
0
0.1
0.2E
F
.CC-BY 4.0 International licensecertified by peer review) is the author/funder. It is made available under aThe copyright holder for this preprint (which was notthis version posted August 7, 2019. . https://doi.org/10.1101/569038doi: bioRxiv preprint
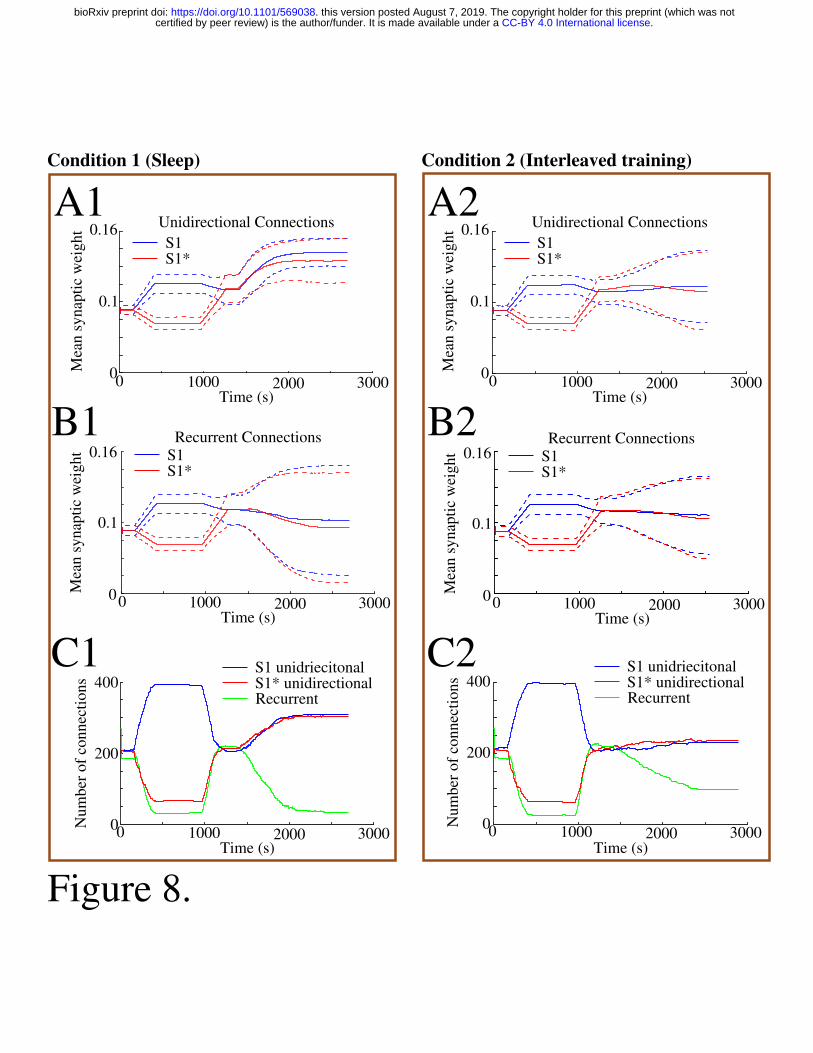
A1
B1
Condition 1 (Sleep) Condition 2 (Interleaved training)
C1
A2
B2
C2
200
0Num
ber o
f con
nect
ions 400
S1 unidriecitonalS1* unidirectionalRecurrent
0 1000 2000 3000Time (s)
0.1
0
0.16
Mea
n sy
napt
ic w
eigh
t
0 1000 2000 3000Time (s)
S1S1*
Recurrent Connections
0.1
0
0.16M
ean
syna
ptic
wei
ght
0 1000 2000 3000Time (s)
S1S1*
Recurrent Connections
0.1
0Mea
n sy
napt
ic w
eigh
t
0 1000 2000 3000Time (s)
0.16S1S1*
Unidirectional Connections
0.1
0Mea
n sy
napt
ic w
eigh
t
0 1000 2000 3000
0.16S1S1*
Unidirectional Connections
Time (s)
200
0Num
ber o
f con
nect
ions 400
S1 unidriecitonalS1* unidirectionalRecurrent
0 1000 2000 3000Time (s)
Figure 8.
.CC-BY 4.0 International licensecertified by peer review) is the author/funder. It is made available under aThe copyright holder for this preprint (which was notthis version posted August 7, 2019. . https://doi.org/10.1101/569038doi: bioRxiv preprint
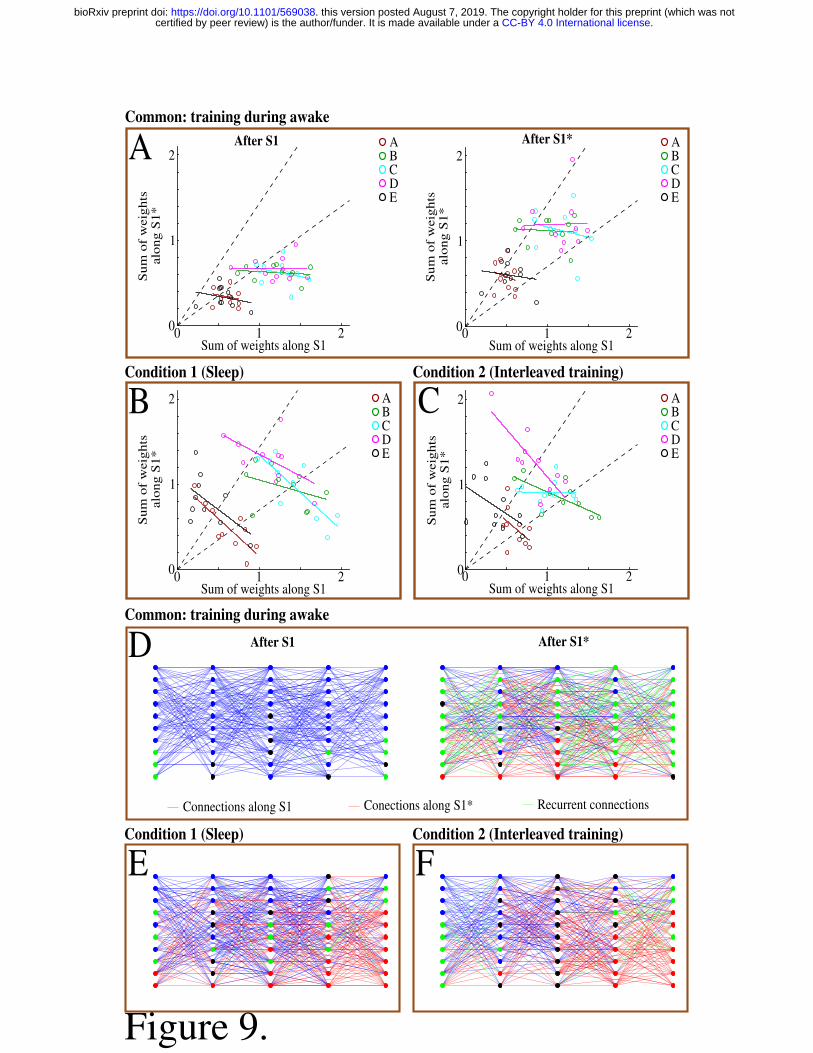
D
E
Common: training during awakeAfter S1 After S1*
Connections along S1 Conections along S1* Recurrent connections
Condition 1 (Sleep) Condition 2 (Interleaved training)
F
Figure 9.
Sum
of
wei
ghts
al
ong
S1*
Sum of weights along S1
ABCDE
A
B
Common: training during awakeAfter S1 After S1*
Condition 1 (Sleep) Condition 2 (Interleaved training)
1
0
2
10 2
Sum
of
wei
ghts
al
ong
S1*
Sum of weights along S1
1
0
2
10 2
Sum
of
wei
ghts
al
ong
S1*
Sum of weights along S1
1
0
2
10 2
Sum
of
wei
ghts
al
ong
S1*
Sum of weights along S1
1
0
2
10 2
CABCDE
ABCDE
ABCDE
.CC-BY 4.0 International licensecertified by peer review) is the author/funder. It is made available under aThe copyright holder for this preprint (which was notthis version posted August 7, 2019. . https://doi.org/10.1101/569038doi: bioRxiv preprint
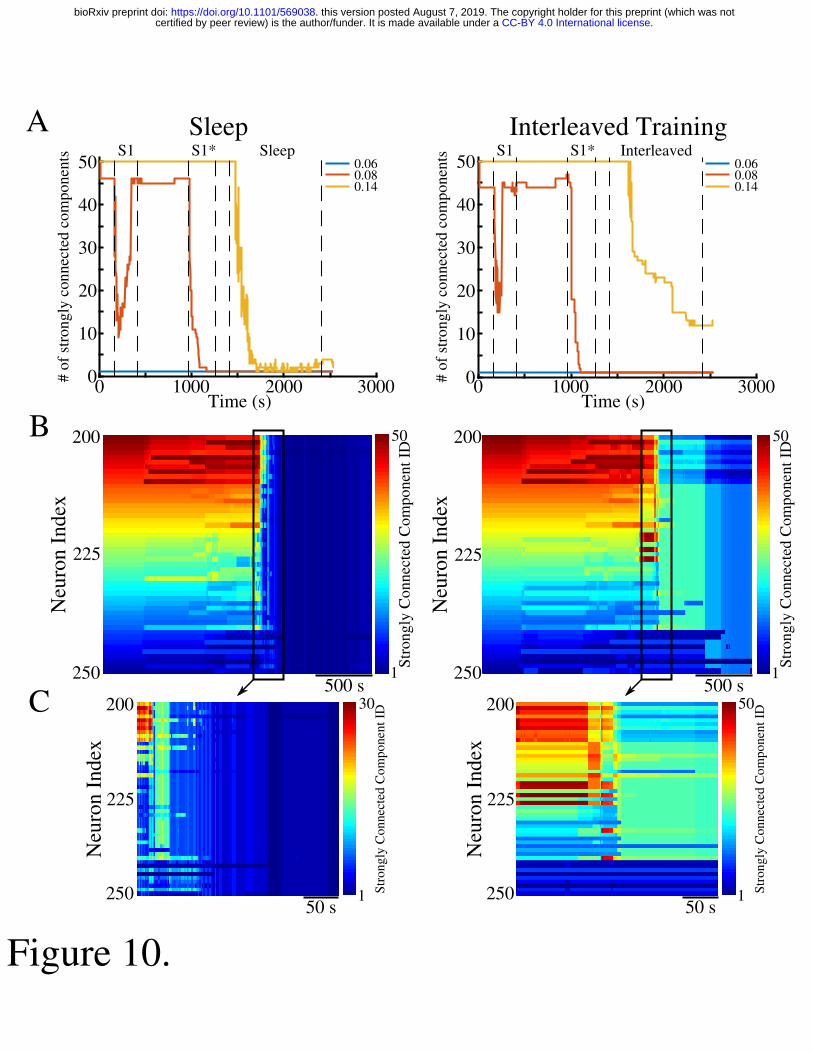
Sleep Interleaved TrainingA
B
S1 S1* Sleep0.060.080.14
# of
str
ongl
y co
nnec
ted
com
pone
nts
0
10
20
30
40
50
0 1000 2000 3000Time (s)
C1
50
250
200
225
Neu
ron
Inde
x
Stro
ngly
Con
nect
ed C
ompo
nent
ID
500 s
250
200
225
Neu
ron
Inde
x
50 s1
50
Stro
ngly
Con
nect
ed C
ompo
nent
ID
50 s250
200
225
Neu
ron
Inde
x
1
30
Stro
ngly
Con
nect
ed C
ompo
nent
ID
# of
str
ongl
y co
nnec
ted
com
pone
nts
0
10
20
30
40
50
0 1000 2000 3000Time (s)
0.060.080.14
S1 S1* Interleaved
250
200
225
Neu
ron
Inde
x
1
50
Stro
ngly
Con
nect
ed C
ompo
nent
ID
500 s
Figure 10.
.CC-BY 4.0 International licensecertified by peer review) is the author/funder. It is made available under aThe copyright holder for this preprint (which was notthis version posted August 7, 2019. . https://doi.org/10.1101/569038doi: bioRxiv preprint