Can Process Analytical Technology Lead to Real-time Quality Management for Dairy Food Products?
30
Can Process Analytical Technology Lead to Real-time Quality Management for Dairy Food Products? Brent Young*, Nick Depree, Taj Munir and David Wilson *[email protected] Farm ing Processing & Supply C hain Ingredients & D airy Solutions C onsum erProducts Innovation to Transform the D airy Value C hain D airy Prim ary G row th Partnership Program me
-
Upload
sloane-burch -
Category
Documents
-
view
21 -
download
0
description
Can Process Analytical Technology Lead to Real-time Quality Management for Dairy Food Products?. Brent Young*, Nick Depree, Taj Munir and David Wilson *[email protected]. The Nature of Dairy/Food Materials. Biological sources of variation Highly perishable - PowerPoint PPT Presentation
Transcript of Can Process Analytical Technology Lead to Real-time Quality Management for Dairy Food Products?

Can Process Analytical Technology Lead to Real-time Quality Management
for Dairy Food Products?
Brent Young*, Nick Depree, Taj Munir and David Wilson
FarmingProcessing & Supply
ChainIngredients & Dairy
SolutionsConsumer Products
Innovation to Transform the Dairy Value Chain
Dairy Primary Growth Partnership Programme

The Nature of Dairy/Food Materials
• Biological sources of variation• Highly perishable• Properties are time dependent• Properties are often not well characterised
Presents considerable challenges – to process design, control and optimisation systems – to sustainably produce safe, consistent and
economically viable products
FarmingProcessing & Supply
ChainIngredients & Dairy
SolutionsConsumer Products
Innovation to Transform the Dairy Value Chain
Dairy Primary Growth Partnership Programme

Traditional Real-time Process Control Solutions
State of the art:
Stainless steel & PLCs – Temperature,
pressure and flow instrumentation
– Uni-variate monitoring– Manual control
common– Minimal optimisation
FarmingProcessing & Supply
ChainIngredients & Dairy
SolutionsConsumer Products
Innovation to Transform the Dairy Value Chain
Dairy Primary Growth Partnership Programme
Challenge: We have real-time process control for some variables. But what about real-time quality (RTQ) control!?

What is RTQ? Is it PAT?
PAT Definition:
Process Analytical Technology* involves the systems approach in the planning, design, control and optimization of processing plants.
This is a model based framework that encompasses new enabling technologies for most areas of the processing industry.
* US Department of Health and Human Services, Process Analytical Technology, FDA, 2004
Challenge: Is PAT simply an evolution of what we have done all along?
FarmingProcessing & Supply
ChainIngredients & Dairy
SolutionsConsumer Products
Innovation to Transform the Dairy Value Chain
Dairy Primary Growth Partnership Programme

What is RTQ? Is it PAT?1. Process analysers
– Fusion of models and latest sensors for better monitoring
2. Design, data acquisition and analysis tools– Multivariate models for deeper process analysis
3. Process control tools– Targeted models for optimisation– Mini models for exception detection
4. Continuous improvement and knowledge management tools– Holistic approach that integrates methodologies– Driven by the customer & regulatory authorities
FarmingProcessing & Supply
ChainIngredients & Dairy
SolutionsConsumer Products
Innovation to Transform the Dairy Value Chain
Dairy Primary Growth Partnership Programme

What is RTQ? Is it PSE?
Fonterra Te Rapa Process PlantTA Instruments ARG2 Rheometer University Dairy Viscosity Testing Rig
FarmingProcessing & Supply
ChainIngredients & Dairy
SolutionsConsumer Products
Innovation to Transform the Dairy Value Chain
Dairy Primary Growth Partnership Programme

Tools: Simulators Pinch Tech Soft Sensing Smart SensorsSteam MPC*
Multivariate SCM** PAT Tools
Model DAEs Objects Large Scale Data DrivenTypes: Codes Exception Based
FarmingProcessing & Supply
ChainIngredients & Dairy
SolutionsConsumer Products
Innovation to Transform the Dairy Value Chain
Dairy Primary Growth Partnership Programme
* Model Predictive Control** Supply Chain Management
vmilmifmi
mi wywxwzdt
Mxd
dM
dtw w wf l v
dM
dtw wgvi v
What is RTQ? Is it PSE?

RTQ: A refocus for our aims
FarmingProcessing & Supply
ChainIngredients & Dairy
SolutionsConsumer Products
Innovation to Transform the Dairy Value Chain
Dairy Primary Growth Partnership Programme
vmilmifmi
mi wywxwzdt
Mxd
dM
dtw w wf l v
dM
dtw wgvi v
I’m happy with my equipment,
but how do I save energy & operating costs?
Primarily interested in equipment design &
operation
What are my mass & energy balances?
Final QA found something amiss
What happened, where & how much product is
affected?
Challenge: Capturing a customer-centric view in a traditional engineering environment

Two Views
Challenge: Do we have two masters?
FarmingProcessing & Supply
ChainIngredients & Dairy
SolutionsConsumer Products
Innovation to Transform the Dairy Value Chain
Dairy Primary Growth Partnership Programme
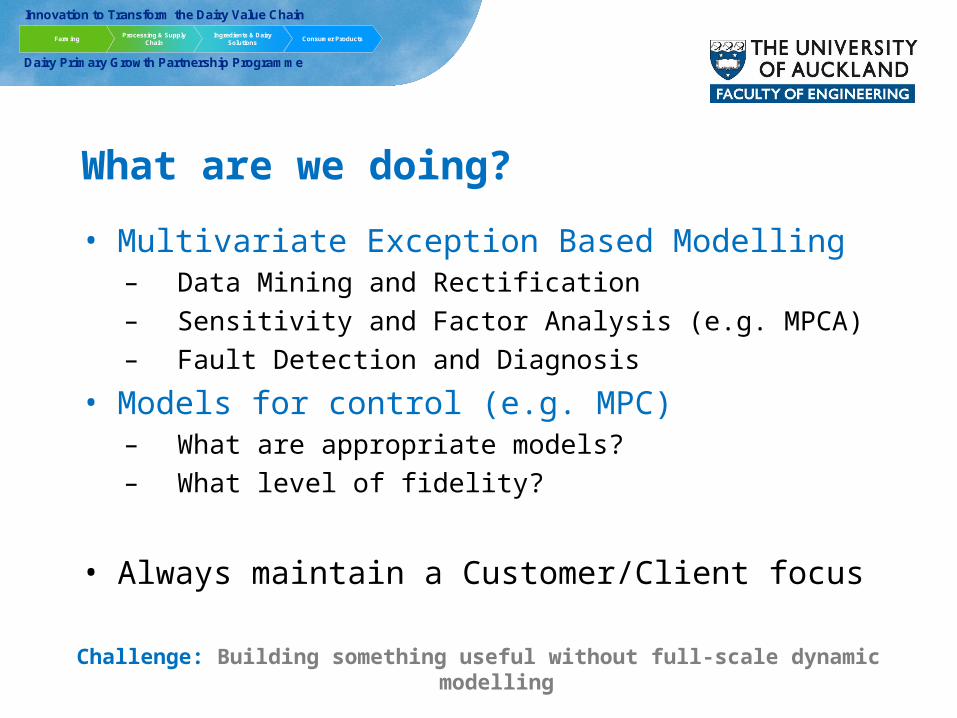
What are we doing?
• Multivariate Exception Based Modelling– Data Mining and Rectification– Sensitivity and Factor Analysis (e.g. MPCA)– Fault Detection and Diagnosis
• Models for control (e.g. MPC)– What are appropriate models?– What level of fidelity?
• Always maintain a Customer/Client focus
FarmingProcessing & Supply
ChainIngredients & Dairy
SolutionsConsumer Products
Innovation to Transform the Dairy Value Chain
Dairy Primary Growth Partnership Programme
Challenge: Building something useful without full-scale dynamic modelling

How are we doing it?
Platform Technologies
Rapid PrototypingBuilding mini-models
R/MATLAB/Python(Tools within) Pavilion
Steady State & Dynamic Modelling
VMGSimMATLAB
Graphical User/Operator Interface Pavilion
Challenge: Building a flexible proto-typing environment,not getting bogged down producing commercial software.
FarmingProcessing & Supply
ChainIngredients & Dairy
SolutionsConsumer Products
Innovation to Transform the Dairy Value Chain
Dairy Primary Growth Partnership Programme
Challenge: Reflective Visualisation – getting timely information to make informed decisions now & tomorrow.

Operator Displays
Visualisation
FarmingProcessing & Supply
ChainIngredients & Dairy
SolutionsConsumer Products
Innovation to Transform the Dairy Value Chain
Dairy Primary Growth Partnership Programme
Is this the best we can do?

Basic Ideas
• Not a standard operator’s display– We already have those
• Data is graphical– Dense, big screens– A3 paper
• Focus on the future– What might happen & when – Future gets uncertain
• Consistent Colour design– Low impact
FarmingProcessing & Supply
ChainIngredients & Dairy
SolutionsConsumer Products
Innovation to Transform the Dairy Value Chain
Dairy Primary Growth Partnership Programme

Careful design of charts – resolution, colour, aspect ratio:
Typical graphics layouts
Ref: Tufte’s The Visual Display of Quantitative Information
FarmingProcessing & Supply
ChainIngredients & Dairy
SolutionsConsumer Products
Innovation to Transform the Dairy Value Chain
Dairy Primary Growth Partnership Programme

Advanced Visualisation
FarmingProcessing & Supply
ChainIngredients & Dairy
SolutionsConsumer Products
Innovation to Transform the Dairy Value Chain
Dairy Primary Growth Partnership Programme
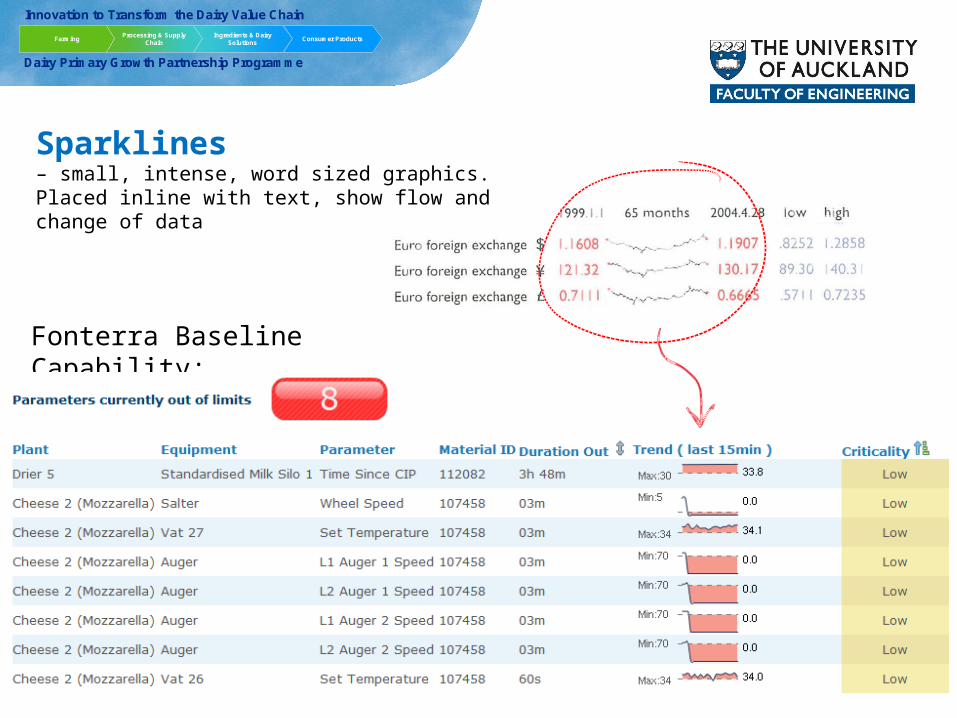
Sparklines – small, intense, word sized graphics. Placed inline with text, show flow and change of data
Fonterra Baseline Capability:
FarmingProcessing & Supply
ChainIngredients & Dairy
SolutionsConsumer Products
Innovation to Transform the Dairy Value Chain
Dairy Primary Growth Partnership Programme

Colour Maps & HMI Design
FarmingProcessing & Supply
ChainIngredients & Dairy
SolutionsConsumer Products
Innovation to Transform the Dairy Value Chain
Dairy Primary Growth Partnership Programme

Chart improvement – Clarity, Resolution, Data Density
FarmingProcessing & Supply
ChainIngredients & Dairy
SolutionsConsumer Products
Innovation to Transform the Dairy Value Chain
Dairy Primary Growth Partnership Programme

Focus on the future
FarmingProcessing & Supply
ChainIngredients & Dairy
SolutionsConsumer Products
Innovation to Transform the Dairy Value Chain
Dairy Primary Growth Partnership Programme

Design, Data Acquisition & Analysis Tools
• Data driven techniques– Data Mining & Rectification– Sensitivity & Factor
Analysis– PCA
– Fault Detection & Diagnosis – PCA & Discriminant Analysis
– Traceability – Bayesian Belief Networks,
Transfer Entropy
• Model based techniques– Process Simulation
FarmingProcessing & Supply
ChainIngredients & Dairy
SolutionsConsumer Products
Innovation to Transform the Dairy Value Chain
Dairy Primary Growth Partnership Programme

FarmingProcessing & Supply
ChainIngredients & Dairy
SolutionsConsumer Products
Innovation to Transform the Dairy Value Chain
Dairy Primary Growth Partnership Programme

FarmingProcessing & Supply
ChainIngredients & Dairy
SolutionsConsumer Products
Innovation to Transform the Dairy Value Chain
Dairy Primary Growth Partnership Programme

Next steps…
• Focus on the future: Does it work?– Mini tools to tell you what will happen– Countdown
• Two screens: two types of information– Dashboards: (useful or naff?)– Super big screens, or multiple screens? – Always visible? Build your own?
• Getting away from trends & PFDs:– Moving “blobs”
FarmingProcessing & Supply
ChainIngredients & Dairy
SolutionsConsumer Products
Innovation to Transform the Dairy Value Chain
Dairy Primary Growth Partnership Programme

This mini tool warns against blockage of the SFB – increasing T between 2 probes indicates poor flow or sticky powder
This right hand plot shows a zoom into small detailed region using the mini-tool
FarmingProcessing & Supply
ChainIngredients & Dairy
SolutionsConsumer Products
Innovation to Transform the Dairy Value Chain
Dairy Primary Growth Partnership Programme

A mini tool looking at stability of feed solids to drier
Example stable for most of cypher but sudden change at endReal version is interactive version
FarmingProcessing & Supply
ChainIngredients & Dairy
SolutionsConsumer Products
Innovation to Transform the Dairy Value Chain
Dairy Primary Growth Partnership Programme

Vitamin D Dosing Mini Tool
With over dosing (right)
Without (below)
FarmingProcessing & Supply
ChainIngredients & Dairy
SolutionsConsumer Products
Innovation to Transform the Dairy Value Chain
Dairy Primary Growth Partnership Programme

Coffee Sediments SQC
Coffee sediments scores plot (right)
N.B. colours are start/middle/end of run
How to display in real time for operators?
-> ‘Snakes on a Plane’ planned! (e.g. below)
FarmingProcessing & Supply
ChainIngredients & Dairy
SolutionsConsumer Products
Innovation to Transform the Dairy Value Chain
Dairy Primary Growth Partnership Programme

Acknowledgments
I2C2•Drs Irina Boiarkine & Ville Rimpilainen (UOA)•Arrian Prince-Pike (AUT)
Fonterra•Advanced Process Control Group, Drs Tristan Hunter & Nigel Russell (Fonterra)
Primary Growth Partnership Program (PGP)
FarmingProcessing & Supply
ChainIngredients & Dairy
SolutionsConsumer Products
Innovation to Transform the Dairy Value Chain
Dairy Primary Growth Partnership Programme

Can Process Analytical Technology Lead to Real-time Quality Management
for Dairy Food Products?
Brent Young*, Nick Depree, Taj Munir and David Wilson
FarmingProcessing & Supply
ChainIngredients & Dairy
SolutionsConsumer Products
Innovation to Transform the Dairy Value Chain
Dairy Primary Growth Partnership Programme

We never said we were statisticians.
FarmingProcessing & Supply
ChainIngredients & Dairy
SolutionsConsumer Products
Innovation to Transform the Dairy Value Chain
Dairy Primary Growth Partnership Programme