
Can Bottom-Up Institutional Reform Improve Service...
51
*† * †
Transcript of Can Bottom-Up Institutional Reform Improve Service...
Can Bottom-Up Institutional Reform Improve Service Delivery?
Evidence from the Citizen Visible Audit program in Colombia.
Ezequiel Molina∗†
Princeton University
May 6, 2013
Contents
1 Introduction 2
2 The Citizen Visible Audit Program 7
3 Theoretical Framework 9
4 Identi�cation Strategy 15
5 Empirical Results 18
5.1 Citizen Visible Audit Program Impact on Project Performance . . . . . . . . . . . . . . . 18
5.2 Uncovering the CVA Program Mechanisms . . . . . . . . . . . . . . . . . . . . . . . . . . 23
5.2.1 De�cient Implementation Theory . . . . . . . . . . . . . . . . . . . . . . . . . . . . 25
5.2.2 Civic Participation Failure Theory . . . . . . . . . . . . . . . . . . . . . . . . . . . 27
5.2.3 Non-Accountable Governments Theory . . . . . . . . . . . . . . . . . . . . . . . . . 33
5.2.4 Self-Ful�lling Prophecy Theory . . . . . . . . . . . . . . . . . . . . . . . . . . . . . 36
6 Conclusions 45
7 Appendix 50
∗Acknowledgements: I wish to thank the Research Program in Political Economy for �nancing a trip to collect the
necessary data to design the research. I also want to thank Edgardo Mosqueira, Arturo Herrera, as well as the LCSPS Team
at the World Bank who made this project possible. Finally I want to thank Liliana Marcela Canas, Lorena Diaz Martinez,
Cecilia Angelica Vivas Robles, Virginia Guevara Sierra, Andres Mackenzie and the team working on the coordination of the
Citizen Visible Audit program at Direccion Nacional de Planeacion (DNP) in Colombia. The usual disclaimer applies.†Corresponding author: Ezequiel Molina [email protected]
1
1 Introduction
The evidence is clear. Public service delivery in developing countries is highly inadequate. In India, one
quarter of all the teachers in public schools and more than a third of nurses and doctors were absent
when enumerators arrived at the schools and hospitals (Chaudhury, Hammer, Kremer, Muralidharan and
Rogers, 2006). Not only teachers, nurses, and doctors are �missing in action� but also public resources.
A landmark study in Uganda found that only 13 percentage of the public funds the central government
assigned to the school system reaches its intended destination (Reinikka and Svensson, 2004, 2011).
Leakages are also a problem for Tanzania, where elected o�cials are the recipients of more than half of
the total amount of subsidized fertilizer's price vouchers (Pan and Christiaensen, 2012). Examples on
corruption and ine�cient allocation of resources in service delivery abound in underdeveloped countries
(World-Bank, 2003). Crucial resources needed to increase opportunities among citizens, to improve
infrastructure, and to reduce the learning gap are lost every day due to pockets of ine�ciency and
corruption.
Scholars have argued that the fundamental problem that give rise to ine�cient delivery of basic
services such as the teacher and nurses absenteeism, leakage, and missing public funds described above
are accountability failures. The argument is succinctly explained by Devarajan, Khemani and Walton
(2011). In a private market transaction (e.g. paying for a haircut) there is direct accountability of the
provider to the client or consumer. The client pays the vendor directly; she can observe not only whether
she receives the haircut but also the quality of the service. And, if the market is reasonably competitive,
the client can go elsewhere to get a haircut, and the salon and the hairdressers know that. The 2004
World Development Report named this relationship �the short route of accountability.� However, for
markets characterized by natural monopolies such as the provision of electricity and sanitation as well
as other strategic markets such as education and health, the government is involved in service provision.
As a result, the relationship between the client and the service provider is no longer a direct one, but an
indirect one, intermediated by the state. Citizens, in their role as voters, hold politicians accountable for
allocating resources and regulating the service provision. In turn, politicians and policymakers rely on
managers, who at the same time rely on front-line providers such as teachers and policemen to deliver
the service. This is the �long route of accountability.�
The problem arise because the formal institutions embedded in the �long route of accountability�
are often weak in developing countries (Bardhan, 2002). Patronage, lack of state capacity, or even weak
electoral institutions may prevent citizens to hold o�cials accountable for the quality of service provision
(Adsera, Boix and Payne, 2003; Besley and Persson, 2011; Persson and Tabellini, 2002).
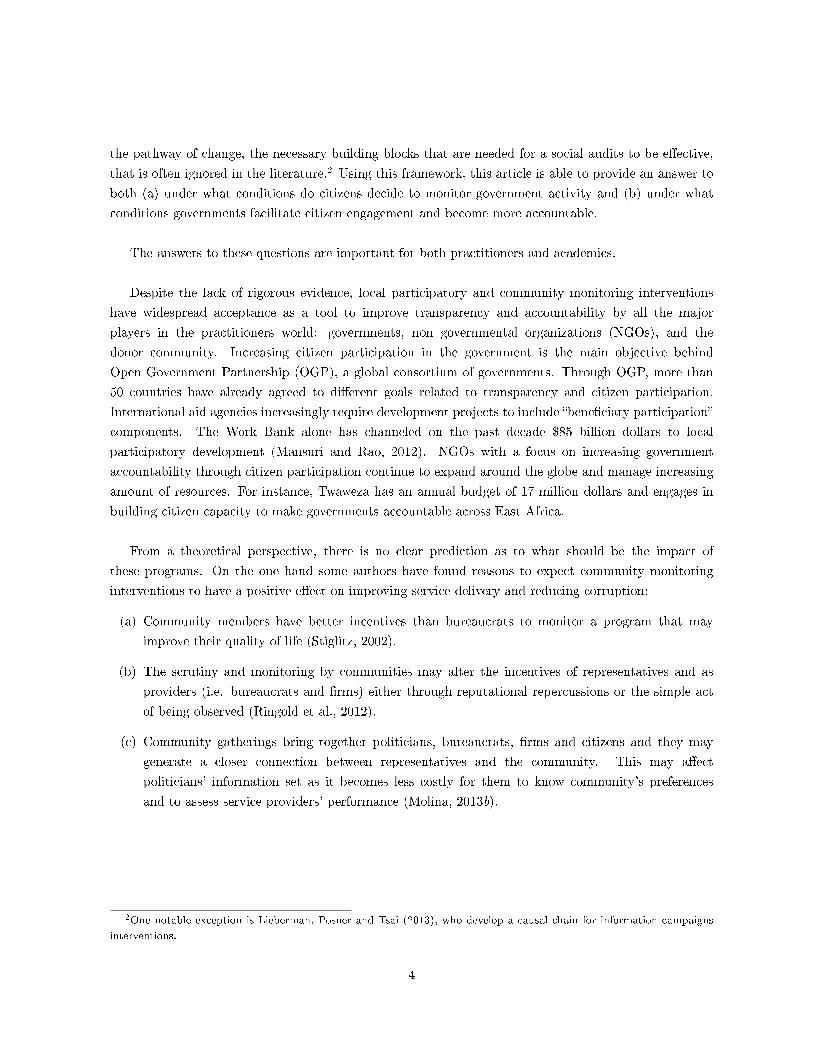
In order to address these challenges, many policies such as information campaigns, scorecards, social
audits, and grievance redress mechanisms have been proposed to enhance involvement of bene�ciaries
in service provision. Table 1 below describes these policies. The idea that community members have
incentives to monitor providers and demand for better services (Stiglitz, 2002) led practitioners to
2
believe that allowing communities to have monitoring power over providers could be bene�cial in the
short and in the long term. In the short term it could improve outcomes by identifying pockets of
corruption and ine�ciency in service provision. In the long term it may contribute to change political
norms, establishing a transparent and accessible channel of communication for the community to provide
feedback to providers and politicians on a regular basis.
Table 1: Policies Aimed to Increase Civic Participation in Monitoring Public O�cials and Providers
Policies Description
Information These campaigns include: a) information on how to monitor providers,
Campaign and b) information on the performance of providers and/or the
importance of the service.
Scorecard It is a quantitative survey that assesses users' satisfaction and experiences
with various dimensions of service delivery. It often involves a meeting between
the recipients of services and providers to discuss the �ndings of the survey
and to develop a follow-up plan (Ringold, Holla, Koziol and Srinivasan, 2012).
Social Audit Social audits allow citizens receiving a speci�c service to examine and cross-check
the information the provider makes available against information
collected from users of the service (Ringold et al., 2012).
Grievance These are mechanisms that provide citizens with opportunities to use information
Redress to in�uence service delivery and give feedback on government programs and services,
Mechanisms including complaint hotlines, informal dispute resolution mechanisms,
and courts (Ringold et al., 2012).
Understanding whether such programs actually a�ect the behavior of bene�ciaries, providers and
politicians and in turn improve outcomes is an open empirical question1 (Mansuri and Rao, 2004).
Additionally, we still know little about the barriers and facilitators through which these interventions
have an impact (or lack thereof).
The goal of this article is precisely to contribute to �ll this gap. In particular, using a unique dataset
from the Citizen Visible Audit (CVA) program in Colombia, the paper provides new evidence of the
e�ect of social audits on citizens' satisfaction with infrastructure projects as well as subjective measures
of the e�ciency of the execution process. The article introduces a theoretical framework to understand
1See Molina (2013a) for a systematic review on whether community monitoring interventions help improve outcomes
and curb corruption in service delivery in low income communities.
3
the pathway of change, the necessary building blocks that are needed for a social audits to be e�ective,
that is often ignored in the literature.2 Using this framework, this article is able to provide an answer to
both (a) under what conditions do citizens decide to monitor government activity and (b) under what
conditions governments facilitate citizen engagement and become more accountable.
The answers to these questions are important for both practitioners and academics.
Despite the lack of rigorous evidence, local participatory and community monitoring interventions
have widespread acceptance as a tool to improve transparency and accountability by all the major
players in the practitioners world: governments, non governmental organizations (NGOs), and the
donor community. Increasing citizen participation in the government is the main objective behind
Open Government Partnership (OGP), a global consortium of governments. Through OGP, more than
50 countries have already agreed to di�erent goals related to transparency and citizen participation.
International aid agencies increasingly require development projects to include �bene�ciary participation�
components. The Work Bank alone has channeled on the past decade $85 billion dollars to local
participatory development (Mansuri and Rao, 2012). NGOs with a focus on increasing government
accountability through citizen participation continue to expand around the globe and manage increasing
amount of resources. For instance, Twaweza has an annual budget of 17 million dollars and engages in
building citizen capacity to make governments accountable across East Africa.
From a theoretical perspective, there is no clear prediction as to what should be the impact of
these programs. On the one hand some authors have found reasons to expect community monitoring
interventions to have a positive e�ect on improving service delivery and reducing corruption:
(a) Community members have better incentives than bureaucrats to monitor a program that may
improve their quality of life (Stiglitz, 2002).
(b) The scrutiny and monitoring by communities may alter the incentives of representatives and as
providers (i.e. bureaucrats and �rms) either through reputational repercussions or the simple act
of being observed (Ringold et al., 2012).
(c) Community gatherings bring together politicians, bureaucrats, �rms and citizens and they may
generate a closer connection between representatives and the community. This may a�ect
politicians' information set as it becomes less costly for them to know community's preferences
and to assess service providers' performance (Molina, 2013b).
2One notable exception is Lieberman, Posner and Tsai (2013), who develop a causal chain for information campaigns
interventions.
4
On the other hand, some authors have argue that successful implementation of community monitoring
interventions might prove more di�cult than expected:
(a) Monitoring public projects is a public good, so there may be a free-rider problem (Olson, 1971).
(b) Community monitoring may also be prone to be captured by local elites (Bardhan, 2002; Bardhan
and Mookherjee, 2006; Olken, 2007).
(c) Citizen's beliefs regarding the probability of success of the community monitoring exercise may
a�ect their participation rate, which in turn, a�ects its visibility. When public o�cials and providers
observe weak community monitoring and low visibility, their incentives to spend time and e�ort
improving service delivery are diminished (Molina, 2013b).
Furthermore, empirical studies have not been able to provide a clear answer regarding the impact
of community monitoring programs either. Table 2 provides an arbitrarily summary of evaluations of
community monitoring interventions.
Evaluations have found what at �rst appears to be contradicting evidence regarding the e�ect of
community monitoring schemes on service delivery outcomes. Björkman and Svensson (2009) found
that community scorecards in Uganda signi�cantly increased the quality and quantity of primary health
care provision. The evidence from this study suggests that the most important causal mechanism that
explains the positive outcome is the one derived from providers' behavioral change.
Banerjee, Banerji, Du�o, Glennerster and Khemani (2010), however, found the opposite result when
testing the e�ect of an information campaign in India. They reported that neither giving citizens
information on how to use existing institutions to monitor schools nor training them in a testing tool
to monitor children's learning had any statistical impact on children's learning performance. Only the
intervention that did not involve government action, training volunteers to help children learn to read,
had a positive e�ect on children's reading skills (3-8%).
5
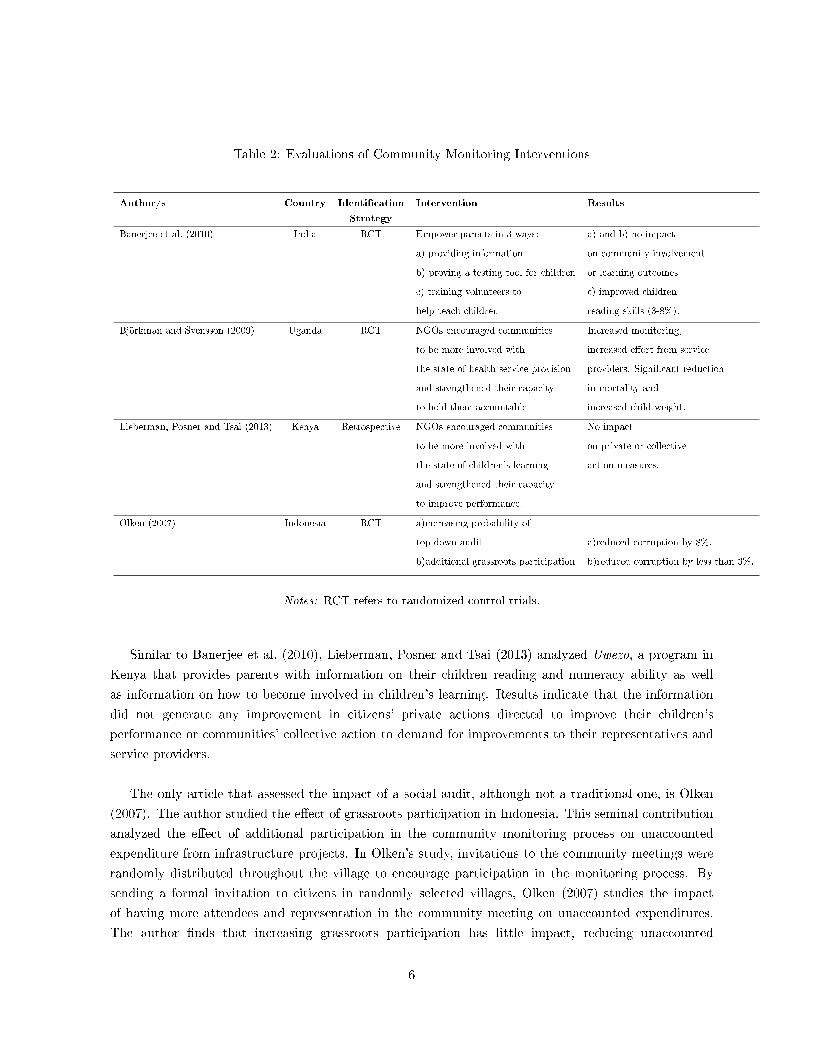
Table 2: Evaluations of Community Monitoring Interventions
Author/s Country Identi�cation Intervention Results
Strategy
Banerjee et al. (2010) India RCT Empower parents in 3 ways: a) and b) no impact
a) providing information on community involvement
b) proving a testing tool for children or learning outcomes
c) training volunteers to c) improved children
help teach children reading skills (3-8%).
Björkman and Svensson (2009) Uganda RCT NGOs encouraged communities Increased monitoring,
to be more involved with increased e�ort from service
the state of health service provision providers. Signi�cant reduction
and strengthened their capacity in mortality and
to hold them accountable increased child weight.
Lieberman, Posner and Tsai (2013) Kenya Retrospective NGOs encouraged communities No impact
to be more involved with on private or collective
the state of children's learning action measures.
and strengthened their capacity
to improve performance.
Olken (2007) Indonesia RCT a)increasing probability of
top down audit a)reduced corruption by 8%.
b)additional grassroots participation b)reduced corruption by less than 3%.
Notes: RCT refers to randomized control trials.
Similar to Banerjee et al. (2010), Lieberman, Posner and Tsai (2013) analyzed Uwezo, a program in
Kenya that provides parents with information on their children reading and numeracy ability as well
as information on how to become involved in children's learning. Results indicate that the information
did not generate any improvement in citizens' private actions directed to improve their children's
performance or communities' collective action to demand for improvements to their representatives and
service providers.
The only article that assessed the impact of a social audit, although not a traditional one, is Olken
(2007). The author studied the e�ect of grassroots participation in Indonesia. This seminal contribution
analyzed the e�ect of additional participation in the community monitoring process on unaccounted
expenditure from infrastructure projects. In Olken's study, invitations to the community meetings were
randomly distributed throughout the village to encourage participation in the monitoring process. By
sending a formal invitation to citizens in randomly selected villages, Olken (2007) studies the impact
of having more attendees and representation in the community meeting on unaccounted expenditures.
The author �nds that increasing grassroots participation has little impact, reducing unaccounted
6
expenditures only in situations with limited free-rider problems and limited elite capture.
This article makes three contributions to the literature. First, it provides new evidence of the impact
of community monitoring interventions using a unique dataset from the Citizen Visible Audit (CVA)
program in Colombia. In contrast with Olken (2007), where the community had the ability to manage
the funds to build a given project, in the present study I assess the impact of a program aimed at
empowering citizens through increasing their opportunity to make providers and local governments
accountable, not a group of peers. This means that citizens do not have decision power, but only the
opportunity to monitor infrastructure projects. This reduces problems related with elite capture that
may arise when the community has decision power over public resources. The second contribution is
the introduction a theoretical framework to understand the pathway of change of the CVA program.
Using this framework, the third contribution of this article is to give an answer to both (a) under what
conditions do citizens decide to monitor government activity and (b) under what conditions governments
facilitate citizen engagement and become more accountable.
Finally, to the best of my knowledge, this is the �rst article to evaluate the impact of a community
monitoring program administered by the government instead of an NGO. This increases the external
validity of the results, as NGOs do not have neither the logistical power nor the mandate to administer
a program if scaling it up is necessary.
The remainder of the article is organized as follows. The next section provides background information
on the CVA program. Section 3 introduces the pathway of change and section 4 describes the identi�cation
strategy. Section 5 presents the impact of the CVA program on project performance. Additionally, using
the framework introduced in section 3, section 5 provides evidence of (a) under what conditions do
citizens decide to monitor government activity and (b) under what conditions governments facilitate
citizen engagement and become more accountable. The article ends with the conclusions.
2 The Citizen Visible Audit Program
Colombian constitution and laws require that mining royalties be transferred to sub-national governments
and allocated to public works in areas such as education, health, nutrition, and water. In order to
prevent corrupt practices in the use of royalties, the Colombian Anti-corruption Presidential Commission
launched in 2008 the Citizen Visible Audits (CVA) program to promote transparency of royalty funds
and citizen participation in the management of public investments. To date, the CVA program has been
implemented in over 400 communities around Colombia. Furthermore, since 2012, the CVA program is
a central piece of Colombian Government agreement with the Open Government Partnership.
The selection process of speci�c projects to be audited by the community is based on the amount of
royalties received, the number of previous irregularities in the management of royalties, and the expected
social impact of the project. The type of projects that received the CVA program are infrastructure
7
projects to help the provision of local public goods (i.e. access to water and sanitation, education,
energy, and housing) for a relatively small group of people who live in the nearby community. Almost
40% of the projects were related to access to water and sanitation. Another 35% was devoted to build
educational infrastructure and housing. The typical project that underwent a CVA lasted on average
335 days, had 2 community forums and 50 citizens participated of each forum. Additionally, the amount
spent on each project was, on average, 6240 million Colombian pesos (around 3.5 million USD), with
more than 80% �nanced by royalties.
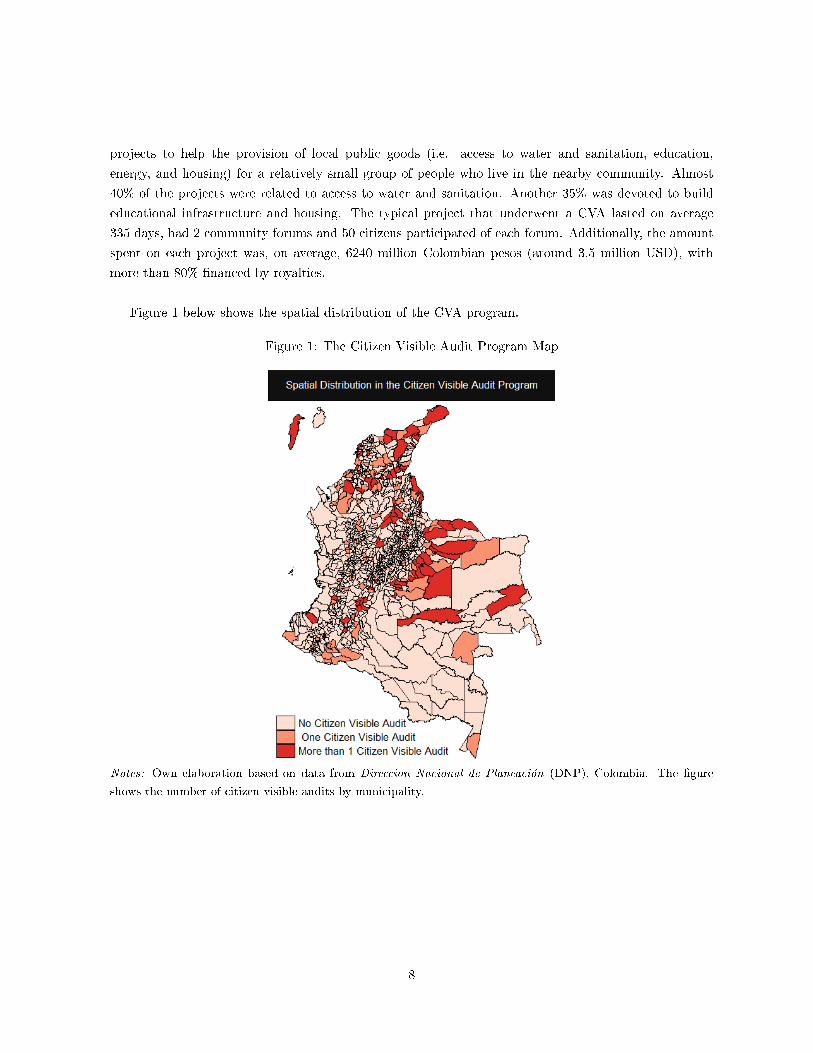
Figure 1 below shows the spatial distribution of the CVA program.
Figure 1: The Citizen Visible Audit Program Map
Notes: Own elaboration based on data from Direccion Nacional de Planeación (DNP), Colombia. The �gure
shows the number of citizen visible audits by municipality.
8
Once a speci�c project is selected in a given municipality, the CVA program consists of the following
activities:
(a) Disseminating information through radio, newspapers, invitations and local TV about the CVA
program in the neighborhoods where the project takes place.
(b) During the �rst public forum the infrastructure project is introduced to the community. Citizens
are told about their rights and entitlements, including the activities they can do to monitor the
project and the responsibilities of the executing �rm. A group of bene�ciaries composed of interested
citizens is constituted and trained to carry out community monitoring activities.
(c) Periodical public forums are held, bringing together local authorities, neighbors, and representatives
from the �rm that carry out the speci�c project. In these public forums, the state of the
project is explained in detail to the community, which in turn might voice its suggestions and
recommendations. Commitments are made by the �rm, the local government, and project supervisor
to solve the problems that may arise during the construction of the project. These commitments are
monitored by the community, the facilitators from the central government (DNP) and the project
supervisor. If a commitment is not honored, facilitators and supervisors intervene to let the local
government know about this. If the problem persists, administrative complaints are submitted to
the Supreme Audit Body in the central administration.
(d) In between public forums, the bene�ciary group monitors the project and collects information on
whether commitments are being honored and any other new problem that may arise.
(e) Before making the �nal payment to the executing �rm, the �nalized project is presented to the
community. The audit results are shared with all interested and concerned stake-holders.
3 Theoretical Framework
Figure 4 presents a stylized pathway of change of the CVA program, clarifying the mechanisms through
which the CVA program is expected to have an impact on project performance.3
The CVA program begins by attempting to make the project that it aims to monitoring and the
monitoring program widely known. A communication campaign (building block 1) through radio,
newspapers, and local TV is launched to increase participation in the �rst public forum. This �rst
contact with the community allows facilitators to give citizens information on the project, such as what
the contract stipulates the �rm has to deliver, how to monitor the executing �rm, and to whom they
should direct enquiries about de�ciencies in the project. This is referred in Figure 4 as capacity building
(building block 2). Empowered with this new information, citizens are expected to solve the collective
action problem and invest their time and e�ort to participate in monitoring the project (building block 3).
Participation in monitoring activities could take many forms. As an organized group, citizens can take
3See Molina (2013a) for a generalized version of the pathway of change for community monitoring interventions.
9
turns to visit the construction site and collect information on its problems. They can also use their voice
to contact the project supervisor, the representatives of the �rm (building block 6) or elected o�cials
(building block 4) to make complains about the project and provide valuable information on the speci�c
problems the project is facing. Citizens can even condition their votes on project performance or could
threat governments with costly protests. Citizen can also share the information collected on the project
with their fellow neighbors that did not take part in monitoring activities (building block 5) to increase
the visibility of the CVA program. Finally, citizen may also contact or threat to contact opposition
party leaders and the media to provide incentives for elected o�cials, �rms and project supervisors to act.
In addition, in the CVA there are public forums where representatives from the local government,
project supervisors, representatives from the executing �rm, representatives from the central government
and the community are present. This allows citizens to make their voice heard by supervisors as well
as local o�cials and providers. This reduces the otherwise necessary time and e�ort citizens would
need to invest to get an appointment with these o�cials. The public forums also reduce the cost of
supervisors and central government representatives to be heard by local o�cials. It also reduces the cost
of local o�cials to take actions to solve problems that arise during the construction of the infrastructure
projects, such as lack of planing, lack of resources to �nish the project, and acts of corruption. Finally,
the symbolic act of the public forum may signal politicians and the executing �rm the importance of
performing well on this project, as citizens are paying extra attention.
In order for the CVA program to generate a change in politicians' behavior at least one of the following
conditions must be present:
(i) citizens subsidized the work of politicians by monitoring providers and identifying pockets of
corruption and ine�ciency.
(ii) as a result of the CVA program it becomes more valuable for politicians to improve project
performance, as citizens are better able to recognize whether elected o�cials are making an e�ort
to improve project performance.
These conditions provide incentives for politicians and policymakers to put more pressure on providers
to improve project performance and to allocate more resources, if necessary. Even further, politicians
could enact new laws to change the way �rms are selected and projects are executed.
Facing formal sanctions by politicians and/or informal sanctions by citizens, providers are more likely
to exert e�ort (building block 7) to improve project performance. As a result, the CVA program may
improve project performance (building block 8).
10
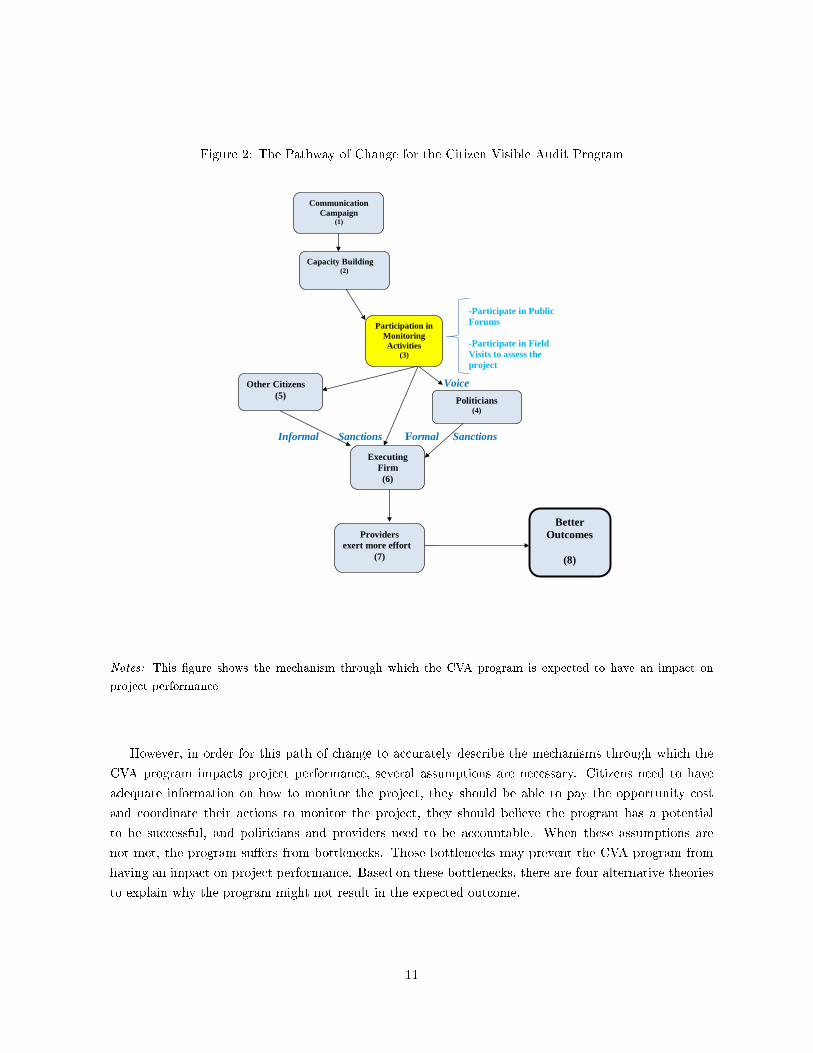
Figure 2: The Pathway of Change for the Citizen Visible Audit Program
Voice
Informal Sanctions Formal Sanctions
Capacity Building (2)
Communication
Campaign (1)
Participation in
Monitoring
Activities (3)
Politicians (4)
Executing
Firm
(6)
Providers
exert more effort
(7)
Better
Outcomes
(8)
-Participate in Public
Forums
-Participate in Field
Visits to assess the
project
Other Citizens
(5)
Notes: This �gure shows the mechanism through which the CVA program is expected to have an impact on
project performance
However, in order for this path of change to accurately describe the mechanisms through which the
CVA program impacts project performance, several assumptions are necessary. Citizens need to have
adequate information on how to monitor the project, they should be able to pay the opportunity cost
and coordinate their actions to monitor the project, they should believe the program has a potential
to be successful, and politicians and providers need to be accountable. When these assumptions are
not met, the program su�ers from bottlenecks. Those bottlenecks may prevent the CVA program from
having an impact on project performance. Based on these bottlenecks, there are four alternative theories
to explain why the program might not result in the expected outcome.
11
The �rst two theories, de�cient implementation theory and civic participation failure, refer to
bottlenecks that prevent citizens from actively engage in monitoring the project. The third one,
non-accountable governments, is independent of whether civic participation in monitoring the project
takes place. It refers to a lack of response on the part of the politicians and providers. The last one is
the self-ful�lling prophecy theory, which takes into account both sides of the CVA's pathway of change:
citizens' decision to participate in monitoring the project and government willingness to facilitate that
engagement and become accountable. Below I present each theory, its empirical implications and the
measurement strategy.
(a) De�cient Implementation Theory : Scholars and policymakers have long argued that programs
often fell short of their expectations because of implementation failures (for a recent review
see Pritchett, Woolcock and Andrews, 2013). In the case of the CVA program there are
two potential de�ciencies: (a.1) the information on the project may have not been properly
disseminated (building block 1), and/or (a.2) information on how to monitor the project was
either not provided or not understood by the citizens (building block 2). This is relevant as if
citizens do not know the project exists (a.1), it will be impossible for them to monitor it. If
citizens do not know how to monitor the project (a.2), they may lose interest in participation
in monitoring activities. And even if citizens decide to participate their e�ectiveness will be limited.
The empirical implications for the case of the CVA program are two:
(a.1) If the information on the project is not properly disseminated, citizens will not participate in
monitoring activities.
(a.2) Citizens probability of participation in monitoring activities will be a function of the quality
of the information they have.
I test (a.1) by focusing on the percentage of citizens in each community that knows about the
project existence and test (a.2) by measuring the percentage of citizens in each community that
evaluates the quality of information received on the project as adequate or very adequate.
(b) Civic Participation Failure Theory : One potential concern with the CVA program, and social
accountability mechanisms in general, is citizens' failure to participate in monitoring the project.
I group under this heading many bottlenecks that prevent citizens to participate in monitoring
activities, which in turn reduces the potential impact of the program. In particular, if community
monitoring activities are not carried out at all or carried out by a few citizens their ability to
uncover problems and pressure the government for accountability is signi�cantly reduced. I identify
four potential bottlenecks: (b.1) citizens may not believe the infrastructure project is a priority
for the community, and/or (b.2) even if the project is a priority for the community, opportunity
costs may prevent citizens from participation. In particular, this will be the case if citizens believe
12
the CVA program is a tax on their time that undermines their ability to spend time in other
equally or more important perceived activities such as working, relaxing and spending time with
their family, and/or (b.3) if citizens were already monitoring the project in the absence of the CVA
program, formal participation in the CVA program becomes irrelevant, and/or (b.4) Scholars have
emphasized the collective action problems that can arise in the presence of a non-excludable local
public good (Olson, 1971), such as monitoring a project which would bene�t the community. In
other words, if community members believe other fellow citizens will monitor the project, they may
decide not to participate 4. The literature has found that collective action problems of the kind
described above can be ameliorated when citizens expect others to reciprocate cooperative behavior
(Putnam, 1993; Svendsen and Svendsen, 2009). As a result, proxies for citizens' expectation of
reciprocating cooperative behavior, often denoted as social capital, are used to study collective
action problems. The empirical implication of these bottlenecks are:
(b.1) If citizens perceive the objective of the project as irrelevant for the community they will not
participate in community monitoring activities.
(b.2) If opportunity cost of time is high, participants in community monitoring activities will have
a higher probability of being inactive individuals, unemployed, or having lower income.
(b.3) If the kind of actions citizens are encouraged to take as a result of participation in the CVA
program are not di�erent from what they are already doing, they will not participate in
community monitoring activities.
(b.4) If citizens expect other citizens would free-ride on their e�orts to monitor the project, the
probability and intensity of participation will be lower.
To test (b.1) I estimate the percentage of citizens that believe the project was a priority for the
community. Regarding (b.2), I test whether CVA participants are statistically di�erent from non
participants in the following characteristics: employment status, whether they work at home or not,
and income level. In the case of (b.3), I estimate the di�erence in participation rates and time spent
in community monitoring activities for both groups, i.e. citizens in the control group and citizens in
the treated group who participated in at least one community forum of the CVA program. To test
(b.4) I use several measures. Since there is no ideal proxy for citizens' expectations of reciprocating
cooperative behavior, following the literature I use trust in fellow neighbors as a proxy for social
capital. Additionally, I use fractionaliation indexes (Alesina and Wacziarg, 2003) as predictors of
lack of social capital. In particular, I measure ethnicity, religion, and language fractionaliation by
community and test whether these measures can contribute to explain the variation in time spent in
monitoring activities in each community. Finally, I use ethnic outsider, a measure suggested in the
literature by Lieberman, Posner and Tsai (2013). This is a dummy variable equal to 1 if respondent's
ethnicity is di�erent from the ethnicity of the majority of respondents in that community, and 0
otherwise.
4For an in-depth analysis of coordination problems as well as potential solutions in the context of civic participation see
(Bardhan and Mookherjee, 2006; Mansuri and Rao, 2012).
13
(c) Non-Accountable Governments Theory : The literature has found many reasons why
politicians and, in turn, their agents, the providers, may not be accountable to their principals.
Citizens may not be pivotal for politician's electoral strategy (Downs, 1957; Hotelling, 1929;
Persson and Tabellini, 2002) or the political system does not work properly and institutions
do not help translate the preference of the people into policy (Acemoglu and Robinson, 2008;
Adsera, Boix and Payne, 2003). Another potential problem could be that politicians and providers
might change their behavior as a result of the intervention, but not in the desired way.5 The
empirical implication is that if governments are not accountable to their citizens, I should �nd that
politicians and providers performance does not increase as a result of the CVA program. I test the
non-accountability theory by estimating the impact of the CVA program on citizens' evaluations
of politicians and providers performance on the project.
(d) Self-Ful�lling Prophecy Theory : In Molina (2013b), I argue that there is a channel, often
forgotten in the literature, through which the e�ect of a community monitor intervention could be
diminished. If community members believe that after paying the opportunity cost of monitoring,
coordinating their actions with fellow neighbors and identifying projects' problems politicians and
providers will not be responsive, citizens may not have an incentive to monitor the project in the
�rst place. In order words, citizens may refuse to take advantage of the opportunity to in�uence
government and providers if they believe the chances of success are low. In particular, I argue that
under certain circumstances a case of self-ful�lling prophecy can occur.
The timing of the theory is the following:
(Part I) In the beginning, citizens low expectations on leaders, o�cials, or service providers'
accountability may generate low community participation in monitoring the project. As a
result, project visibility is reduced, since there are fewer citizens disseminating the information
from the project to other fellow citizens.
(Part II) Then, politicians observe community monitoring participation and project visibility. If
participation in monitoring activities and project visibility are low, politicians have fewer
incentives to spend time and e�ort improving project performance.
Note that this theory is the only one that engages with both sides of the pathway of change, the
conditions under which citizens decide to monitor the project and the conditions under which
5 Gavazza and Lizzeri (2007) as well as Prat (2005) provide several examples that might be understood from this
perspective. For example, they point to transparency policies aimed at disclosing how much time it takes for government
agencies to carry out the simplest procedure, such as providing a driver's license. The problem about this information
campaign that encourages individuals to use the most e�cient agency is that it can generate excess demand without
providing a commensurate change in the public employee compensation system. Anticipating this, the sta� of these agencies
might reduce their e�ciency once the policy is put in place. Generally speaking, therefore, in those markets where there
are price rigidities (in this case, public sector salaries), transparency policy can be counterproductive.
14
politicians react by exerting more e�ort and improving performance.
The empirical implications are:
(d.1) Citizens who perceived themselves as in�uential have higher probability of participating in the
CVA public forums and community monitoring activities.
(d.2) Citizens who participated in the CVA public forums disseminate the information of the CVA
to other non-participating citizens.
(d.3) In projects with more participation in community monitoring activities and higher visibility
politicians' performance is higher.
To test the empirical validity of these claims I follow the structure of the theory. For part I, I
estimate a model at the individual level of the e�ect of citizens' perception of their in�uence on
time devoted to monitoring the project and participation in the public forums of the CVA program.
Then, I test whether citizens that participate in the CVA public forums disseminate the information
to other fellow citizens that did not participate in the public forums. To test part II, I estimate a
model of percentage of citizens that know about the project and time spent monitoring the project
at the community level on politicians's and project performance.
4 Identi�cation Strategy
In order to assess the impact of the CVA project on citizens' satisfaction performance and explore
its determinants, this article carries out a retrospective evaluation and uses indicators derived from
a household survey instrument. For each project with the CVA program I look for similar projects
without the program. In particular, I look for projects within the same sector (education, health,
water and sanitation), with similar spatial concentration of its population, similar initial estimated
timeline of the project and similar resources. Additionally I selected projects that were carried out in
a non-contiguous community from the same municipality to guarantee same administrative procedures
and same responsible local government.
Using this methodology, I �nd matches for 10 CVA projects out of the universe of 400 CVA projects.
I expand the search for similar projects in similar municipalities to add 3 additional pairs to the �nal
sample. I create a propensity score of municipalities using the following pretreatment variables: royalties
(measured in US dollars), irregularity in the management of royalties, population size, percentage of
citizens with access to water and sanitation, and primary and secondary enrollment. Table 12 and 13 in
the annex describe each project that was surveyed and its sector, object, municipality, amount of funds
and estimated time frame at the beginning of the project.
To understand the e�ect of the CVA program and its mechanisms two di�erent random samples
were collected: (a) a sample of individuals from treated and control projects that may or may not have
15
participated in community monitoring activities and (b) a sample of participants in the public forums.
For (a) I use a household survey of 28 infrastructure projects, 13 of which were �treated� with the
CVA program and 15 were �control projects�. Each project was located it in the cartographical map
and sampled randomly from the surrounding areas. The random sample contains 30 households for all
13 projects in the treatment group and 11 in the control group. For the two CVA projects that have
two controls each, each sample contains 20 households. The total sample is 390 treated and 410 control
households.
For (b), the contact information collected for each community forum for each CVA project is used. I
use a random sample of 10 participants in each of the 13 treated projects.
To explore whether the matching resulted in a balanced set of respondents in the two treatment
conditions, Table 3 shows summary statistics for a wide range of variables that capture the social and
economic characteristics of the respondents. I investigate whether the populations from treatment and
control groups are statistically di�erent in terms of observable characteristics that may a�ect their
answers to the survey.
I present the results in Table 36. While respondents from treatment and control communities are not
statistically di�erent in most characteristics, two di�erences are statistically signi�cant. The population
interviewed on the treatment group is, on average, older that the population interviewed in the control
group. Also, the population in the treatment group has a lower percentage of individuals pursuing a
post-secondary education. I use this information to control for those characteristics as well as other
variables in the estimations of the impact of the program.
6 Asset Index is a variable created using principal components. I use a list of 12 assets: television, refrigerator, landline
telephone, cellular phone, automobile, washing machine, microwave oven, motorcycle, indoor plumbing, indoor bathroom,
computer, and �at panel TV. The principal component yields a asset index that assigns a larger weight to assets that vary
the most across households. Political News (Daily) is a binary variable equal to 1 when respondents' answer daily to the
question: `How often do you pay attention to the news, whether on TV, the radio, newspapers or the internet?'. Political
Knowledge (Departments) is a binary variable equal to 1 when respondents' provide a correct answer to the question: `How
many departments does the country have?'. Political Knowledge (Presidential Period) is a binary variable equal to 1 when
respondents' provide a correct answer to the question: How long is the presidential term of o�ce in Colombia?.
16
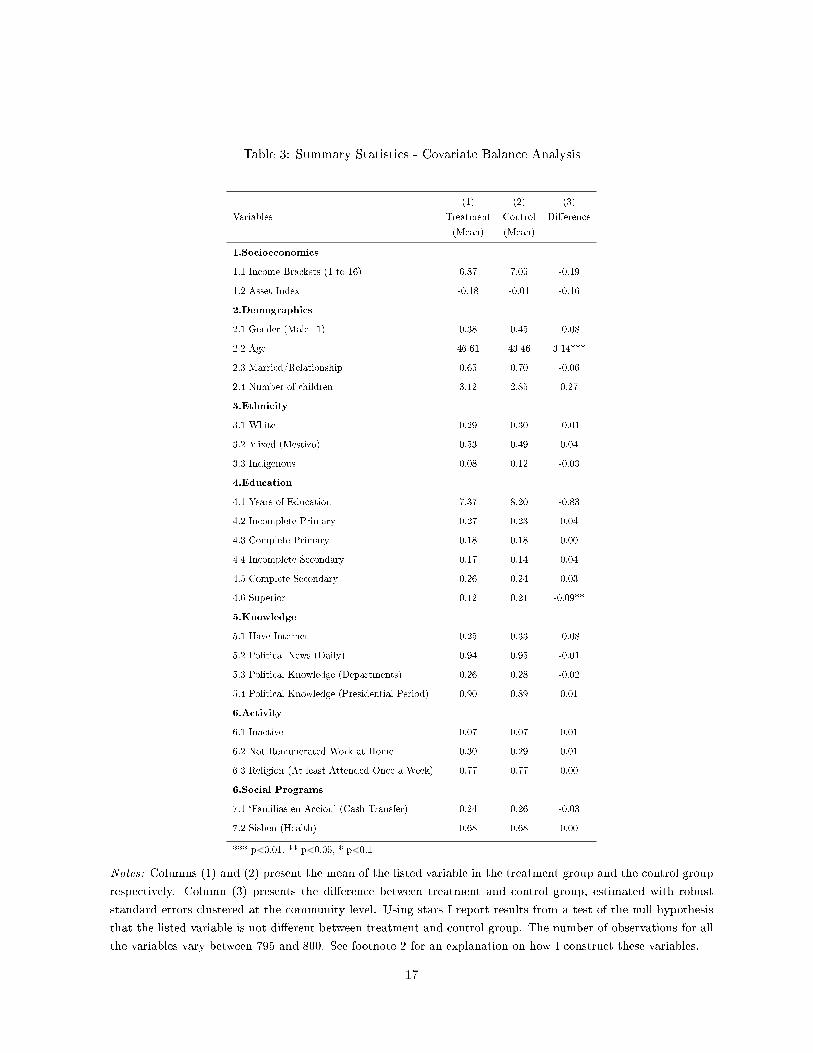
Table 3: Summary Statistics - Covariate Balance Analysis
(1) (2) (3)
Variables Treatment Control Di�erence
(Mean) (Mean)
1.Socioeconomics
1.1 Income Brackets (1 to 16) 6.87 7.05 -0.19
1.2 Asset Index -0.18 -0.01 -0.16
2.Demographics
2.1 Gender (Male=1) 0.38 0.45 -0.08
2.2 Age 46.61 43.46 3.14***
2.3 Married/Relationship 0.65 0.70 -0.06
2.4 Number of children 3.12 2.85 0.27
3.Ethnicity
3.1 White 0.29 0.30 -0.01
3.2 Mixed (Mestizo) 0.53 0.49 0.04
3.3 Indigenous 0.08 0.12 -0.03
4.Education
4.1 Years of Education 7.37 8.20 -0.83
4.2 Incomplete Primary 0.27 0.23 0.04
4.3 Complete Primary 0.18 0.18 0.00
4.4 Incomplete Secondary 0.17 0.14 0.04
4.5 Complete Secondary 0.26 0.24 0.03
4.6 Superior 0.12 0.21 -0.09**
5.Knowledge
5.1 Have Internet 0.25 0.33 -0.08
5.2 Political News (Daily) 0.94 0.95 -0.01
5.3 Political Knowledge (Departments) 0.26 0.28 -0.02
5.4 Political Knowledge (Presidential Period) 0.90 0.89 0.01
6.Activity
6.1 Inactive 0.07 0.07 0.01
6.2 Not Remunerated Work at Home 0.30 0.29 0.01
6.3 Religion (At least Attended Once a Week) 0.77 0.77 0.00
6.Social Programs
7.1 `Familias en Accion' (Cash Transfer) 0.24 0.26 -0.03
7.2 Sisben (Health) 0.68 0.68 0.00
*** p<0.01, ** p<0.05, * p<0.1
Notes: Columns (1) and (2) present the mean of the listed variable in the treatment group and the control group
respectively. Column (3) presents the di�erence between treatment and control group, estimated with robust
standard errors clustered at the community level. Using stars I report results from a test of the null hypothesis
that the listed variable is not di�erent between treatment and control group. The number of observations for all
the variables vary between 795 and 800. See footnote 2 for an explanation on how I construct these variables.
17
5 Empirical Results
This section discusses the main �ndings. The �rst subsection presents the results of the impact of
the CVA program on measures of satisfaction with the project and on subjective measures of the
e�ciency of the execution process. Using the pathway of change developed on section 3, the second
subsection examines the mechanism behind the functioning of the CVA program. In particular, I
examine the empirical validity of the four alternative theories described in the previous section: de�cient
implementation, civic participation failure, non-accountable governments and self-ful�lling prophecy.
Examining these theories allows me to provide an answer to both: (a) under what conditions do citizens
decide to monitor government activity and (b) under what conditions governments facilitate citizen
engagement and become more accountable.
5.1 Citizen Visible Audit Program Impact on Project Performance
To measure the impact of the CVA program on project performance I use a wide variety of measures,
including overall performance, compliance with established time for completion, adequacy in the
administration of resources, adequate inputs, adequate planing and probability of deciding to carry out
the same project again. Table 4 describes in detail the set of variables included in the analysis.
18
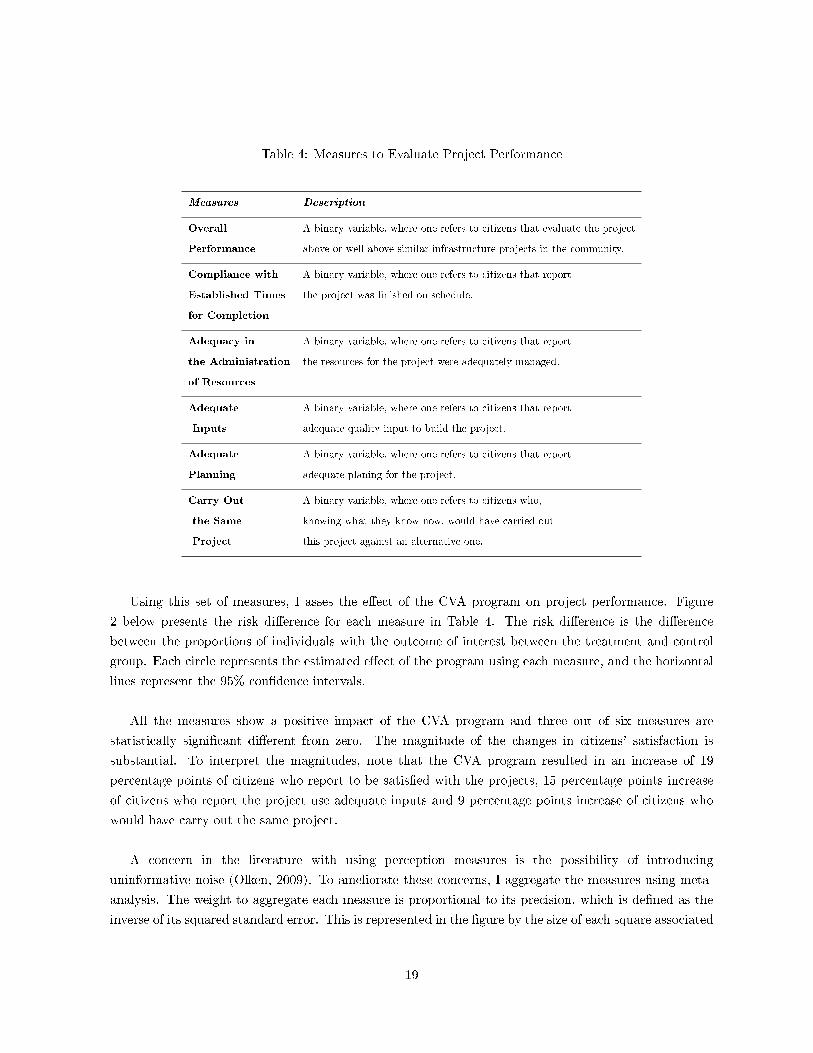
Table 4: Measures to Evaluate Project Performance
Measures Description
Overall A binary variable, where one refers to citizens that evaluate the project
Performance above or well above similar infrastructure projects in the community.
Compliance with A binary variable, where one refers to citizens that report
Established Times the project was �nished on schedule.
for Completion
Adequacy in A binary variable, where one refers to citizens that report
the Administration the resources for the project were adequately managed.
of Resources
Adequate A binary variable, where one refers to citizens that report
Inputs adequate quality input to build the project.
Adequate A binary variable, where one refers to citizens that report
Planning adequate planing for the project.
Carry Out A binary variable, where one refers to citizens who,
the Same knowing what they know now, would have carried out
Project this project against an alternative one.
Using this set of measures, I asses the e�ect of the CVA program on project performance. Figure
2 below presents the risk di�erence for each measure in Table 4. The risk di�erence is the di�erence
between the proportions of individuals with the outcome of interest between the treatment and control
group. Each circle represents the estimated e�ect of the program using each measure, and the horizontal
lines represent the 95% con�dence intervals.
All the measures show a positive impact of the CVA program and three out of six measures are
statistically signi�cant di�erent from zero. The magnitude of the changes in citizens' satisfaction is
substantial. To interpret the magnitudes, note that the CVA program resulted in an increase of 19
percentage points of citizens who report to be satis�ed with the projects, 15 percentage points increase
of citizens who report the project use adequate inputs and 9 percentage points increase of citizens who
would have carry out the same project.
A concern in the literature with using perception measures is the possibility of introducing
uninformative noise (Olken, 2009). To ameliorate these concerns, I aggregate the measures using meta-
analysis. The weight to aggregate each measure is proportional to its precision, which is de�ned as the
inverse of its squared standard error. This is represented in the �gure by the size of each square associated
19
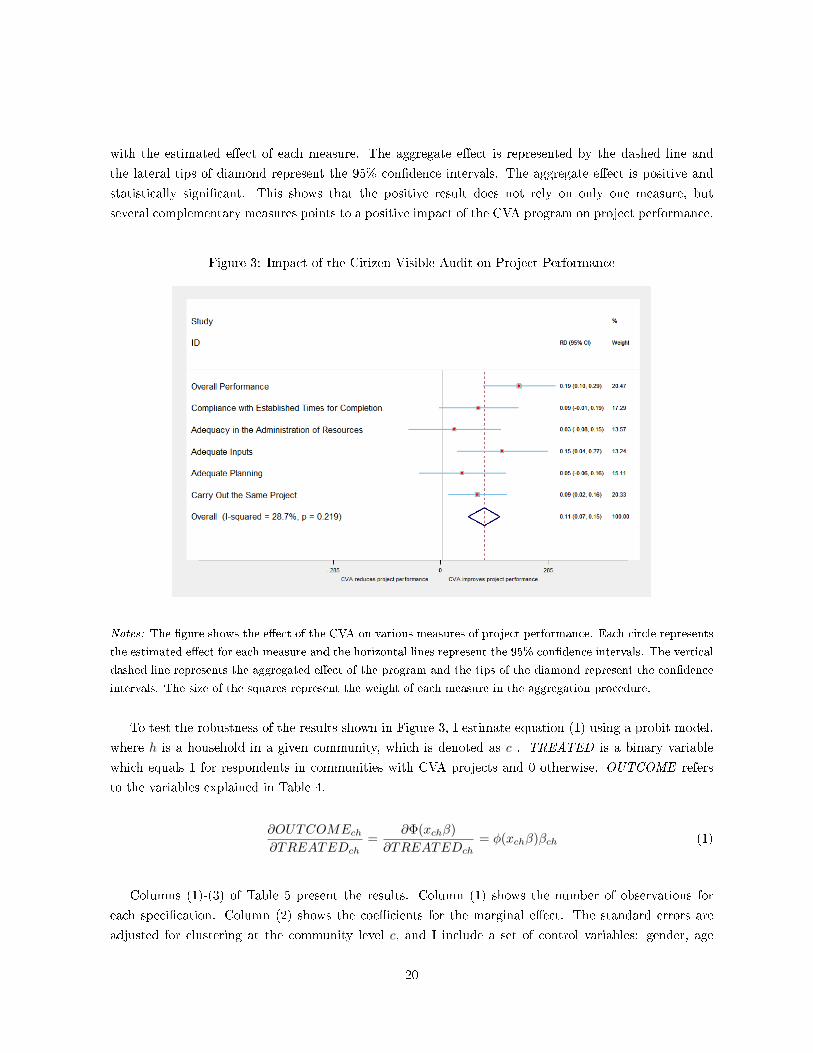
with the estimated e�ect of each measure. The aggregate e�ect is represented by the dashed line and
the lateral tips of diamond represent the 95% con�dence intervals. The aggregate e�ect is positive and
statistically signi�cant. This shows that the positive result does not rely on only one measure, but
several complementary measures points to a positive impact of the CVA program on project performance.
Figure 3: Impact of the Citizen Visible Audit on Project Performance
Notes: The �gure shows the e�ect of the CVA on various measures of project performance. Each circle represents
the estimated e�ect for each measure and the horizontal lines represent the 95% con�dence intervals. The vertical
dashed line represents the aggregated e�ect of the program and the tips of the diamond represent the con�dence
intervals. The size of the squares represent the weight of each measure in the aggregation procedure.
To test the robustness of the results shown in Figure 3, I estimate equation (1) using a probit model,
where h is a household in a given community, which is denoted as c . TREATED is a binary variable
which equals 1 for respondents in communities with CVA projects and 0 otherwise. OUTCOME refers
to the variables explained in Table 4.
∂OUTCOMEch∂TREATEDch
=∂Φ(xchβ)
∂TREATEDch= φ(xchβ)βch (1)
Columns (1)-(3) of Table 5 present the results. Column (1) shows the number of observations for
each speci�cation. Column (2) shows the coe�cients for the marginal e�ect. The standard errors are
adjusted for clustering at the community level c, and I include a set of control variables: gender, age
20
group dummies, income, education dummies and ethnicity dummies. Column (3) shows the p-value for
the null hypothesis of no e�ect.
As seen in Table 5, the CVA program resulted in greater community satisfaction across a wide variety
of measures. Among the communities with CVA projects, citizen were more likely to report that project
performance was higher as well as more likely to report more adequate inputs for building the project.
Once I account for all the controls, I �nd that the point estimates are higher and more signi�cant than
in Figure 3. Overall performance for CVA communities increases from 19 to 22.8 percentage points,
adequate inputs from 15 to 20.9 percentage points, and citizens reporting that if they have the power
they would carry out the same project increases from 9 to 10.8 percentage points.
For columns (4) and (5) of Table 5 I use the same variables from Table 4 but on a di�erent scale. Each
variable is used as it was asked on the survey, on a 5-point scale from 1 (best) to 5 (worst). As a result,
negative coe�cients will indicate an improvement in project performance. For ease of interpretation, I
estimate the regression in equation (2) using ordinary least squares (OLS).
OUTCOMEch = α+ βTREATEDc +X ′chγ + εch (2)
Again, I cluster standard errors by community to take into account that there are multiple respondents
h in each community c. The vector X represents a set of respondent control variables: gender, age
group dummies, income, education dummies and ethnicity dummies. Regression results con�rm the
patterns shown in Figure 3 and in columns (2) and (3) of Table 5. Overall, the point estimates are
now generally negative and statistically signi�cant. Estimation using ordered probit and logit models
produces qualitatively similar results.
21
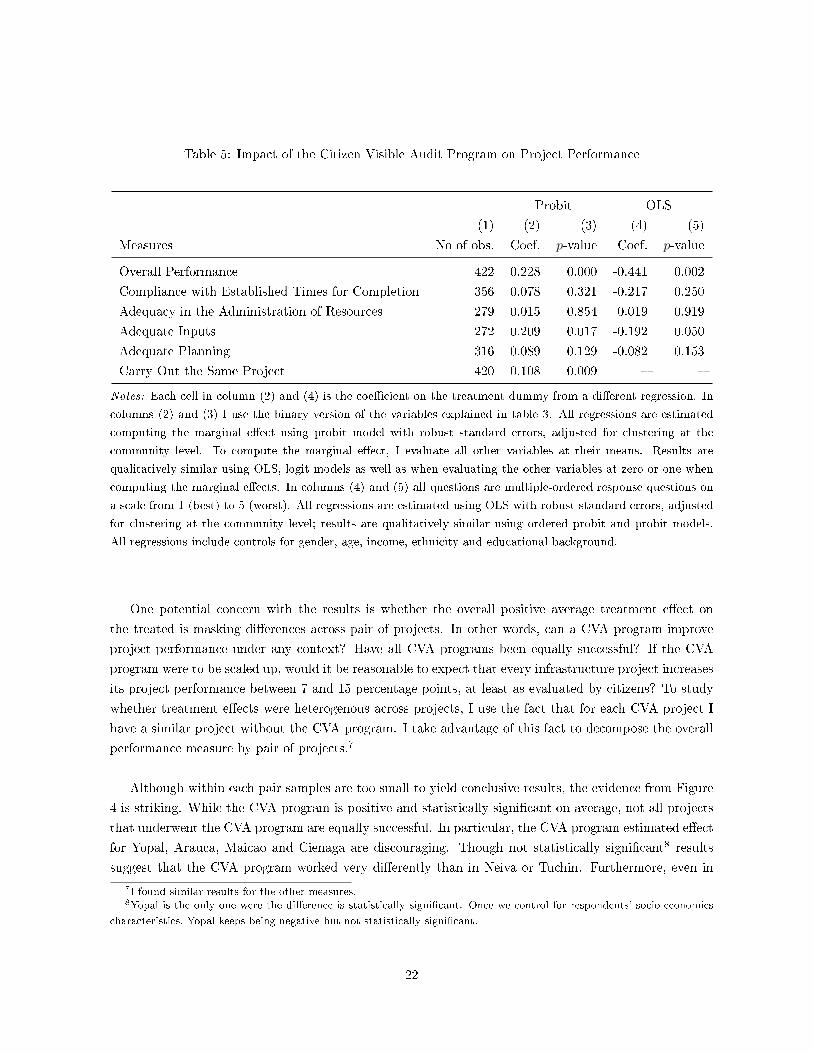
Table 5: Impact of the Citizen Visible Audit Program on Project Performance
Probit OLS
(1) (2) (3) (4) (5)
Measures No of obs. Coef. p-value Coef. p-value
Overall Performance 422 0.228 0.000 -0.441 0.002
Compliance with Established Times for Completion 356 0.078 0.321 -0.217 0.250
Adequacy in the Administration of Resources 279 0.015 0.854 0.019 0.919
Adequate Inputs 272 0.209 0.017 -0.192 0.050
Adequate Planning 316 0.089 0.129 -0.082 0.153
Carry Out the Same Project 420 0.108 0.009 � �
Notes: Each cell in column (2) and (4) is the coe�cient on the treatment dummy from a di�erent regression. In
columns (2) and (3) I use the binary version of the variables explained in table 3. All regressions are estimated
computing the marginal e�ect using probit model with robust standard errors, adjusted for clustering at the
community level. To compute the marginal e�ect, I evaluate all other variables at their means. Results are
qualitatively similar using OLS, logit models as well as when evaluating the other variables at zero or one when
computing the marginal e�ects. In columns (4) and (5) all questions are multiple-ordered response questions on
a scale from 1 (best) to 5 (worst). All regressions are estimated using OLS with robust standard errors, adjusted
for clustering at the community level; results are qualitatively similar using ordered probit and probit models.
All regressions include controls for gender, age, income, ethnicity and educational background.
One potential concern with the results is whether the overall positive average treatment e�ect on
the treated is masking di�erences across pair of projects. In other words, can a CVA program improve
project performance under any context? Have all CVA programs been equally successful? If the CVA
program were to be scaled up, would it be reasonable to expect that every infrastructure project increases
its project performance between 7 and 15 percentage points, at least as evaluated by citizens? To study
whether treatment e�ects were heterogenous across projects, I use the fact that for each CVA project I
have a similar project without the CVA program. I take advantage of this fact to decompose the overall
performance measure by pair of projects.7
Although within each pair samples are too small to yield conclusive results, the evidence from Figure
4 is striking. While the CVA program is positive and statistically signi�cant on average, not all projects
that underwent the CVA program are equally successful. In particular, the CVA program estimated e�ect
for Yopal, Arauca, Maicao and Cienaga are discouraging. Though not statistically signi�cant8 results
suggest that the CVA program worked very di�erently than in Neiva or Tuchin. Furthermore, even in
7I found similar results for the other measures.8Yopal is the only one were the di�erence is statistically signi�cant. Once we control for respondents' socio-economics
characteristics, Yopal keeps being negative but not statistically signi�cant.
22
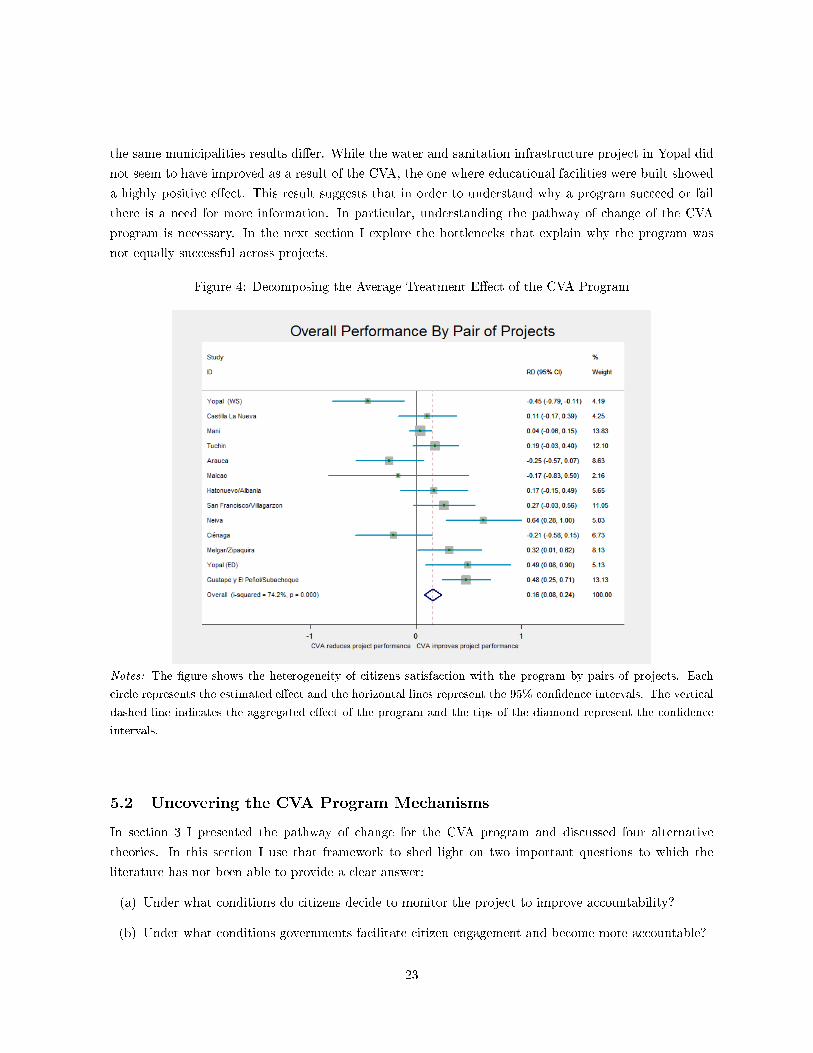
the same municipalities results di�er. While the water and sanitation infrastructure project in Yopal did
not seem to have improved as a result of the CVA, the one where educational facilities were built showed
a highly positive e�ect. This result suggests that in order to understand why a program succeed or fail
there is a need for more information. In particular, understanding the pathway of change of the CVA
program is necessary. In the next section I explore the bottlenecks that explain why the program was
not equally successful across projects.
Figure 4: Decomposing the Average Treatment E�ect of the CVA Program
Notes: The �gure shows the heterogeneity of citizens satisfaction with the program by pairs of projects. Each
circle represents the estimated e�ect and the horizontal lines represent the 95% con�dence intervals. The vertical
dashed line indicates the aggregated e�ect of the program and the tips of the diamond represent the con�dence
intervals.
5.2 Uncovering the CVA Program Mechanisms
In section 3 I presented the pathway of change for the CVA program and discussed four alternative
theories. In this section I use that framework to shed light on two important questions to which the
literature has not been able to provide a clear answer:
(a) Under what conditions do citizens decide to monitor the project to improve accountability?
(b) Under what conditions governments facilitate citizen engagement and become more accountable?
23
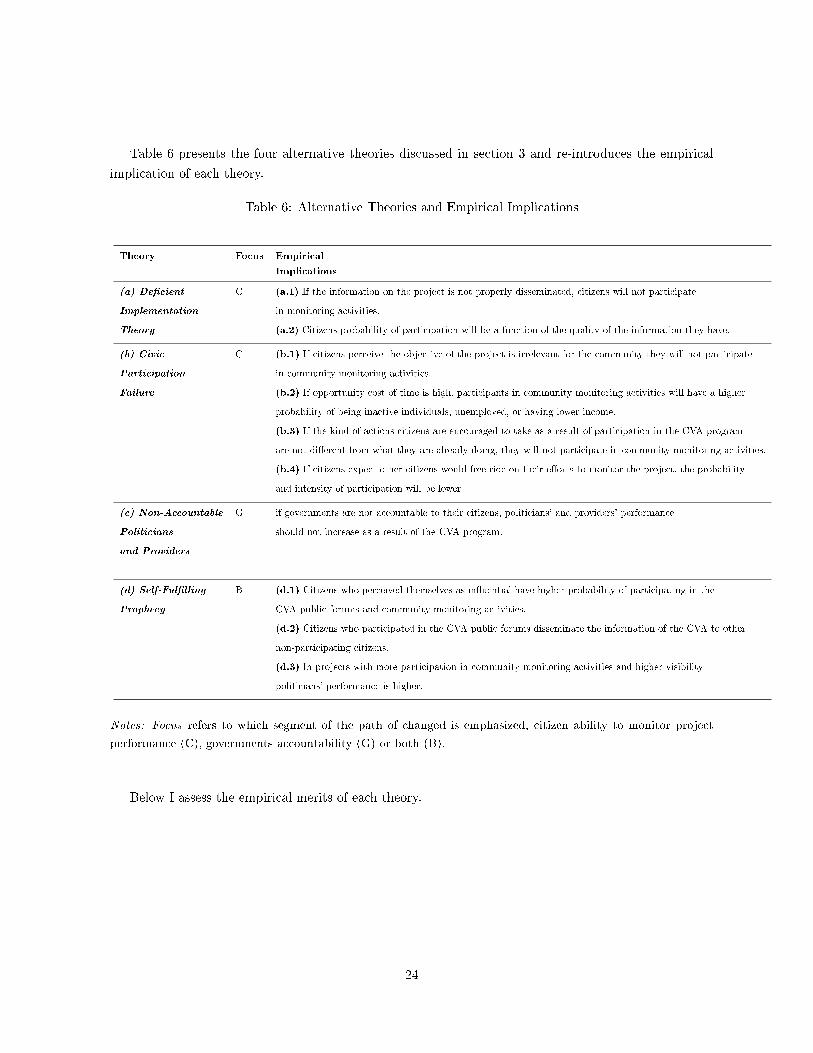
Table 6 presents the four alternative theories discussed in section 3 and re-introduces the empirical
implication of each theory.
Table 6: Alternative Theories and Empirical Implications
Theory Focus Empirical
Implications
(a) De�cient C (a.1) If the information on the project is not properly disseminated, citizens will not participate
Implementation in monitoring activities.
Theory (a.2) Citizens probability of participation will be a function of the quality of the information they have.
(b) Civic C (b.1) If citizens perceive the objective of the project is irrelevant for the community they will not participate
Participation in community monitoring activities.
Failure (b.2) If opportunity cost of time is high, participants in community monitoring activities will have a higher
probability of being inactive individuals, unemployed, or having lower income.
(b.3) If the kind of actions citizens are encouraged to take as a result of participation in the CVA program
are not di�erent from what they are already doing, they will not participate in community monitoring activities.
(b.4) If citizens expect other citizens would free-ride on their e�orts to monitor the project, the probability
and intensity of participation will be lower.
(c) Non-Accountable G if governments are not accountable to their citizens, politicians' and providers' performance
Politicians should not increase as a result of the CVA program.
and Providers
(d) Self-Ful�lling B (d.1) Citizens who perceived themselves as in�uential have higher probability of participating in the
Prophecy CVA public forums and community monitoring activities.
(d.2) Citizens who participated in the CVA public forums disseminate the information of the CVA to other
non-participating citizens.
(d.3) In projects with more participation in community monitoring activities and higher visibility
politicians' performance is higher.
Notes: Focus refers to which segment of the path of changed is emphasized, citizen ability to monitor project
performance (C), governments accountability (G) or both (B).
Below I assess the empirical merits of each theory.
24
5.2.1 De�cient Implementation Theory
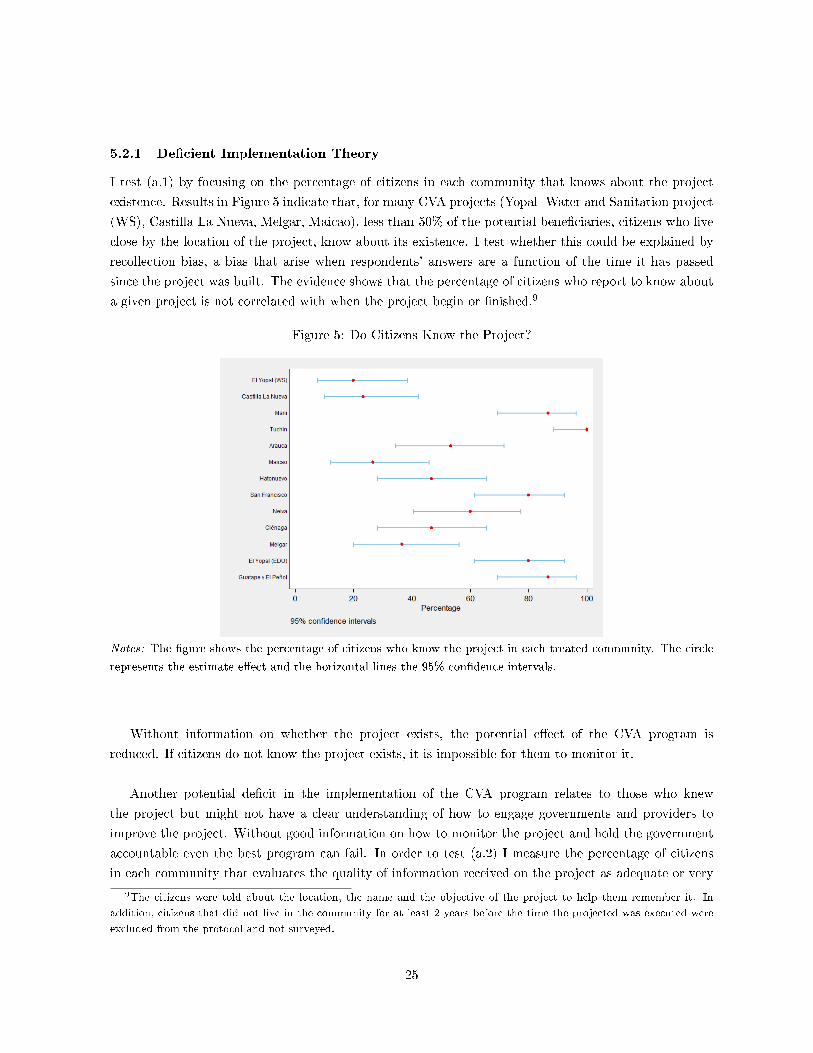
I test (a.1) by focusing on the percentage of citizens in each community that knows about the project
existence. Results in Figure 5 indicate that, for many CVA projects (Yopal- Water and Sanitation project
(WS), Castilla La Nueva, Melgar, Maicao), less than 50% of the potential bene�ciaries, citizens who live
close by the location of the project, know about its existence. I test whether this could be explained by
recollection bias, a bias that arise when respondents' answers are a function of the time it has passed
since the project was built. The evidence shows that the percentage of citizens who report to know about
a given project is not correlated with when the project begin or �nished.9
Figure 5: Do Citizens Know the Project?
Notes: The �gure shows the percentage of citizens who know the project in each treated community. The circle
represents the estimate e�ect and the horizontal lines the 95% con�dence intervals.
Without information on whether the project exists, the potential e�ect of the CVA program is
reduced. If citizens do not know the project exists, it is impossible for them to monitor it.
Another potential de�cit in the implementation of the CVA program relates to those who knew
the project but might not have a clear understanding of how to engage governments and providers to
improve the project. Without good information on how to monitor the project and hold the government
accountable even the best program can fail. In order to test (a.2) I measure the percentage of citizens
in each community that evaluates the quality of information received on the project as adequate or very
9The citizens were told about the location, the name and the objective of the project to help them remember it. In
addition, citizens that did not live in the community for at least 2 years before the time the projected was executed were
excluded from the protocol and not surveyed.
25
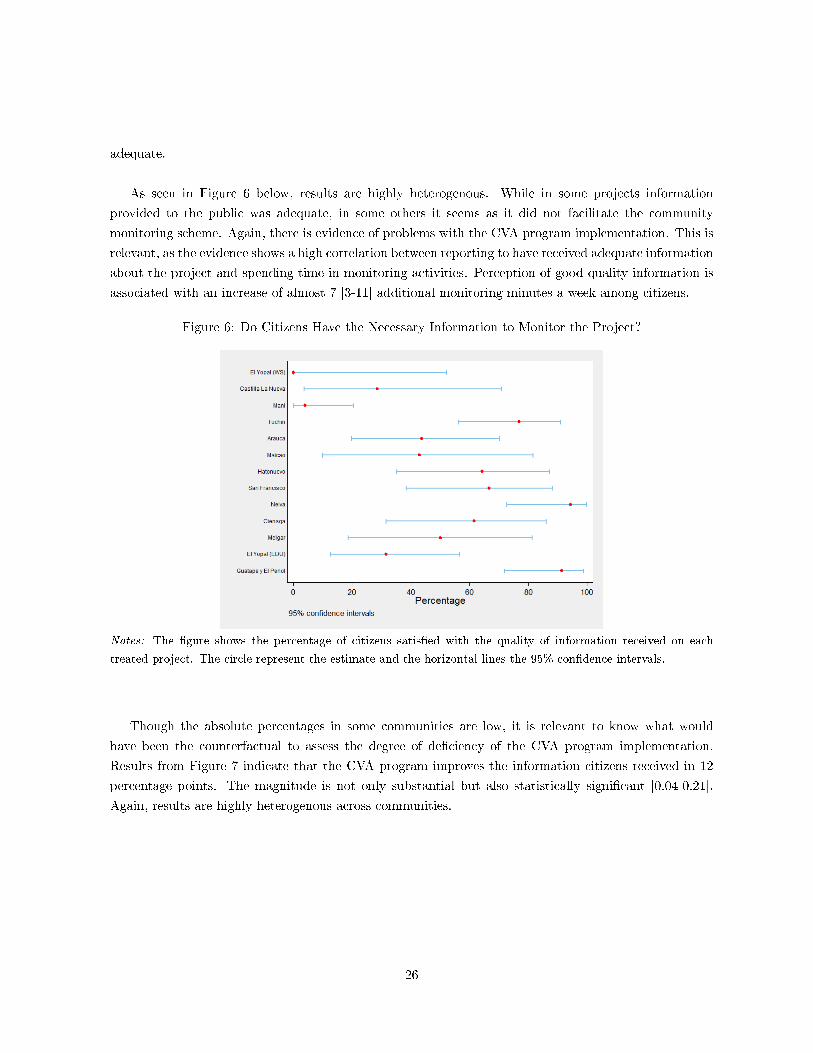
adequate.
As seen in Figure 6 below, results are highly heterogenous. While in some projects information
provided to the public was adequate, in some others it seems as it did not facilitate the community
monitoring scheme. Again, there is evidence of problems with the CVA program implementation. This is
relevant, as the evidence shows a high correlation between reporting to have received adequate information
about the project and spending time in monitoring activities. Perception of good quality information is
associated with an increase of almost 7 [3-11] additional monitoring minutes a week among citizens.
Figure 6: Do Citizens Have the Necessary Information to Monitor the Project?
Notes: The �gure shows the percentage of citizens satis�ed with the quality of information received on each
treated project. The circle represent the estimate and the horizontal lines the 95% con�dence intervals.
Though the absolute percentages in some communities are low, it is relevant to know what would
have been the counterfactual to assess the degree of de�ciency of the CVA program implementation.
Results from Figure 7 indicate that the CVA program improves the information citizens received in 12
percentage points. The magnitude is not only substantial but also statistically signi�cant [0.04-0.21].
Again, results are highly heterogenous across communities.
26
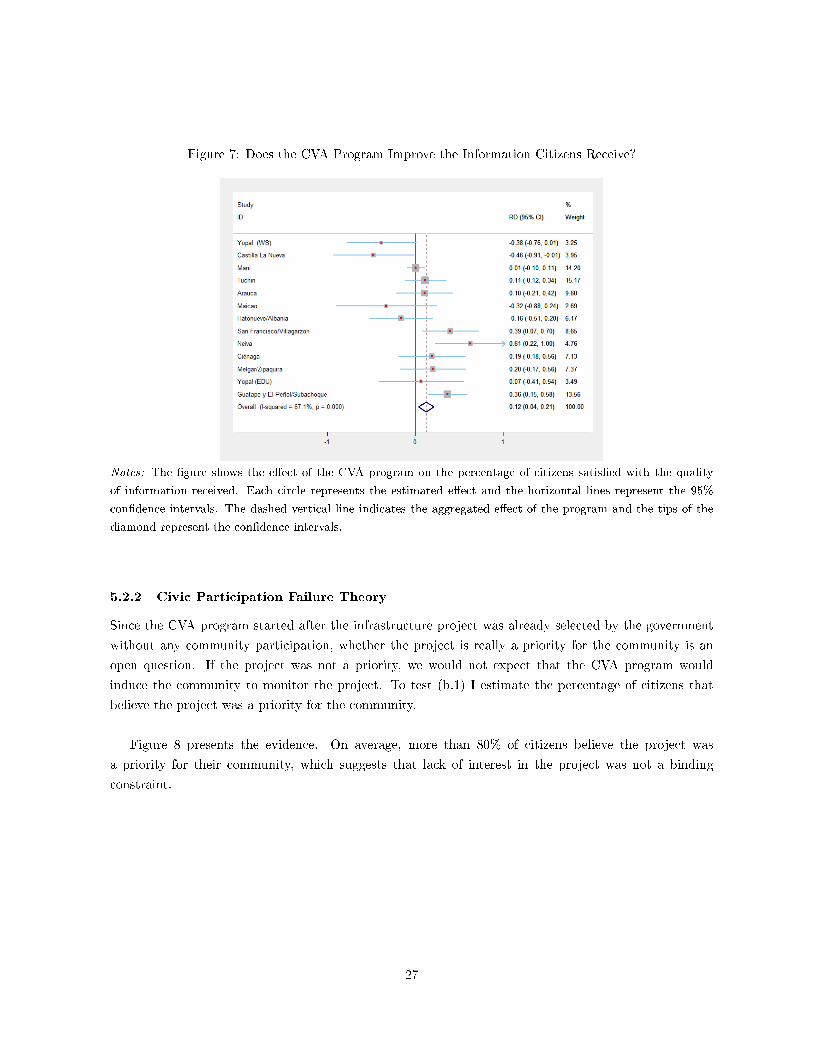
Figure 7: Does the CVA Program Improve the Information Citizens Receive?
Notes: The �gure shows the e�ect of the CVA program on the percentage of citizens satis�ed with the quality
of information received. Each circle represents the estimated e�ect and the horizontal lines represent the 95%
con�dence intervals. The dashed vertical line indicates the aggregated e�ect of the program and the tips of the
diamond represent the con�dence intervals.
5.2.2 Civic Participation Failure Theory
Since the CVA program started after the infrastructure project was already selected by the government
without any community participation, whether the project is really a priority for the community is an
open question. If the project was not a priority, we would not expect that the CVA program would
induce the community to monitor the project. To test (b.1) I estimate the percentage of citizens that
believe the project was a priority for the community.
Figure 8 presents the evidence. On average, more than 80% of citizens believe the project was
a priority for their community, which suggests that lack of interest in the project was not a binding
constraint.
27
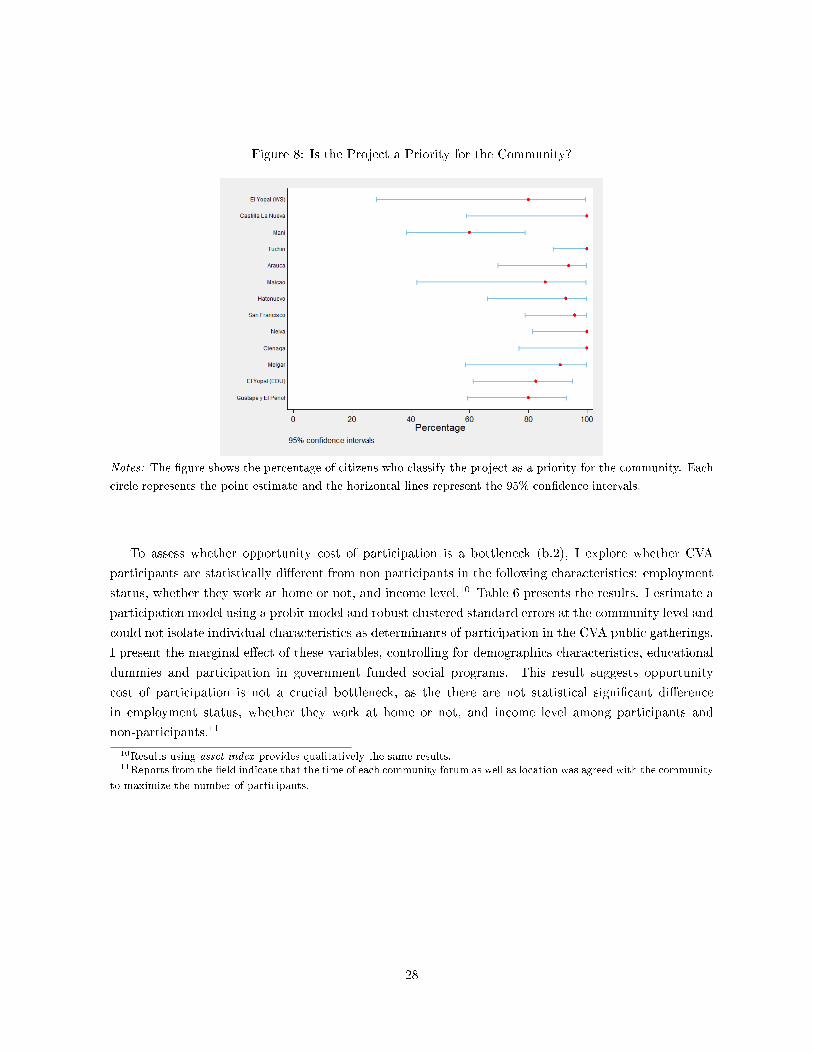
Figure 8: Is the Project a Priority for the Community?
Notes: The �gure shows the percentage of citizens who classify the project as a priority for the community. Each
circle represents the point estimate and the horizontal lines represent the 95% con�dence intervals.
To assess whether opportunity cost of participation is a bottleneck (b.2), I explore whether CVA
participants are statistically di�erent from non participants in the following characteristics: employment
status, whether they work at home or not, and income level.10 Table 6 presents the results. I estimate a
participation model using a probit model and robust clustered standard errors at the community level and
could not isolate individual characteristics as determinants of participation in the CVA public gatherings.
I present the marginal e�ect of these variables, controlling for demographics characteristics, educational
dummies and participation in government funded social programs. This result suggests opportunity
cost of participation is not a crucial bottleneck, as the there are not statistical signi�cant di�erence
in employment status, whether they work at home or not, and income level among participants and
non-participants.11
10Results using asset index provides qualitatively the same results.11Reports from the �eld indicate that the time of each community forum as well as location was agreed with the community
to maximize the number of participants.
28
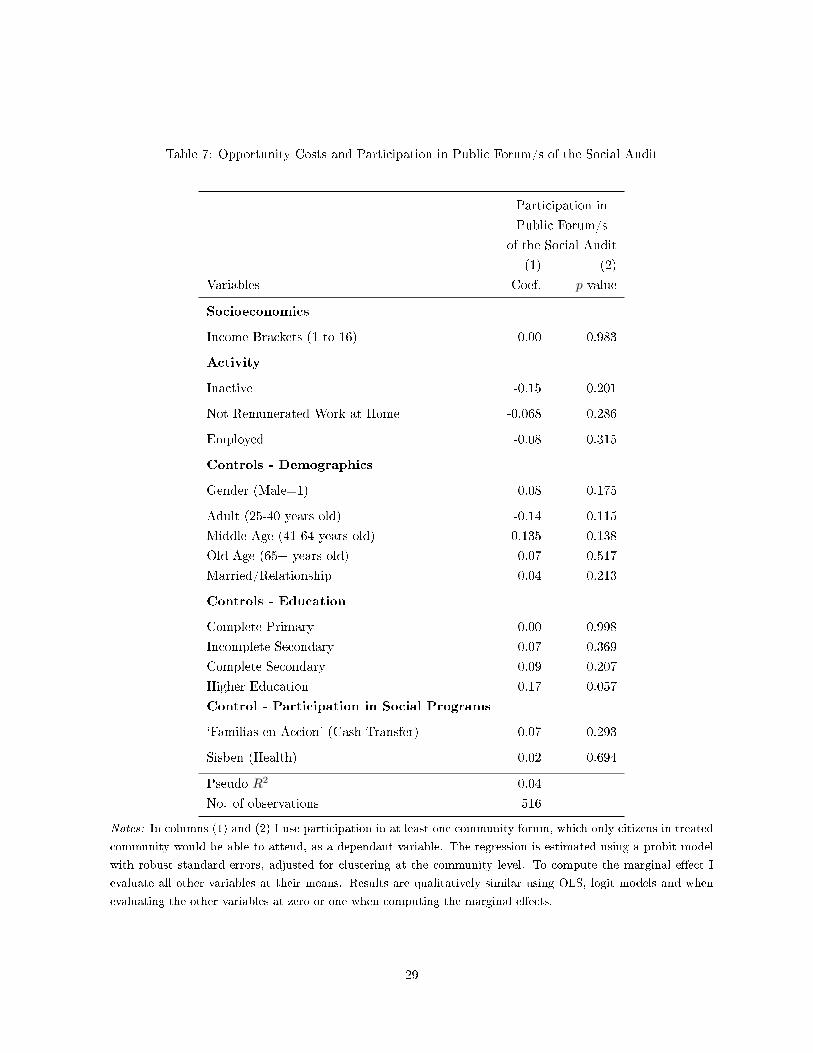
Table 7: Opportunity Costs and Participation in Public Forum/s of the Social Audit
Participation in
Public Forum/s
of the Social Audit
(1) (2)
Variables Coef. p-value
Socioeconomics
Income Brackets (1 to 16) 0.00 0.983
Activity
Inactive -0.15 0.201
Not Remunerated Work at Home -0.068 0.286
Employed -0.08 0.315
Controls - Demographics
Gender (Male=1) 0.08 0.175
Adult (25-40 years old) -0.14 0.115
Middle Age (41-64 years old) -0.135 0.138
Old Age (65+ years old) -0.07 0.517
Married/Relationship 0.04 0.213
Controls - Education
Complete Primary 0.00 0.998
Incomplete Secondary 0.07 0.369
Complete Secondary 0.09 0.207
Higher Education 0.17 0.057
Control - Participation in Social Programs
`Familias en Accion' (Cash Transfer) 0.07 0.293
Sisben (Health) 0.02 0.694
Pseudo R2 0.04
No. of observations 516
Notes: In columns (1) and (2) I use participation in at least one community forum, which only citizens in treated
community would be able to attend, as a dependant variable. The regression is estimated using a probit model
with robust standard errors, adjusted for clustering at the community level. To compute the marginal e�ect I
evaluate all other variables at their means. Results are qualitatively similar using OLS, logit models and when
evaluating the other variables at zero or one when computing the marginal e�ects.
29
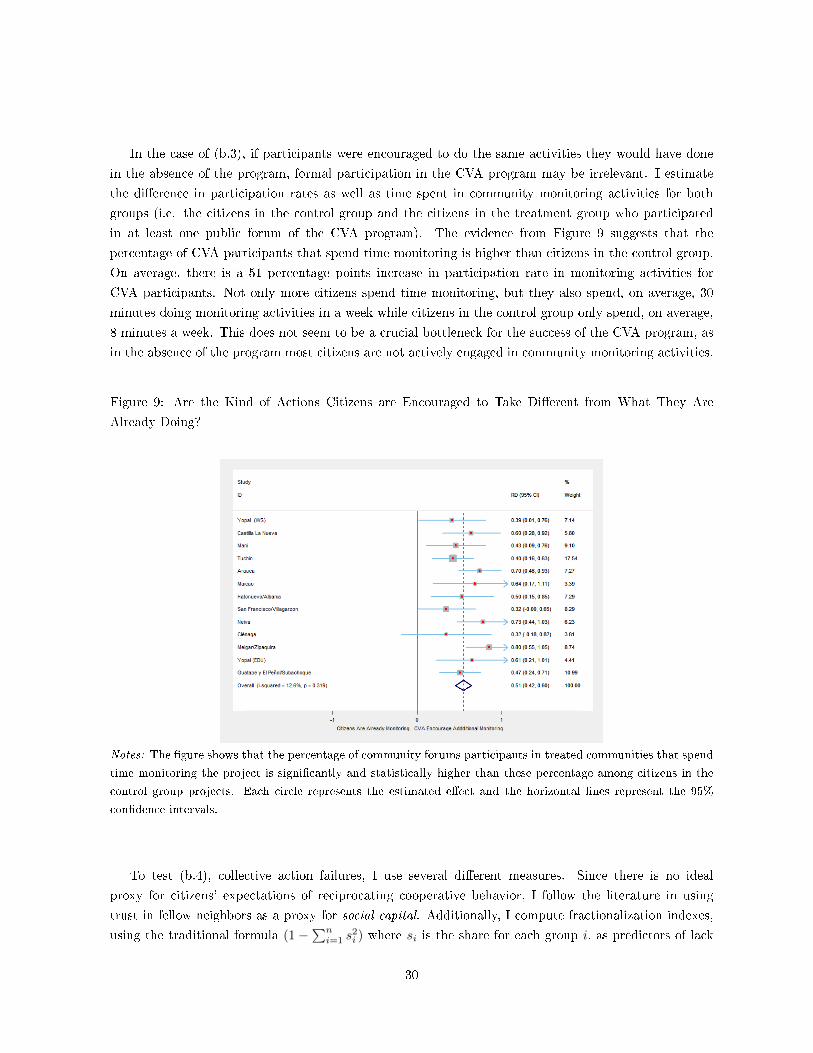
In the case of (b.3), if participants were encouraged to do the same activities they would have done
in the absence of the program, formal participation in the CVA program may be irrelevant. I estimate
the di�erence in participation rates as well as time spent in community monitoring activities for both
groups (i.e. the citizens in the control group and the citizens in the treatment group who participated
in at least one public forum of the CVA program). The evidence from Figure 9 suggests that the
percentage of CVA participants that spend time monitoring is higher than citizens in the control group.
On average, there is a 51 percentage points increase in participation rate in monitoring activities for
CVA participants. Not only more citizens spend time monitoring, but they also spend, on average, 30
minutes doing monitoring activities in a week while citizens in the control group only spend, on average,
8 minutes a week. This does not seem to be a crucial bottleneck for the success of the CVA program, as
in the absence of the program most citizens are not actively engaged in community monitoring activities.
Figure 9: Are the Kind of Actions Citizens are Encouraged to Take Di�erent from What They Are
Already Doing?
Notes: The �gure shows that the percentage of community forums participants in treated communities that spend
time monitoring the project is signi�cantly and statistically higher than these percentage among citizens in the
control group projects. Each circle represents the estimated e�ect and the horizontal lines represent the 95%
con�dence intervals.
To test (b.4), collective action failures, I use several di�erent measures. Since there is no ideal
proxy for citizens' expectations of reciprocating cooperative behavior, I follow the literature in using
trust in fellow neighbors as a proxy for social capital. Additionally, I compute fractionalization indexes,
using the traditional formula (1 −∑ni=1 s
2i ) where si is the share for each group i, as predictors of lack
30
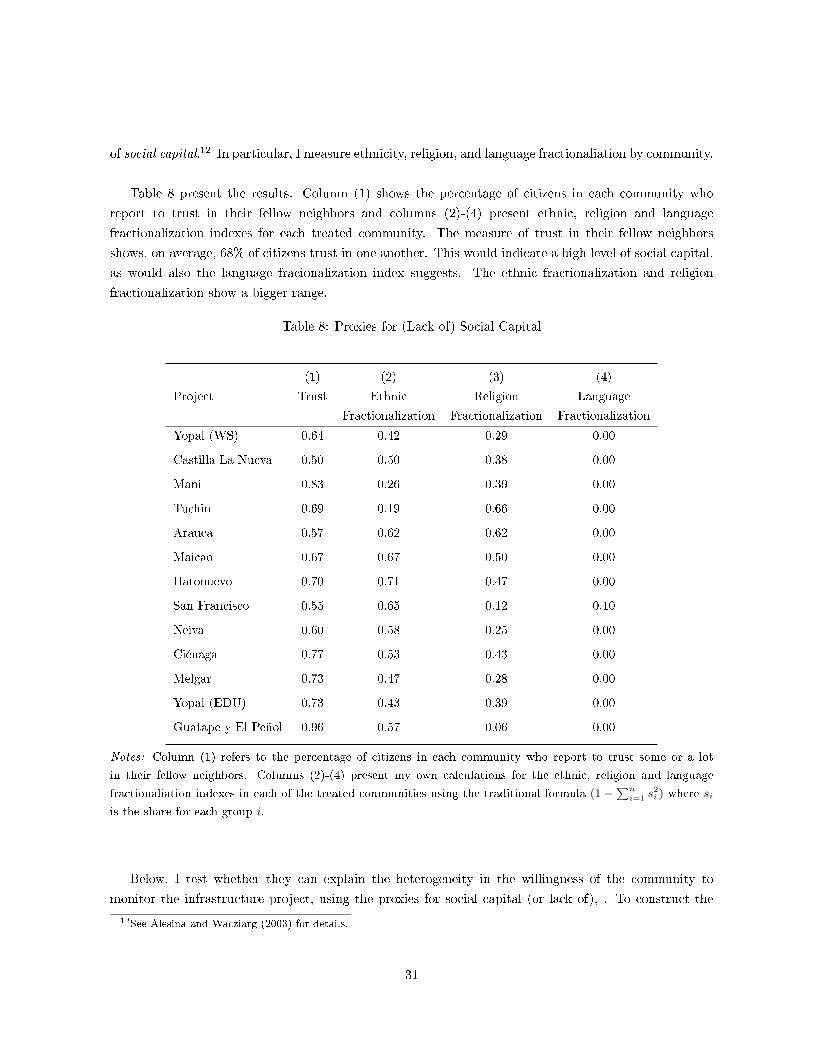
of social capital.12 In particular, I measure ethnicity, religion, and language fractionaliation by community.
Table 8 present the results. Column (1) shows the percentage of citizens in each community who
report to trust in their fellow neighbors and columns (2)-(4) present ethnic, religion and language
fractionalization indexes for each treated community. The measure of trust in their fellow neighbors
shows, on average, 68% of citizens trust in one another. This would indicate a high level of social capital,
as would also the language fracionalization index suggests. The ethnic fractionalization and religion
fractionalization show a bigger range.
Table 8: Proxies for (Lack of) Social Capital
(1) (2) (3) (4)
Project Trust Ethnic Religion Language
Fractionalization Fractionalization Fractionalization
Yopal (WS) 0.64 0.42 0.29 0.00
Castilla La Nueva 0.50 0.50 0.38 0.00
Mani 0.83 0.26 0.39 0.00
Tuchin 0.69 0.19 0.66 0.00
Arauca 0.57 0.62 0.62 0.00
Maicao 0.67 0.67 0.50 0.00
Hatonuevo 0.70 0.71 0.47 0.00
San Francisco 0.55 0.65 0.12 0.10
Neiva 0.60 0.58 0.25 0.00
Ciénaga 0.77 0.53 0.43 0.00
Melgar 0.73 0.47 0.28 0.00
Yopal (EDU) 0.73 0.43 0.39 0.00
Guatape y El Peñol 0.96 0.57 0.06 0.00
Notes: Column (1) refers to the percentage of citizens in each community who report to trust some or a lot
in their fellow neighbors. Columns (2)-(4) present my own calculations for the ethnic, religion and language
fractionaliation indexes in each of the treated communities using the traditional formula (1−∑n
i=1 s2i ) where si
is the share for each group i.
Below, I test whether they can explain the heterogeneity in the willingness of the community to
monitor the infrastructure project, using the proxies for social capital (or lack of), . To construct the
12See Alesina and Wacziarg (2003) for details.
31
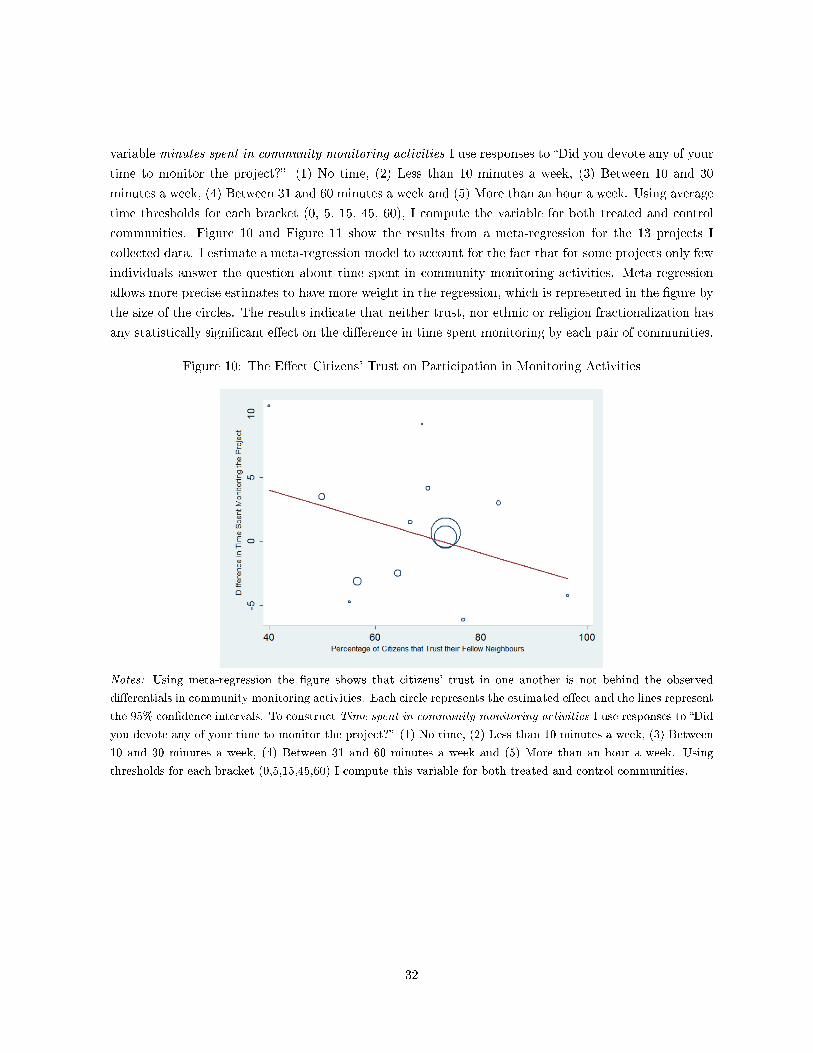
variable minutes spent in community monitoring activities I use responses to �Did you devote any of your
time to monitor the project?� (1) No time, (2) Less than 10 minutes a week, (3) Between 10 and 30
minutes a week, (4) Between 31 and 60 minutes a week and (5) More than an hour a week. Using average
time thresholds for each bracket (0, 5, 15, 45, 60), I compute the variable for both treated and control
communities. Figure 10 and Figure 11 show the results from a meta-regression for the 13 projects I
collected data. I estimate a meta-regression model to account for the fact that for some projects only few
individuals answer the question about time spent in community monitoring activities. Meta-regression
allows more precise estimates to have more weight in the regression, which is represented in the �gure by
the size of the circles. The results indicate that neither trust, nor ethnic or religion fractionalization has
any statistically signi�cant e�ect on the di�erence in time spent monitoring by each pair of communities.
Figure 10: The E�ect Citizens' Trust on Participation in Monitoring Activities
Notes: Using meta-regression the �gure shows that citizens' trust in one another is not behind the observed
di�erentials in community monitoring activities. Each circle represents the estimated e�ect and the lines represent
the 95% con�dence intervals. To construct Time spent in community monitoring activities I use responses to �Did
you devote any of your time to monitor the project?� (1) No time, (2) Less than 10 minutes a week, (3) Between
10 and 30 minutes a week, (4) Between 31 and 60 minutes a week and (5) More than an hour a week. Using
thresholds for each bracket (0,5,15,45,60) I compute this variable for both treated and control communities.
32
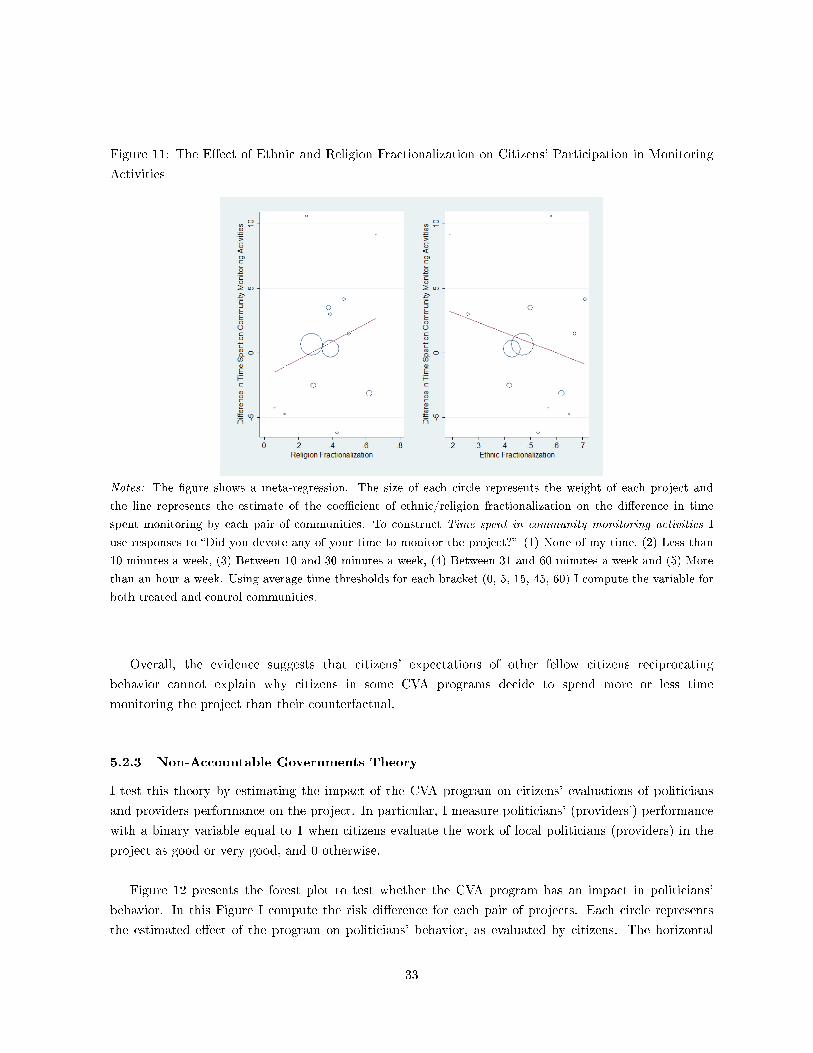
Figure 11: The E�ect of Ethnic and Religion Fractionalization on Citizens' Participation in Monitoring
Activities
Notes: The �gure shows a meta-regression. The size of each circle represents the weight of each project and
the line represents the estimate of the coe�cient of ethnic/religion fractionalization on the di�erence in time
spent monitoring by each pair of communities. To construct Time spent in community monitoring activities I
use responses to �Did you devote any of your time to monitor the project?� (1) None of my time, (2) Less than
10 minutes a week, (3) Between 10 and 30 minutes a week, (4) Between 31 and 60 minutes a week and (5) More
than an hour a week. Using average time thresholds for each bracket (0, 5, 15, 45, 60) I compute the variable for
both treated and control communities.
Overall, the evidence suggests that citizens' expectations of other fellow citizens reciprocating
behavior cannot explain why citizens in some CVA programs decide to spend more or less time
monitoring the project than their counterfactual.
5.2.3 Non-Accountable Governments Theory
I test this theory by estimating the impact of the CVA program on citizens' evaluations of politicians
and providers performance on the project. In particular, I measure politicians' (providers') performance
with a binary variable equal to 1 when citizens evaluate the work of local politicians (providers) in the
project as good or very good, and 0 otherwise.
Figure 12 presents the forest plot to test whether the CVA program has an impact in politicians'
behavior. In this Figure I compute the risk di�erence for each pair of projects. Each circle represents
the estimated e�ect of the program on politicians' behavior, as evaluated by citizens. The horizontal
33
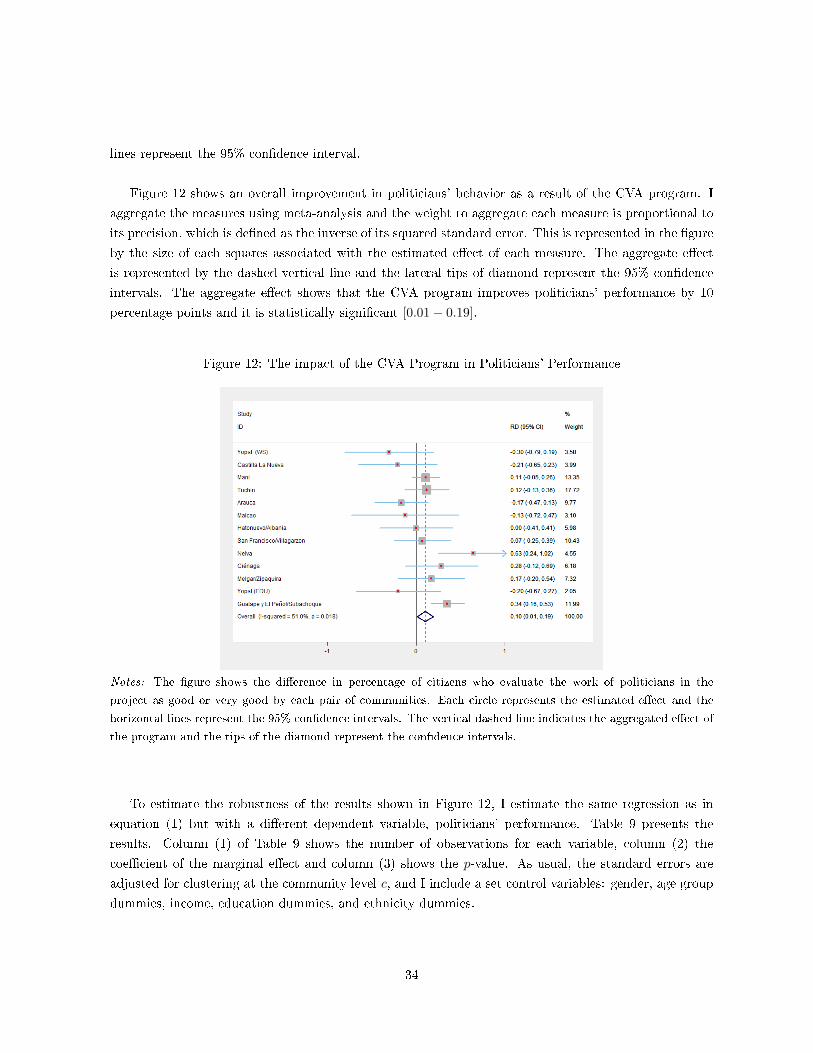
lines represent the 95% con�dence interval.
Figure 12 shows an overall improvement in politicians' behavior as a result of the CVA program. I
aggregate the measures using meta-analysis and the weight to aggregate each measure is proportional to
its precision, which is de�ned as the inverse of its squared standard error. This is represented in the �gure
by the size of each squares associated with the estimated e�ect of each measure. The aggregate e�ect
is represented by the dashed vertical line and the lateral tips of diamond represent the 95% con�dence
intervals. The aggregate e�ect shows that the CVA program improves politicians' performance by 10
percentage points and it is statistically signi�cant [0.01 − 0.19].
Figure 12: The impact of the CVA Program in Politicians' Performance
Notes: The �gure shows the di�erence in percentage of citizens who evaluate the work of politicians in the
project as good or very good by each pair of communities. Each circle represents the estimated e�ect and the
horizontal lines represent the 95% con�dence intervals. The vertical dashed line indicates the aggregated e�ect of
the program and the tips of the diamond represent the con�dence intervals.
To estimate the robustness of the results shown in Figure 12, I estimate the same regression as in
equation (1) but with a di�erent dependent variable, politicians' performance. Table 9 presents the
results. Column (1) of Table 9 shows the number of observations for each variable, column (2) the
coe�cient of the marginal e�ect and column (3) shows the p-value. As usual, the standard errors are
adjusted for clustering at the community level c, and I include a set control variables: gender, age group
dummies, income, education dummies, and ethnicity dummies.
34
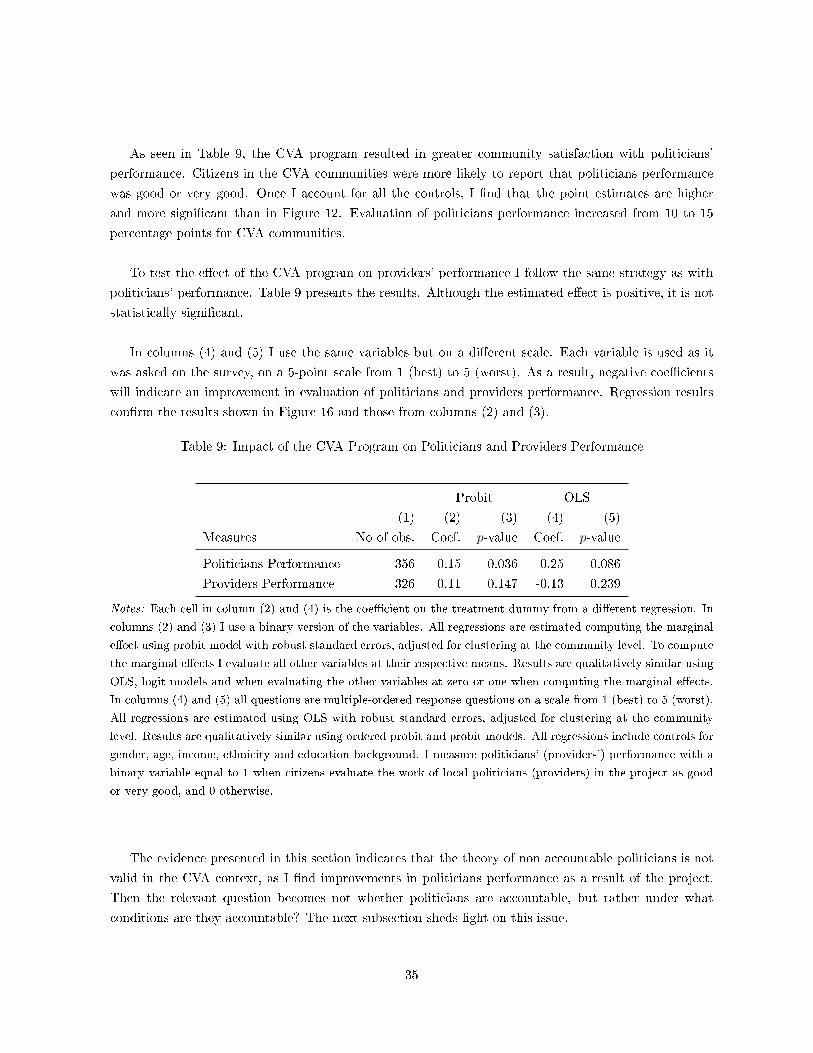
As seen in Table 9, the CVA program resulted in greater community satisfaction with politicians'
performance. Citizens in the CVA communities were more likely to report that politicians performance
was good or very good. Once I account for all the controls, I �nd that the point estimates are higher
and more signi�cant than in Figure 12. Evaluation of politicians performance increased from 10 to 15
percentage points for CVA communities.
To test the e�ect of the CVA program on providers' performance I follow the same strategy as with
politicians' performance. Table 9 presents the results. Although the estimated e�ect is positive, it is not
statistically signi�cant.
In columns (4) and (5) I use the same variables but on a di�erent scale. Each variable is used as it
was asked on the survey, on a 5-point scale from 1 (best) to 5 (worst). As a result, negative coe�cients
will indicate an improvement in evaluation of politicians and providers performance. Regression results
con�rm the results shown in Figure 16 and those from columns (2) and (3).
Table 9: Impact of the CVA Program on Politicians and Providers Performance
Probit OLS
(1) (2) (3) (4) (5)
Measures No of obs. Coef. p-value Coef. p-value
Politicians Performance 356 0.15 0.036 -0.25 0.086
Providers Performance 326 0.11 0.147 -0.13 0.239
Notes: Each cell in column (2) and (4) is the coe�cient on the treatment dummy from a di�erent regression. In
columns (2) and (3) I use a binary version of the variables. All regressions are estimated computing the marginal
e�ect using probit model with robust standard errors, adjusted for clustering at the community level. To compute
the marginal e�ects I evaluate all other variables at their respective means. Results are qualitatively similar using
OLS, logit models and when evaluating the other variables at zero or one when computing the marginal e�ects.
In columns (4) and (5) all questions are multiple-ordered response questions on a scale from 1 (best) to 5 (worst).
All regressions are estimated using OLS with robust standard errors, adjusted for clustering at the community
level. Results are qualitatively similar using ordered probit and probit models. All regressions include controls for
gender, age, income, ethnicity and education background. I measure politicians' (providers') performance with a
binary variable equal to 1 when citizens evaluate the work of local politicians (providers) in the project as good
or very good, and 0 otherwise.
The evidence presented in this section indicates that the theory of non accountable politicians is not
valid in the CVA context, as I �nd improvements in politicians performance as a result of the project.
Then the relevant question becomes not whether politicians are accountable, but rather under what
conditions are they accountable? The next subsection sheds light on this issue.
35
5.2.4 Self-Ful�lling Prophecy Theory
To test its empirical validity I follow the structure of the theory. For part I, I estimate a model at the
individual level of citizens' perception of their in�uence on time devoted to monitoring the project and
participation in the public forums of the CVA program.13 Then, I test whether citizens that participate
in the CVA public forums disseminate the information to other fellow citizens that did not participate
in the public forums. To test part II, I estimate a model of percentage of citizens that know about
the project and time spent monitoring the project at the community level on politicians's and project
performance.
Part I
If citizens think they are not in�uential in government activities, even if they spend time uncovering
pockets of corruption and ine�ciencies, the probability of an improvement in project performance may
be low. As a result, they may decide not to spend their time monitoring the project. In fact, on average,
less than 20% of the citizens in the treated communities believe that they have some or a lot of in�uence
in municipal government activities, which are responsible for managing the infrastructure project.
Figure 13 shows graphically an estimation using the simple linear probability model. I study whether
citizens' perception of their in�uence on local governments is associated with community participation
in monitoring activities. Perception of in�uence in the local government is a binary variable equal to 1
when citizens report to have some or a lot of in�uence on the local government administration and 0
otherwise. Minutes spent in community monitoring activities measure was explained above.
The results from Figure 13 indicate that perception of in�uence is positive and highly correlated with
the time citizens' spent in community monitoring activities.
13As a robustness check I study whether citizens believe they should have an important role as monitors of public o�cials.
If the answer to this question is negative and citizens believe monitoring public o�cials is not their responsibility, then the
theory of self-ful�lling prophecies would not be empirically valid. This is because citizens may decide not to participate in
the CVA process even if they perceived themselves as highly in�uential. Results, which are available upon request, indicate
that more than 75% of citizens do believe they should have an important role as monitors of public o�cials.
36
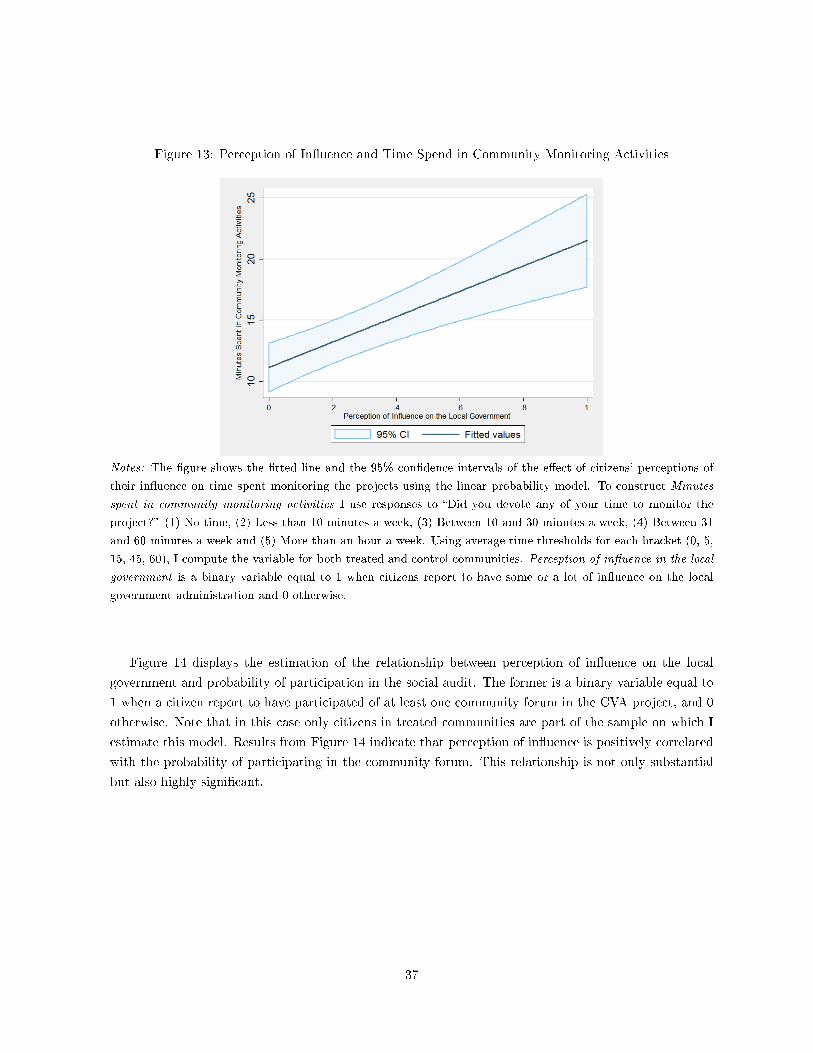
Figure 13: Perception of In�uence and Time Spend in Community Monitoring Activities
Notes: The �gure shows the �tted line and the 95% con�dence intervals of the e�ect of citizens' perceptions of
their in�uence on time spent monitoring the projects using the linear probability model. To construct Minutes
spent in community monitoring activities I use responses to �Did you devote any of your time to monitor the
project?� (1) No time, (2) Less than 10 minutes a week, (3) Between 10 and 30 minutes a week, (4) Between 31
and 60 minutes a week and (5) More than an hour a week. Using average time thresholds for each bracket (0, 5,
15, 45, 60), I compute the variable for both treated and control communities. Perception of in�uence in the local
government is a binary variable equal to 1 when citizens report to have some or a lot of in�uence on the local
government administration and 0 otherwise.
Figure 14 displays the estimation of the relationship between perception of in�uence on the local
government and probability of participation in the social audit. The former is a binary variable equal to
1 when a citizen report to have participated of at least one community forum in the CVA project, and 0
otherwise. Note that in this case only citizens in treated communities are part of the sample on which I
estimate this model. Results from Figure 14 indicate that perception of in�uence is positively correlated
with the probability of participating in the community forum. This relationship is not only substantial
but also highly signi�cant.
37
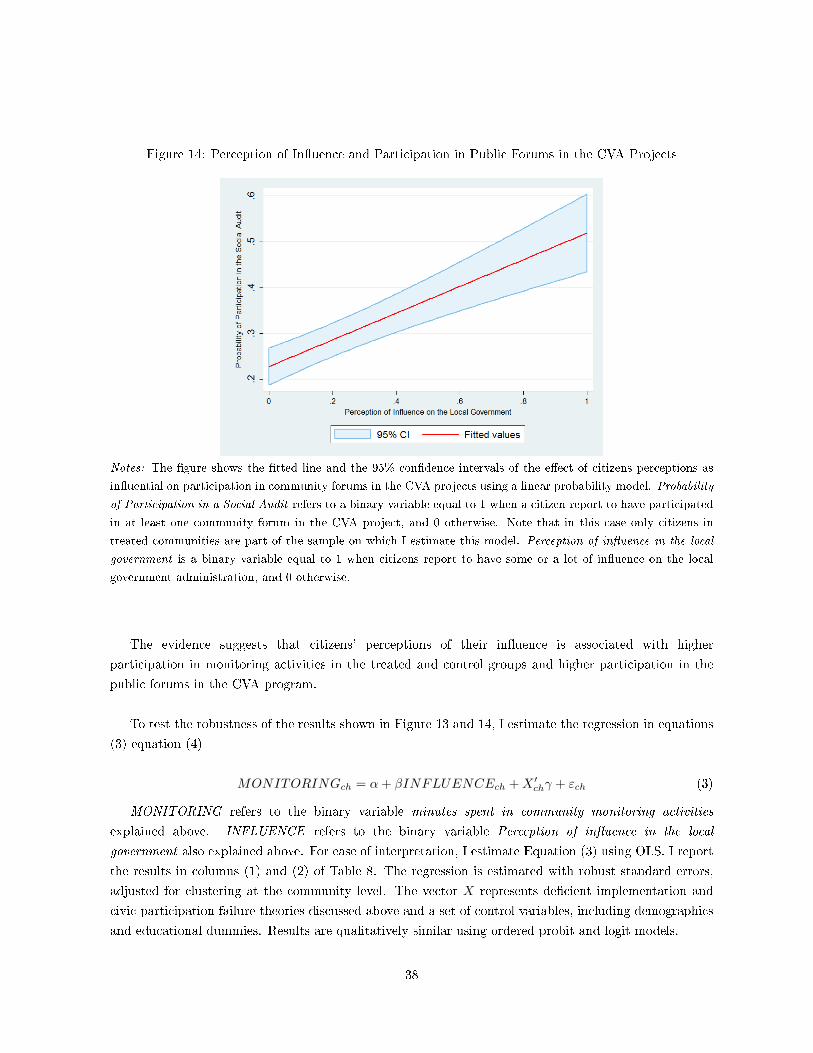
Figure 14: Perception of In�uence and Participation in Public Forums in the CVA Projects
Notes: The �gure shows the �tted line and the 95% con�dence intervals of the e�ect of citizens perceptions as
in�uential on participation in community forums in the CVA projects using a linear probability model. Probability
of Participation in a Social Audit refers to a binary variable equal to 1 when a citizen report to have participated
in at least one community forum in the CVA project, and 0 otherwise. Note that in this case only citizens in
treated communities are part of the sample on which I estimate this model. Perception of in�uence in the local
government is a binary variable equal to 1 when citizens report to have some or a lot of in�uence on the local
government administration, and 0 otherwise.
The evidence suggests that citizens' perceptions of their in�uence is associated with higher
participation in monitoring activities in the treated and control groups and higher participation in the
public forums in the CVA program.
To test the robustness of the results shown in Figure 13 and 14, I estimate the regression in equations
(3) equation (4)
MONITORINGch = α+ βINFLUENCEch +X ′chγ + εch (3)
MONITORING refers to the binary variable minutes spent in community monitoring activities
explained above. INFLUENCE refers to the binary variable Perception of in�uence in the local
government also explained above. For ease of interpretation, I estimate Equation (3) using OLS. I report
the results in columns (1) and (2) of Table 8. The regression is estimated with robust standard errors,
adjusted for clustering at the community level. The vector X represents de�cient implementation and
civic participation failure theories discussed above and a set of control variables, including demographics
and educational dummies. Results are qualitatively similar using ordered probit and logit models.
38
I estimate equation (4) using a probit model, where h is a household in a given community, denoted as
c. I use participation in at least one community forum, which only citizens in treated community would
be able to attend, as a dependant variable. The regression is estimated using probit model with robust
standard errors, adjusted for clustering at the community level. Columns (3) and (4) of Table 8 show the
coe�cient for the marginal e�ect and the p-value, respectively.
∂PARTICIPATIONch∂INFLUENCEch
=∂Φ(xchβ)
∂INFLUENCEch= φ(xchβ)βch (4)
In the regression exercises, I control for the two theories, de�cient implementation theory and civic
participation failure, that attempt to explain when citizens are unable to engage with governments to
monitor project performance.
On the one hand, I con�rmed what the previous evidence presented above suggested. Civic
participation failure theory does not have any explanatory power in CVA's context. In particular, in the
case of the opportunity cost of time, income cannot explain neither time spend in community monitoring
activities nor participation in the community forums. To test the e�ect of citizens' expectations of
reciprocating behavior on citizens willingness to monitor the project, I use two measures. A measure
of trust introduced above and a measure of ethnic outsider, suggested in the literature by Lieberman,
Posner and Tsai (2013). This is a dummy variable equal to 1 if respondent's ethnicity is di�erent from
the ethnicity of the majority of respondents in that community, and 0 otherwise. Both measures fail to
explain the variation in the dependent variables.
On the other hand I �nd that de�cient program implementation and citizens' beliefs about their
perception of in�uence are majors bottlenecks which constrain citizens' ability to engage with government
to monitor project performance. In the �rst case, I �nd that having access to high quality information
is crucial in the decision whether to monitor the project. In particular, it increases time spent in
monitoring activities by almost 7 additional minutes, and increases probability of participation in the
community forum by almost 16 percentage points. In the case of beliefs, perceiving oneself as somewhat
or a lot in�uential on local government increases time spent monitoring by almost 8 additional minutes
as well as increases the probability of participation in the community forum by almost 27 percentage
points.
These results go in line with the theory of self-ful�lling prophecies, as citizens participation in
monitoring activities are dependant on whether citizens' perceive themselves as in�uential in local
government, which is a proxy for citizens' expectations of local government accountability.
39
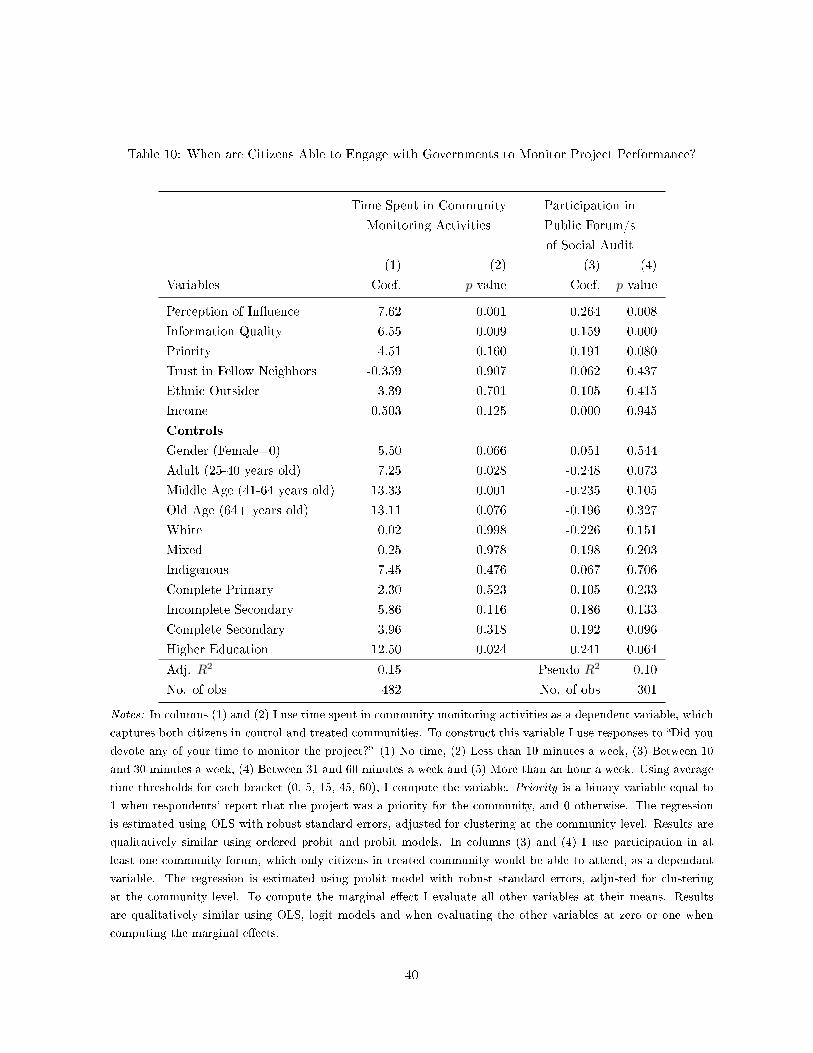
Table 10: When are Citizens Able to Engage with Governments to Monitor Project Performance?
Time Spent in Community Participation in
Monitoring Activities Public Forum/s
of Social Audit
(1) (2) (3) (4)
Variables Coef. p-value Coef. p-value
Perception of In�uence 7.62 0.001 0.264 0.008
Information Quality 6.55 0.009 0.159 0.000
Priority 4.51 0.160 0.191 0.080
Trust in Fellow Neighbors -0.359 0.907 0.062 0.437
Ethnic Outsider 3.39 0.701 -0.105 0.415
Income 0.503 0.125 0.000 0.945
Controls
Gender (Female=0) 5.50 0.066 0.051 0.544
Adult (25-40 years old) 7.25 0.028 -0.248 0.073
Middle Age (41-64 years old) 13.33 0.001 -0.235 0.105
Old Age (64+ years old) 13.11 0.076 -0.196 0.327
White 0.02 0.998 -0.226 0.151
Mixed 0.25 0.978 -0.198 0.203
Indigenous 7.45 0.476 -0.067 0.706
Complete Primary 2.30 0.523 0.105 0.233
Incomplete Secondary 5.86 0.116 0.186 0.133
Complete Secondary 3.96 0.318 0.192 0.096
Higher Education 12.50 0.024 0.241 0.064
Adj. R2 0.15 Pseudo R2 0.10
No. of obs 482 No. of obs 301
Notes: In columns (1) and (2) I use time spent in community monitoring activities as a dependent variable, which
captures both citizens in control and treated communities. To construct this variable I use responses to �Did you
devote any of your time to monitor the project?� (1) No time, (2) Less than 10 minutes a week, (3) Between 10
and 30 minutes a week, (4) Between 31 and 60 minutes a week and (5) More than an hour a week. Using average
time thresholds for each bracket (0, 5, 15, 45, 60), I compute the variable. Priority is a binary variable equal to
1 when respondents' report that the project was a priority for the community, and 0 otherwise. The regression
is estimated using OLS with robust standard errors, adjusted for clustering at the community level. Results are
qualitatively similar using ordered probit and probit models. In columns (3) and (4) I use participation in at
least one community forum, which only citizens in treated community would be able to attend, as a dependant
variable. The regression is estimated using probit model with robust standard errors, adjusted for clustering
at the community level. To compute the marginal e�ect I evaluate all other variables at their means. Results
are qualitatively similar using OLS, logit models and when evaluating the other variables at zero or one when
computing the marginal e�ects.
40
One concern with results from Table 10 is that there is a potential confounding e�ect. Taking part in
community monitoring activities could also a�ect citizens' perception of in�uence on the local government.
If this were true and participation in community monitoring activities was crucial in changing
citizens' perceptions of their in�uence vis à vis the municipal government, I should �nd that spending
additional time monitoring a project increases the probability that the citizen changes his/her perception
of in�uence. I take advantage of the fact that among those who spend time monitoring projects we
have a wide variation, with the coe�cient of variation being σ̂µ̂ = 1.67. I �nd that among this group,
additional time spent in community monitoring activities has no e�ect on perception of in�uence.
Additionally, another empirical implication of the endogeneity theory is that those who participate
in community monitoring activities and �nd the work of representatives of municipal government
unsatisfactory should have a lower perception of being in�uential. The fact that they were not able to
increase politicians accountability while participating in monitoring the project should have an e�ect
in updating their priors regarding how in�uential they perceive themselves to be. However, this is not
the case, as 31% of those individuals believe they are in�uential, not statistically di�erent from the 34%
among those who evaluate the work of local o�cials as satisfactory. These numbers are substantially
higher and statistically di�erent than the 17% of citizens who perceive themselves as in�uential using
the whole sample.
The evidence suggests that once the person has decided to spend time monitoring the project,
neither additional time spent in community monitoring activities nor their perceived performance of
local o�cials has an impact on perception of their own in�uence on the municipal government. As a
result, it seems that perception of in�uence in government is not easy to change and it is crucial to
understand why citizens decide to participate and spent time in community monitoring activities such
as the ones encouraged by the CVA program.
In order to test whether the (d.2), I asses whether increase (decrease) participation in the CVA
increases (decreases) project visibility. Using responses from participants in community forums in the
CVA program I estimate the participant multiplier e�ect. For each participant, 4 [2.4 − 5.42] other
neighbors that did not participate in any of the public forums were told about the CVA program and
the infrastructure project. This piece of evidence explains the micro-linkages between participation in
the public forums and citizens knowledge about the infrastructure project which was being built in the
community.
41
Part II
The evidence from Figure 12 and Table 9 above suggest that the CVA program improved politician's
behavior, as evaluated by citizens. As I argued above, there are two potential explanations:
(a) Citizens subsidized the work of politicians by monitoring providers and identifying pockets of
corruption and ine�ciency.
(b) Improvements in project performance becomes more valuable for politicians, as citizens are better
able to recognize politicians' e�ort.
Table 10 presents the results from examining whether these theories have empirical validity. I estimate
the regression in equation (5) and (6) using OLS, where OUTCOME refers to the di�erential in overall
performance and di�erence in politicians performance14. In equation (5) MONITORING refers to time
spent in monitoring activities, explained above. This variable is used to test potential explanation (a).
In equation (6) VISIBILITY refers to the percentage of citizens that know about the project in each
community. This variable is used to test theory (b).
OUTCOMEc = α+ βMONITORINGc + εc (5)
OUTCOMEc = α+ βV ISIBILITYc + εc (6)
Columns (6) and (7) from Table 10 assess the validity of potential explanation (a) using OLS and
columns (8) and (9) using metaregression. I use metaregression to account for the fact that variables
for some communities are estimated with a small sample. Metaregression allows me to compute a
weight for each pair of projects based on their standard error, ameliorating the small sample problem
within projects. I found that time spent monitoring projects cannot explain politicians' performance
improvement in CVA's projects. In particular, using OLS or meta-regression, average time spent
monitoring activities by CVA project is not associated with changes in Di�erence in Politicians'
Performance. Point estimates are small and have no statistical signi�cance. Similar results are found for
Di�erence in overall performance in columns (2) and (3) using OLS and (4) and (5) using metaregression.
Columns (6) and (7) from Table 10 also assess the validity of potential explanation (b) using OLS
and columns (8) and (9) using metaregression. The evidence from Table 10 suggests stronger treatment
e�ects of the CVA program on politicians' and project performance on communities where a higher
percentage of citizens had knowledged about its existence. Using OLS, the point estimate indicates that
increasing project visibility in 10 percentage points in CVA projects increase Di�erence in Politicians'
Performance by 3,8 percentage points. This e�ect is not only substantial but also statistically signi�cant
at 93% signi�cance level. In the case of Di�erence in overall performance in columns (2) and (3), the
14Di�erence in overall performance refers to the di�erence between the proportion of citizens who evaluate the project
performance as good or very good by pair of communities. Di�erence in Politicians' Performance refers to the di�erence
between the proportion of citizens who evaluate the work of politicians as good or very good by pair of communities.
42
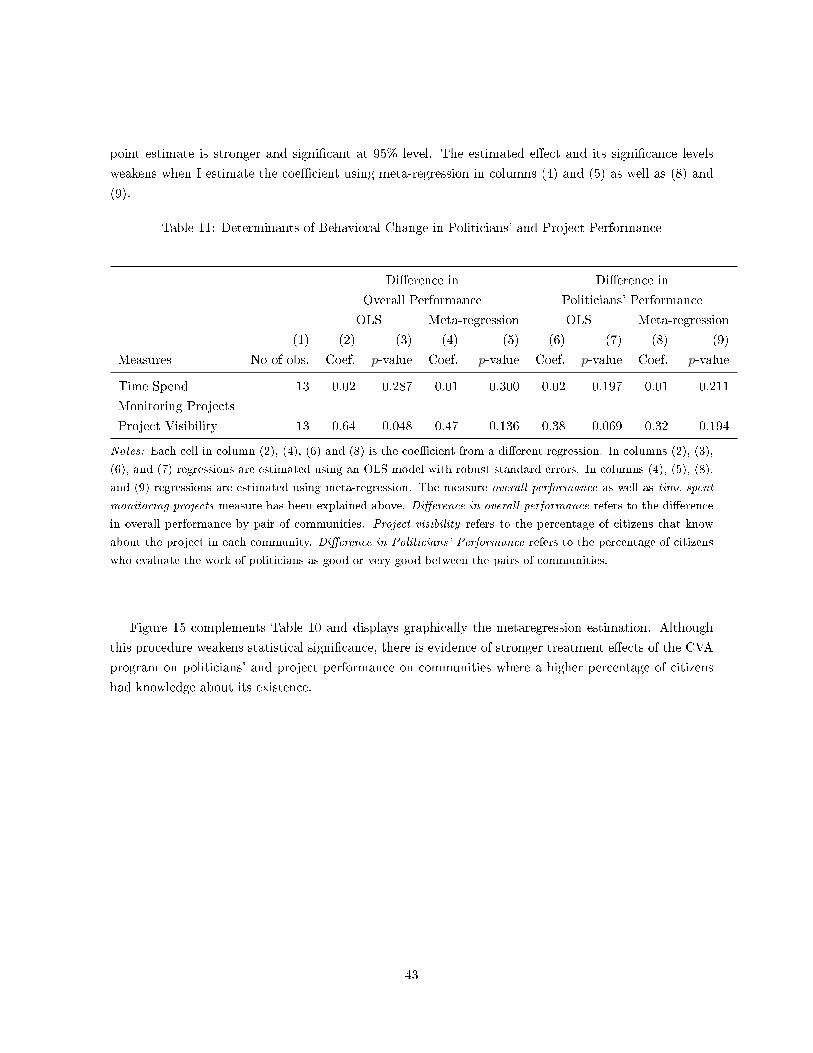
point estimate is stronger and signi�cant at 95% level. The estimated e�ect and its signi�cance levels
weakens when I estimate the coe�cient using meta-regression in columns (4) and (5) as well as (8) and
(9).
Table 11: Determinants of Behavioral Change in Politicians' and Project Performance
Di�erence in Di�erence in
Overall Performance Politicians' Performance
OLS Meta-regression OLS Meta-regression
(1) (2) (3) (4) (5) (6) (7) (8) (9)
Measures No of obs. Coef. p-value Coef. p-value Coef. p-value Coef. p-value
Time Spend 13 0.02 0.287 0.01 0.300 0.02 0.197 0.01 0.211
Monitoring Projects
Project Visibility 13 0.64 0.048 0.47 0.136 0.38 0.069 0.32 0.194
Notes: Each cell in column (2), (4), (6) and (8) is the coe�cient from a di�erent regression. In columns (2), (3),
(6), and (7) regressions are estimated using an OLS model with robust standard errors. In columns (4), (5), (8),
and (9) regressions are estimated using meta-regression. The measure overall performance as well as time spent
monitoring projects measure has been explained above. Di�erence in overall performance refers to the di�erence
in overall performance by pair of communities. Project visibility refers to the percentage of citizens that know
about the project in each community. Di�erence in Politicians' Performance refers to the percentage of citizens
who evaluate the work of politicians as good or very good between the pairs of communities.
Figure 15 complements Table 10 and displays graphically the metaregression estimation. Although
this procedure weakens statistical signi�cance, there is evidence of stronger treatment e�ects of the CVA
program on politicians' and project performance on communities where a higher percentage of citizens
had knowledge about its existence.
43
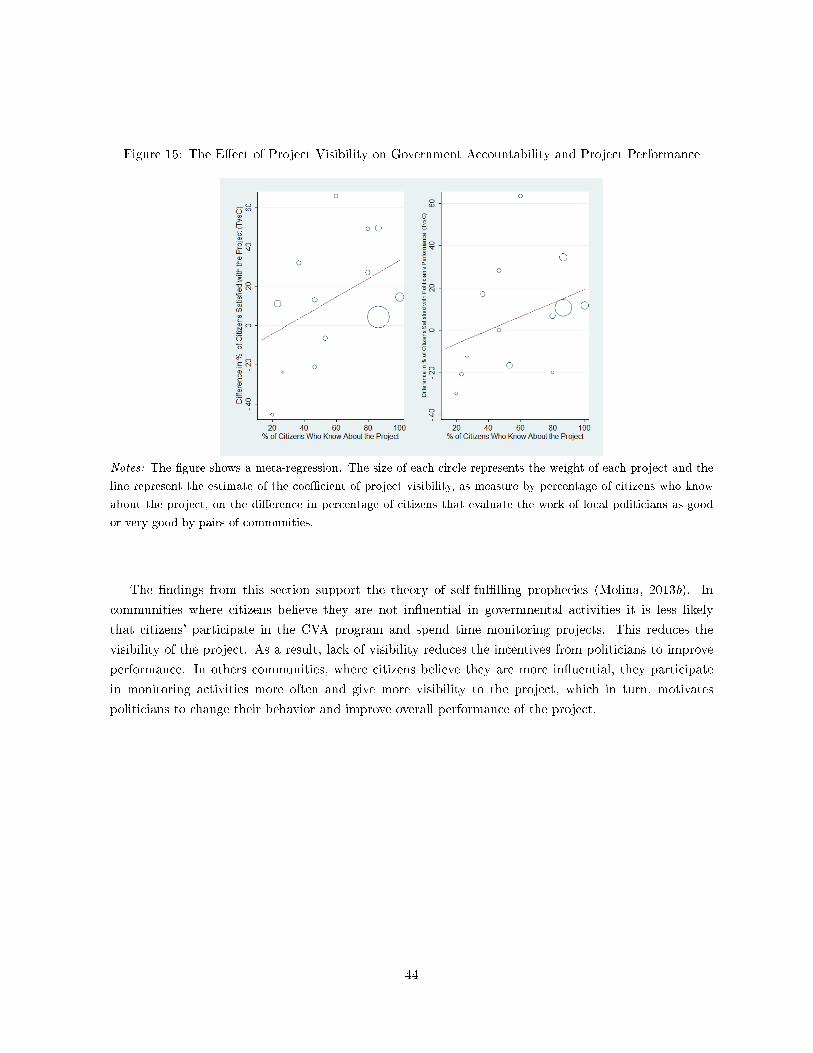
Figure 15: The E�ect of Project Visibility on Government Accountability and Project Performance
Notes: The �gure shows a meta-regression. The size of each circle represents the weight of each project and the
line represent the estimate of the coe�cient of project visibility, as measure by percentage of citizens who know
about the project, on the di�erence in percentage of citizens that evaluate the work of local politicians as good
or very good by pairs of communities.
The �ndings from this section support the theory of self-ful�lling prophecies (Molina, 2013b). In
communities where citizens believe they are not in�uential in governmental activities it is less likely
that citizens' participate in the CVA program and spend time monitoring projects. This reduces the
visibility of the project. As a result, lack of visibility reduces the incentives from politicians to improve
performance. In others communities, where citizens believe they are more in�uential, they participate
in monitoring activities more often and give more visibility to the project, which in turn, motivates
politicians to change their behavior and improve overall performance of the project.
44
6 Conclusions
This article examines the impact of the Citizen Visible Audit (CVA), a social audit aim to monitor the
use of royalties in Colombia, on project performance. The results suggest that the CVA program is
successful in improving project performance in almost all performance measures I compute, including an
aggregate one. This suggests a highly positive impact of the program in improving citizens' satisfaction
with the project as well as citizen's assessment of the quality of the project's execution. However,
treatment e�ects are highly heterogenous across communities.
I developed a theoretical framework for social audits that allows me to identify the potential
bottlenecks of the CVA program. My theory contributes to explain (a) under what conditions citizens
decide to monitor the project and (b) under what conditions governments facilitate citizen engagement
and become more accountable.
In the case of (a), I found that neither opportunity cost of participation nor collective action
bottlenecks can explain the variation in citizens' willingness to participate in monitoring the project.
The evidence suggests that heterogeneity in citizens monitoring e�orts is the result of two major
bottlenecks: (i) citizens knowledge about the program and how to monitor the program and (ii) citizens'
beliefs about the probability that participation in monitoring activities will lead to improvements in
project performance.
In the �rst case, I �nd that in some communities citizens did not know the infrastructure program
existed, and in some others, they knew the project existed but did not have access to information on
how to monitor it. This prevents citizens from taking an active role in CVA's community forums and
community monitoring activities in general.
In the case of beliefs, the evidence suggests that perceiving oneself as in�uential to local government
is crucial for deciding whether to spend time in community monitoring activities. The rationale is that
citizens may refuse to take advantage of the opportunity to monitor government and providers if they
believe that after paying the opportunity cost of monitoring, coordinating their actions with fellow
neighbors and identifying projects' problems, politicians and providers will not be responsive.
Regarding (b), there is supporting evidence of stronger treatment e�ects of the CVA program on
politicians' performance on communities where the project had higher visibility among the population.
Overall, results give supporting evidence for what I have called a theory of self-ful�lling prophecy
in service delivery. In Molina (2013b), I argue that there is a channel, often not accounted for in
the literature, through which the e�ect of a community monitor intervention could be diminished. In
particular, I argue that citizen's low expectations on leaders, o�cials, or service providers' accountability
may generate low community participation in monitoring the project. As a result, project visibility is
45
reduced, since there are fewer citizens talking about this program to other fellow citizens. Politicians
and providers, in turn, observing weak community monitoring participation and project visibility, may
have fewer incentives to spend time and e�ort improving project performance.
Future work should aim to collect more and better data to allow for a better understanding of the
pathway of change of social audits and community monitoring interventions in general.
References
Acemoglu, D. and J. A. Robinson. 2008. �Persistence of Power, Elites, and Institutions.� American
Economic Review 98(1):267�293.
Adsera, Alicia, Carles Boix and Mark Payne. 2003. �Are You Being Served? Political Accountability and
Quality of Government.� Journal of Law, Economics and Organization 19(2):445�490.
Alesina, Alberto and Romain Wacziarg. 2003. �Fractionalization.� Journal of Economic Growth 8(2):155�
94.
Banerjee, Abhijit V., Rukmini Banerji, Esther Du�o, Rachel Glennerster and Stuti Khemani. 2010.
�Pitfalls of Participatory Programs: Evidence from a Randomized Evaluation in Education in India.�
American Economic Journal: Economic Policy 2(1):1�30.
Bardhan, Pranab. 2002. �Decentralization of Governance and Development.� Journal of Economic
Perspectives 16(4):185�205.
Bardhan, Pranab and Dilip Mookherjee. 2006. �Decentralisation and Accountability in Infrastructure
Delivery in Developing Countries.� Economic Journal 116(508):101�127.
Besley, T. and T. Persson. 2011. Pillars of Prosperity: The Political Economics of Development Clusters.
The Yrj Jahnsson Lectures Princeton University Press.
Björkman, Martina and Jakob Svensson. 2009. �Power to the People: Evidence from a Randomized
Field Experiment on Community-Based Monitoring in Uganda.� The Quarterly Journal of Economics
124(2):735�769.
Chaudhury, Nazmul, Je�rey Hammer, Michael Kremer, Karthik Muralidharan and F. Halsey Rogers.
2006. �Missing in Action: Teacher and Health Worker Absence in Developing Countries.� Journal of
Economic Perspectives 20(1):91�116.
Devarajan, Shantayanan, Stuti Khemani and Michael Walton. 2011. Civil society, public action and
accountability in Africa. Policy Research Working Paper Series 5733 The World Bank.
Downs, A. 1957. An economic theory of democracy. Harper.
46
Gavazza, Alessandro and Alessandro Lizzeri. 2007. �The Perils of Transparency in Bureaucracies.�
American Economic Review 97(2):300�305.
Hotelling, H. 1929. �Stability in Competition.� Economic Journal 39:41�57.
Lieberman, Evan, Daniel N. Posner and Lily Tsai. 2013. Does Information Lead to More Active
Citizenship? Evidence from an Education Intervention in Rural Kenya. Technical report MIT Political
Science Department.
Mansuri, Ghazala and Vijayendra Rao. 2004. Community-based (and driven) development : A critical
review. Policy Research Working Paper Series 3209 The World Bank.
Mansuri, Ghazala and Vijayendra Rao. 2012. Localizing Development : Does Participation Work?
Number 11859 in �World Bank Publications� The World Bank.
Molina, Ezequiel. 2013a. �Community Monitoring Interventions to Improve Outcomes and Curb
Corruption in Service Delivery in Low Income Communities: a systematic review.�.
Molina, Ezequiel. 2013b. �A Theory of Self-fu�lling Prophecy in Service Delivery.�.
Olken, B. 2007. �Monitoring corruption: Evidence from a �eld experiment in Indonesia.� Journal of
Political Economy 115:200�249.
Olken, Benjamin A. 2009. �Corruption perceptions vs. corruption reality.� Journal of Public Economics
93(7-8):950�964.
Olson, Mancur. 1971. The Logic of Collective Action : Public Goods and the Theory of Groups. Harvard
economic studies, v. 124 revised ed. Harvard University Press.
Pan, Lei and Luc Christiaensen. 2012. �Who is Vouching for the Input Voucher? Decentralized Targeting
and Elite Capture in Tanzania.� World Development 40(8):1619�1633.
Persson, Torsten and Guido Tabellini. 2002. Political Economics: Explaining Economic Policy. Vol. 1 of
MIT Press Books The MIT Press.
Prat, Andrea. 2005. �The Wrong Kind of Transparency.� American Economic Review 95(3):862�877.
Pritchett, Lant, Michael Woolcock and Matt Andrews. 2013. �Looking Like a State: Techniques of
Persistent Failure in State Capability for Implementation.� Journal of Development Studies 49(1):1�
18.
Putnam, Robert D. 1993. Making Democracy Work: Civic Traditions in Modern Italy. Vol. 506 Princeton
University Press.
Reinikka, Ritva and Jakob Svensson. 2004. �Local Capture: Evidence From a Central Government
Transfer Program in Uganda.� The Quarterly Journal of Economics 119(2):678�704.
47
Reinikka, Ritva and Jakob Svensson. 2011. �The power of information in public services: Evidence from
education in Uganda.� Journal of Public Economics 95(7-8):956�966.
Ringold, Dena, Alaka Holla, Margaret Koziol and Santhosh Srinivasan. 2012. Citizens and Service
Delivery : Assessing the Use of Social Accountability Approaches in the Human Development Sectors.
Number 2377 in �World Bank Publications� The World Bank.
Stiglitz, Joseph E. 2002. �Participation and Development: Perspectives from the Comprehensive
Development Paradigm.� Review of Development Economics 6(2):163�82.
Svendsen, G.T. and G.L.H. Svendsen. 2009. Handbook of Social Capital: The Troika of Sociology, Political
Science and Economics. Elgar Original Reference Series Edward Elgar Publishing, Incorporated.
World-Bank. 2003. Making Service Work for Poor People. World Bank.
48

49
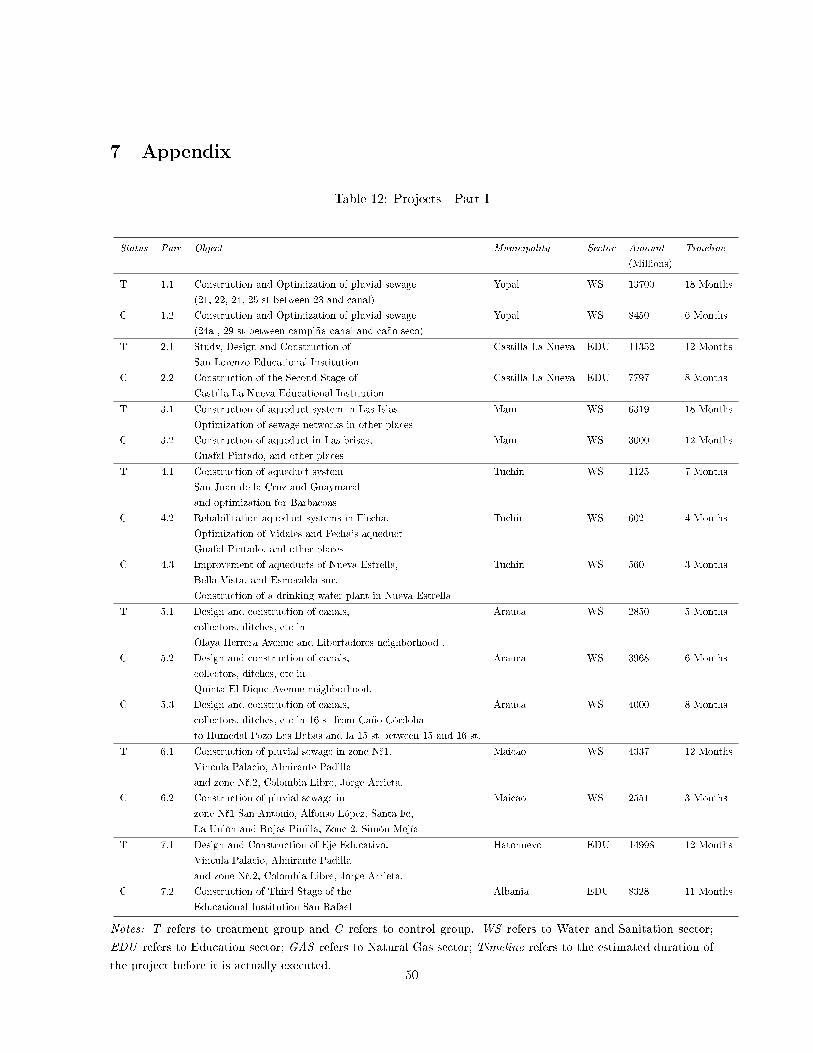
7 Appendix
Table 12: Projects - Part I
Status Pair Object Municipality Sector Amount Timeline
(Millions)
T 1.1 Construction and Optimization of pluvial sewage Yopal WS 13700 18 Months
(21, 22, 24, 25 st between 23 and canal)
C 1.2 Construction and Optimization of pluvial sewage Yopal WS 8450 6 Months
(24a , 29 st between campiña canal and caño seco)
T 2.1 Study, Design and Construction of Castilla La Nueva EDU 11352 12 Months
San Lorenzo Educational Institution
C 2.2 Construction of the Second Stage of Castilla La Nueva EDU 7797 8 Months
Castilla La Nueva Educational Institution
T 3.1 Construction of aqueduct system in Las Islas Mani WS 6319 18 Months
Optimization of sewage networks in other places
C 3.2 Construction of aqueduct in Las brisas, Mani WS 3000 12 Months
Guafal Pintado, and other places
T 4.1 Construction of aqueduct system Tuchin WS 1125 7 Months
San Juan de la Cruz and Guaymaral
and optimization for Barbacoas
C 4.2 Rehabilitation aqueduct systems in Flecha, Tuchin WS 602 4 Months
Optimization of Vidales and Fecha's aqueduct
Guafal Pintado, and other places
C 4.3 Improvement of aqueducts of Nueva Estrella, Tuchin WS 560 3 Months
Bella Vista, and Esmeralda sur.
Construction of a drinking water plant in Nueva Estrella
T 5.1 Design and construction of canals, Arauca WS 2850 5 Months
collectors, ditches, etc in
Olaya Herrera Avenue and Libertadores neighborhood .
C 5.2 Design and construction of canals, Arauca WS 3968 6 Months
collectors, ditches, etc in
Quinta-El Dique Avenue neighborhood.
C 5.3 Design and construction of canals, Arauca WS 4000 8 Months
collectors, ditches, etc in 16 st from Caño Córdoba
to Humedal Pozo Las Babas and la 15 st between 15 and 16 st.
T 6.1 Construction of pluvial sewage in zone N°1, Maicao WS 4337 12 Months
Víncula Palacio, Almirante Padilla
and zone N°.2, Colombia Libre, Jorge Arrieta.
C 6.2 Construction of pluvial sewage in Maicao WS 2551 3 Months
zone N°1 San Antonio, Alfonso López, Santa Fe,
La Unión and Rojas Pinilla, Zone 2, Simón Mejía
T 7.1 Design and Construction of Eje Educativo. Hatonuevo EDU 14998 12 Months
Víncula Palacio, Almirante Padilla
and zone N°.2, Colombia Libre, Jorge Arrieta.
C 7.2 Construction of Third Stage of the Albania EDU 8328 11 Months
Educational Institution San Rafael
Notes: T refers to treatment group and C refers to control group. WS refers to Water and Sanitation sector;
EDU refers to Education sector; GAS refers to Natural Gas sector; Timeline refers to the estimated duration of
the project before it is actually executed.50
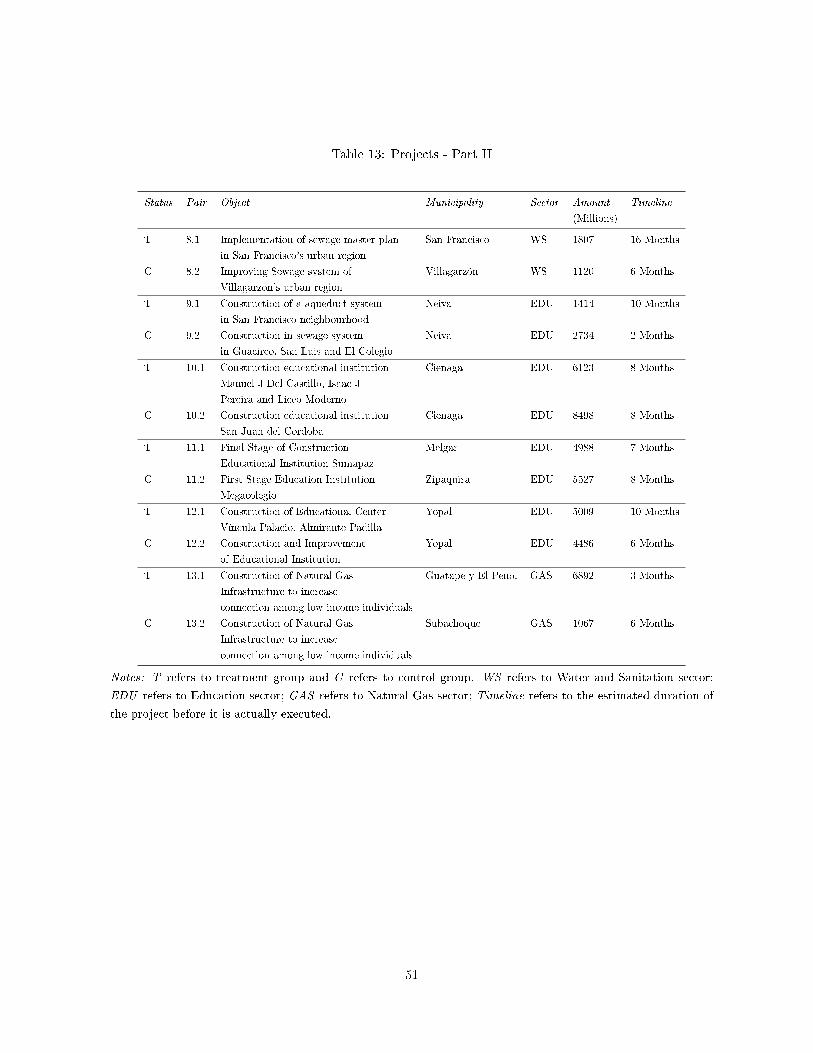
Table 13: Projects - Part II
Status Pair Object Municipality Sector Amount Timeline
(Millions)
T 8.1 Implementation of sewage master plan San Francisco WS 1807 16 Months
in San Francisco's urban region
C 8.2 Improving Sewage system of Villagarzón WS 1120 6 Months
Villagarzon's urban region
T 9.1 Construction of a aqueduct system Neiva EDU 1414 10 Months
in San Francisco neighbourhood
C 9.2 Construction in sewage system Neiva EDU 2734 2 Months
in Guacirco, San Luis and El Colegio
T 10.1 Construction educational institution Cienaga EDU 6123 8 Months
Manuel J Del Castillo, Isaac J
Pereira and Liceo Moderno
C 10.2 Construction educational institution Cienaga EDU 8498 8 Months
San Juan del Cordoba
T 11.1 Final Stage of Construction Melgar EDU 4988 7 Months
Educational Institution Sumapaz
C 11.2 First Stage Education Institution Zipaquira EDU 5527 8 Months
Megacolegio
T 12.1 Construction of Educational Center Yopal EDU 5009 10 Months
Víncula Palacio, Almirante Padilla
C 12.2 Construction and Improvement Yopal EDU 4486 6 Months
of Educational Institution
T 13.1 Construction of Natural Gas Guatape y El Penol GAS 6892 3 Months
Infrastructure to increase
connection among low income individuals
C 13.2 Construction of Natural Gas Subachoque GAS 1067 6 Months
Infrastructure to increase
connection among low income individuals
Notes: T refers to treatment group and C refers to control group. WS refers to Water and Sanitation sector;
EDU refers to Education sector; GAS refers to Natural Gas sector; Timeline refers to the estimated duration of
the project before it is actually executed.
51