CAMPUS FORUM April 22, 2010 1. Vision for 2035: World Class Research University 2.
42
CAMPUS FORUM April 22, 2010 1
-
Upload
david-pitts -
Category
Documents
-
view
214 -
download
0
Transcript of CAMPUS FORUM April 22, 2010 1. Vision for 2035: World Class Research University 2.

1
CAMPUS FORUM
April 22, 2010

2
Vision for 2035:
World Class Research University

3
Strategic Plan
• Approved by Board of Control on July 16, 2009
Major Goals Remain SamePeopleDistinctive EducationResearch/Scholarship/Creativity
• http://www.mtu.edu/stratplan/

4
FY10 Budget Update

Current Fund 2010(in Thousands)
5
Original 3rd Qtr
Projection Projection
Revenue 238,446 238,519
Expense (237,918) (239,657)
Investment Gains - 1,698
Net Income 528 561
Current Fund Balance 16,162 16,196
Note: Current Fund includes General Fund, Designated Fund, Auxiliaries,
Retirement and Insurance, and the Expendable Restricted Funds.

6

7
FY10 Challenges
•Financial Aid•More Students Accepting•Promise Grant•Merit Awards

8
FY10 Opportunities
•State Appropriations - ARRA
•Research Awards
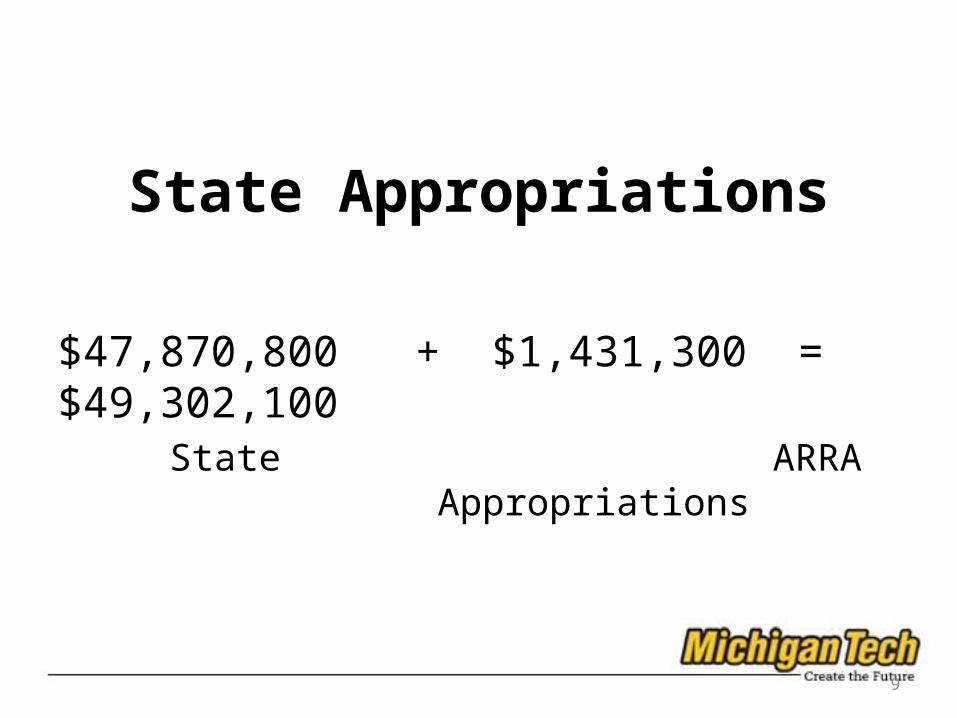
9
State Appropriations
$47,870,800 + $1,431,300 = $49,302,100 State ARRA Appropriations

10
RESEARCH

11
Final 3rd Quarter

12
FY08 NSF Research Rankings
• 163rd Nationally • 118th Among Public Institutions• 66th Among Institutions without Medical Schools

13
ENROLLMENT

14
19701971
19721973
19741975
19761977
19781979
19801981
19821983
19841985
19861987
19881989
19901991
19921993
19941995
19961997
19981999
20002001
20022003
20042005
20062007
20082009
4,500
5,000
5,500
6,000
6,500
7,000
7,500
8,000
8,500
Michigan Tech Fall Enrollment History 1970-2009
Standard Learning On-Line Learning ESD Students*2009 figures are final prelimi-nary
7,1327,018

Fall 2010 Undergraduate Recruitment Update
2009 2010 Change
• Total apps 5,317 5,012 -305 -6%
• Accepts 3,751 3,565 -186 -5%
• Deposits 1,284 1,156 -128 -10%
• Freshmen ACT Composite Avg. 26.3 26.5 .2
April 19, 2010
15

16
2 4 6 8 10 12 14 16 18 20 22 24 26 28 30 32 34 36 38 40 42 44 46 48 50 520
1000
2000
3000
4000
5000
6000
7000
3949
4605
5032
5885
Total Applications
2004 Total Apps
2005 Total Apps
2006 Total Apps
2007 Total Apps
2008 Total Apps
2009 Total Apps
2010 Total Apps

17
Wee
k 1 3 5 7 9 11 13 15 17 19 21 23 25 27 29 31 33 35 37 39 41 43 45 47 49 510
500
1000
1500
2000
2500
3000
3500
4000
4500
5000
3326
3834
3765
4214
4598
Accepted Applications
2004 Accepts
2005 Accepts
2006 Accepts
2007 Accepts
2008 Accepts
2009 Accepts
2010 Accepts

18
1 3 5 7 9 11 13 15 17 19 21 23 25 27 29 31 33 35 37 39 41 43 45 47 49 510
200
400
600
800
1000
1200
1400
1600
1800
Enrollment Deposits
2004 Deposits
2005 Deposits
2006 Deposits
2007 Deposits
2008 Deposits
2009 Deposits
2010 Deposits

19
Wee
k 2 4 6 8 10 12 14 16 18 20 22 24 26 28 30 32 34 36 38 40 42 44 46 48 50 520
200
400
600
800
1000
1200
1400
720
870
972
1035
1238
Female Accepted Applications
2004
2005
2006
2007
2008
2009
2010

20
Wee
k 2 4 6 8 10 12 14 16 18 20 22 24 26 28 30 32 34 36 38 40 42 44 46 48 50 520
50
100
150
200
250
300
350
400
450
Female Deposits Paid
2004
2005
2006
2007
2008
2009
2010

21
Wee
k 2 4 6 8 10 12 14 16 18 20 22 24 26 28 30 32 34 36 38 40 42 44 46 48 50 520
50
100
150
200
250
300
350
400
450
339
302
Domestic Minority Accepted Applications
2004
2005
2006
2007
2008
2009
2010

22
Wee
k 2 4 6 8 10 12 14 16 18 20 22 24 26 28 30 32 34 36 38 40 42 44 46 48 50 520
20
40
60
80
100
120
74
106
8788
106
Domestic Minority Deposits Paid
2004
2005
2006
2007
2008
2009
2010

23
Fall 2010 Graduate Recruitment Update
2009 2010 ChangeTotal Applications 2155 2401 246Accepts 504 540 36International Accepts 337 420 83Total Accepts 841 960 119
April 29, 2010

24
2011 Budget

25
Michigan Higher Education This Decade
State Personal Income +12.7%State Spending from State Resources + 2.4%State Higher Ed. Appropriations -13.7%University FTE Enrollment +12.8%Decrease in State Tax Revenue -28.8%*
Source: Senate Fiscal Agency
*February 2010 tax revenue compared to February 2009

26
Michigan Tech State Appropriation
Governor $49,302,100
Senate $47,756,500
House Testimony Phase

27
2002-03 2003-04 2004-05 2005-06 2006-07 2007-08 2008-09 2009-10 2010-1144.0
45.0
46.0
47.0
48.0
49.0
50.0
51.0
52.0
53.0
54.0
State AppropriationsFiscal Years 2002-03 to 2010-11
.
Dolla
rs (I
n M
illio
ns)

28
Budget Parameters
•3.1% Reduction in State Appropriations•Continued Realignment of Internal Resources•Retention and Promotion Salary Pool•Graduate Student Compensation +1%

29
Budget Parameters
•Decrease in undergraduate enrollment ~220•Increase in graduate enrollment ~70
•Tuition/Fees Increase- under 6%•Financial Aid Increase $2.5M•ICR Increase $200k

30
GENERAL FUND AND CURRENT FUNDFY11 Budget and Projection (in Thousands)
General Current Fund Fund
Total Operating Revenue 158,890 245,430
Total Operating Expense (158,890) (245,220) (and transfers)
Net Income - 210
Note: Current Fund includes General Fund, Designated Fund, Auxiliaries, Retirement and Insurance, and the Expendable Restricted Funds.

31
Budget Uncertainties
•Appropriations•Enrollment•State Retirement Program•Federal Health Care

32
CAPITAL CAMPAIGN

33
MICHIGAN TECHNOLOGICAL UNIVERSITY Generations of Discovery
Campaign Progress Summary as of March 31, 2010
Alumni & Friends $ 77,048,252Corporations 31,056,115Private Foundations 2,094,007Gifts-in-Kind 4,605,634Grand Total $114,804,008
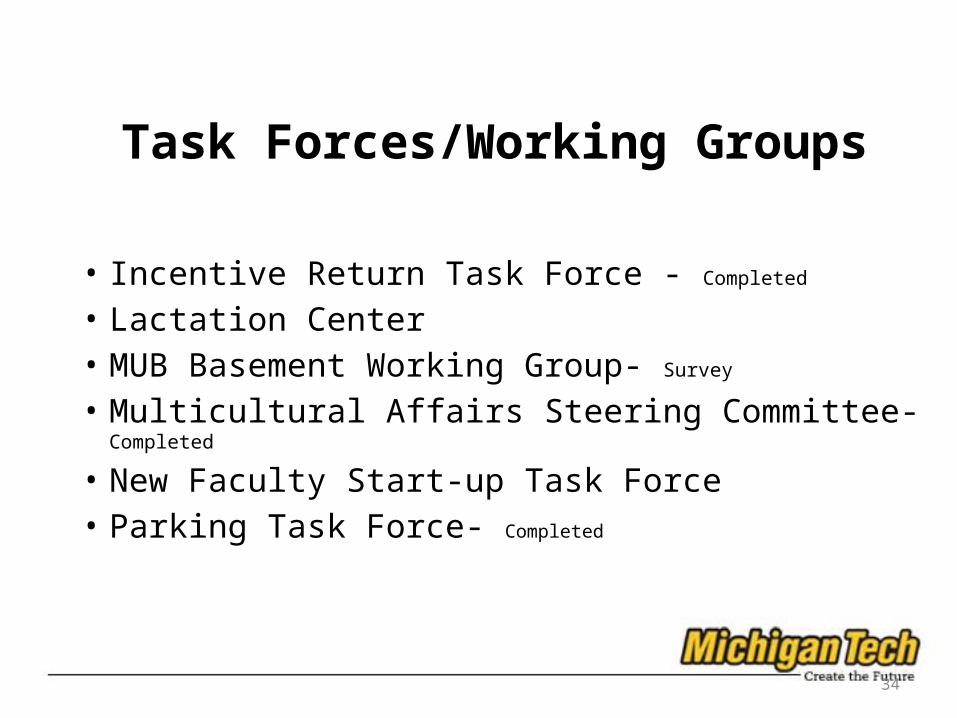
34
Task Forces/Working Groups
• Incentive Return Task Force - Completed
• Lactation Center• MUB Basement Working Group- Survey • Multicultural Affairs Steering Committee- Completed
• New Faculty Start-up Task Force• Parking Task Force- Completed

35
CAPITAL PROJECTS

36
New Student Apartment Building

37RESIDENTIAL APARTMENTS - Preliminary Design

38
First Floor Remodel inAdministration Building

39
The Great Museum Caper

40

41
Keweenaw Research Center

42
Harvard Business Review – Roaring Out of the Recession
Organization Characteristics:1) Multifaceted strategy but aimed in one direction2) Highly customized responses to challenges3) Operating efficiencies4) Did least amount of employee reductions