Campus Conversations Research-FINAL · 2018-02-13 · The American Research University Wilhelm von...
56
0
Transcript of Campus Conversations Research-FINAL · 2018-02-13 · The American Research University Wilhelm von...
0

Agenda
• Introduction – The Mission and Growth of Rutgers as a Research University• Key Metrics for Assessing Research Performance
• Research Focus and Productivity• National Recognition and Capacity
• Research Support • Some Ideas to Spur Growth
1

The American Research University
Wilhelm von Humboldt – architect of the Prussian education system
– Unity of research and teaching (Theory of Human Education, c 1793)
American research universities founded on the Humboldt model
1767-1835§ Land grant public research universities, 1862§ Association of American Universities, 1900
2

Milestones in the Development of Rutgers as a Research University1766 – Rutgers is founded as Queen’s College; the college is renamed Rutgers in 1825.
1864 – Per the federal Morrill Act, the state legislature chooses Rutgers (over Princeton) as New
Jersey’s land-grant institution.
1880 – The New Jersey Agricultural Experiment Station, aligned with Rutgers, is founded.
1924 – Rutgers College officially becomes Rutgers University.
1956 – Rutgers and the State of New Jersey enter into a compact, still in effect today, that affirms
Rutgers’ position as The State University and creates the Board of Governors.
1989 – Rutgers is invited to join the prestigious Association of American Universities, recognizing its
status as one of the top research universities in North America.
2012 – The New Jersey Medical and Health Sciences Education Restructuring Act is signed into
law, merging two medical schools and other entities of the former University of Medicine and
Dentistry into Rutgers, effective summer of 2013.
2013 – Rutgers joins the Committee on Institutional Cooperation (CIC), a consortium of outstanding
research universities. The CIC is renamed the Big Ten Academic Alliance in 2016.3

4
A Few Notes About This Presentation
A major focus of this presentation is on research spending, a measure of research activity in which comparative data is readily available through the National Science Foundation.
Emphasis is on spending in the science and engineering fields; significant investment by federal funding agencies.
Excellent work being done at Rutgers in non science and engineering; some of the most distinguished departments at Rutgers are in fields outside of science and engineering.
“It would be folly to set up a program under which research in the natural sciences and medicine was expanded at the cost of the social sciences, humanities, and other studies so essential to national well-being.”
Vannevar BushScience the Endless Frontier1945
5
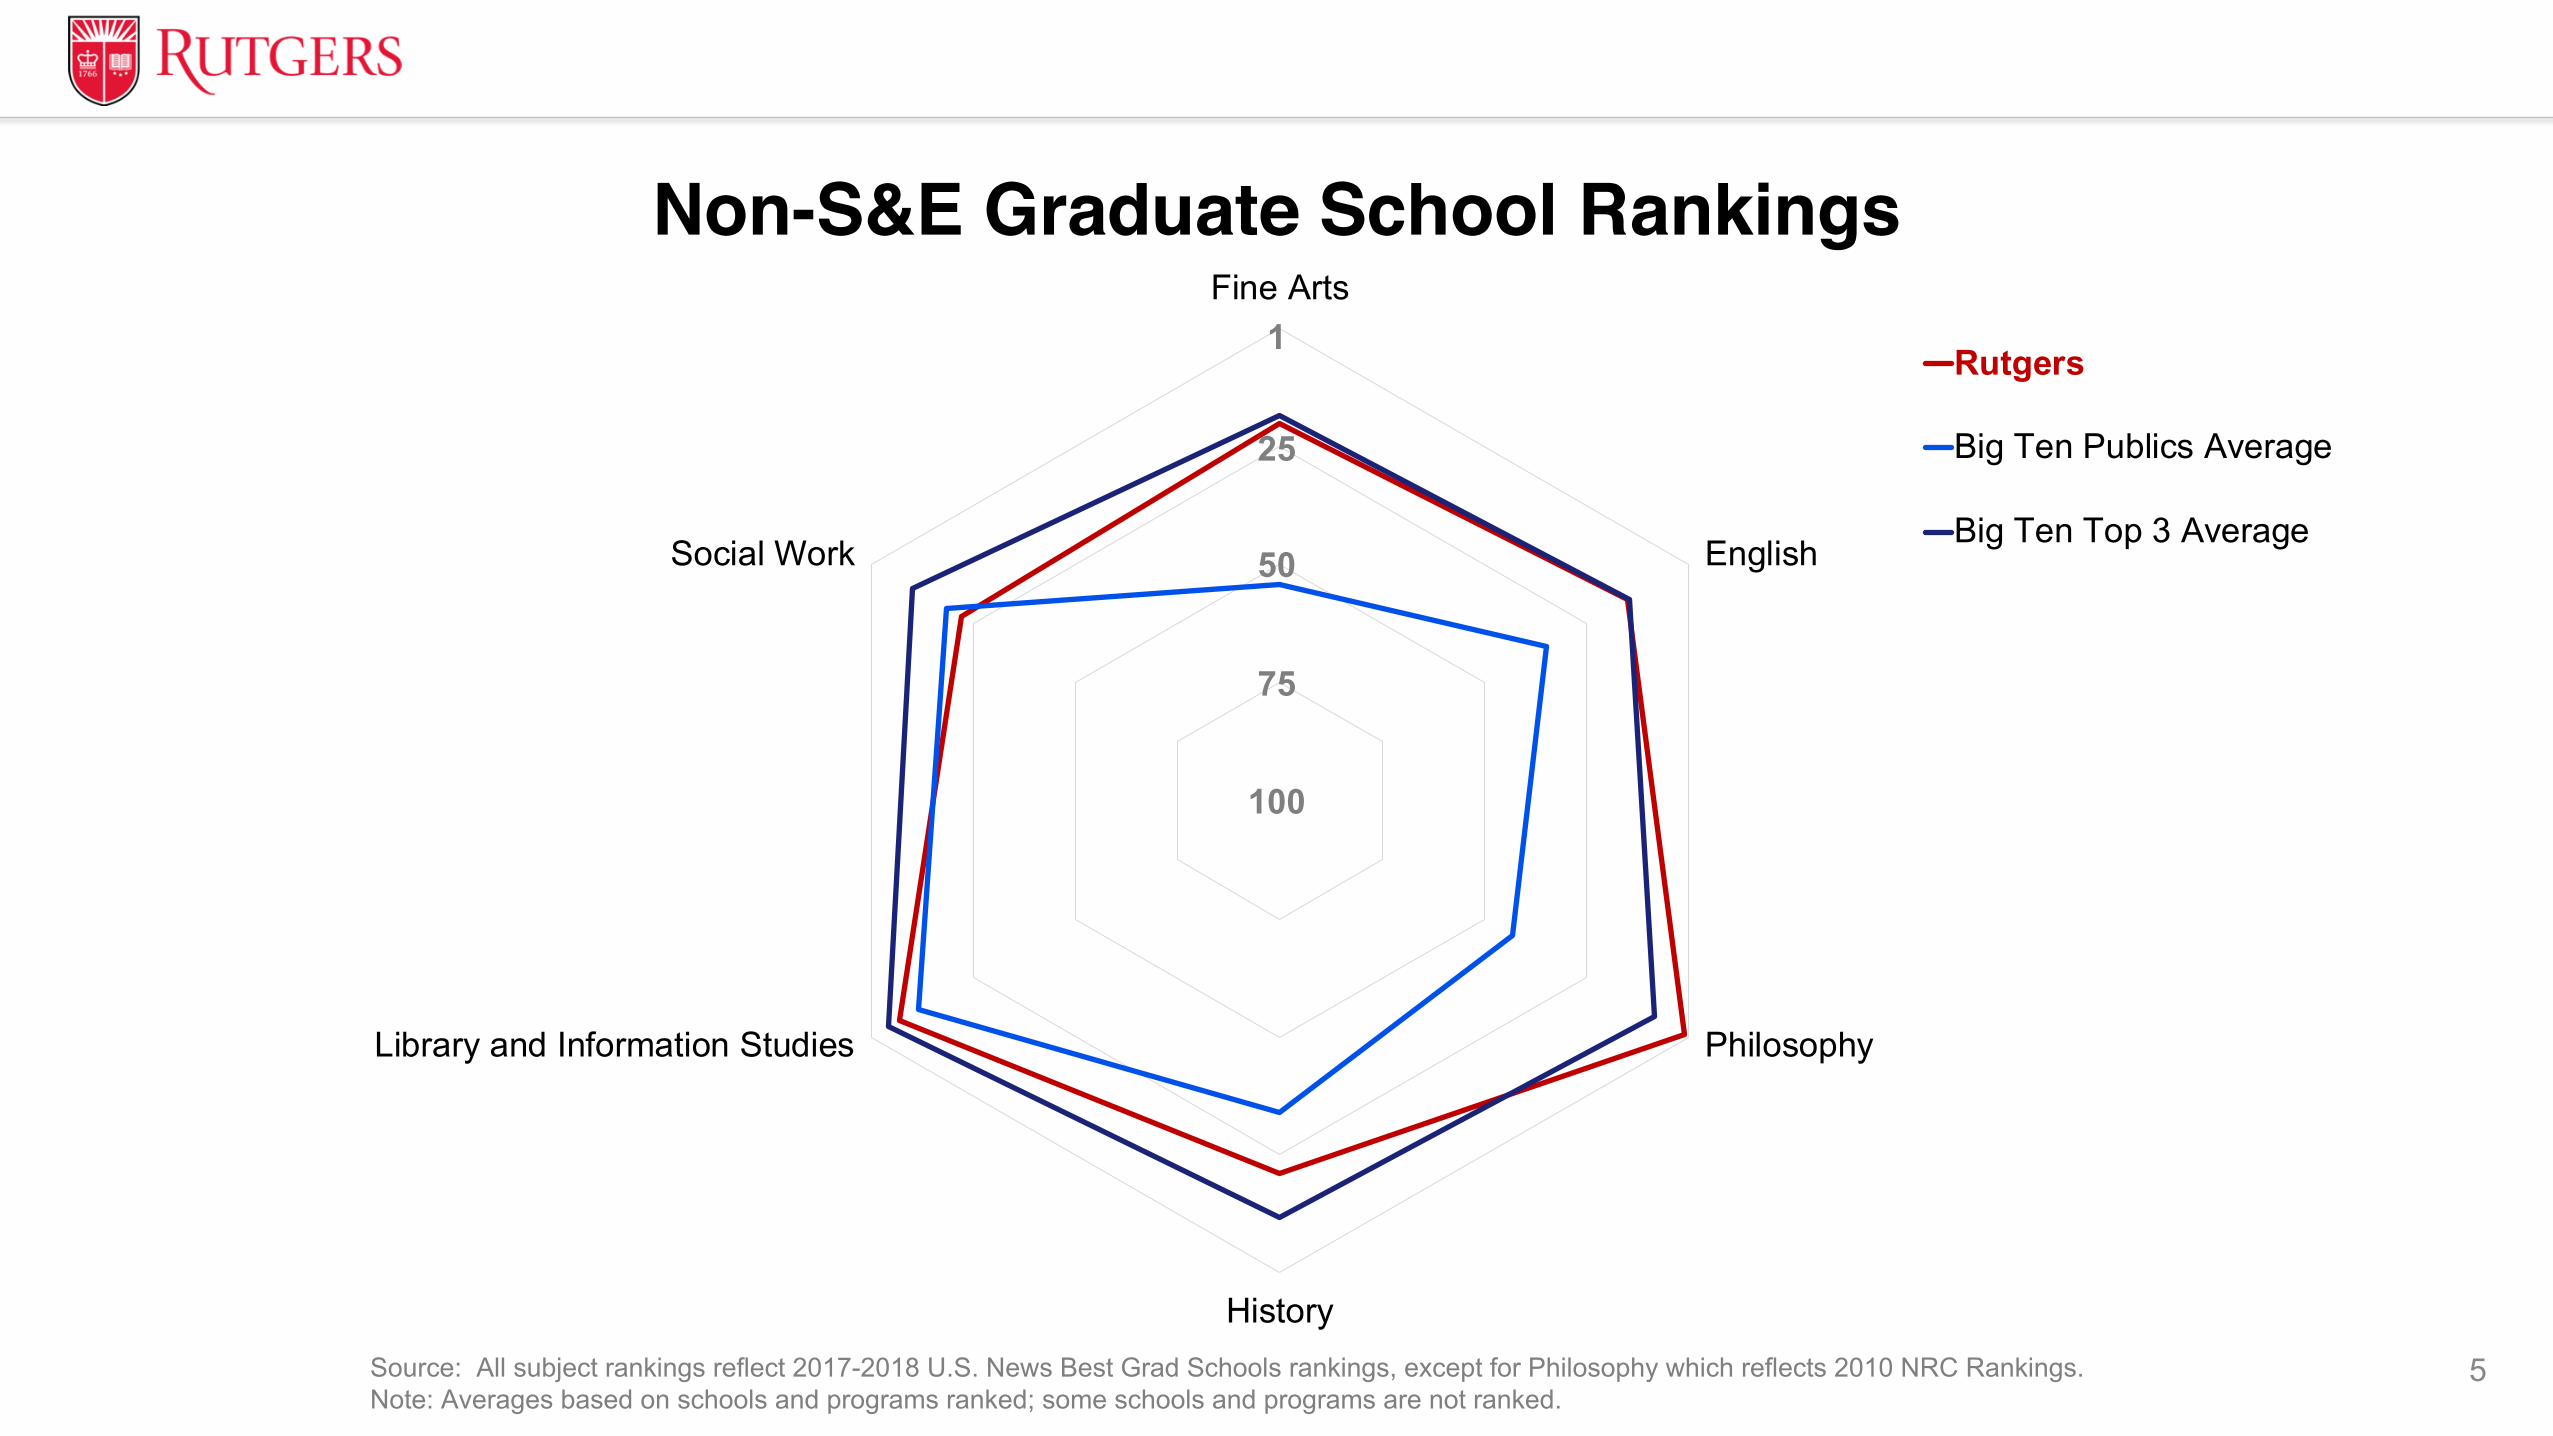
Fine Arts
English
Philosophy
History
Library and Information Studies
Social Work
Rutgers
Big Ten Publics Average
Big Ten Top 3 Average
Non-S&E Graduate School Rankings
Source: All subject rankings reflect 2017-2018 U.S. News Best Grad Schools rankings, except for Philosophy which reflects 2010 NRC Rankings.Note: Averages based on schools and programs ranked; some schools and programs are not ranked.
1
25
50
75
100
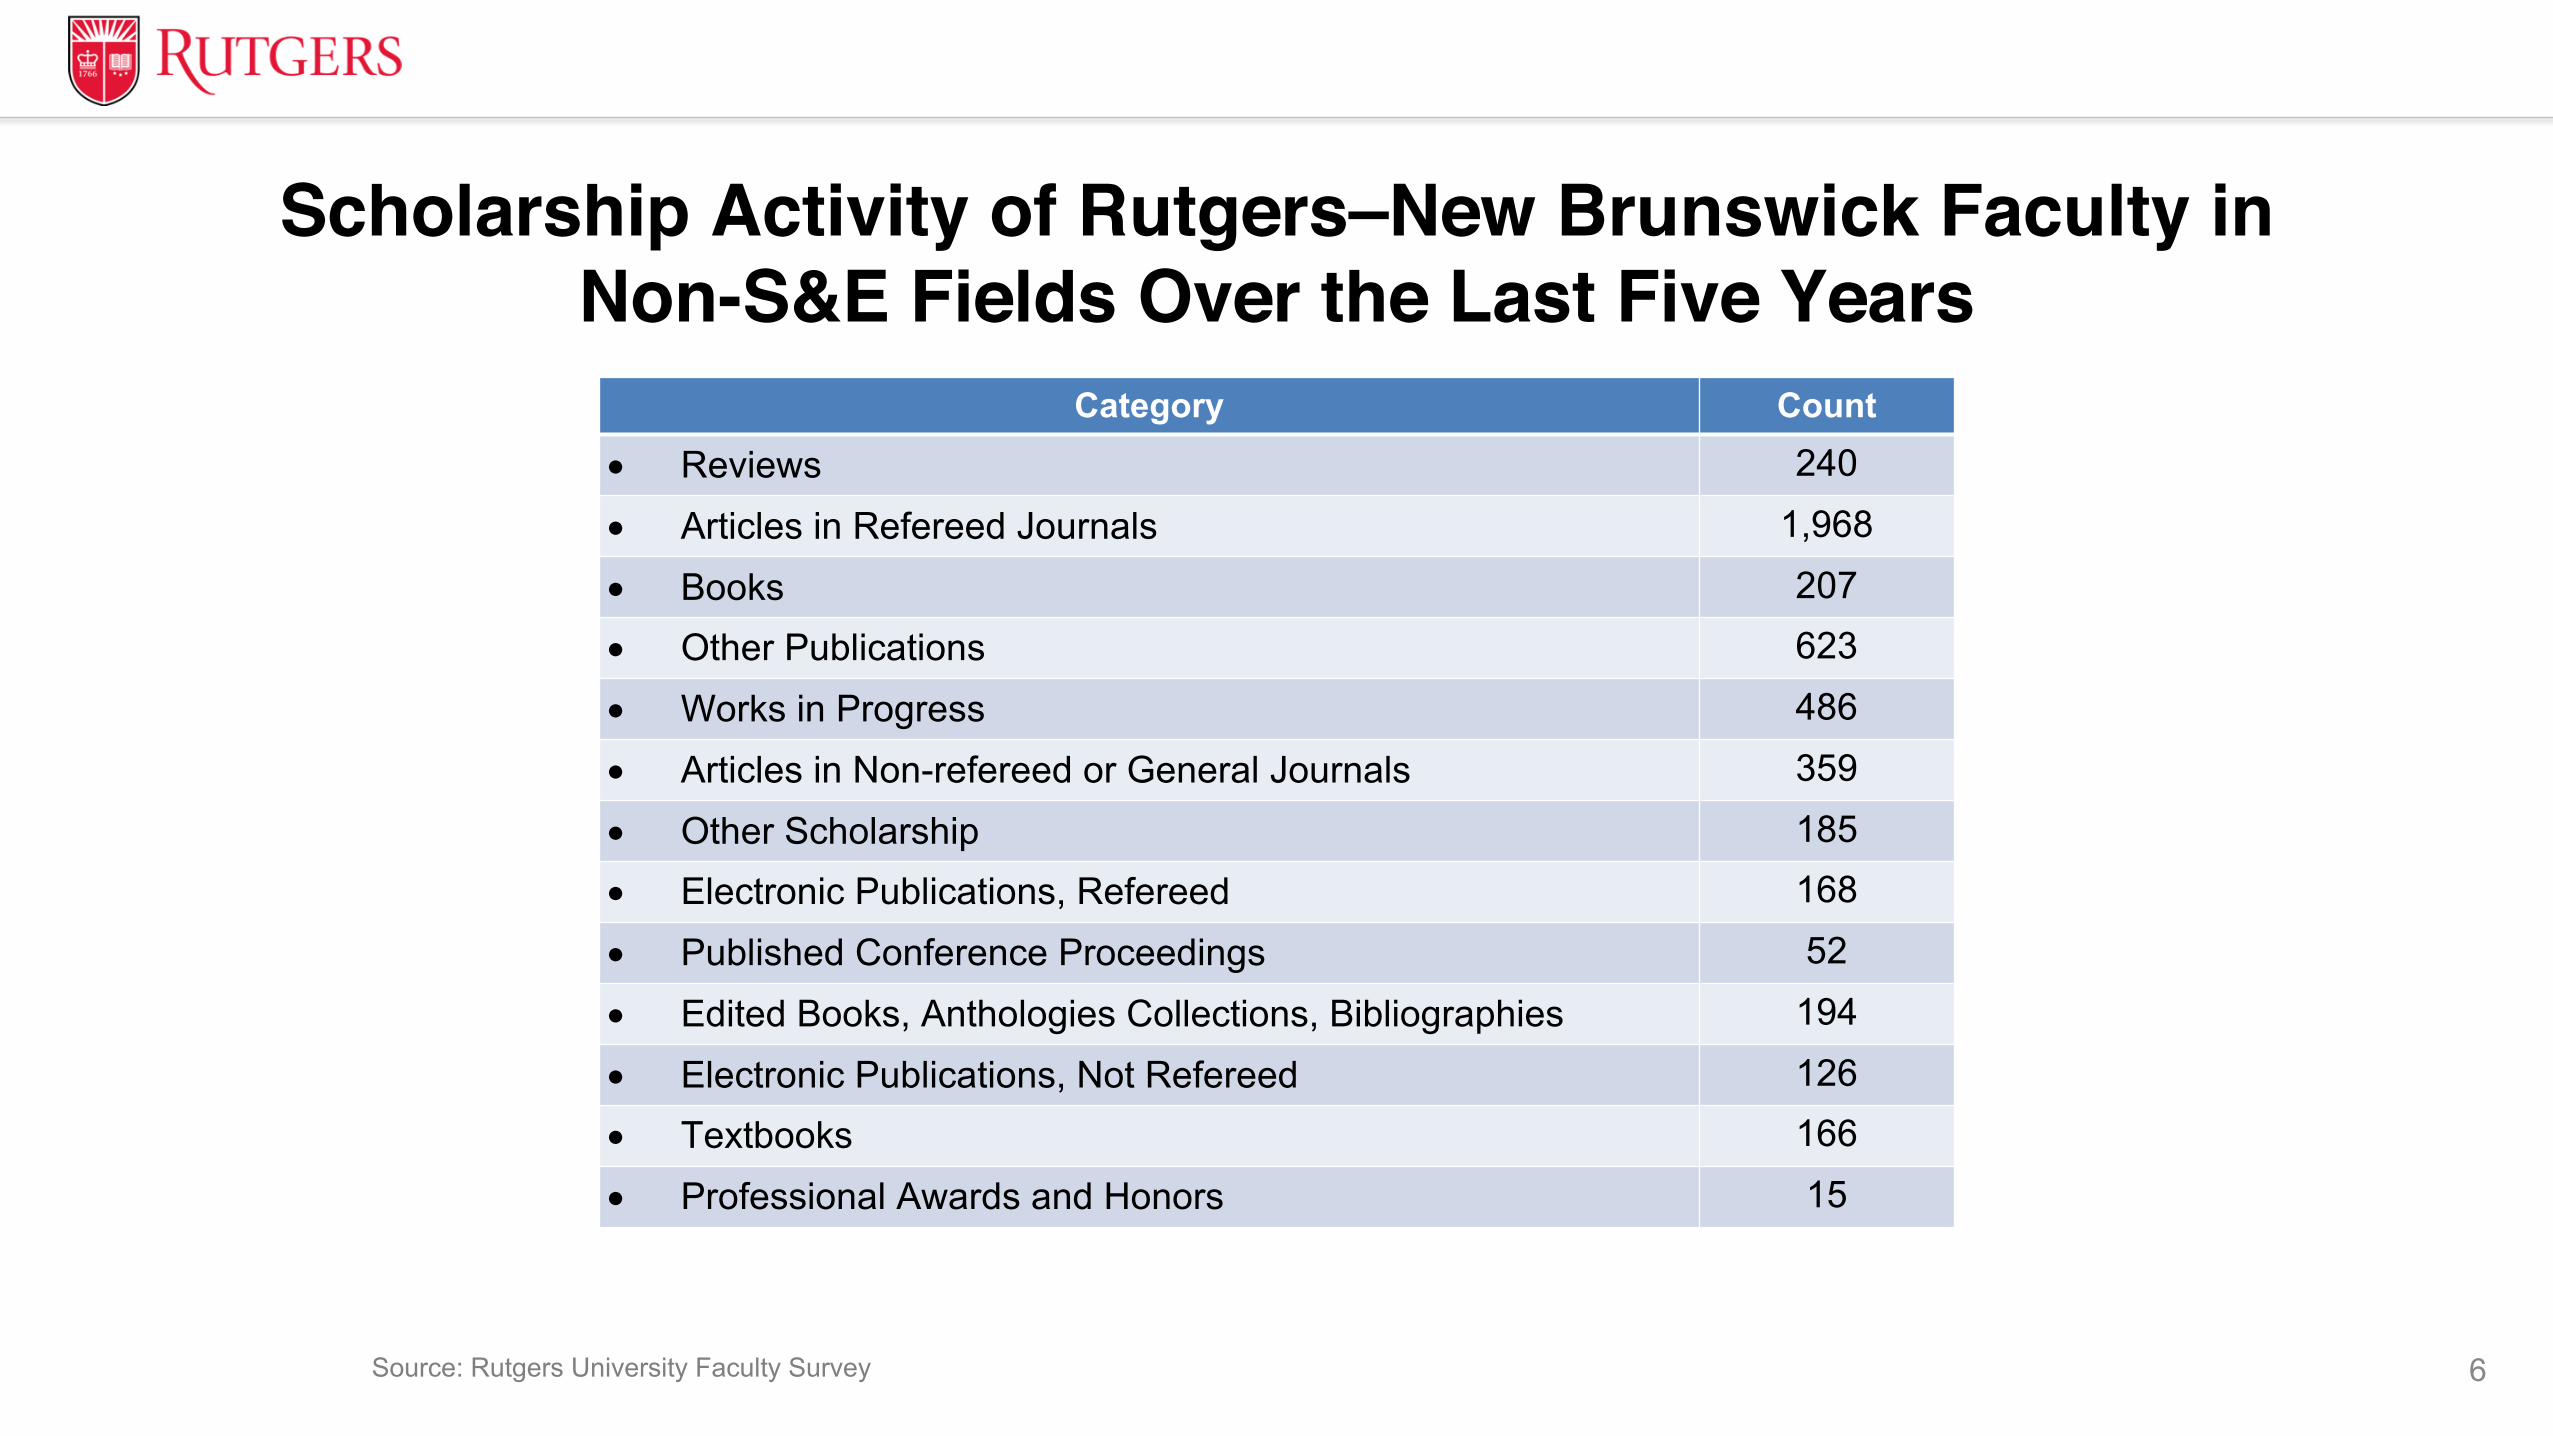
Category Count• Reviews 240
• Articles in Refereed Journals 1,968
• Books 207
• Other Publications 623
• Works in Progress 486
• Articles in Non-refereed or General Journals 359
• Other Scholarship 185
• Electronic Publications, Refereed 168
• Published Conference Proceedings 52
• Edited Books, Anthologies Collections, Bibliographies 194
• Electronic Publications, Not Refereed 126
• Textbooks 166
• Professional Awards and Honors 15
6
Scholarship Activity of Rutgers–New Brunswick Faculty in Non-S&E Fields Over the Last Five Years
Source: Rutgers University Faculty Survey

Major Academic and Achievement Awards• ACLS Fellowships – 2 • Guggenheim Fellowships – 13• American Academy of Arts and Letters – 3 • IREX Fellowship – 1
• Apexart Franchise Program Award -1 • Jerome Robbins Award – 1
• Avery Fisher Career Grants – 2 • MacArthur Fellowships – 2
• Bambi Award – 1 • Naumburg First Prize – 2
• Baryshnikov Fellowship – 1 • NEA Fellowships – 2
• Bessie Awards - 3 • NEH Fellowships – 3
• Bogliasco Fellowship – 1 • OBIE Award -1
• Doris Duke Award – 1 • Rockefeller Fellowships – 2
• Foundation for Contemporary Art Award – 1 • Rome Prizes – 2
• Fulbright Fellowships – 10 • Tony Awards – 2• Grammy Awards – 10 • Tony Nominations - 12• Grammy Nominations – 22
7
An Example of Faculty Excellence in a Non-S&E Discipline: Mason Gross School of the Arts Faculty
Note: Awards curated by the Mason Gross School of the Arts Administration

Key Metrics for AssessingResearch Performance
8
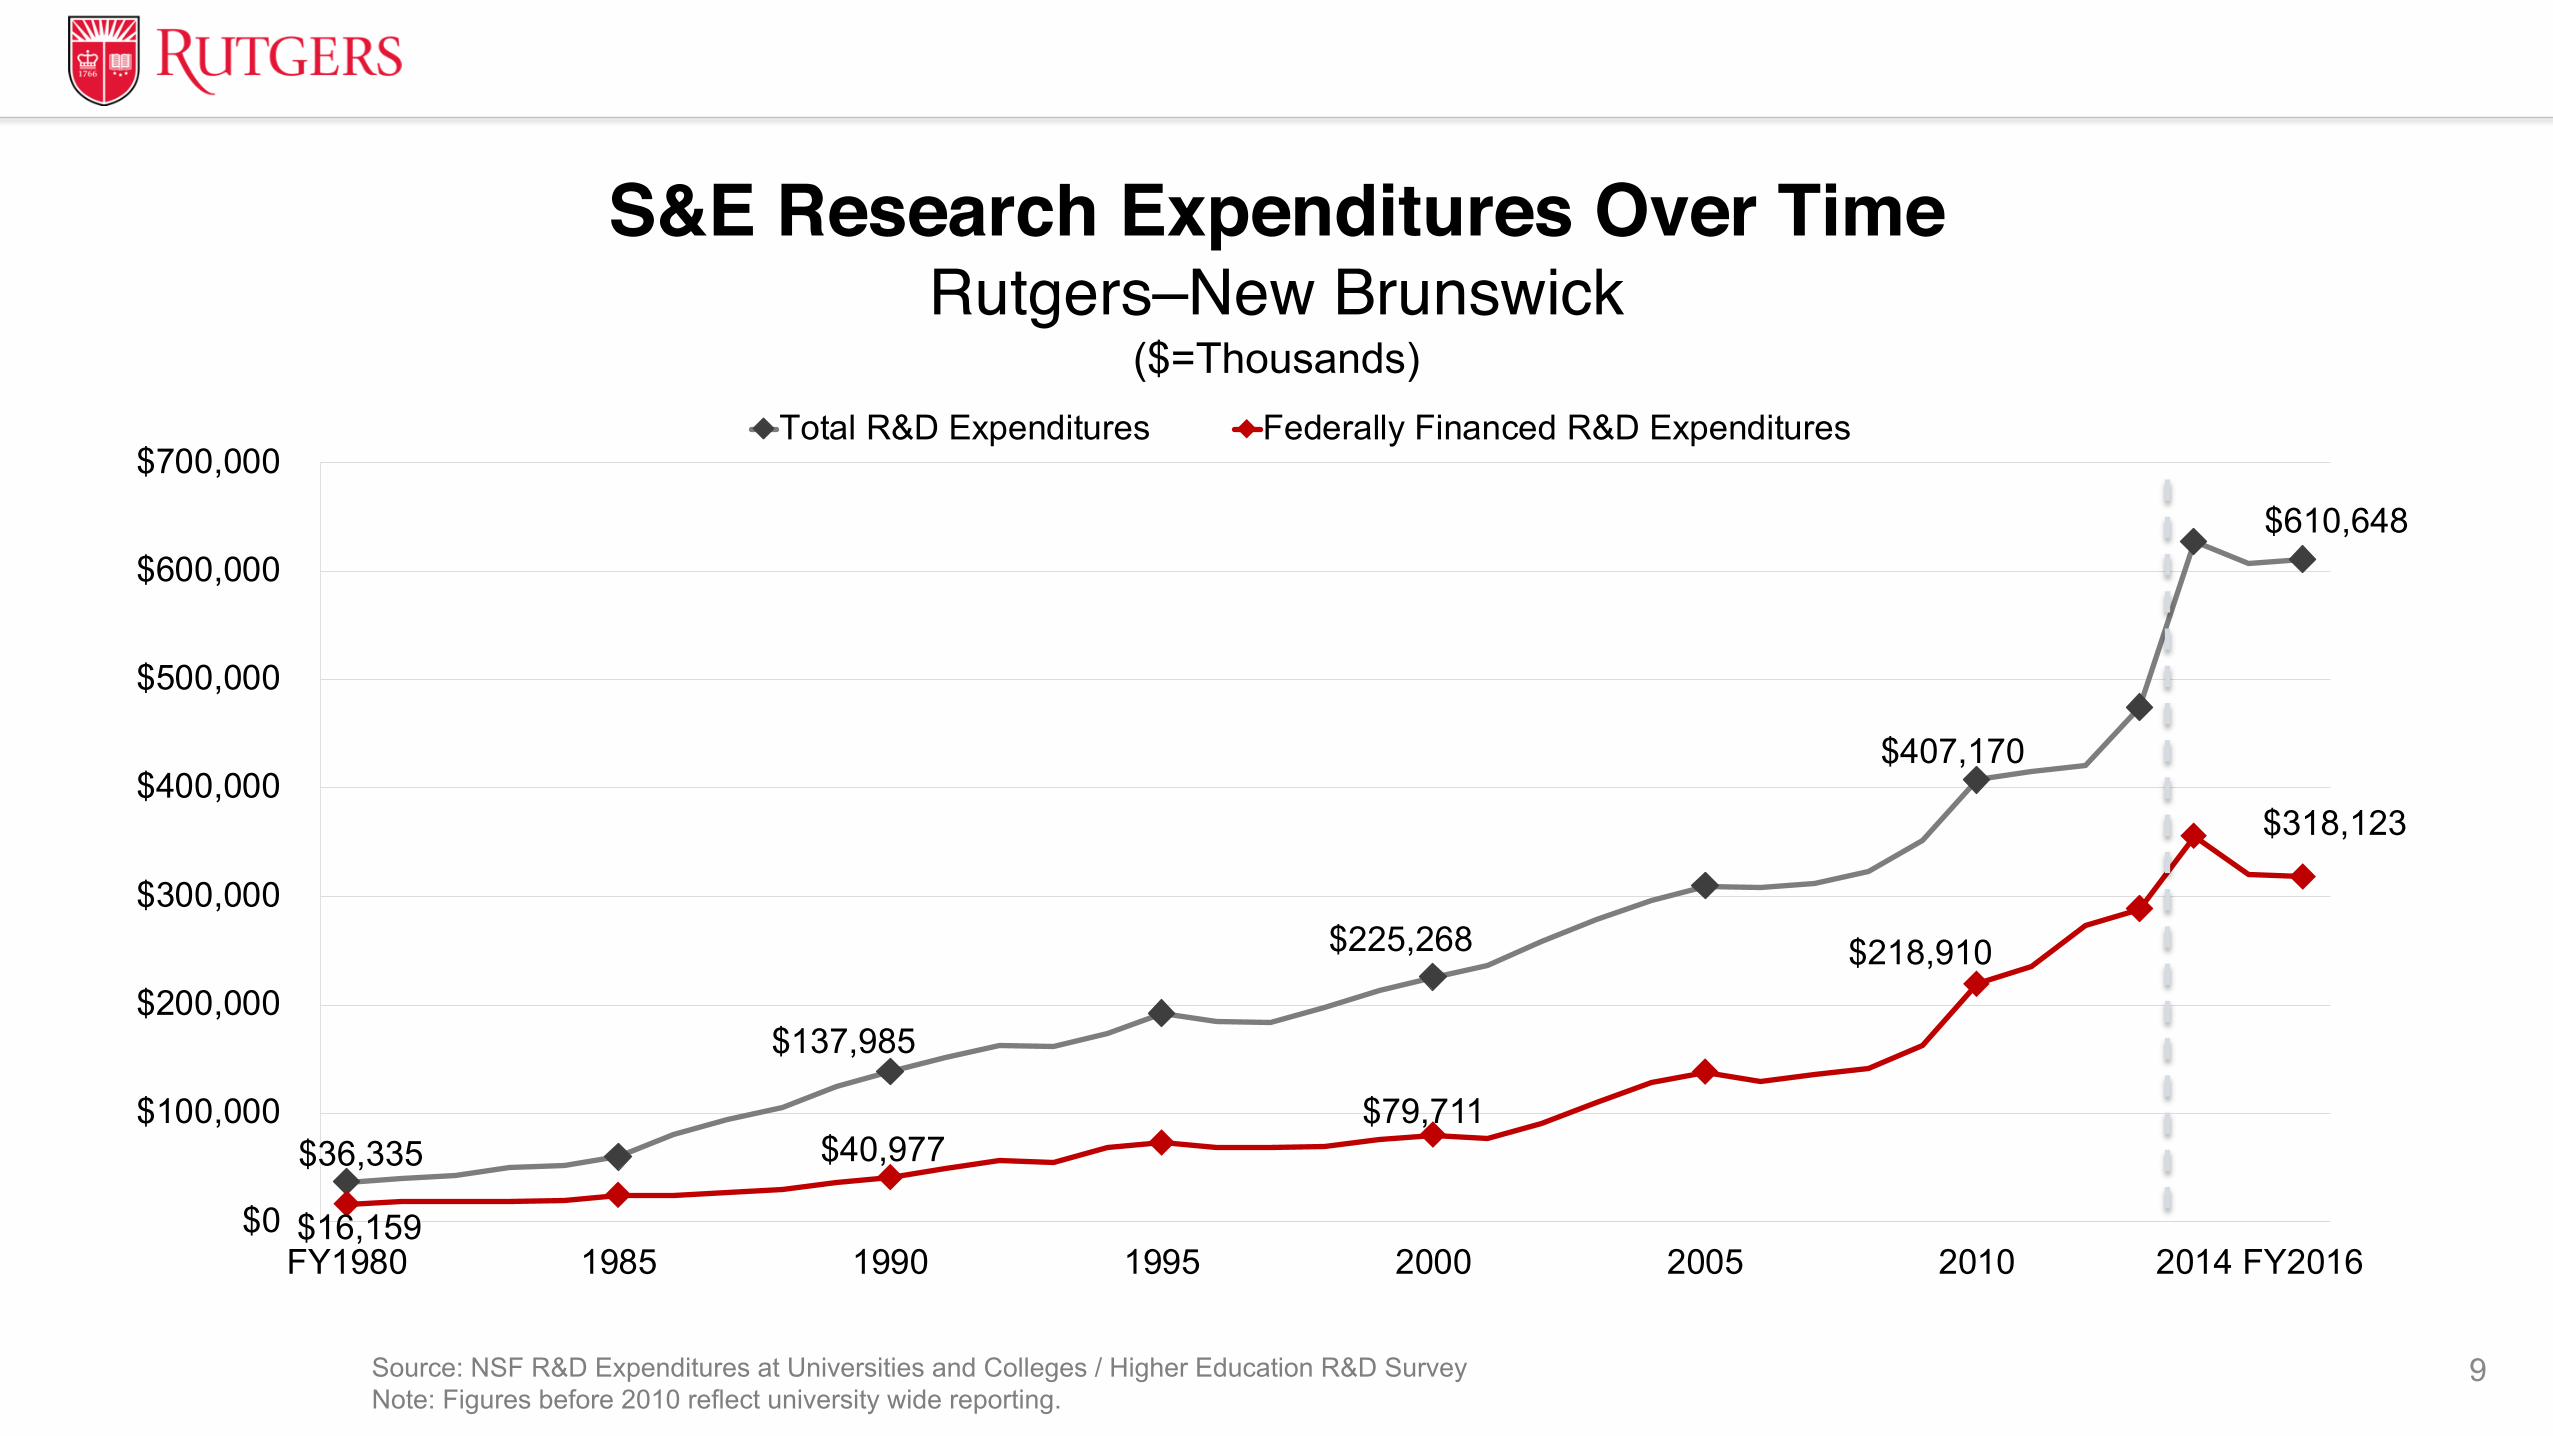
$36,335
$137,985
$225,268
$407,170
$610,648
$16,159
$40,977 $79,711
$218,910
$318,123
$0
$100,000
$200,000
$300,000
$400,000
$500,000
$600,000
$700,000
FY1980 1985 1990 1995 2000 2005 2010 2014 FY2016
Total R&D Expenditures Federally Financed R&D Expenditures Integration
Source: NSF R&D Expenditures at Universities and Colleges / Higher Education R&D SurveyNote: Figures before 2010 reflect university wide reporting.
9
S&E Research Expenditures Over Time Rutgers–New Brunswick
($=Thousands)

$36,335
$137,985
$225,268
$407,170 $415,502 $420,737 $474,192
$627,076 $607,257 $610,648
$0
$100,000
$200,000
$300,000
$400,000
$500,000
$600,000
$700,000
FY1980 1990 2000 2010 2011 2012 2013 2014 2015 FY2016
Federal Institutional State/Local Industry Other
Source: NSF R&D Expenditures at Universities and Colleges / Higher Education R&D SurveyNote: Figures before 2010 reflect university wide reporting.
10
S&E Research Expenditures Over Time – By SourceRutgers–New Brunswick
($=Thousands)
Integration

Source: NSF R&D Expenditures at Universities and Colleges / Higher Education R&D SurveyNote: Figures before 2010 reflect university wide reporting.
44.5%29.7% 35.4%
53.8% 52.1%
29.9%
40.4%38.3%
19.5% 26.4%
19.8%19.4% 11.4% 17.4% 12.8%
2.8% 4.9%3.9%
2.7% 4.3%3.0% 5.6% 11.0% 6.6% 4.5%
0%
10%
20%
30%
40%
50%
60%
70%
80%
90%
100%
FY1980 1990 2000 2010 FY2016
Federal Institutional State/Local Industry Other
11
Share of S&E Research Expenditures Over Time – By SourceRutgers–New Brunswick

Source: NSF R&D Expenditures at Universities and Colleges / Higher Education R&D Survey
Note: Reflects all reported expenditures, not just S&E. Indiana includes Bloomington & IUPUI. “Other” includes non-profit sources.12
$1,436,448
$1,157,680
$910,181
$825,561 $818,464
$630,212 $625,180 $613,369 $606,302 $566,619 $539,388
$473,362
$294,856
$0
$200,000
$400,000
$600,000
$800,000
$1,000,000
$1,200,000
$1,400,000
$1,600,000
Michigan Wisconsin Minnesota PennState
OhioState
Rutgers Illinois MichiganState
Purdue Indiana Maryland Iowa Nebraska
Federal Institutional State/Local Industry Other
Rutgers
All Research Expenditures – By SourceBig Ten Publics – FY2016
($=Thousands)
Source: NSF R&D Expenditures at Universities and Colleges / Higher Education R&D SurveyNote: Rutgers figures before 2010 reflect university wide reporting. Indiana includes Bloomington & IUPUI for 2016 and is university wide before 2010.
13
0.6%
1.2%
2.0%
0.7%
1.1%
1.7%
0.9%1.0%
1.6%
0.4%
1.1%
1.9%
0.5%
1.0%
1.7%
0.8%1.0%
1.6%1.5% 1.6%
2.7%
1.2%1.4%
1.0%
2.1%
1.0% 1.1%1.3%
1.7%
2.5%
1.5% 1.5%
2.1%
1.0%1.2%
2.1%
0%
1%
2%
3%
4%
Rutgers Big Ten PublicsAverage
Big Ten Top 3Average
Rutgers Big Ten PublicsAverage
Big Ten Top 3Average
Rutgers Big Ten PublicsAverage
Big Ten Top 3Average
1980 2000 2016
Total Federal State/Local Institutional
Rutgers Rutgers RutgersRutgers Rutgers RutgersRutgersRutgers
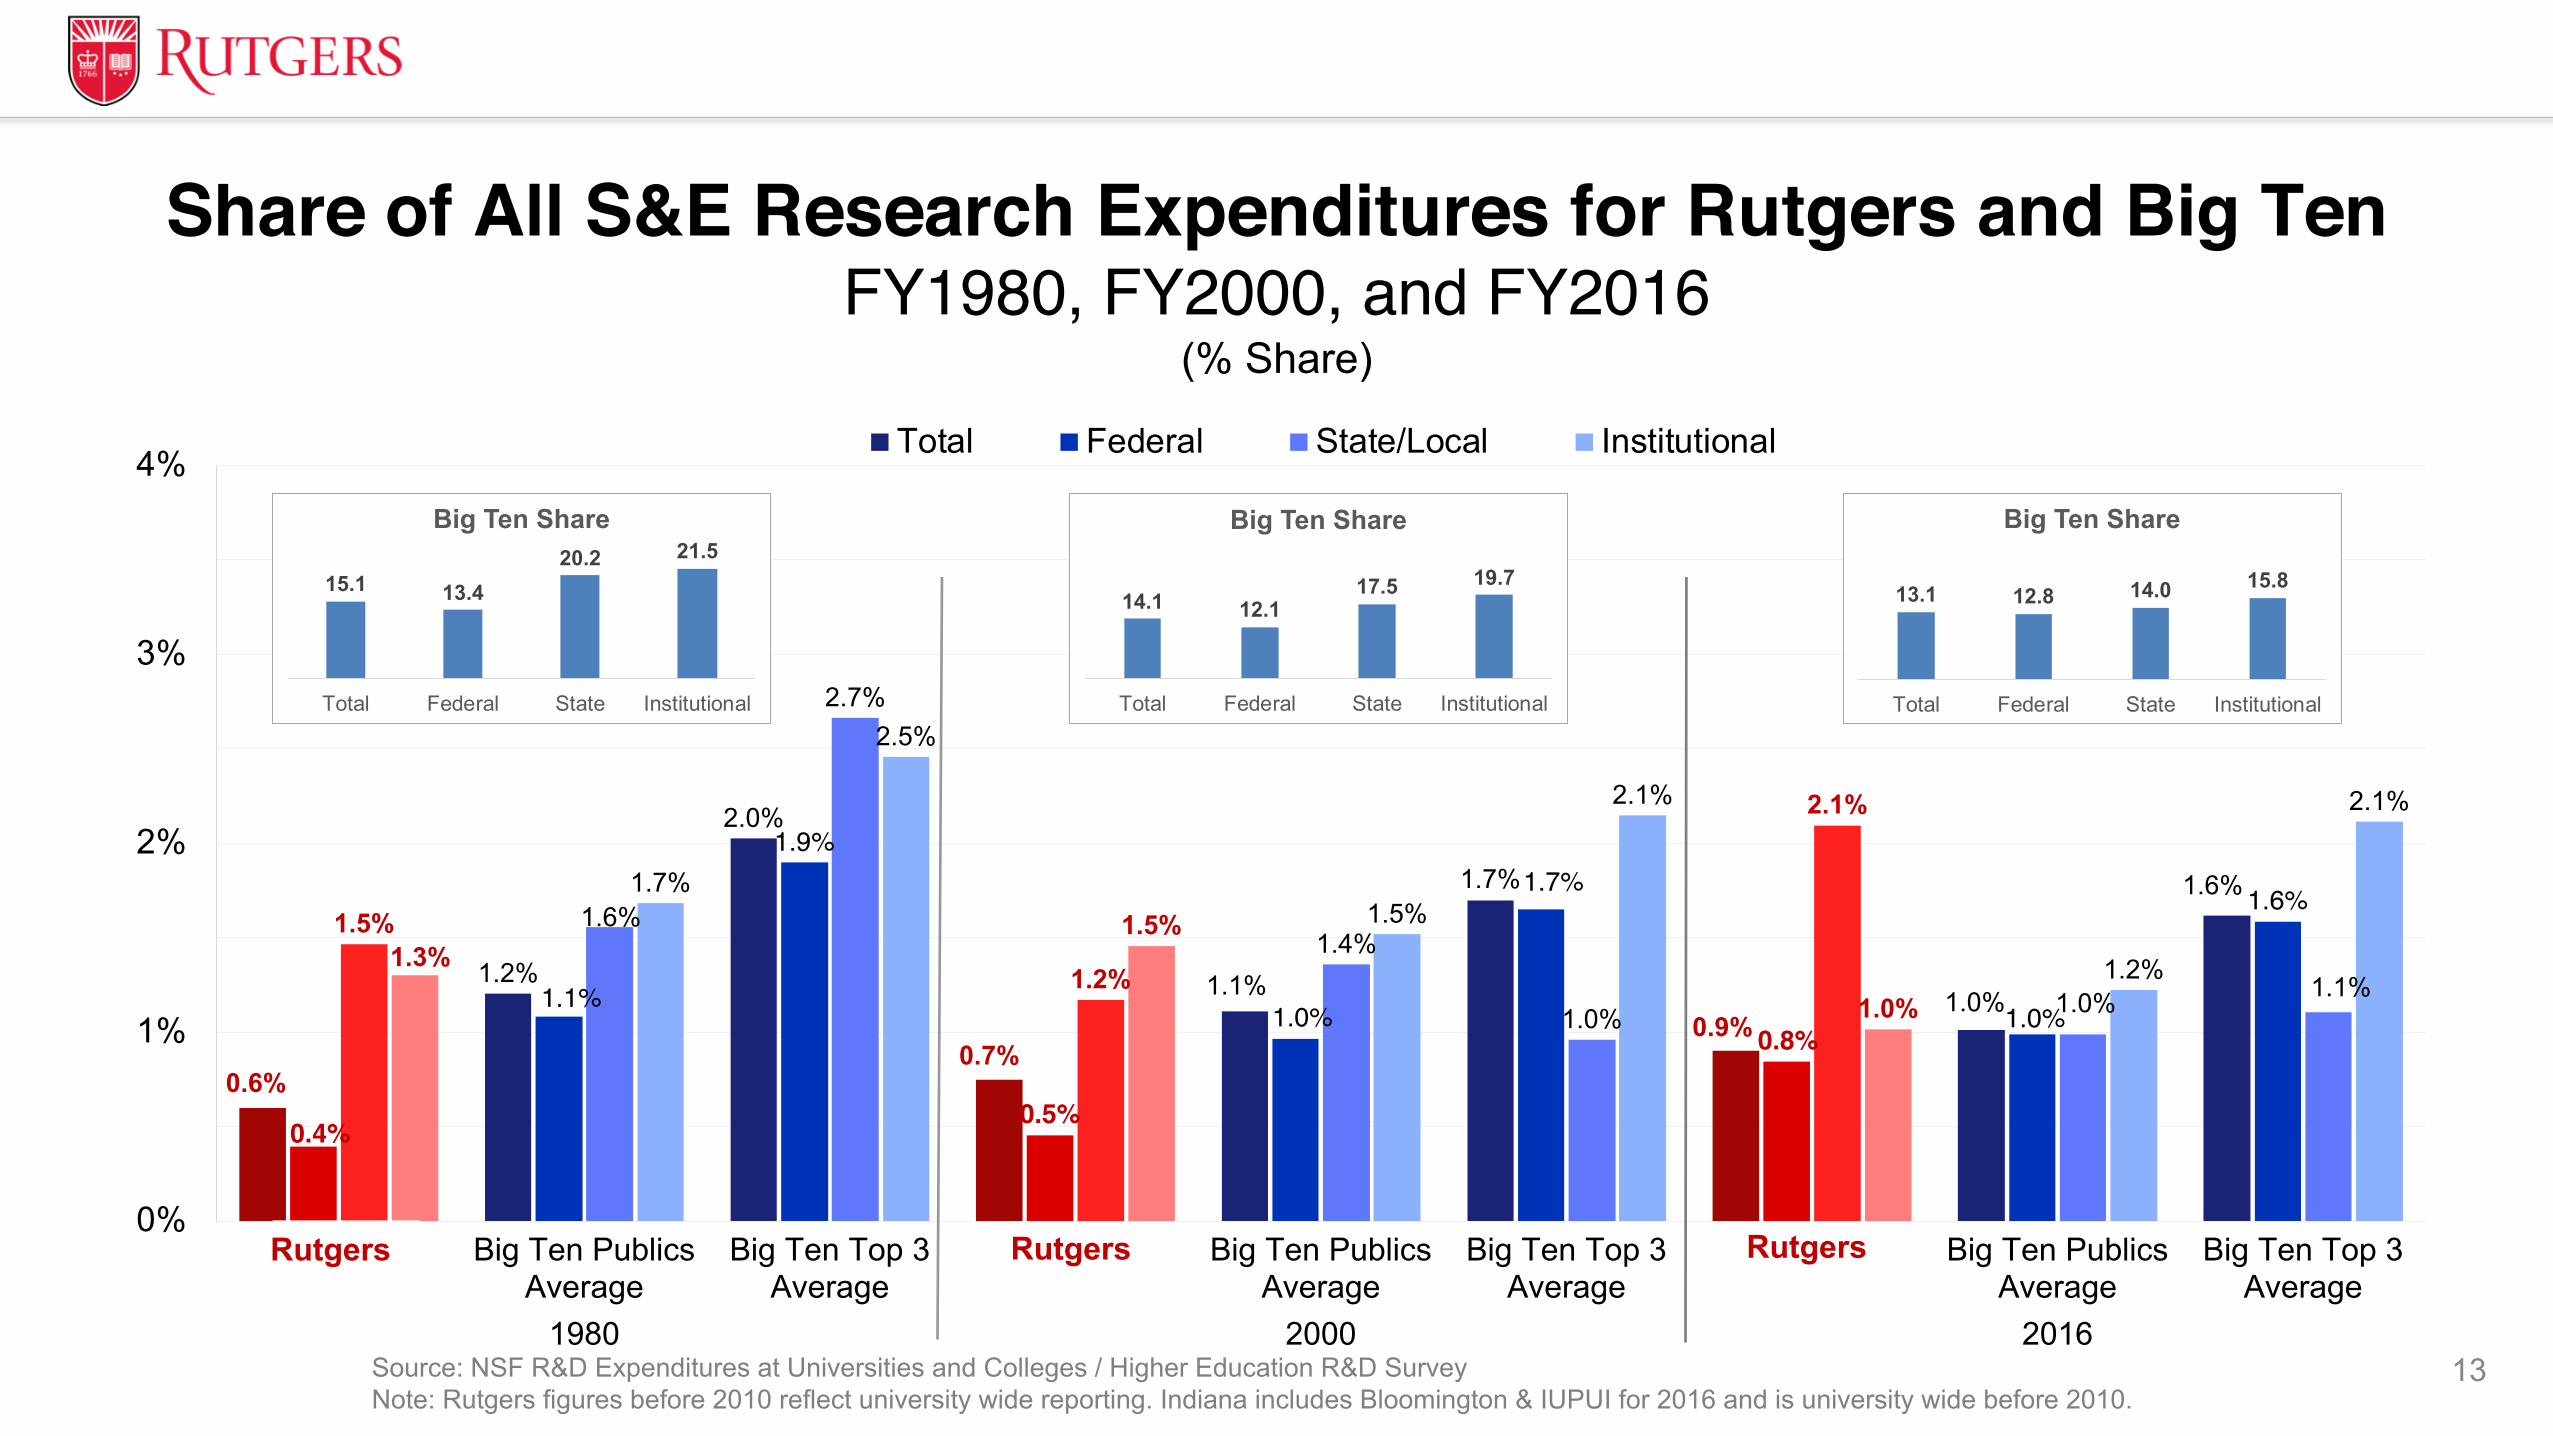
13.1 12.8 14.0 15.8
Total Federal State Institutional
Big Ten Share
15.1 13.420.2 21.5
Total Federal State Institutional
Big Ten Share
14.1 12.117.5 19.7
Total Federal State Institutional
Big Ten Share
Share of All S&E Research Expenditures for Rutgers and Big TenFY1980, FY2000, and FY2016
(% Share)

Source: NSF R&D Expenditures at Universities and Colleges / Higher Education R&D SurveyNote: Reflects all reported expenditures, not just S&E. Indiana includes Bloomington & IUPUI.
14
Michigan Wisconsin Minnesota Penn State Ohio State Rutgers Illinois MichiganState Purdue Indiana Maryland Iowa Nebraska
FY2010 $1,184,445 $1,029,295 $786,074 $770,449 $755,194 $428,432 $515,133 $431,373 $548,980 $473,714 $451,415 $444,034 $224,135FY2016 $1,436,448 $1,157,680 $910,181 $825,561 $818,464 $630,212 $625,180 $613,369 $606,302 $566,619 $539,388 $473,362 $294,856FY2010-FY2016 CAGR 2.8% 1.7% 2.1% 1.0% 1.2% 5.7% 2.8% 5.2% 1.4% 2.6% 2.6% 0.9% 4.0%
$0
$200,000
$400,000
$600,000
$800,000
$1,000,000
$1,200,000
$1,400,000
$1,600,000FY2010 FY2016 FY2010-FY2016 CAGR
Rutgers
Compounded Annual Growth Rate of Total Research ExpendituresBig Ten Publics, FY2010, and FY2016
($=Thousands)
A compound annual growth rate (CAGR) is the mean annual growth rate over a specified period of time

15
Discussion
Research Focus and Faculty Productivity
16

17
42.4% 40.1% 36.8% 39.3%
57.3% 56.8% 58.5%
20.5% 20.8%20.6% 18.7%
14.7% 15.2% 16.7%10.8% 10.8%8.9% 7.2%
5.7% 5.7% 4.8%5.9% 6.0% 14.5% 15.1%
6.6% 5.0% 4.6%
16.1% 17.0% 14.1% 13.4% 12.4% 14.1% 12.1%
0%
10%
20%
30%
40%
50%
60%
70%
80%
90%
100%
FY10 FY11 FY12 FY13 FY14 FY15 FY16
Health/Human Services NSF Defense Agriculture Energy NASA Other
Federal-Funded Research Expenditures – By AgencyRutgers–New Brunswick – FY2010-FY2016
Source: NSF R&D Expenditures at Universities and Colleges / Higher Education R&D SurveyNote: Reflects all reported expenditures, not just S&E.
Integration
Source: NSF R&D Expenditures at Universities and Colleges / Higher Education R&D SurveyNote: Reflects all reported expenditures, not just S&E. Indiana includes Bloomington & IUPUI.
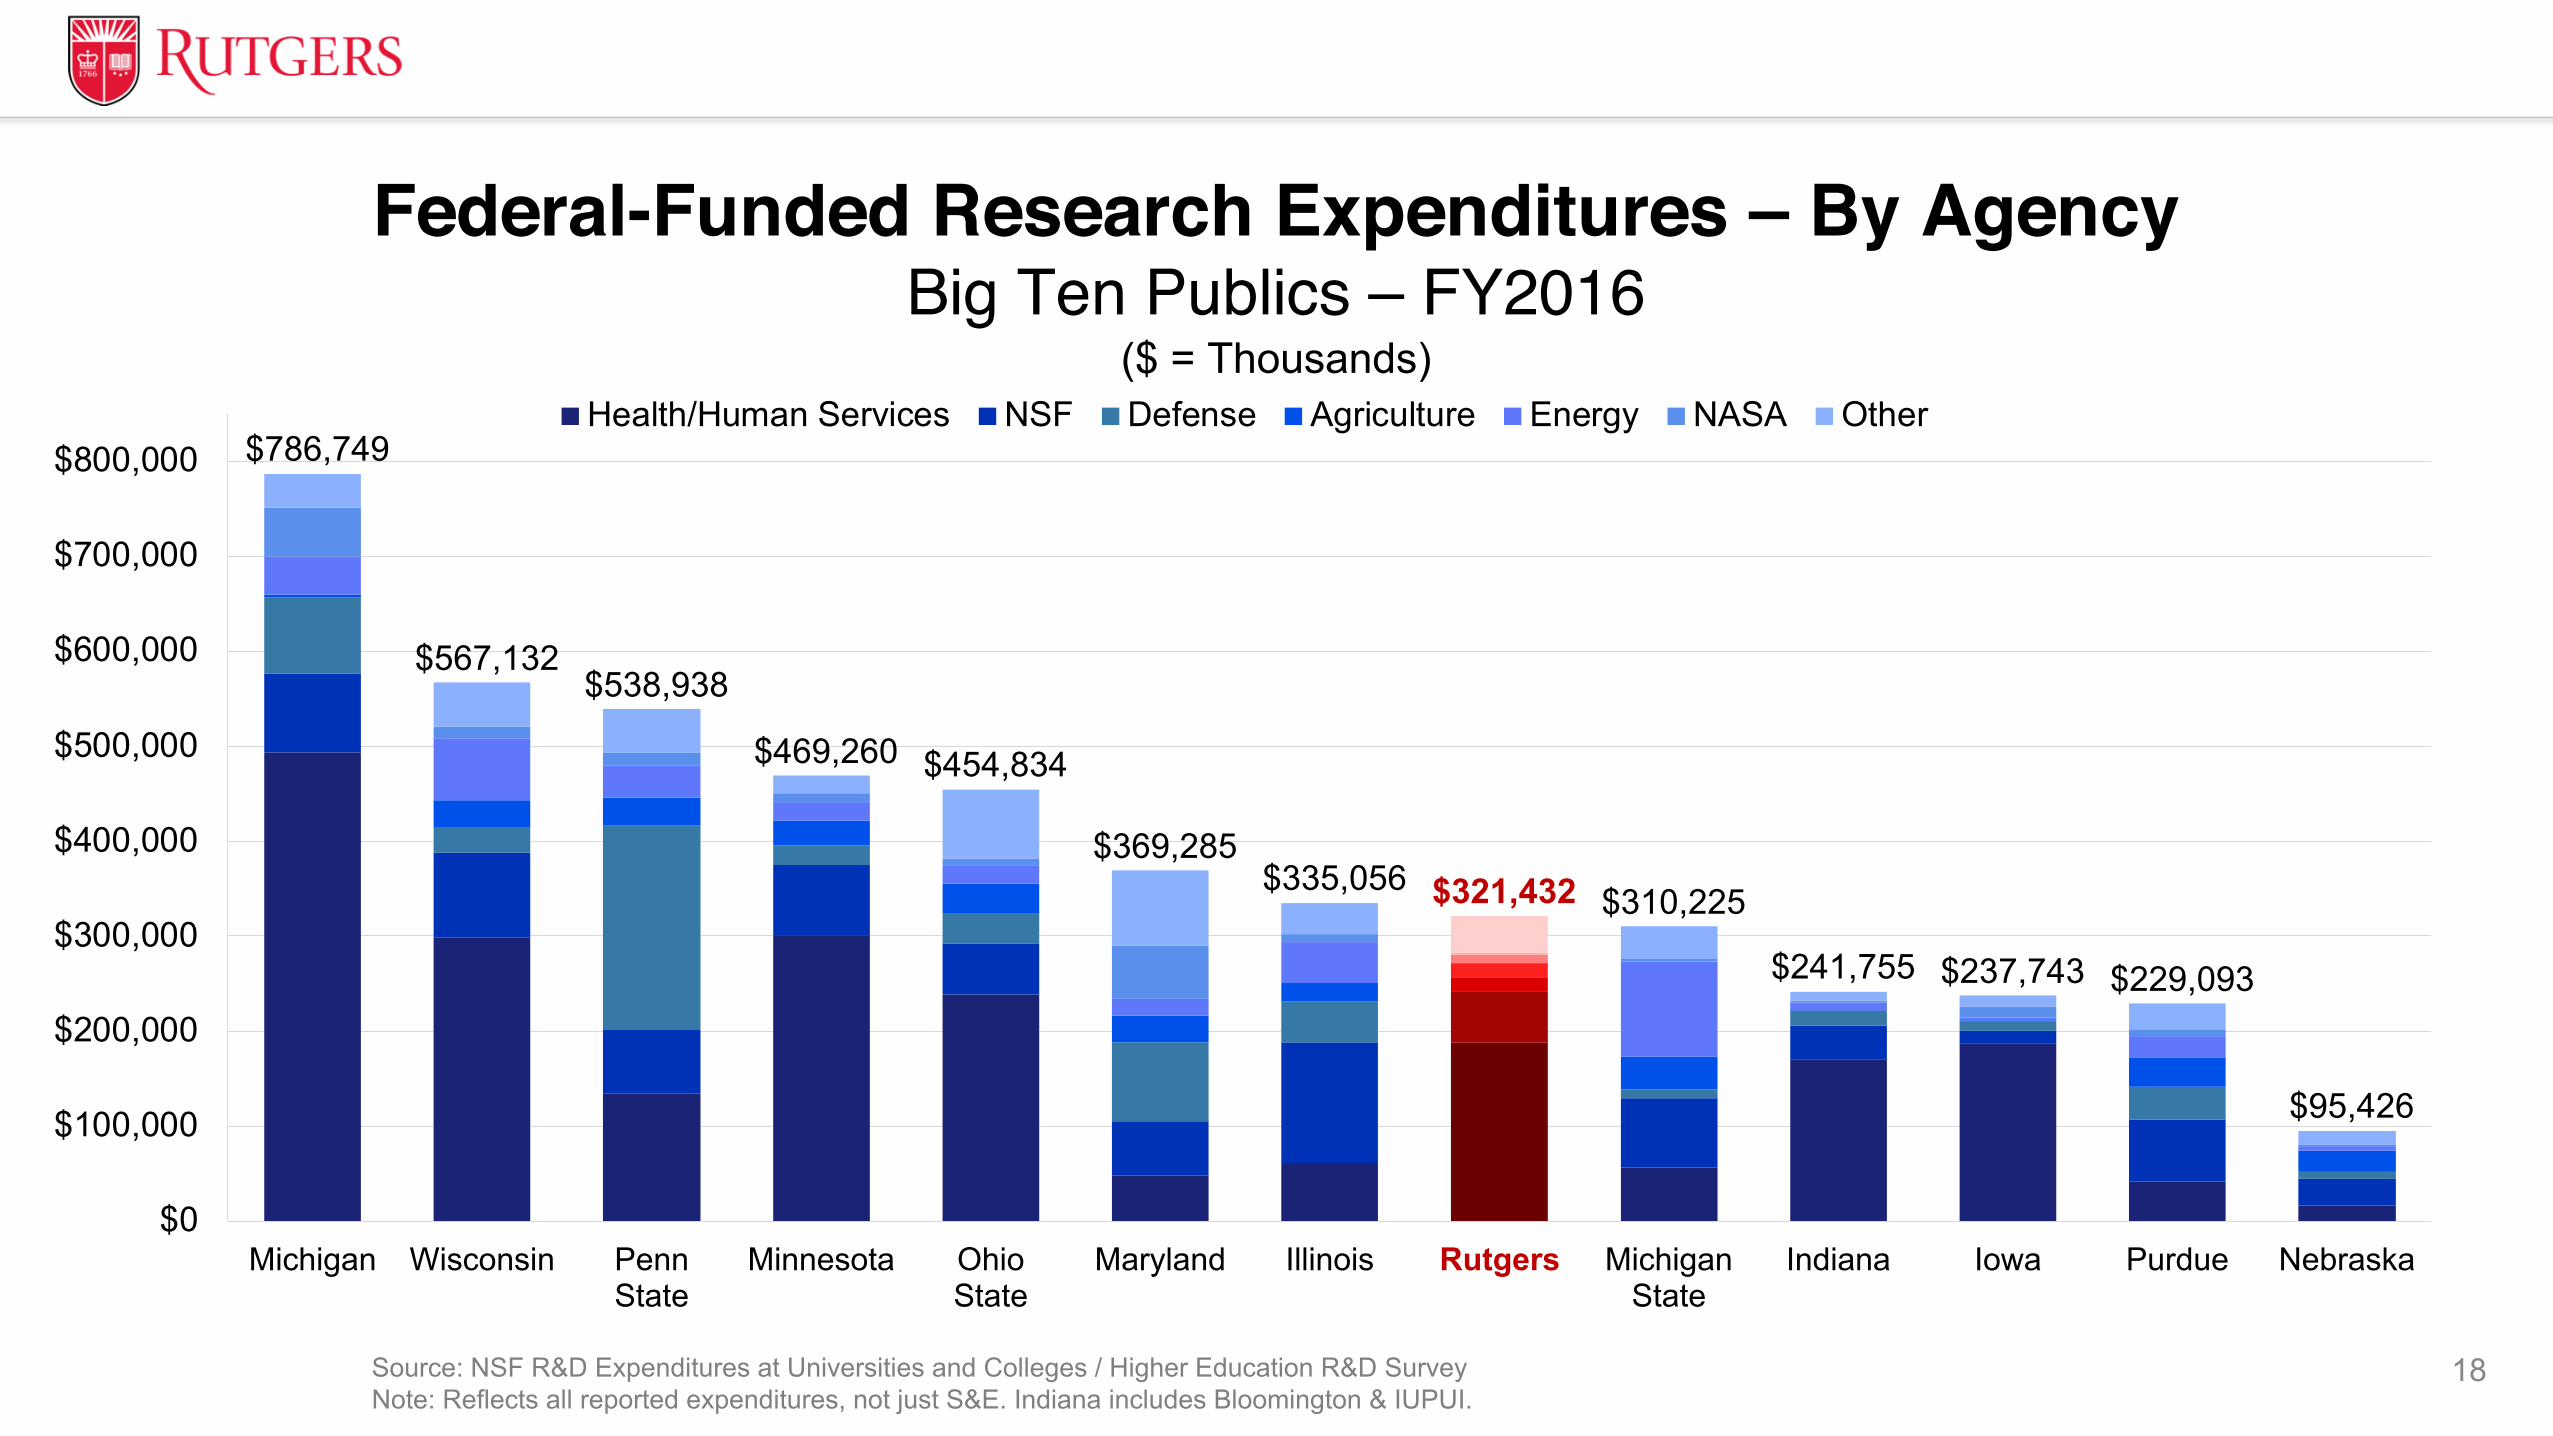
$786,749
$567,132 $538,938
$469,260 $454,834
$369,285 $335,056 $321,432 $310,225
$241,755 $237,743 $229,093
$95,426
$0
$100,000
$200,000
$300,000
$400,000
$500,000
$600,000
$700,000
$800,000
Michigan Wisconsin PennState
Minnesota OhioState
Maryland Illinois Rutgers MichiganState
Indiana Iowa Purdue Nebraska
Health/Human Services NSF Defense Agriculture Energy NASA Other
Rutgers
18
Federal-Funded Research Expenditures – By AgencyBig Ten Publics – FY2016
($ = Thousands)

Source: NSF R&D Expenditures at Universities and Colleges / Higher Education R&D SurveyNote: Reflects all reported expenditures, not just S&E. Big Ten Publics percentages do not include Rutgers. Indiana includes Bloomington & IUPUI.
19
48.9%
44.2%
58.5%
12.7%
16.5%
16.7%
17.0%
12.5%
4.8%
3.2%
5.5%
4.6%
7.4%
8.1%
6.8%
9.3%
12.1%
Big Ten Top 3
Big Ten Publics
Rutgers
Health/Human Services NSF Defense Agriculture Energy NASA Other
Rutgers
Share of Federal Research ExpendituresBy Government Agency – FY2016

41.2% 42.0% 45.7% 46.3%57.7% 58.3% 57.9%
12.3% 13.8%14.1% 12.1%
10.0% 11.4% 11.8%11.8% 13.0%
12.0% 9.4%7.5% 6.9% 7.1%
6.6% 6.2% 7.0%6.6%
6.0% 6.6% 7.0%11.0% 11.3% 8.9% 11.9%7.6% 6.2% 5.2%5.0% 3.9% 3.3% 3.9% 2.6% 3.4% 3.1%
0%
10%
20%
30%
40%
50%
60%
70%
80%
90%
100%
FY10 FY11 FY12 FY13 FY14 FY15 FY16
Life Science Engineering Physical Science Geo/Atmospheric/Ocean Social Science
Non-Science/Engineering Psychology Mathematical Computer/Information Science, Other
Source: NSF R&D Expenditures at Universities and Colleges / Higher Education R&D Survey
Note: Reflects all reported expenditures, not just S&E.
20
Integration
Total Research Expenditures – By Broad DisciplineRutgers-New Brunswick – FY2010-FY2016
(% Shares)

Source: NSF R&D Expenditures at Universities and Colleges / Higher Education R&D SurveyNote: Reflects all reported expenditures, not just S&E. Indiana includes Bloomington & IUPUI.
$1,436,448
$1,157,680
$910,181 $825,561 $818,464
$630,212 $625,180 $613,369 $606,302 $566,619 $539,388 $473,362
$294,856
$0
$200,000
$400,000
$600,000
$800,000
$1,000,000
$1,200,000
$1,400,000
$1,600,000
Michigan Wisconsin Minnesota PennState
OhioState
Rutgers Illinois MichiganState
Purdue Indiana Maryland Iowa Nebraska
Science, OtherComputer/InformationMathematicalPsychologyNon-Science/Non-EngineeringSocial ScienceGeo/Atmospheric/OceanPhysical ScienceEngineeringLife Science
Rutgers
21
Total Research Expenditures – By Broad DisciplineBig Ten Publics – FY2016
($=Thousands)

58.5%
50.6%
57.9%
16.0%
18.7%
11.8%
4.9%
8.2%
7.1% 7.0%
6.8%
5.0%
5.2%
6.4%
6.7%
0% 10% 20% 30% 40% 50% 60% 70% 80% 90% 100%
Big Ten Top 3
Big Ten Publics
Rutgers
Life Science Engineering Physical Science Geo/Atmospheric/Ocean Social ScienceNon-Science/Engineering Psychology Mathematical Computer/Information Science, Other
Source: NSF R&D Expenditures at Universities and Colleges / Higher Education R&D SurveyNote: Reflects all reported expenditures, not just S&E. Does not include ARRA expenditures. Big Ten Publics percentages do not include Rutgers.
Rutgers
22
Total Research Expenditures – By Broad DisciplineRutgers and Big Ten Publics – FY2016
(% Shares)
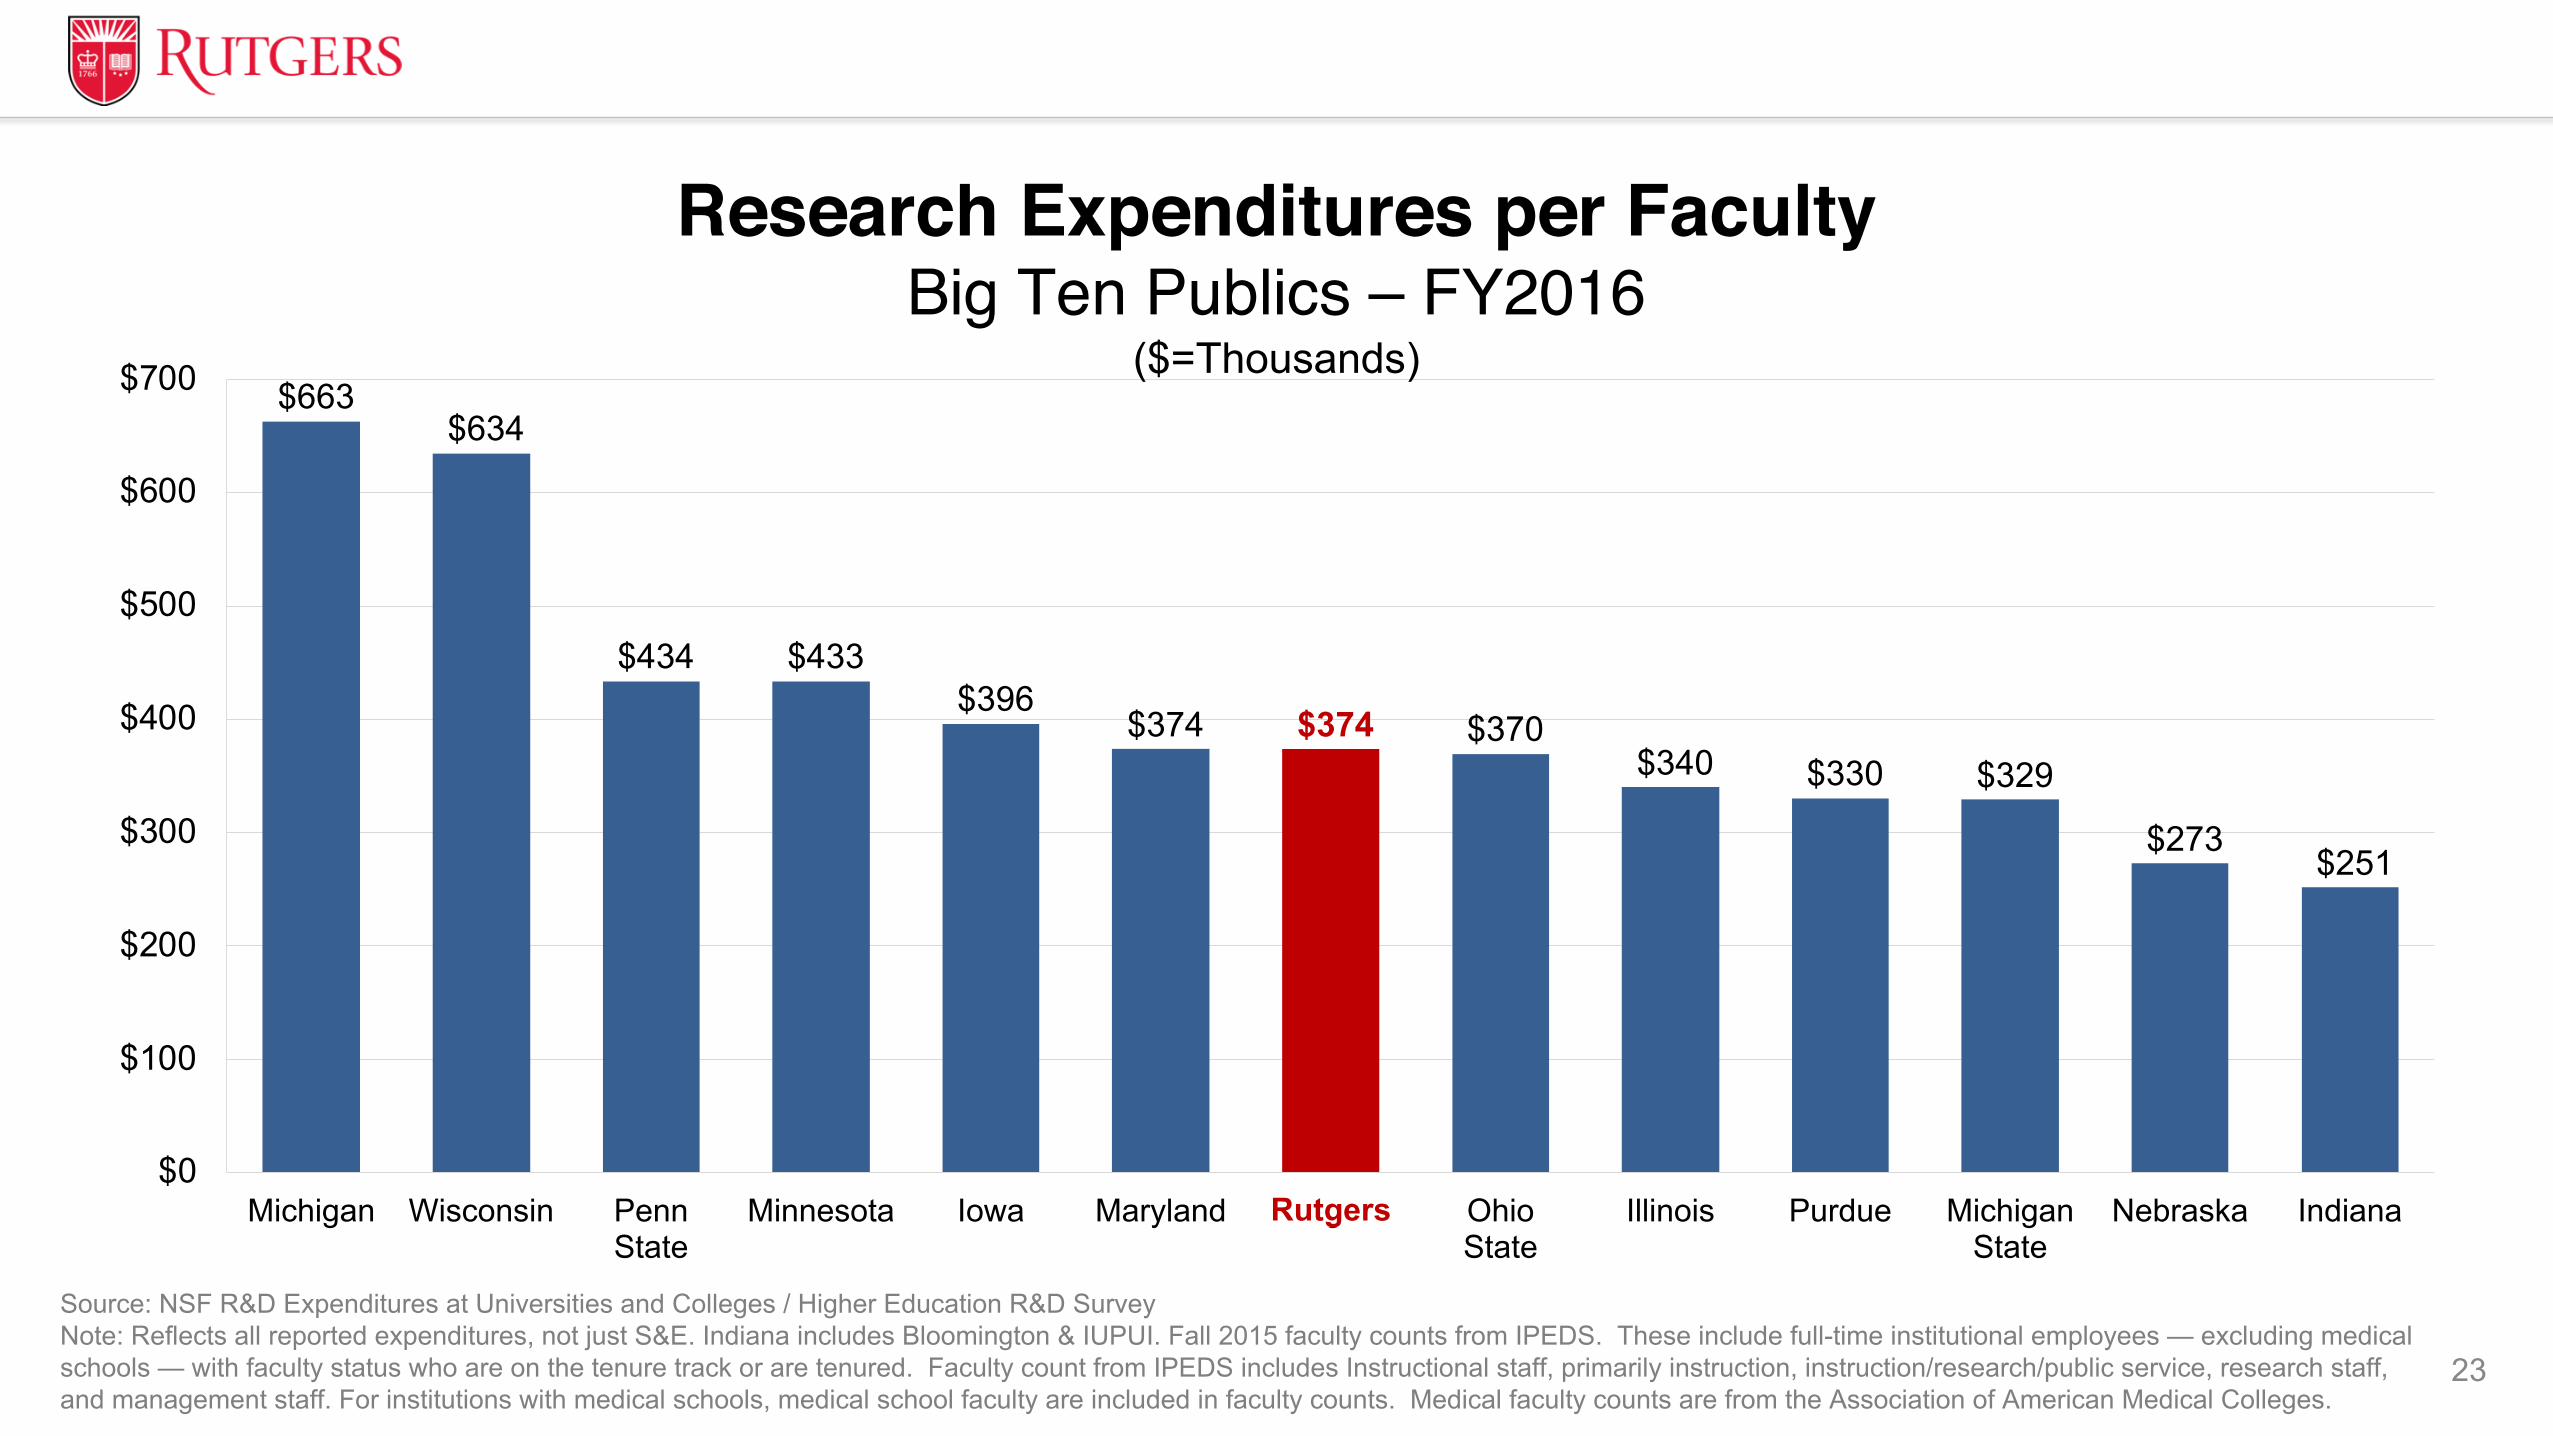
Source: NSF R&D Expenditures at Universities and Colleges / Higher Education R&D SurveyNote: Reflects all reported expenditures, not just S&E. Indiana includes Bloomington & IUPUI. Fall 2015 faculty counts from IPEDS. These include full-time institutional employees — excluding medical schools — with faculty status who are on the tenure track or are tenured. Faculty count from IPEDS includes Instructional staff, primarily instruction, instruction/research/public service, research staff, and management staff. For institutions with medical schools, medical school faculty are included in faculty counts. Medical faculty counts are from the Association of American Medical Colleges.
$663 $634
$434 $433 $396
$374 $374 $370 $340 $330 $329
$273 $251
$0
$100
$200
$300
$400
$500
$600
$700
Michigan Wisconsin PennState
Minnesota Iowa Maryland Rutgers OhioState
Illinois Purdue MichiganState
Nebraska IndianaRutgers
23
Research Expenditures per FacultyBig Ten Publics – FY2016
($=Thousands)

24
• Rutgers is around the median in federal-funded research expenditures among the Big Ten Publics. Michigan, Wisconsin, and Penn State lead the Big Ten Publics, each with over a half-billion dollars in FY16.
• Health/Human Services research funding at Rutgers increased significantly in FY14 as a result of the merger. Life Science research expenditures at Rutgers increased significantly as a result.
• Compared to its Big Ten peers, Rutgers receives a relatively small share of its federal funding from the Department of Defense, Department of Energy, and NASA, and a relatively large share from Health/Human Services.
• Compared to its Big Ten peers, Rutgers expenditure in Engineering and Non-Science/Engineering is relatively small, whereas in Life Science and Geo/Atmospheric/Ocean Sciences it is relatively large.
Summary

25
Discussion

Research Recognition and Capacity
26

Source: https://www.amacad.org/multimedia/pdfs/classlist2017.pdfNote: Includes all active and retired members.
79
59
38
28 27 25
18 1815
9 7 51
0
10
20
30
40
50
60
70
80
90
Michigan Wisconsin Illinois Minnesota Indiana Rutgers Ohio State Penn State Maryland Purdue Iowa MichiganState
NebraskaRutgers
27
Number of Members in the American Academy of Arts & SciencesBig Ten Publics – January 2018
Source: https://www.aaas.org/elected-fellowsNote: Includes all active and retired members.
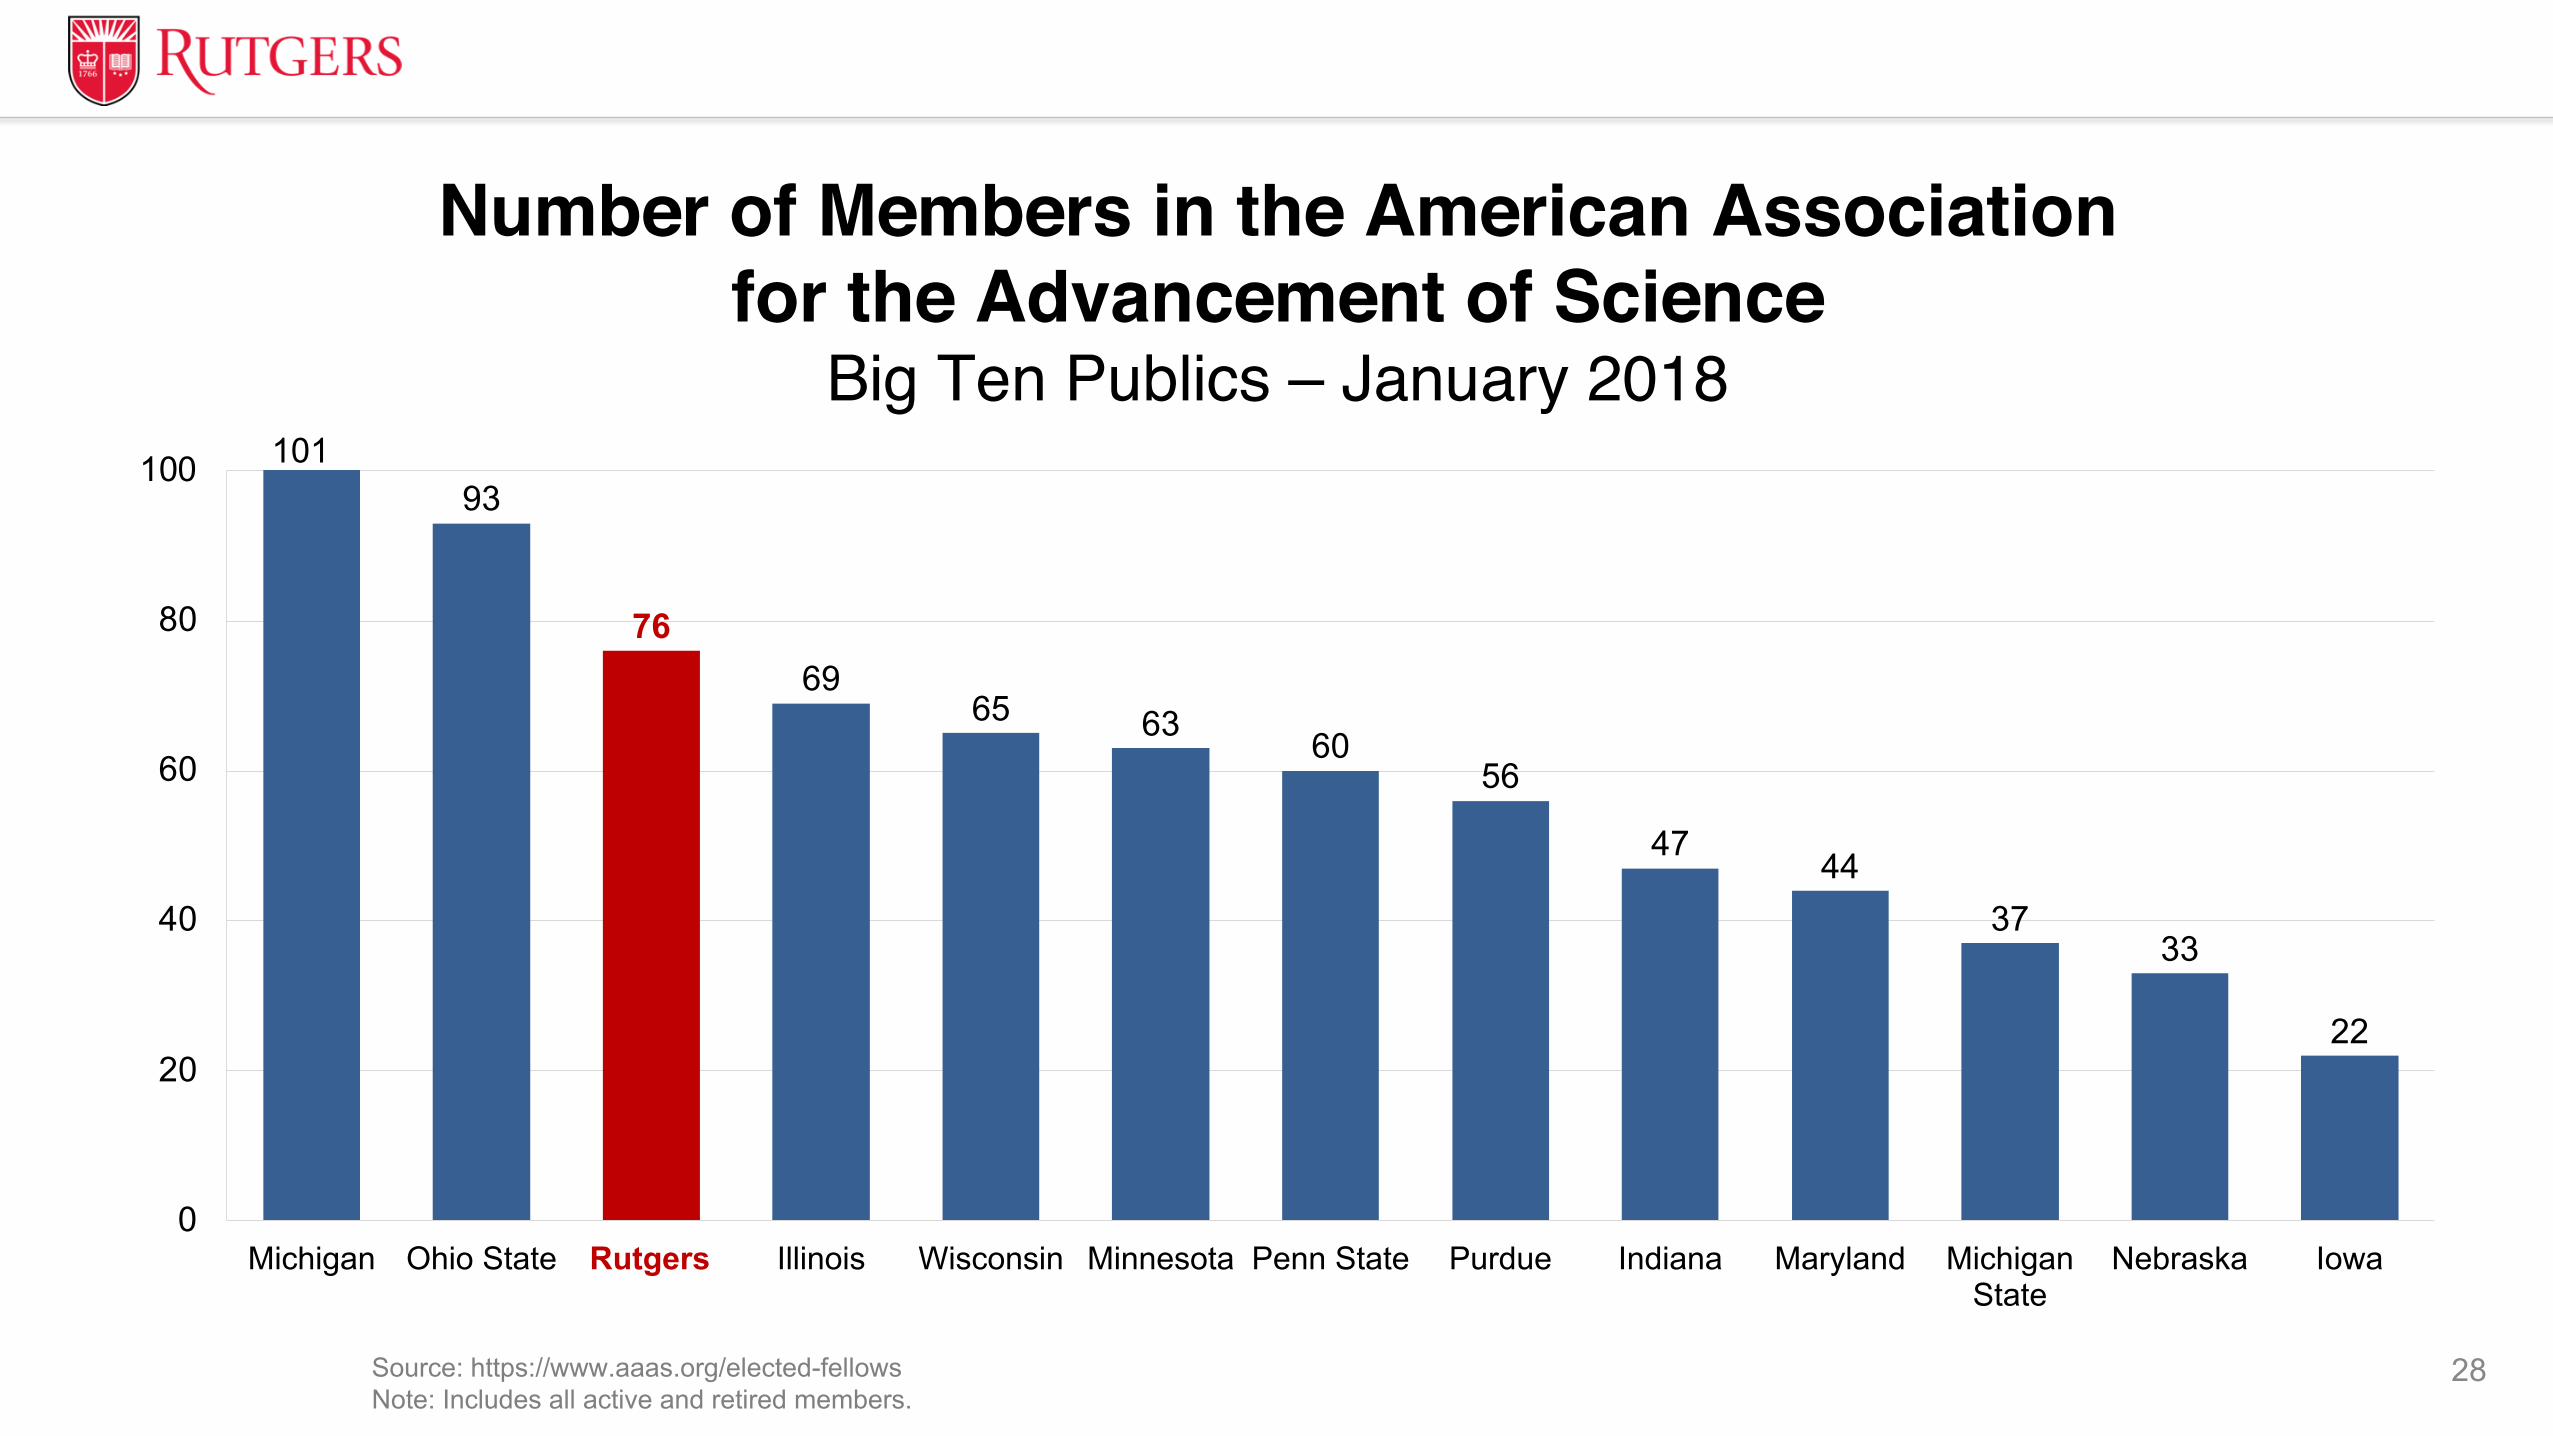
93
7669
65 63 6056
47 4437
33
22
0
20
40
60
80
100
Michigan Ohio State Rutgers Illinois Wisconsin Minnesota Penn State Purdue Indiana Maryland MichiganState
Nebraska IowaRutgers
28
Number of Members in the American Association for the Advancement of Science
Big Ten Publics – January 2018101
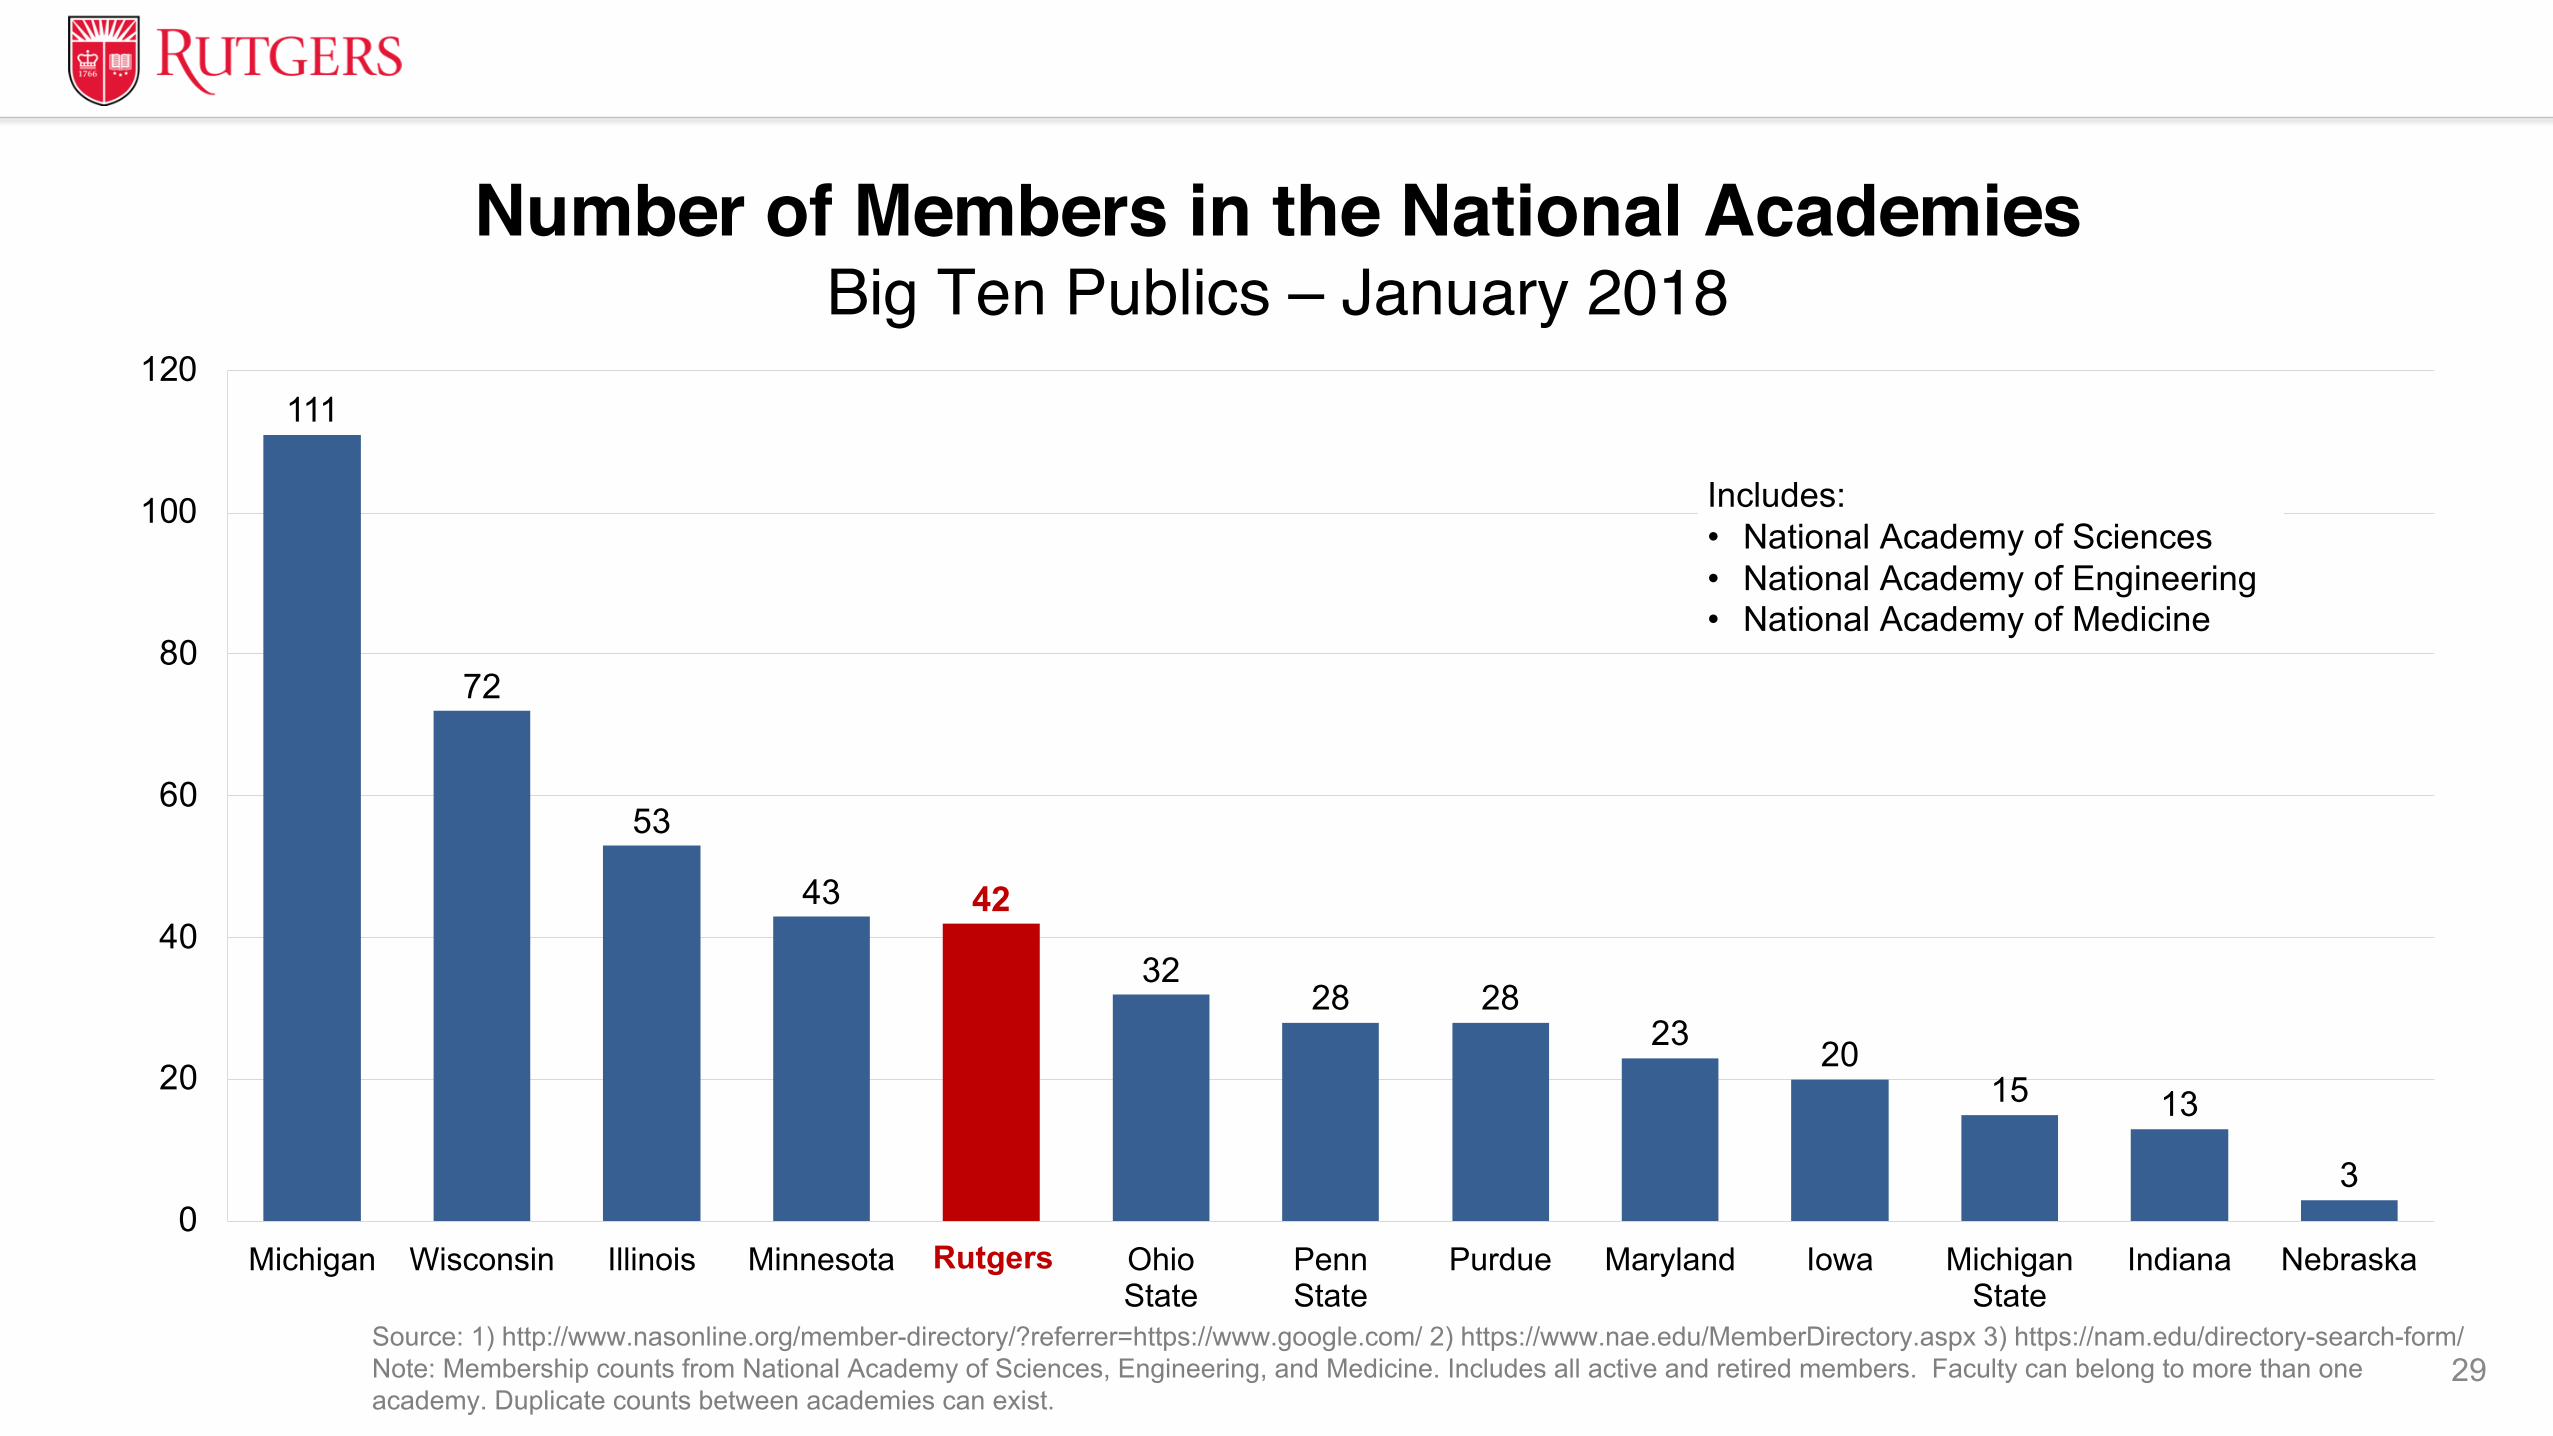
Source: 1) http://www.nasonline.org/member-directory/?referrer=https://www.google.com/ 2) https://www.nae.edu/MemberDirectory.aspx 3) https://nam.edu/directory-search-form/ Note: Membership counts from National Academy of Sciences, Engineering, and Medicine. Includes all active and retired members. Faculty can belong to more than one academy. Duplicate counts between academies can exist.
111
72
53
43 42
3228 28
23 2015 13
30
20
40
60
80
100
120
Michigan Wisconsin Illinois Minnesota Rutgers OhioState
PennState
Purdue Maryland Iowa MichiganState
Indiana NebraskaRutgers
29
Includes:• National Academy of Sciences• National Academy of Engineering• National Academy of Medicine
Number of Members in the National AcademiesBig Ten Publics – January 2018

Source: https://mup.asu.edu/sites/default/files/mup-2016-top-american-research-universities-annual-report.pdfNote: Indiana includes Bloomington and IUPUI. Explanation of faculty awards methodology on pg. 227 of The Top American Research Universities, 2016 Annual Report.
42
35
30 30
20 20 19 19 18 17
11 10
3
0
5
10
15
20
25
30
35
40
45
Michigan Minnesota Illinois Wisconsin Rutgers Maryland Penn State Purdue Indiana Ohio State MichiganState
Iowa NebraskaRutgers
30
Example Awards:• American Council of Learned Societies (ACLS) Fellows• Fulbright American Scholars • Getty Scholars in Residence• Guggenheim Fellows• National Endowment for the Humanities (NEH) Fellows• National Medal of Science and National Medal of Technology• Robert Wood Johnson Policy Fellows• Sloan Research Fellows• Woodrow Wilson Fellows
Other Prestigious Faculty AwardsBig Ten Publics – 2015
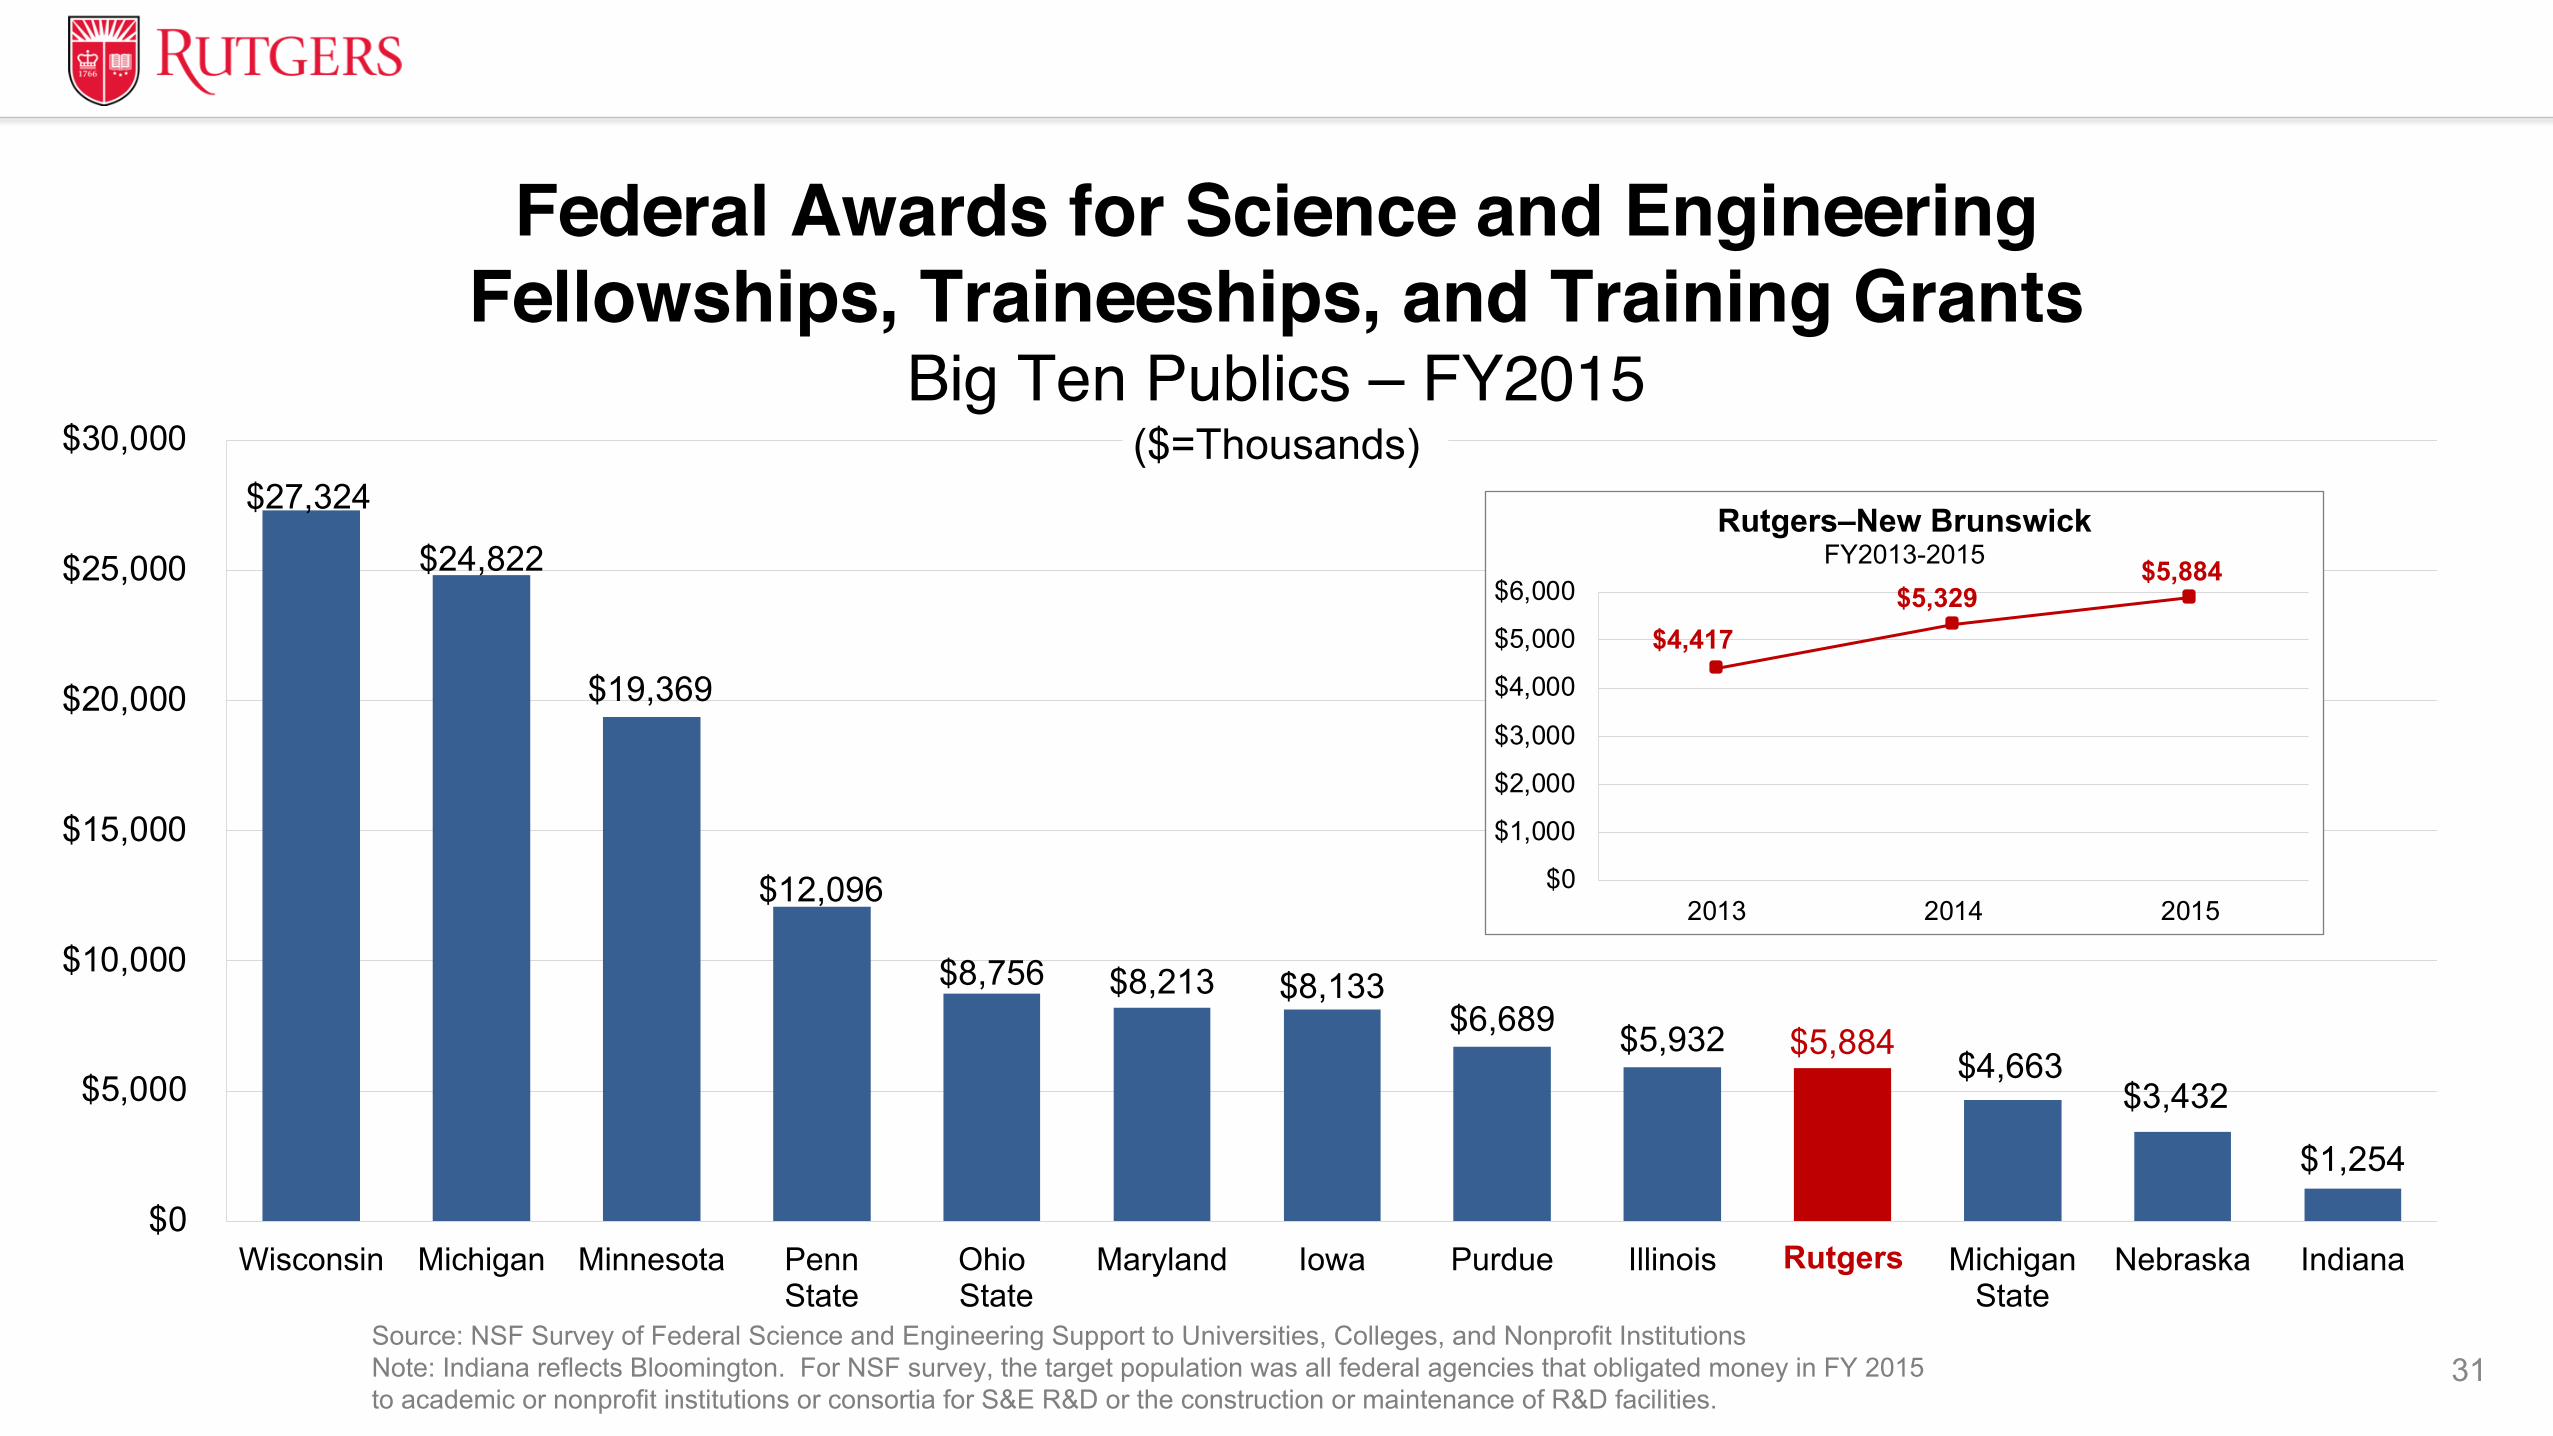
$27,324
$24,822
$19,369
$12,096
$8,756 $8,213 $8,133 $6,689 $5,932 $5,884
$4,663 $3,432
$1,254
$0
$5,000
$10,000
$15,000
$20,000
$25,000
$30,000
Wisconsin Michigan Minnesota PennState
Ohio State
Maryland Iowa Purdue Illinois Rutgers MichiganState
Nebraska IndianaRutgers
Source: NSF Survey of Federal Science and Engineering Support to Universities, Colleges, and Nonprofit InstitutionsNote: Indiana reflects Bloomington. For NSF survey, the target population was all federal agencies that obligated money in FY 2015 to academic or nonprofit institutions or consortia for S&E R&D or the construction or maintenance of R&D facilities.
31
$4,417 $5,329
$5,884
$0
$1,000
$2,000
$3,000
$4,000
$5,000
$6,000
2013 2014 2015
Rutgers–New BrunswickFY2013-2015
Federal Awards for Science and Engineering Fellowships, Traineeships, and Training Grants
Big Ten Publics – FY2015($=Thousands)
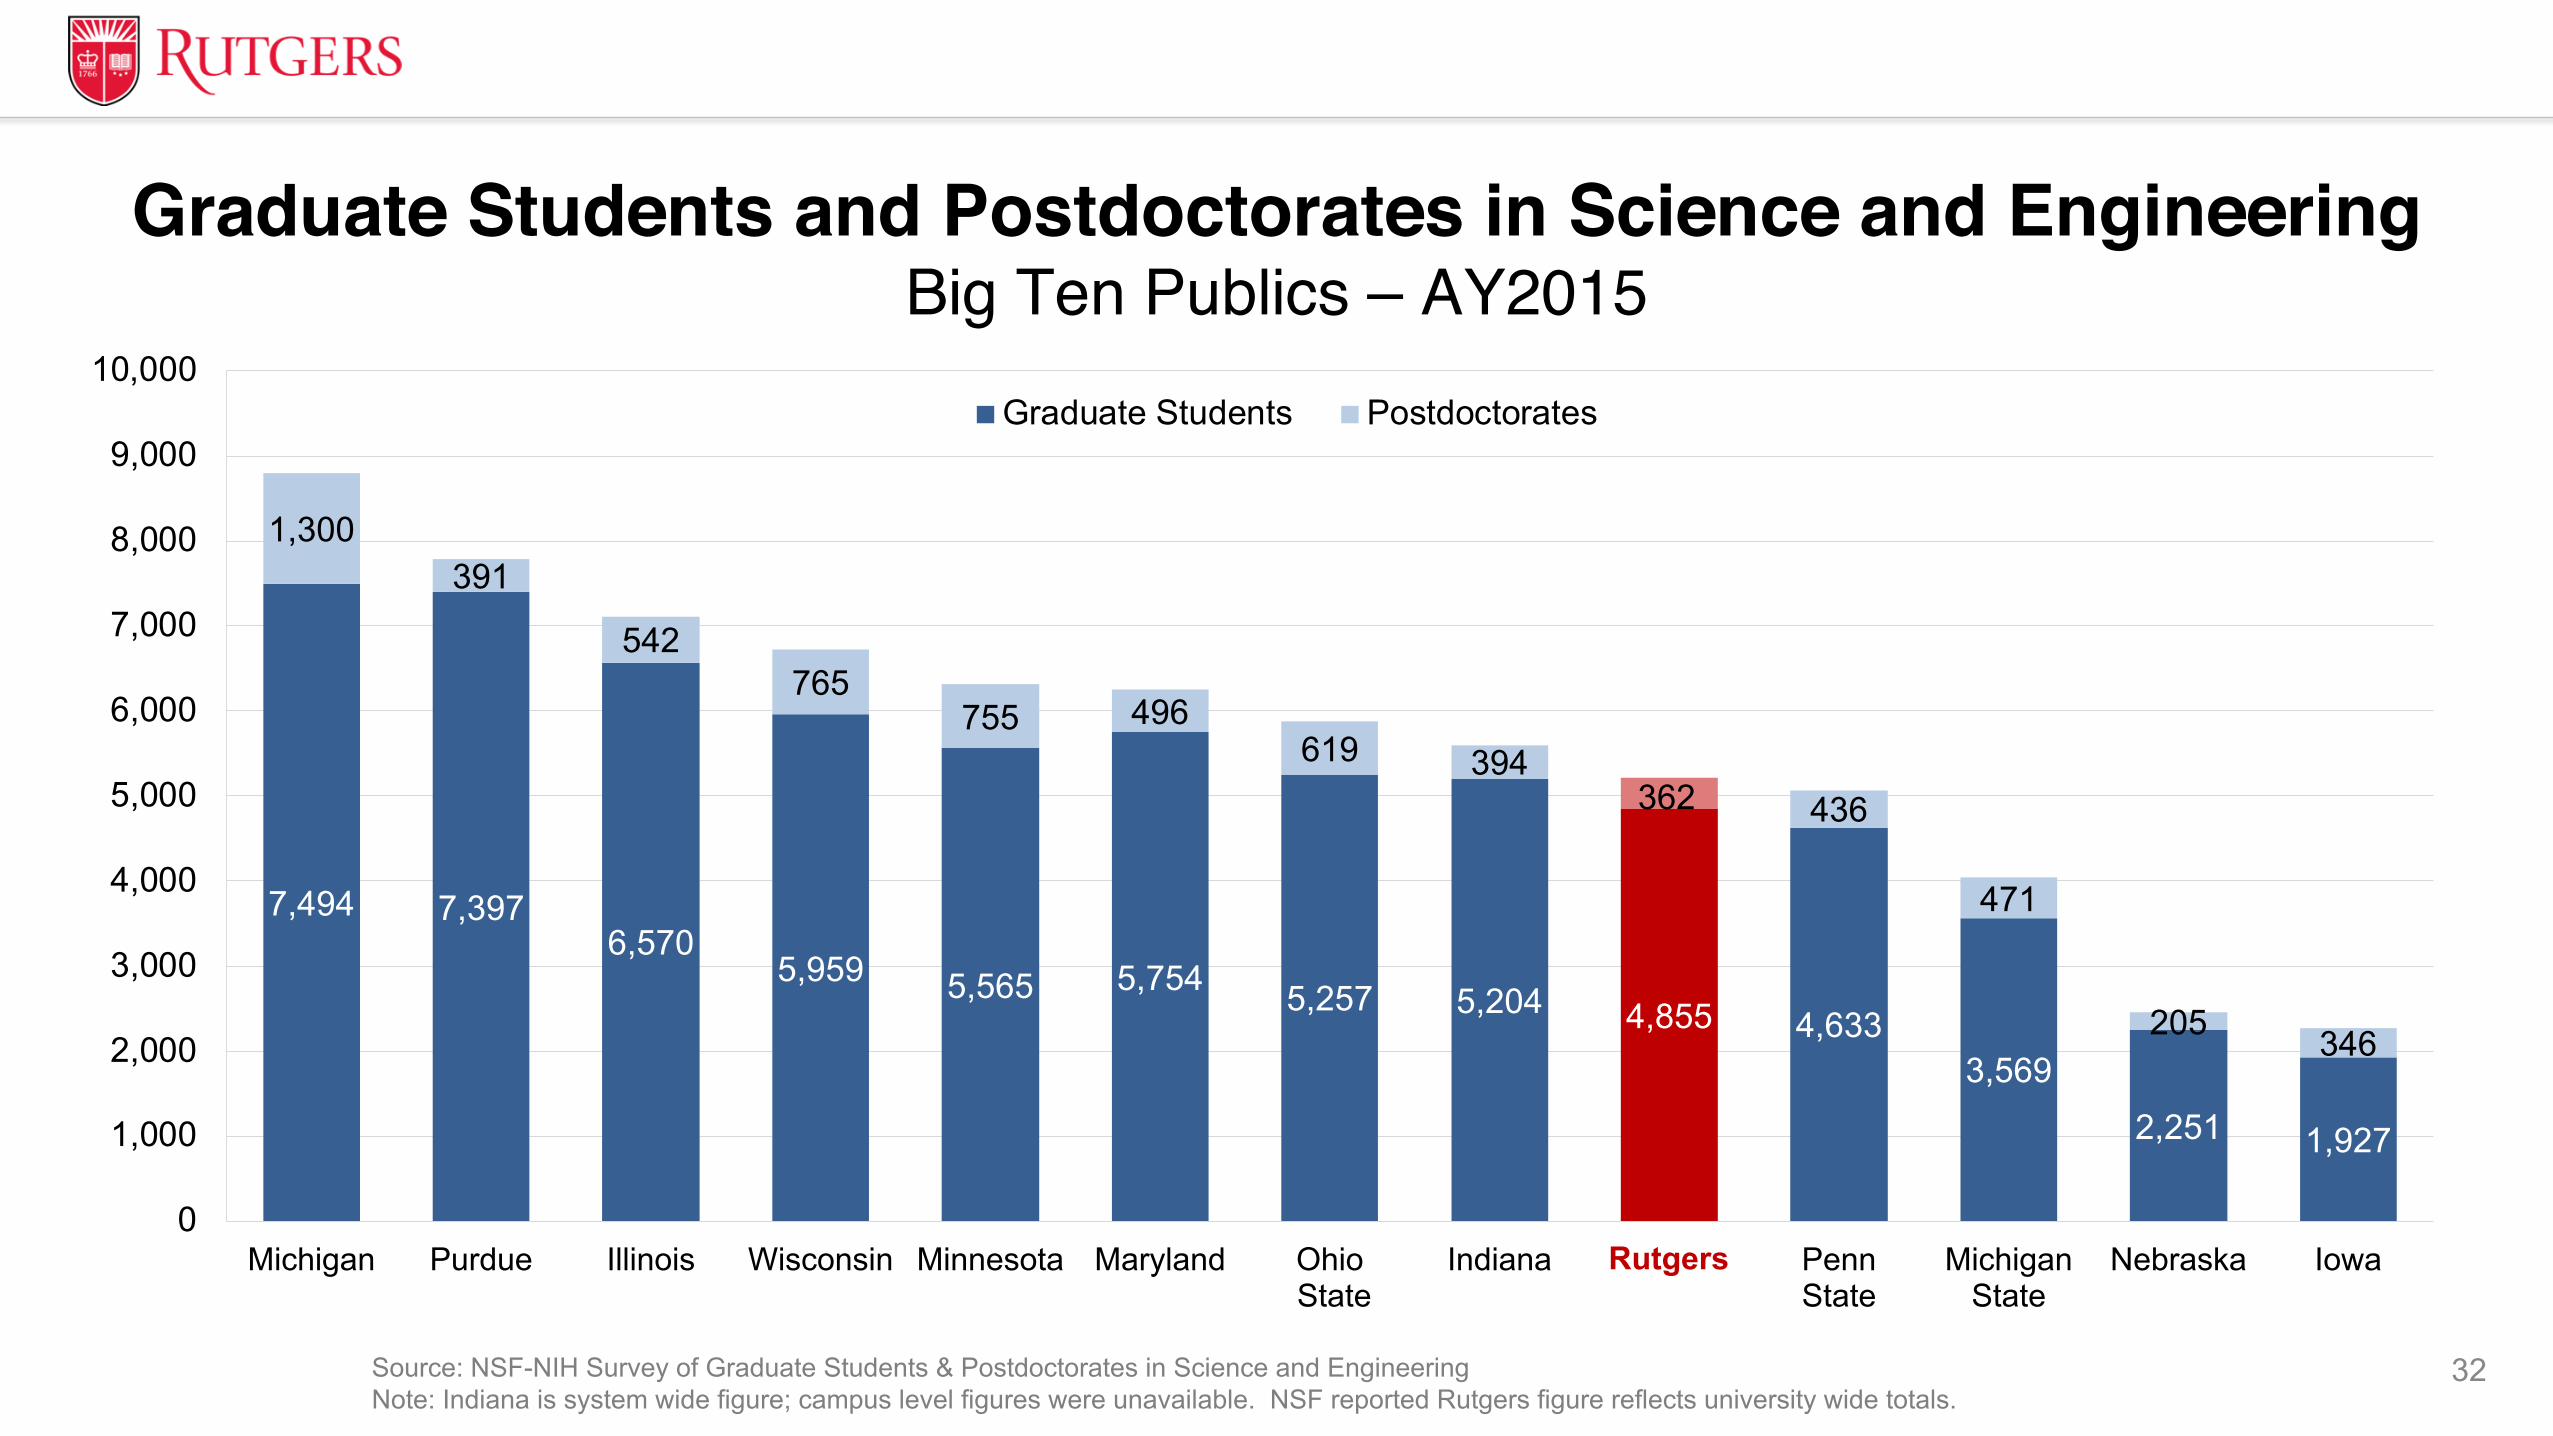
7,494 7,3976,570
5,959 5,565 5,754 5,257 5,204 4,855 4,6333,569
2,251 1,927
1,300391
542765
755 496619 394
362 436
471
205 346
0
1,000
2,000
3,000
4,000
5,000
6,000
7,000
8,000
9,000
10,000
Michigan Purdue Illinois Wisconsin Minnesota Maryland Ohio State
Indiana Rutgers PennState
MichiganState
Nebraska Iowa
Graduate Students Postdoctorates
Rutgers
Source: NSF-NIH Survey of Graduate Students & Postdoctorates in Science and EngineeringNote: Indiana is system wide figure; campus level figures were unavailable. NSF reported Rutgers figure reflects university wide totals.
32
Graduate Students and Postdoctorates in Science and EngineeringBig Ten Publics – AY2015
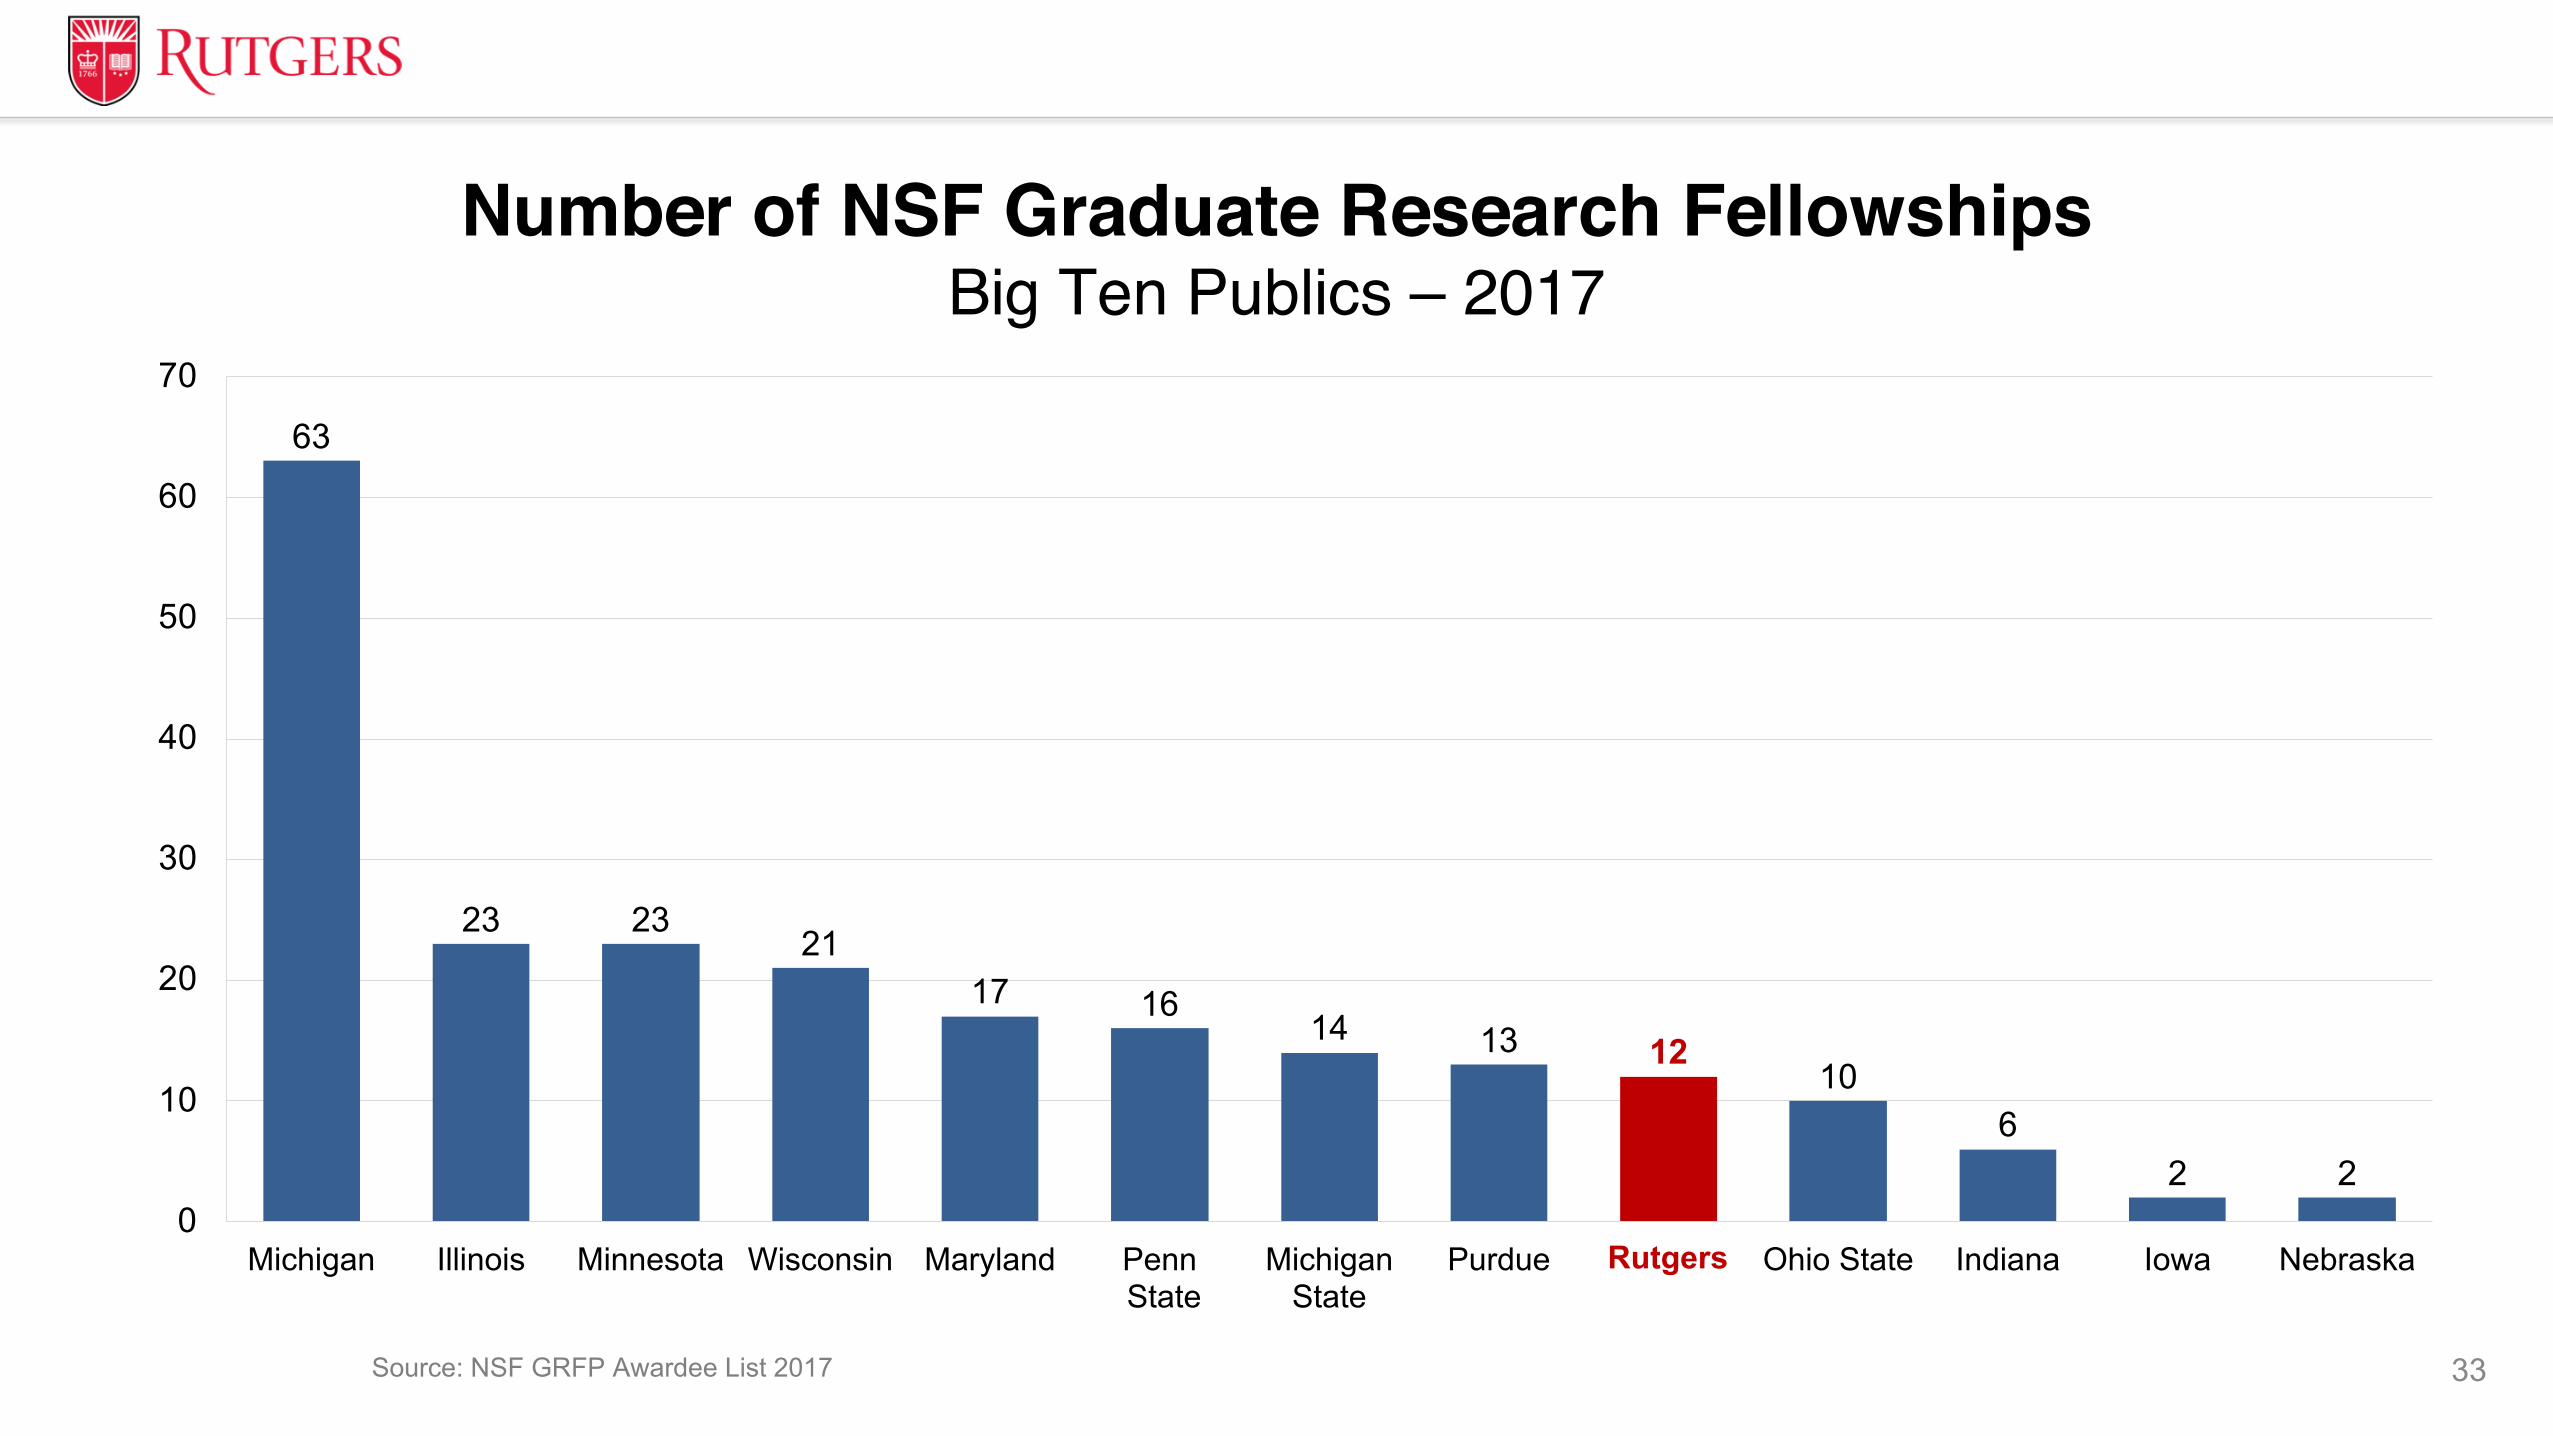
63
23 2321
17 1614 13 12
106
2 20
10
20
30
40
50
60
70
Michigan Illinois Minnesota Wisconsin Maryland Penn State
MichiganState
Purdue Rutgers Ohio State Indiana Iowa NebraskaRutgers
Source: NSF GRFP Awardee List 2017 33
Number of NSF Graduate Research FellowshipsBig Ten Publics – 2017
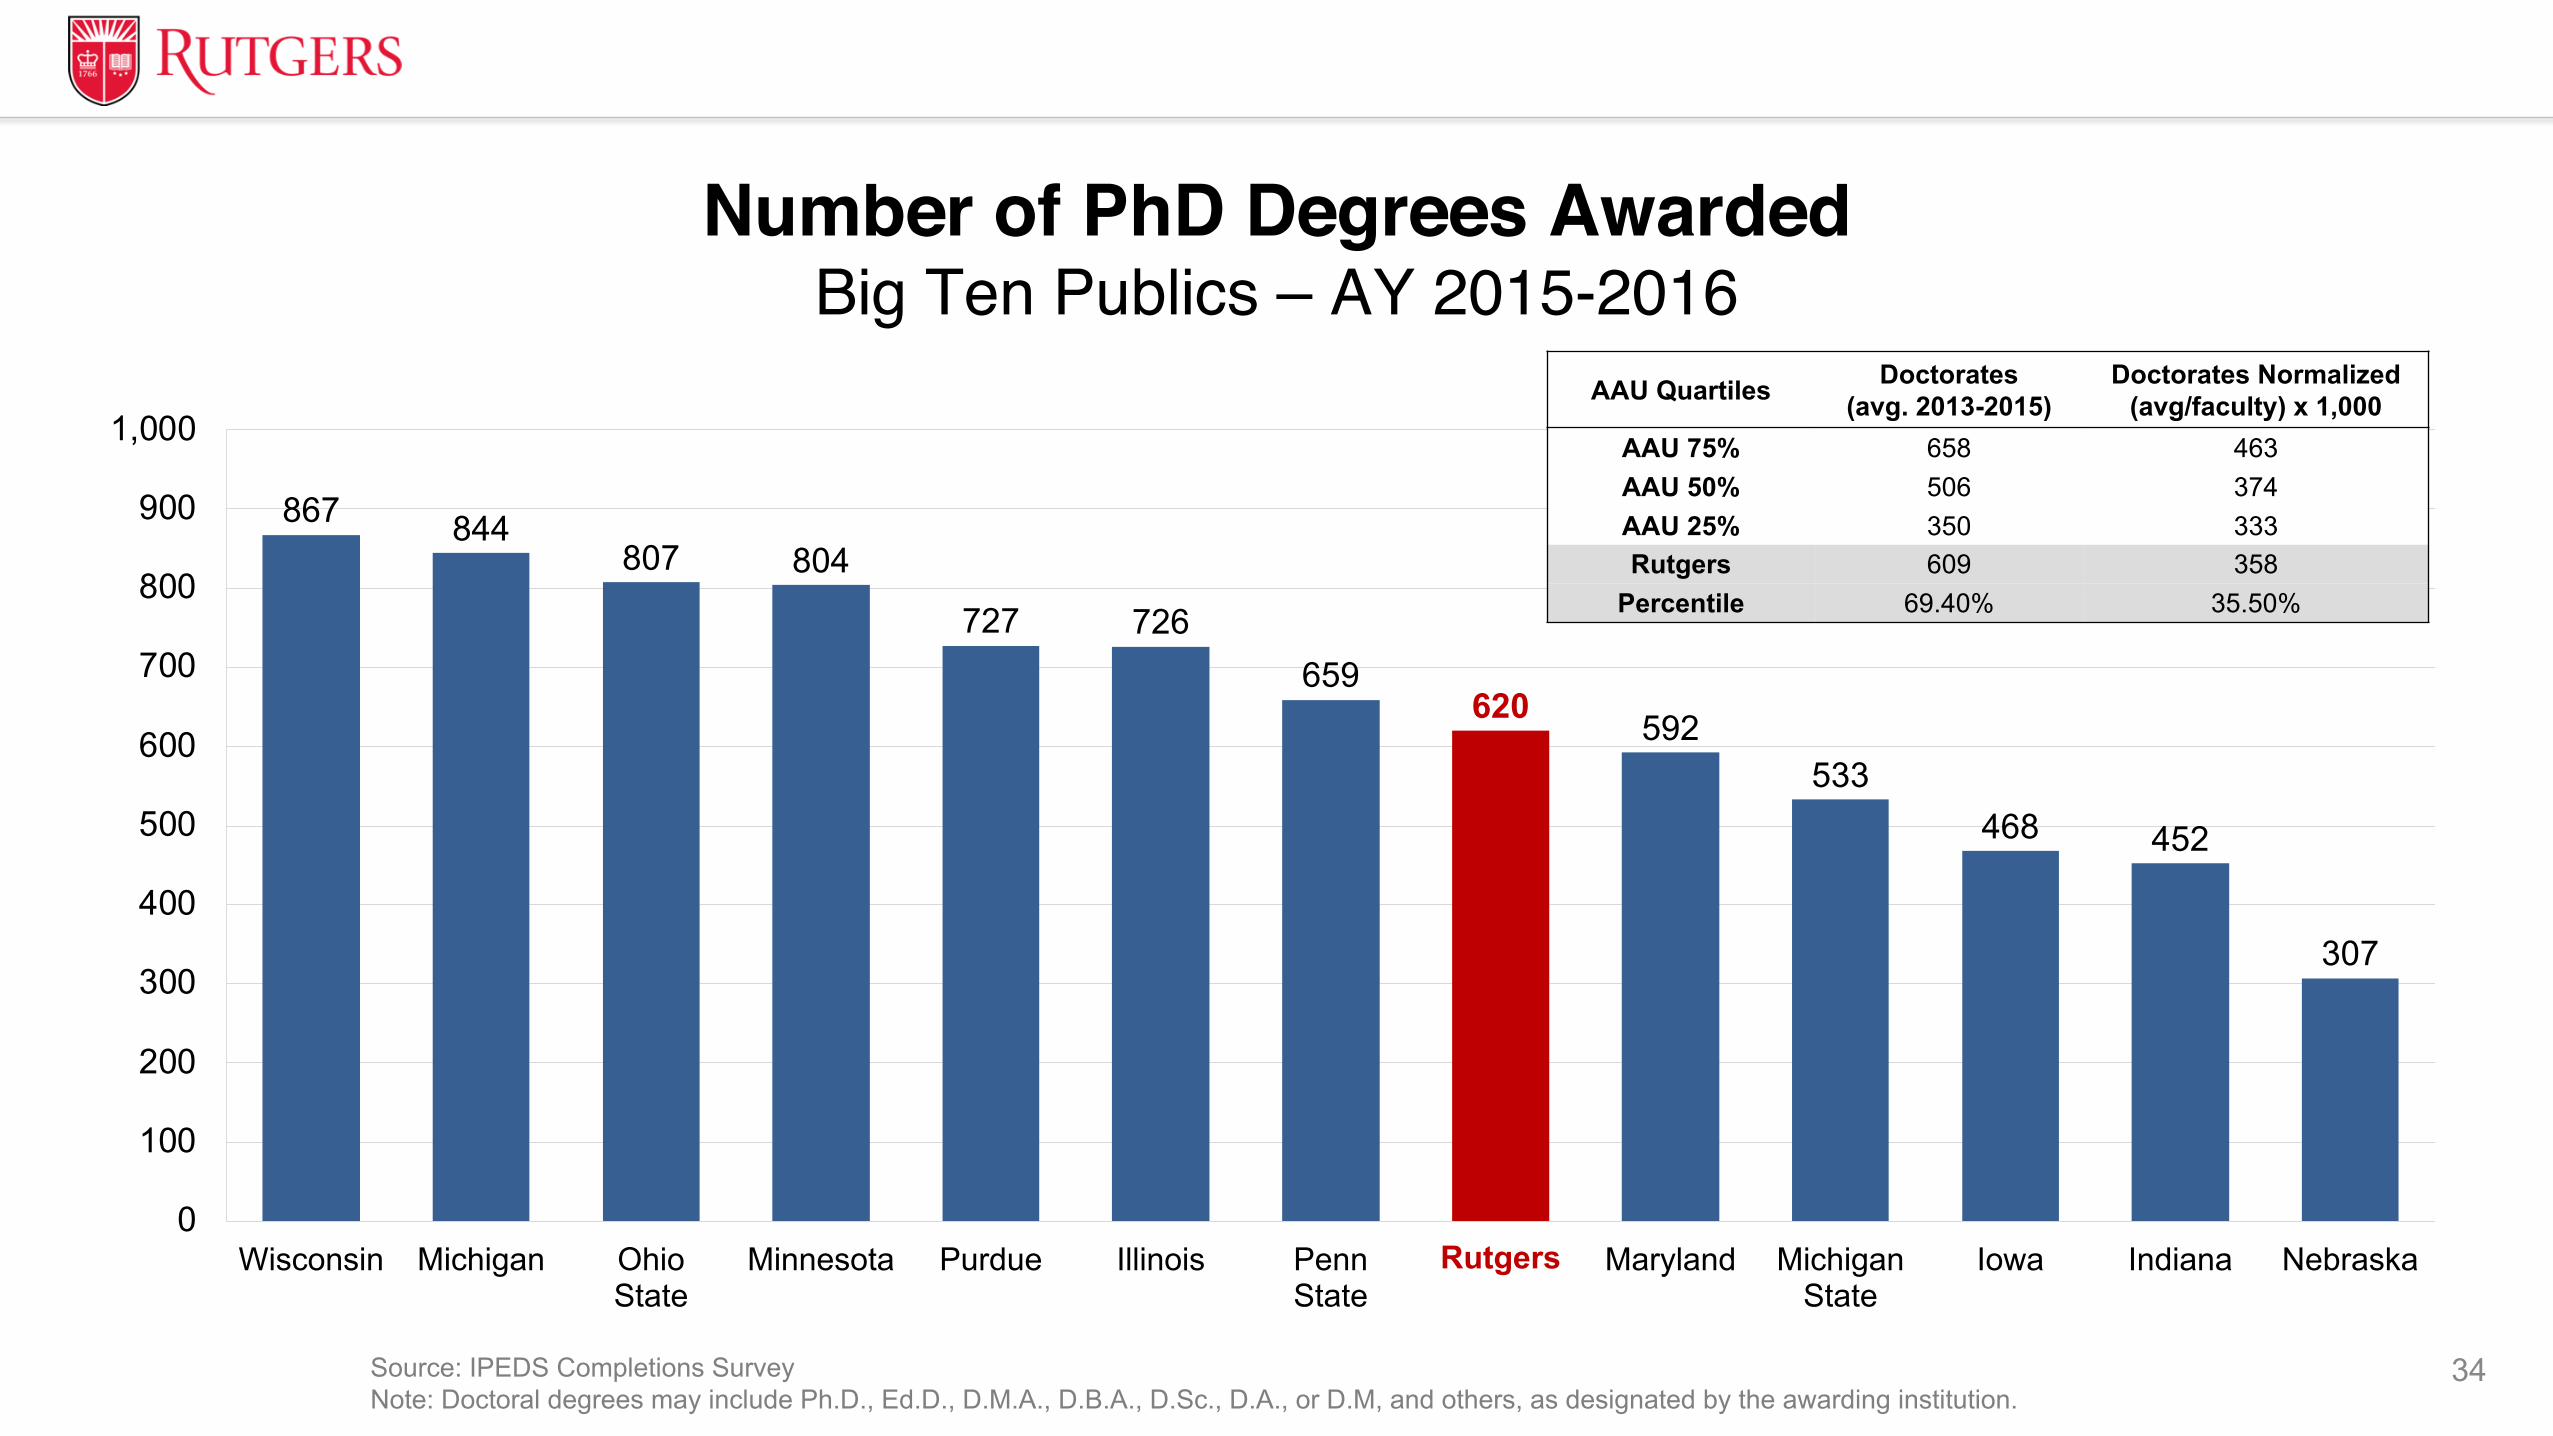
867 844807 804
727 726659
620 592533
468 452
307
0
100
200
300
400
500
600
700
800
900
1,000
Wisconsin Michigan OhioState
Minnesota Purdue Illinois PennState
Rutgers Maryland MichiganState
Iowa Indiana NebraskaRutgers
Source: IPEDS Completions Survey Note: Doctoral degrees may include Ph.D., Ed.D., D.M.A., D.B.A., D.Sc., D.A., or D.M, and others, as designated by the awarding institution.
34
Number of PhD Degrees AwardedBig Ten Publics – AY 2015-2016
AAU Quartiles Doctorates (avg. 2013-2015)
Doctorates Normalized (avg/faculty) x 1,000
AAU 75% 658 463AAU 50% 506 374AAU 25% 350 333Rutgers 609 358
Percentile 69.40% 35.50%

3,399,529
3,034,3012,903,902
2,561,1002,445,663
1,920,691 1,877,753
1,444,6671,315,441
855,710 785,740 676,258 594,390
0
500,000
1,000,000
1,500,000
2,000,000
2,500,000
3,000,000
3,500,000
4,000,000
Minnesota Illinois Wisconsin PennState
Michigan State
Rutgers Michigan Purdue OhioState
Nebraska Maryland Iowa Indiana
Other S&E FieldsComputer and Information SciencesMathematics and StatisticsPsychologyNatural Resources and ConservationAgriculture SciencesSocial SciencesGeosciences, Atmospheric, and Ocean SciencesBiological and Biomedical SciencesPhysical SciencesEngineeringHealth Sciences
Rutgers
35Source: NSF Survey of Science and Engineering Research FacilitiesNote: Reflects all reported expenditures, not just S&E. Rutgers figures reflect FY2017. Indiana reflects Bloomington.
Research Space - By FieldBig Ten Publics – FY2015
Square Feet (NASF)

36
Discussion

Research Support(ORED)
37

7,118
5,412
4,506
4,332 4,3224,098
3,905 3,903 3,894
3,687 3,671
3,432
2,076
0
1,000
2,000
3,000
4,000
5,000
6,000
7,000
8,000
Michigan Minnesota Penn
State
Illinois Rutgers Indiana Ohio
State
Purdue Wisconsin Maryland Iowa Michigan
State
NebraskaRutgers
Source: Big Ten Academic Alliance Research Database.
Note: Note: Due to missing data points, Ohio State’s average number of proposals does not include 2015 and 2017. 38
Average Number of All Grant Proposals Submitted Over Four YearsBig Ten Publics
FY2014 - FY2017

$4,952
$2,638 $2,491 $2,376
$2,194 $2,168 $1,865
$1,694 $1,654
$1,224 $1,003
$765 $701
$0
$500
$1,000
$1,500
$2,000
$2,500
$3,000
$3,500
$4,000
$4,500
$5,000
Michigan Wisconsin Penn State Ohio State Minnesota Indiana Maryland MichiganState
Purdue Illinois Rutgers Nebraska Iowa
Source: Big Ten Academic Alliance Research Database. Note: Due to missing data points, Ohio State’s average amount does not include 2015. 39
Rutgers
Average Amount of All Grant Proposals Submitted Over Four YearsBig Ten Publics – FY2014 - FY2017
($=Millions)

7,058
5,833
5,389
4,696
4,039 4,032
3,783
3,388
2,855
2,562 2,4622,306
1,385
0
1,000
2,000
3,000
4,000
5,000
6,000
7,000
8,000
Wisconsin Maryland Ohio
State
Minnesota Purdue Illinois Penn
State
Michigan Indiana Michigan
State
Rutgers Iowa NebraskaRutgers
Source: Big Ten Academic Alliance Research Database.
Note: Due to missing data points, Ohio State's average number of awards does not include 2017.
40
Average Number of All Grants Awarded Over Four YearsBig Ten Publics
FY2014 - FY2017
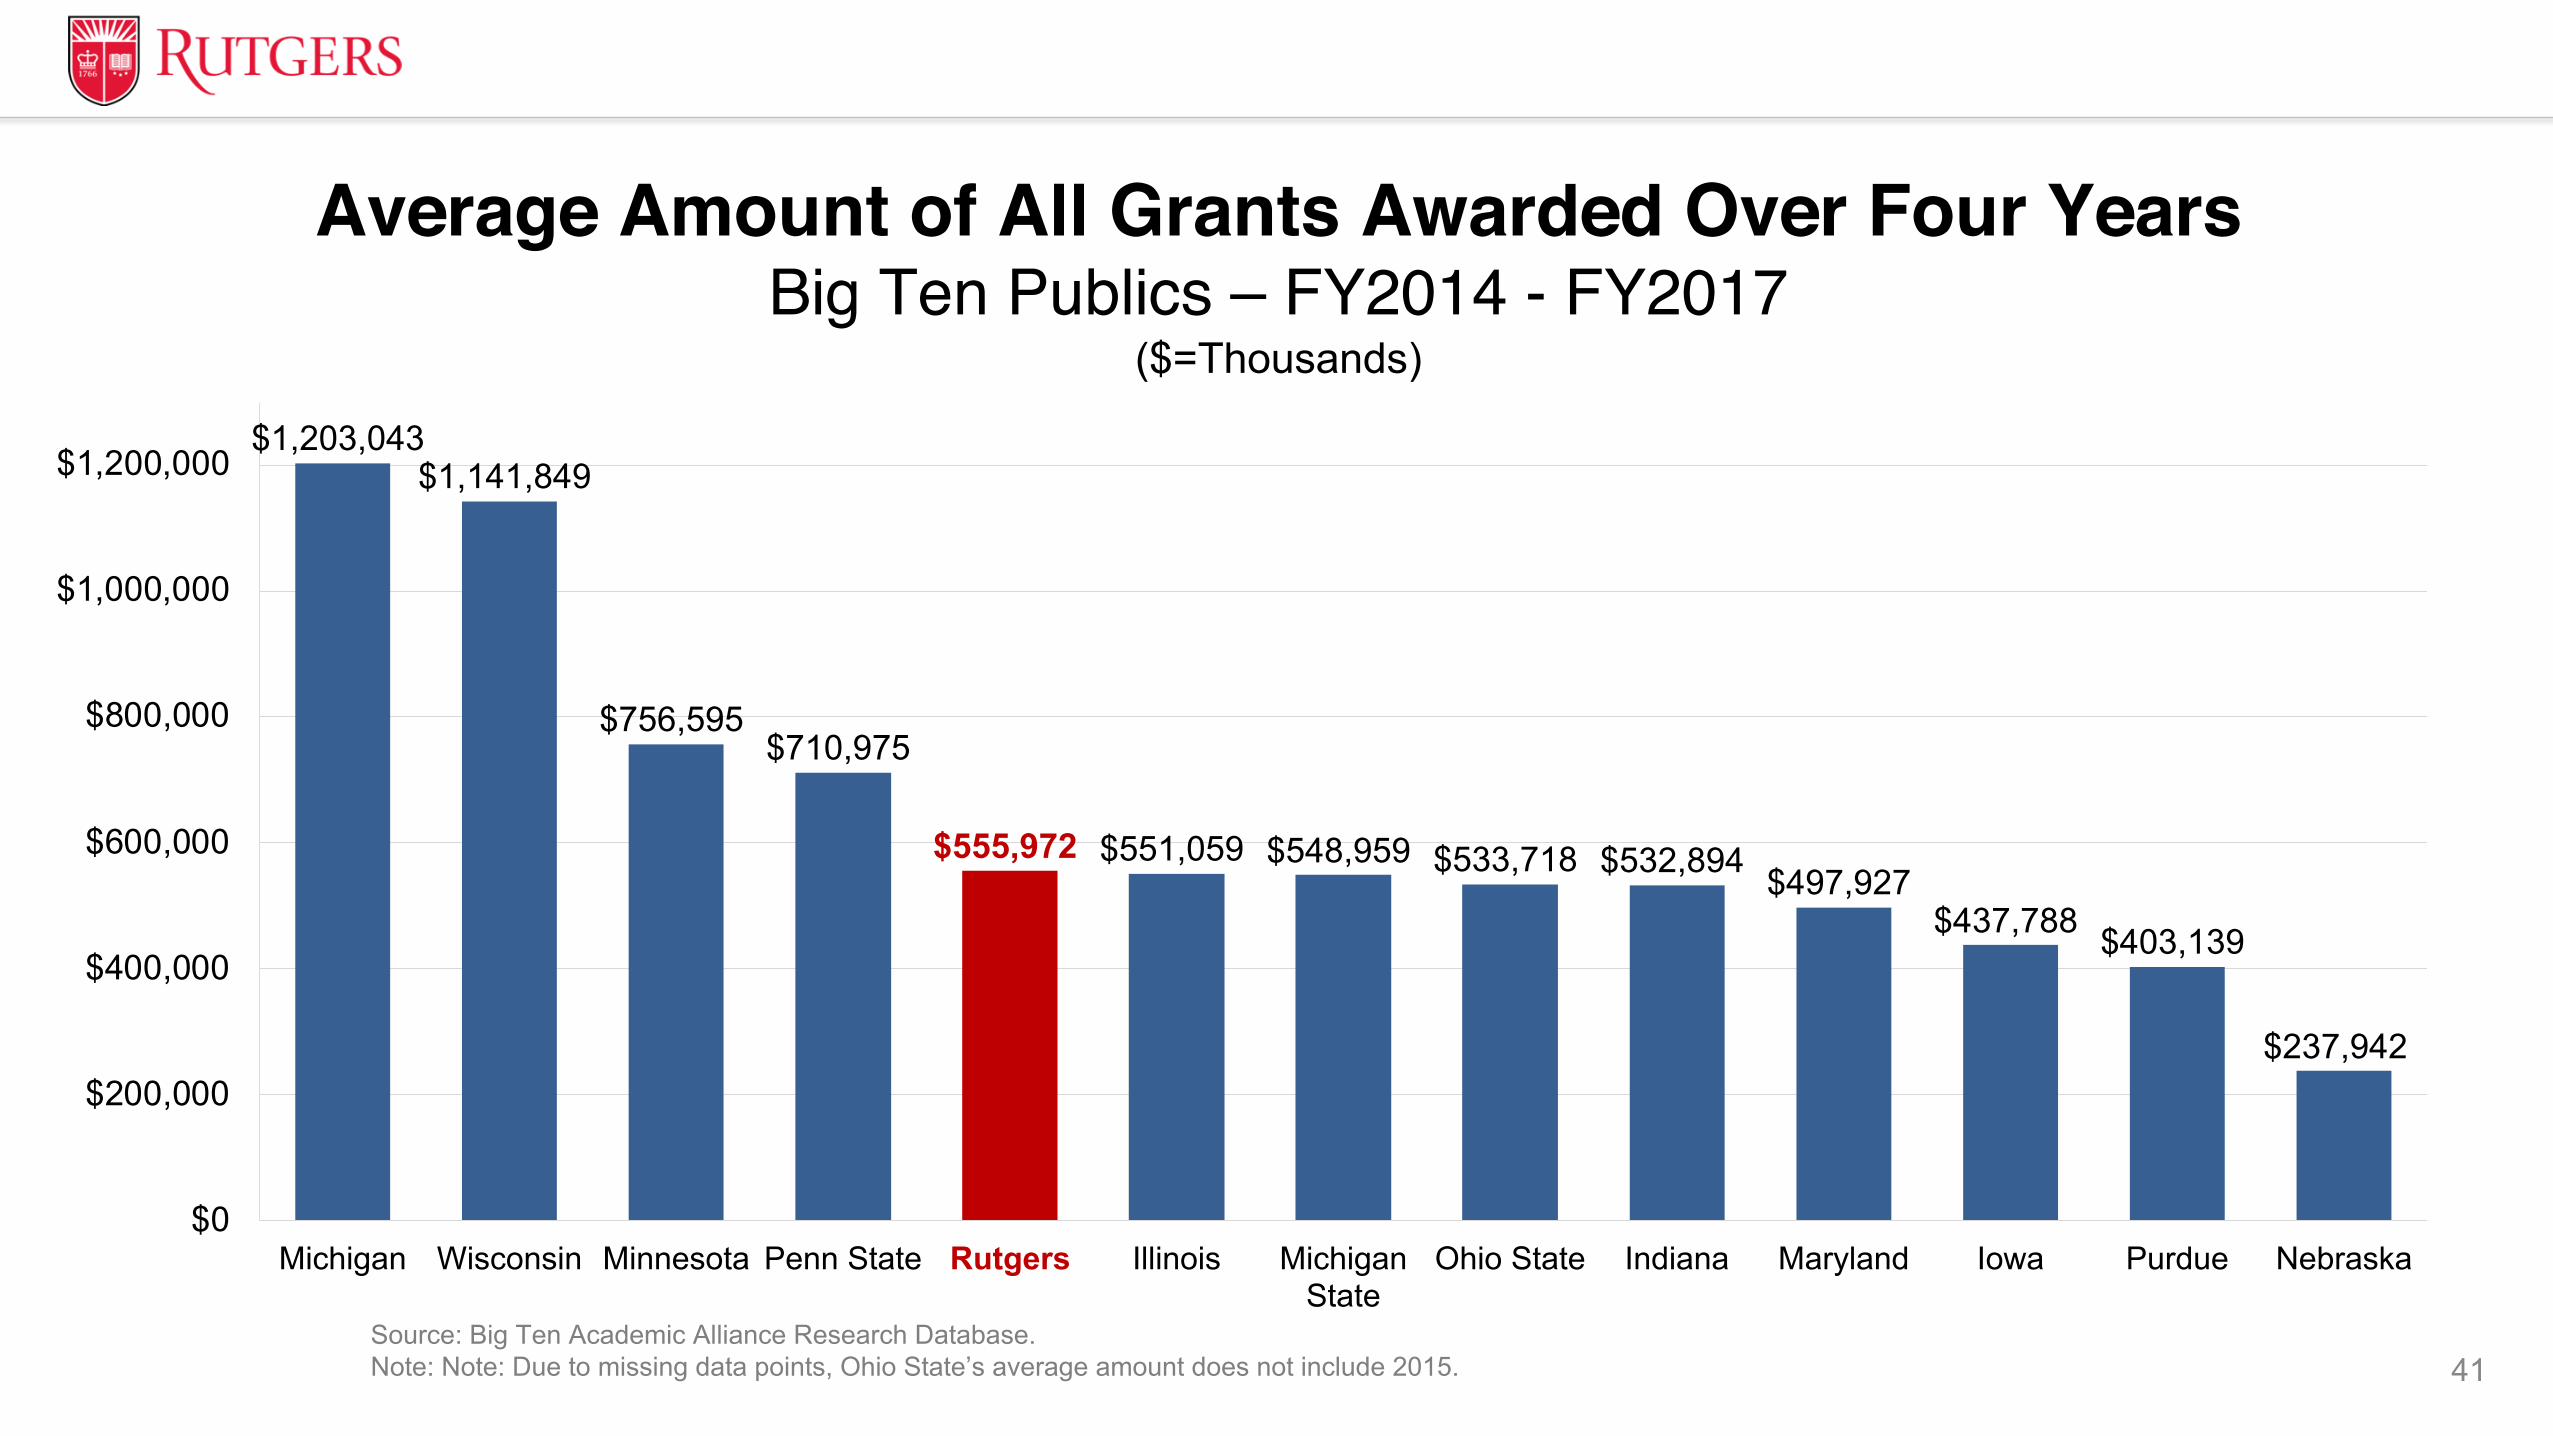
$1,203,043 $1,141,849
$756,595 $710,975
$555,972 $551,059 $548,959 $533,718 $532,894 $497,927
$437,788 $403,139
$237,942
$0
$200,000
$400,000
$600,000
$800,000
$1,000,000
$1,200,000
Michigan Wisconsin Minnesota Penn State Rutgers Illinois MichiganState
Ohio State Indiana Maryland Iowa Purdue Nebraska
Source: Big Ten Academic Alliance Research Database. Note: Note: Due to missing data points, Ohio State’s average amount does not include 2015. 41
Rutgers
Average Amount of All Grants Awarded Over Four YearsBig Ten Publics – FY2014 - FY2017
($=Thousands)
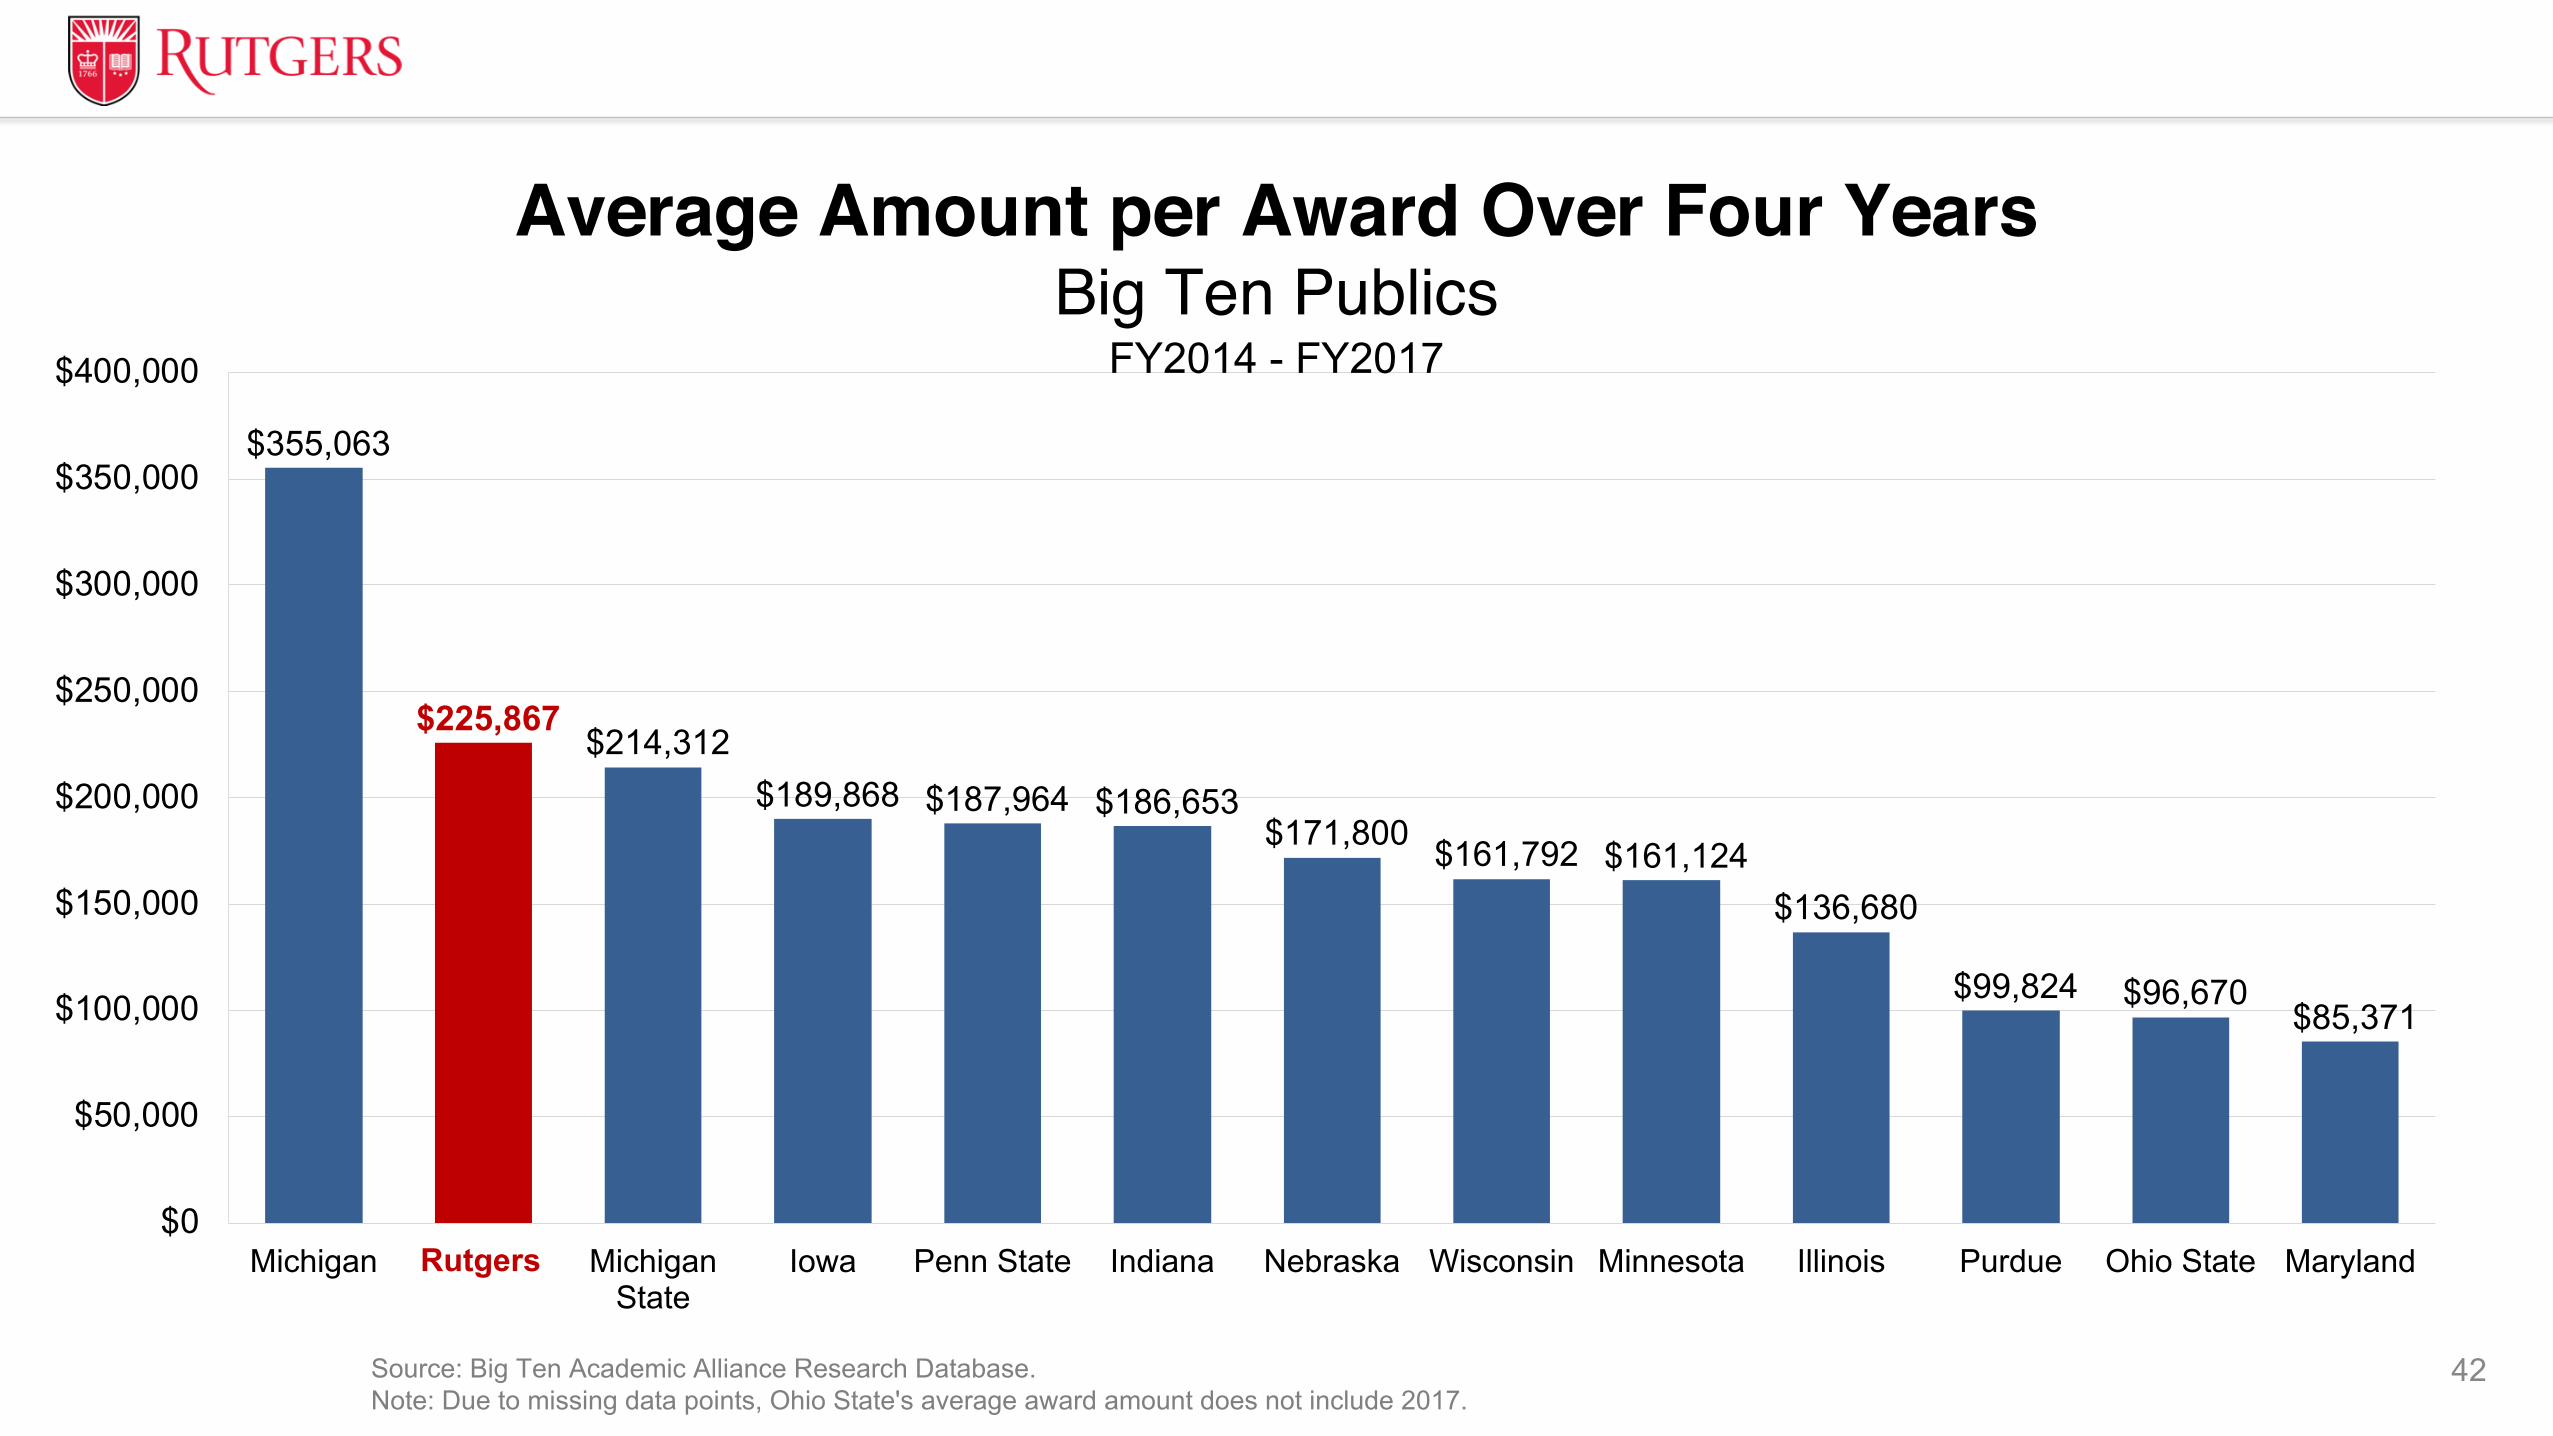
Source: Big Ten Academic Alliance Research Database. Note: Due to missing data points, Ohio State's average award amount does not include 2017.
42
$355,063
$225,867 $214,312
$189,868 $187,964 $186,653 $171,800 $161,792 $161,124
$136,680
$99,824 $96,670 $85,371
$0
$50,000
$100,000
$150,000
$200,000
$250,000
$300,000
$350,000
$400,000
Michigan Rutgers MichiganState
Iowa Penn State Indiana Nebraska Wisconsin Minnesota Illinois Purdue Ohio State MarylandRutgers
Average Amount per Award Over Four YearsBig Ten Publics
FY2014 - FY2017

$0
$2,000,000
$4,000,000
$6,000,000
$8,000,000
$10,000,000
$12,000,000
$14,000,000
$16,000,000
$18,000,000
0
20
40
60
80
100
120
140
160
180
200
FY2006 2007 2008 2009 2010 2011 2012 2013 2014 2015 FY2016
Disclosures Received US Patents Issued Licenses Issued Start-ups Formed
Gross License Income
43Source: Association of University Technology Managers, Statistics Access for Technology Transfer (STATT) Database.
Technology Transfer MetricsRutgers–New Brunswick
FY2006 - FY2017
Integration

Rutgers Big Ten Average
$15,186,394 $15,382,491
Gross License Income$0
$4,000,000
$8,000,000
$12,000,000
$16,000,000
44Source: Association of University Technology Managers, Statistics Access for Technology Transfer (STATT) Database.Note: Big Ten average excludes University of Maryland System.
Tech TransferBig Ten Publics – FY2014 - FY2016
3-Year Average
166
83
60
4
271
76 70
110
50
100
150
200
250
300
DisclosuresReceived
US Patents Issued Licenses Issued Start-ups Formed

45
Discussion

46
Some Ideas to Spur Research Growth
47
EducationBusiness
Law
Engineering
Public Health
Pharmacy
Medical
Physical Therapy
Nursing
History
EnglishLibrary and Information StudiesPolitical Science
Economics
Sociology
Social Work
Psychology
Math
Statistics
Physics
Computer Science
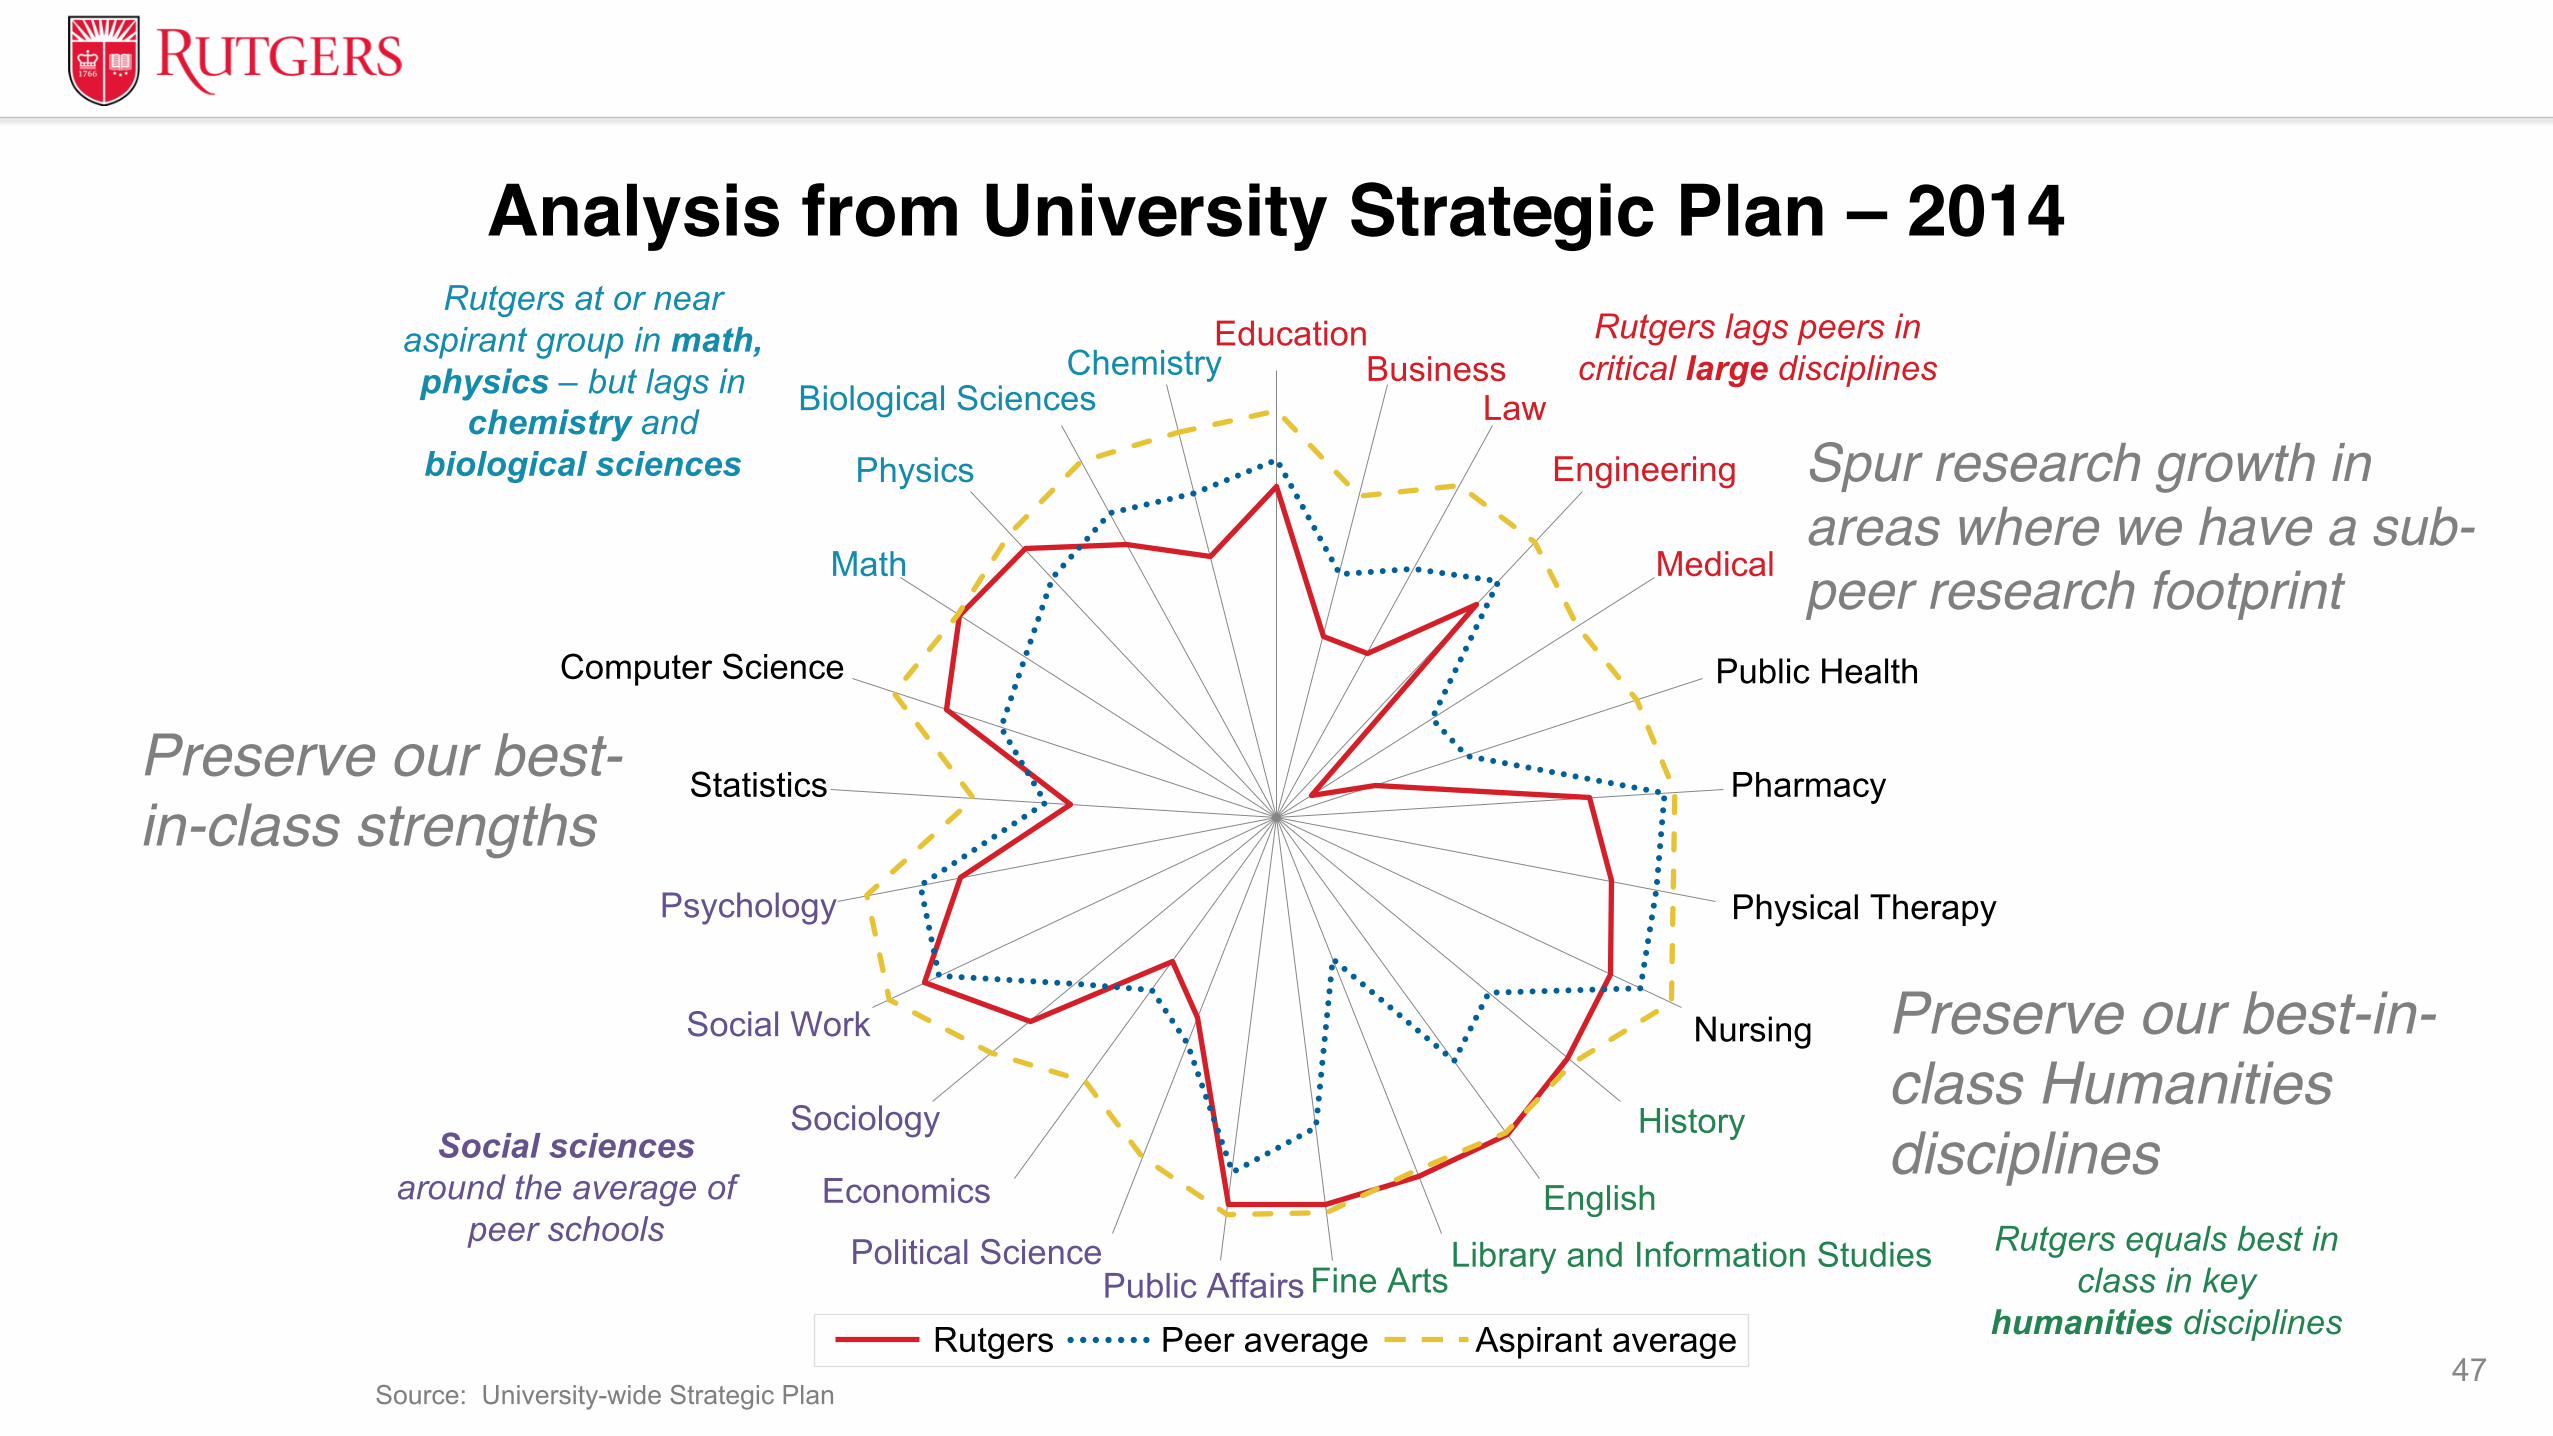
Biological SciencesChemistry
Rutgers at or near aspirant group in math, physics – but lags in
chemistry andbiological sciences
Rutgers lags peers in critical large disciplines
Rutgers equals best in class in key
humanities disciplines
Social sciencesaround the average of
peer schoolsFine ArtsPublic Affairs
Preserve our best-in-class strengths
Preserve our best-in-class Humanities disciplines
Spur research growth in areas where we have a sub-peer research footprint
Source: University-wide Strategic Plan
Analysis from University Strategic Plan – 2014
Peer average Aspirant averageRutgers
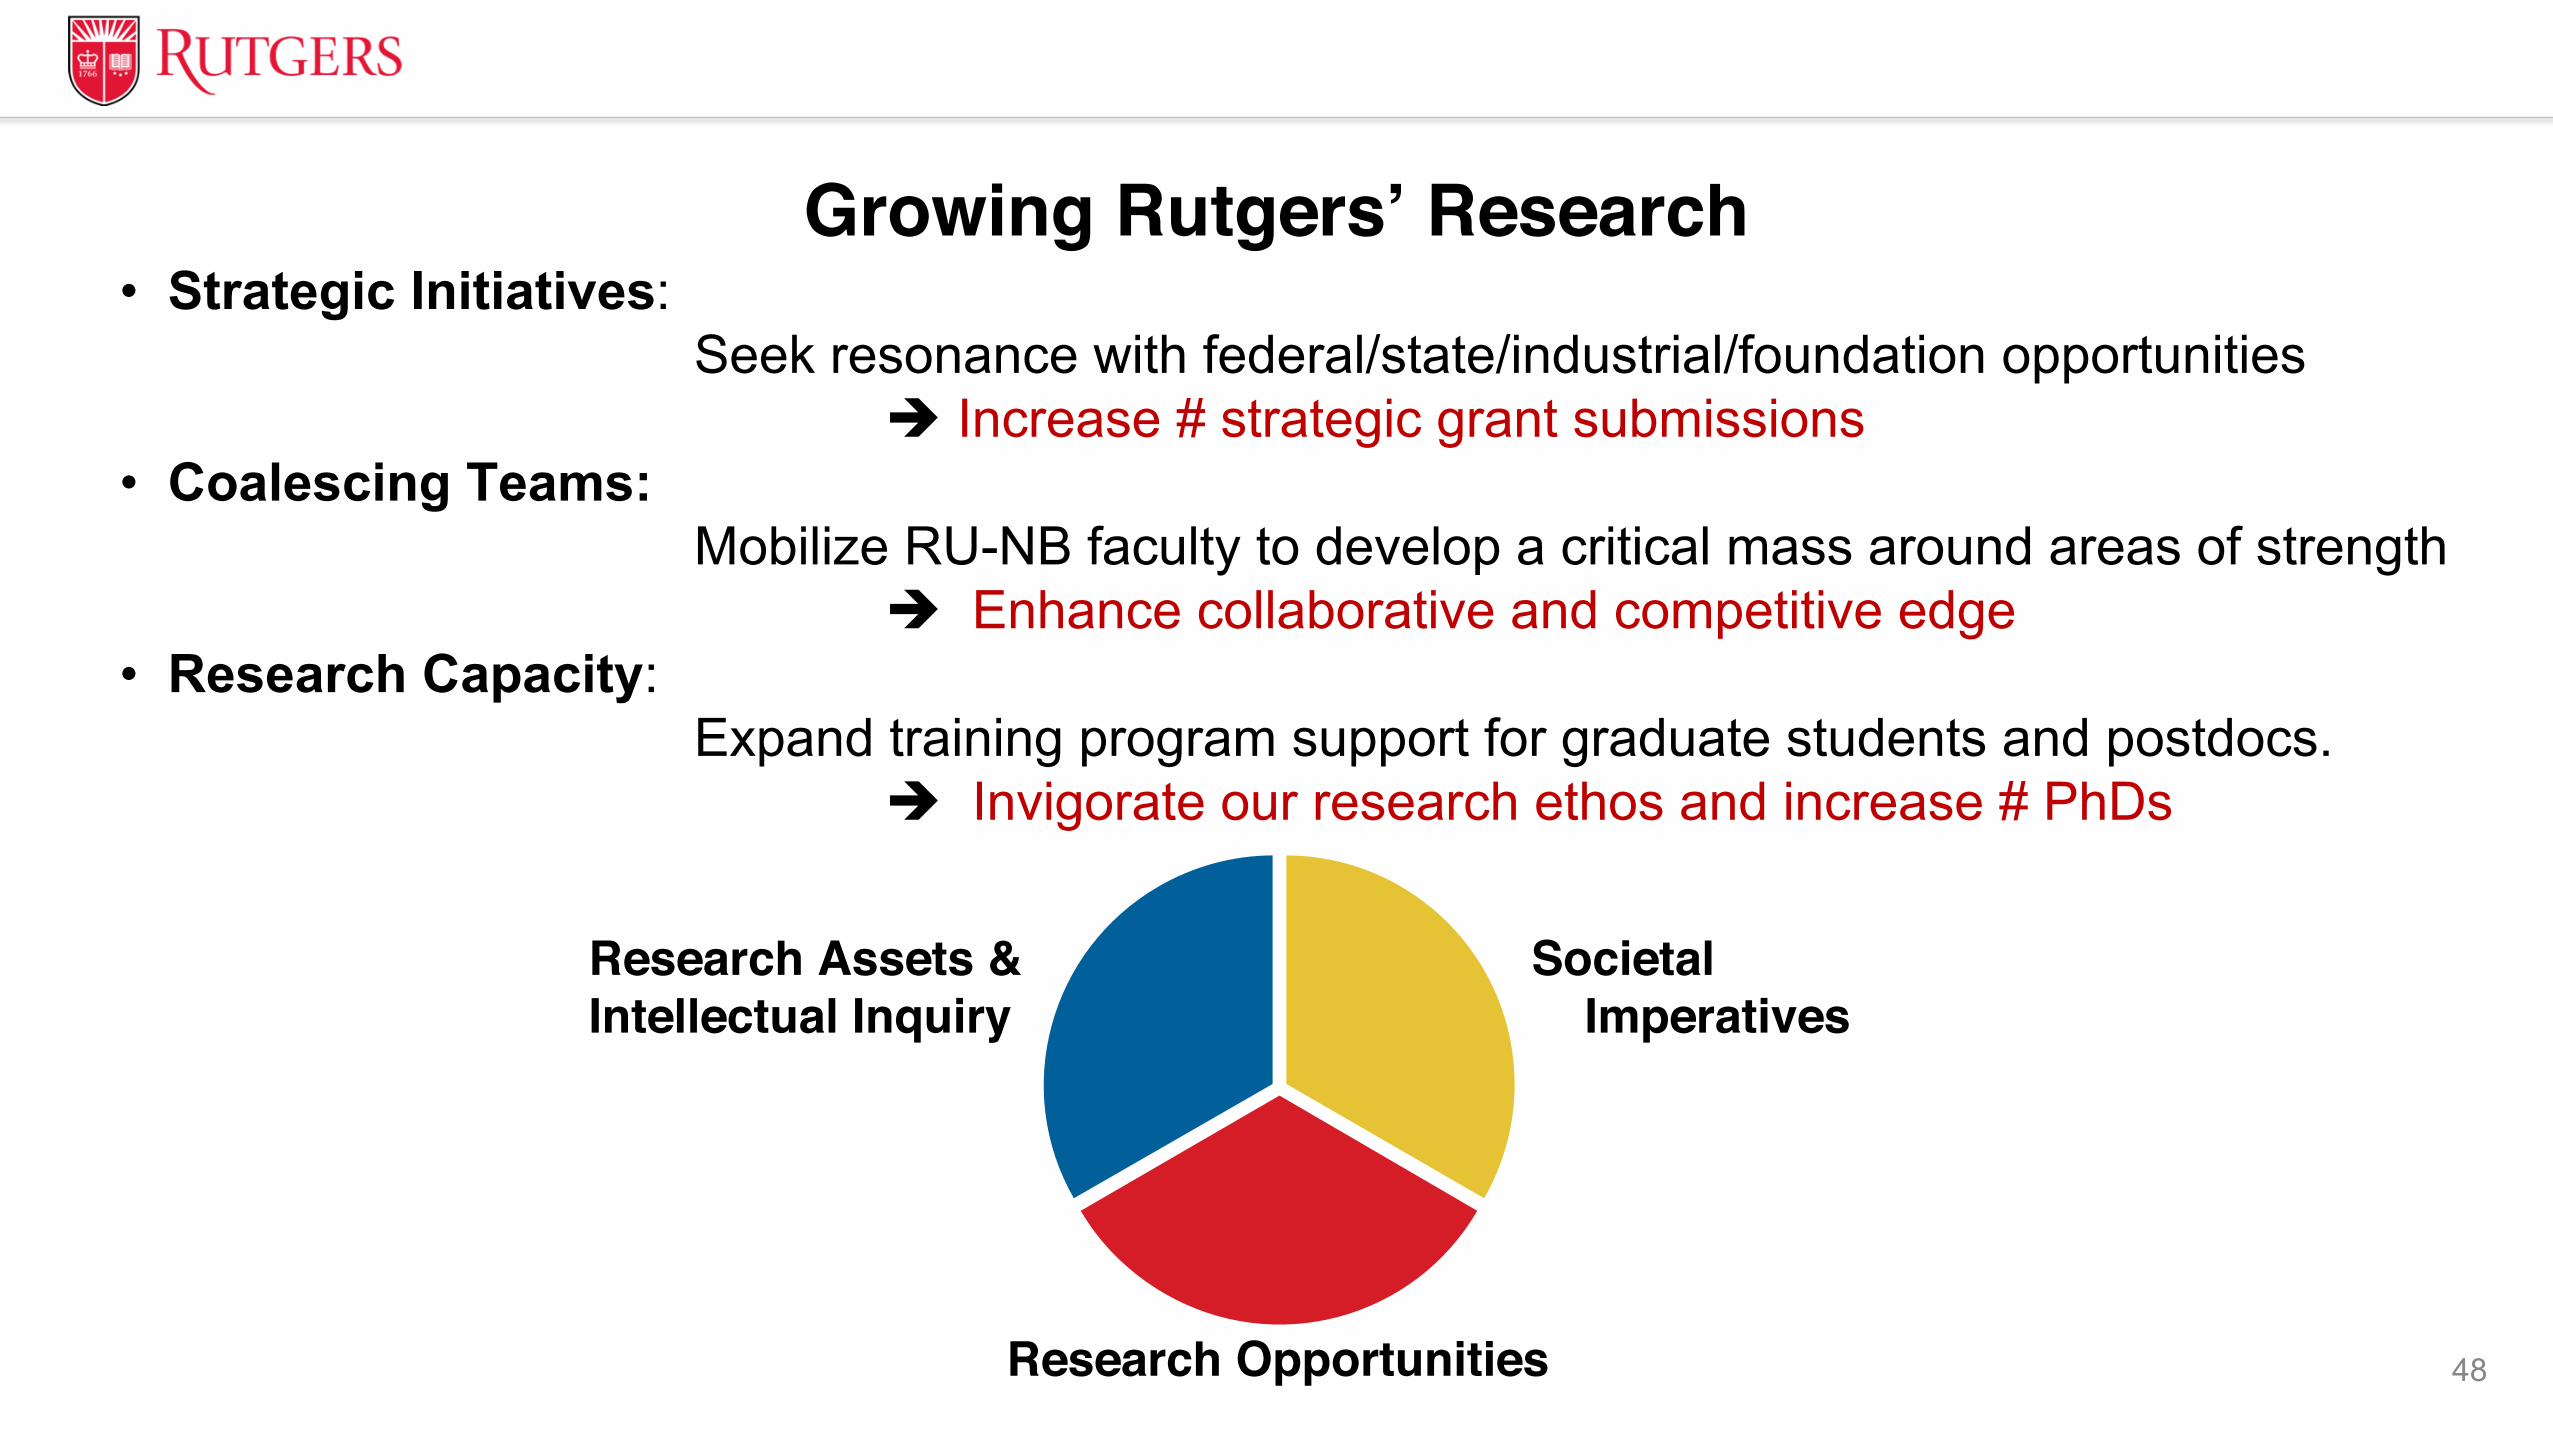
Research Assets & Intellectual Inquiry
Societal Imperatives
Research Opportunities
• Strategic Initiatives: Seek resonance with federal/state/industrial/foundation opportunities
è Increase # strategic grant submissions• Coalescing Teams:
Mobilize RU-NB faculty to develop a critical mass around areas of strengthè Enhance collaborative and competitive edge
• Research Capacity: Expand training program support for graduate students and postdocs.
è Invigorate our research ethos and increase # PhDs
Growing Rutgers’ Research
48

49
Vice Chancellor for Research & InnovationRutgers University–New Brunswick
• Recognize high quality research/grants/initiatives
• Develop faculty mentoring mechanisms
• Ideate new research initiatives and centers across RU-NB
• Seed and assist new training programs (predoctoral, postdoctoral)
• Oversee the growth of current research centers and the next phase
• Develop strategic research partnerships with industry
• Align RU-NB research to federal and state research agency opportunities

A few examples:
• Advanced Materials Initiative
• The Microbiome Project
• Bio/Pharma Manufacturing Institute
• Energy & Sustainability Initiatives
• Security and the Human Element
• …
50
Nucleating the next wave of collaborative research initiatives
The VCRI and the leadership team will engage with RU-NB faculty to nucleate
research initiatives where we can be most competitive. The goal is to be broad
and inclusive while anchoring around our existing and emergent strengths.
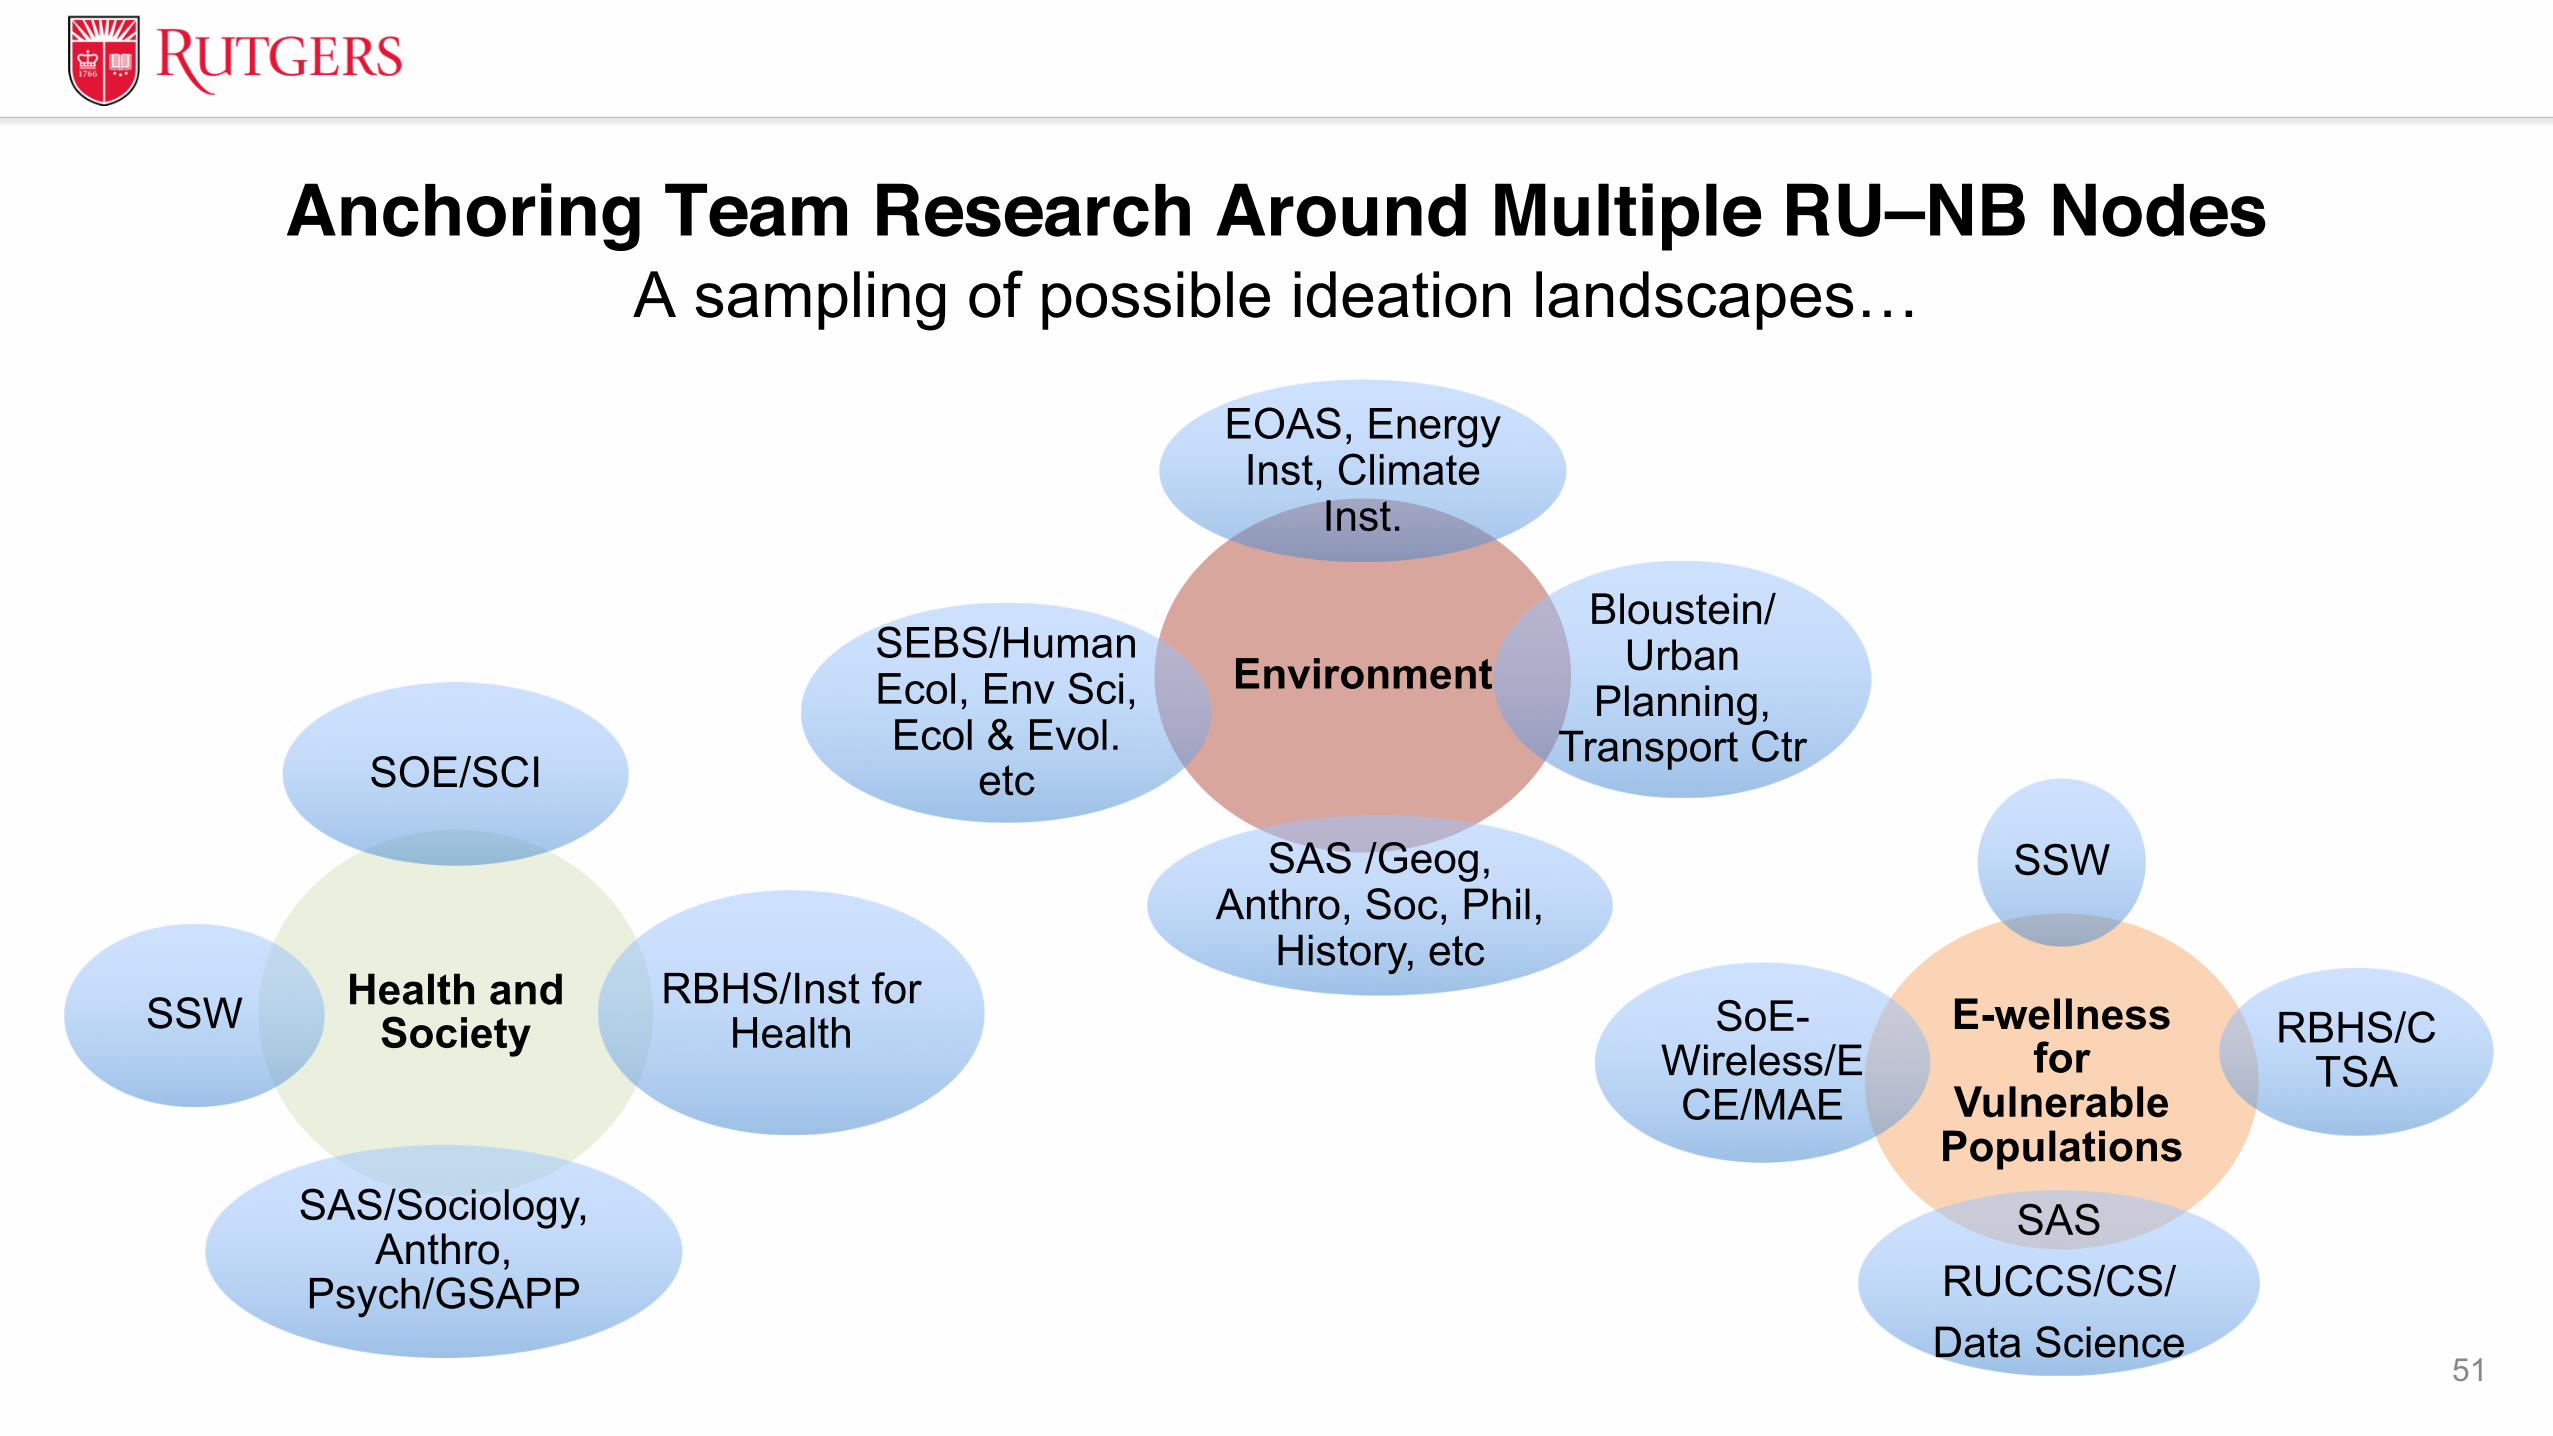
Health and Society
SOE/SCI
RBHS/Inst for
Health
SAS/Sociology,
Anthro,
Psych/GSAPP
SSW
Environment
EOAS, Energy
Inst, Climate
Inst.
Bloustein/
Urban
Planning,
Transport Ctr
SAS /Geog,
Anthro, Soc, Phil,
History, etc
SEBS/Human
Ecol, Env Sci,
Ecol & Evol.
etc
E-wellness for
Vulnerable Populations
SSW
RBHS/C
TSA
SAS
RUCCS/CS/
Data Science
SoE-
Wireless/E
CE/MAE
Anchoring Team Research Around Multiple RU–NB NodesA sampling of possible ideation landscapes…
51
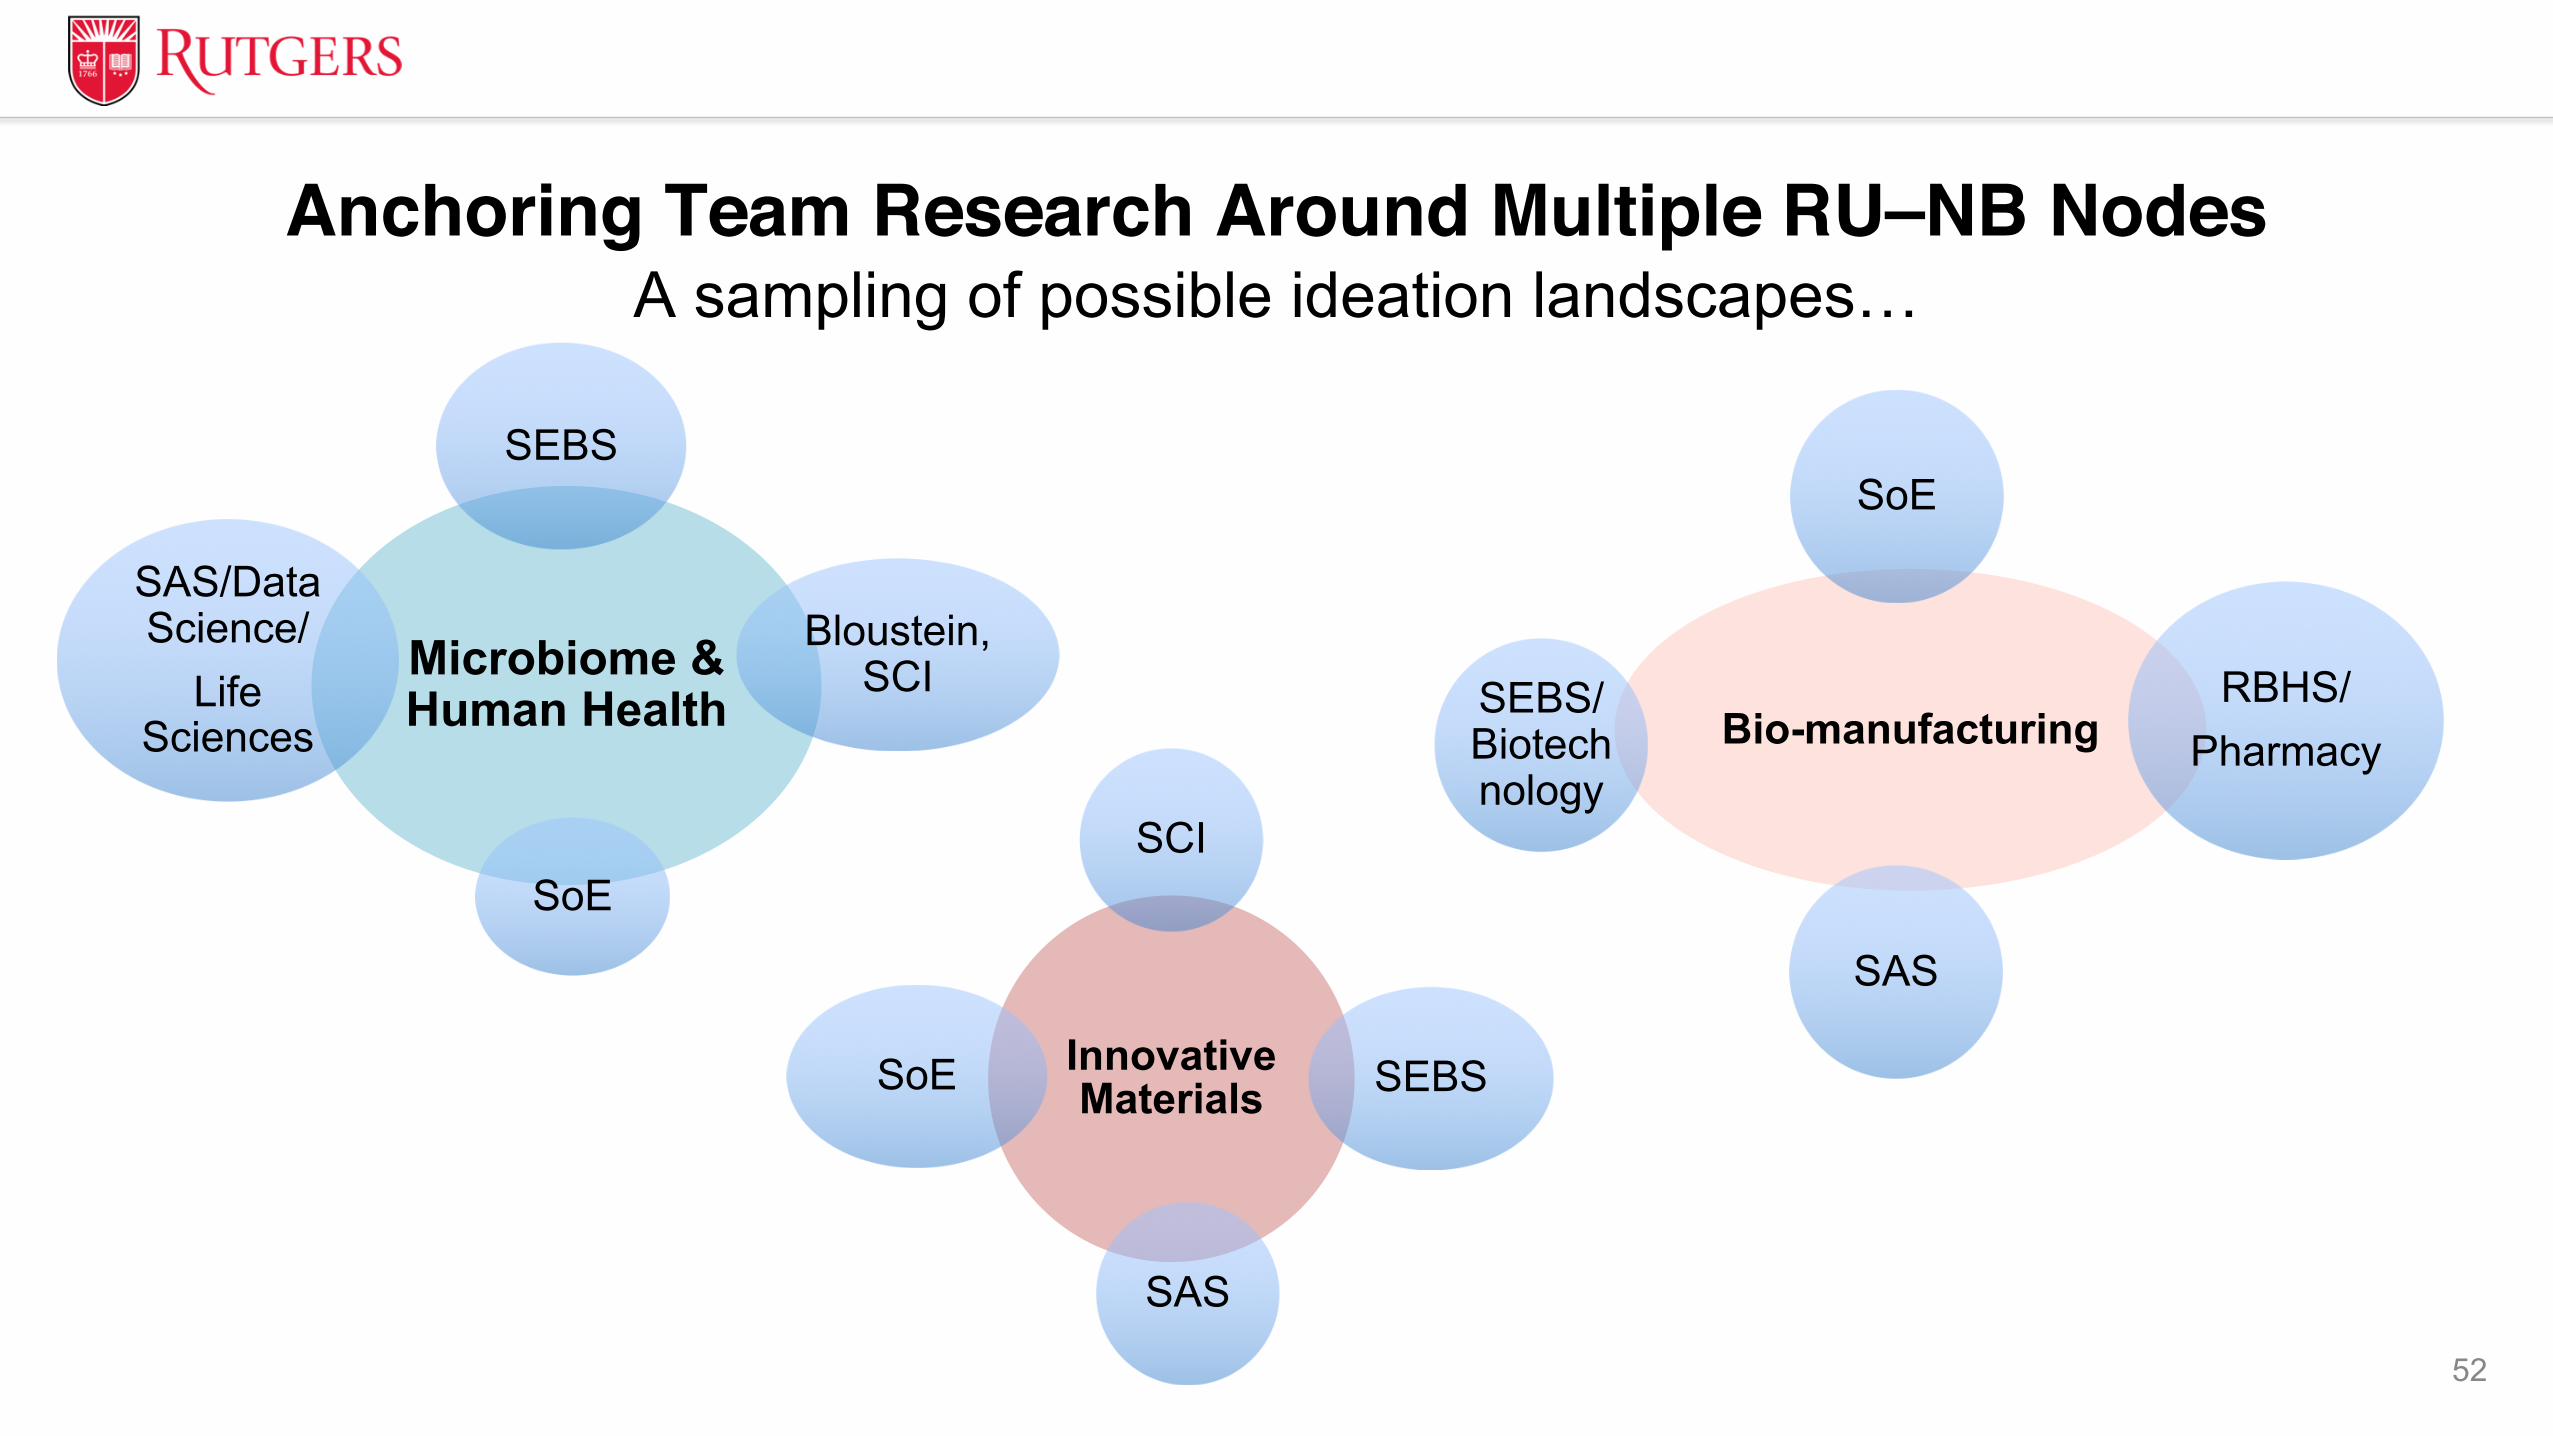
Innovative Materials
SCI
SEBS
SAS
SoE
Bio-manufacturing
SoE
RBHS/Pharmacy
SAS
SEBS/Biotechnology
52
Microbiome & Human Health
SEBS
Bloustein, SCI
SoE
SAS/Data Science/
Life Sciences
Anchoring Team Research Around Multiple RU–NB NodesA sampling of possible ideation landscapes…
53
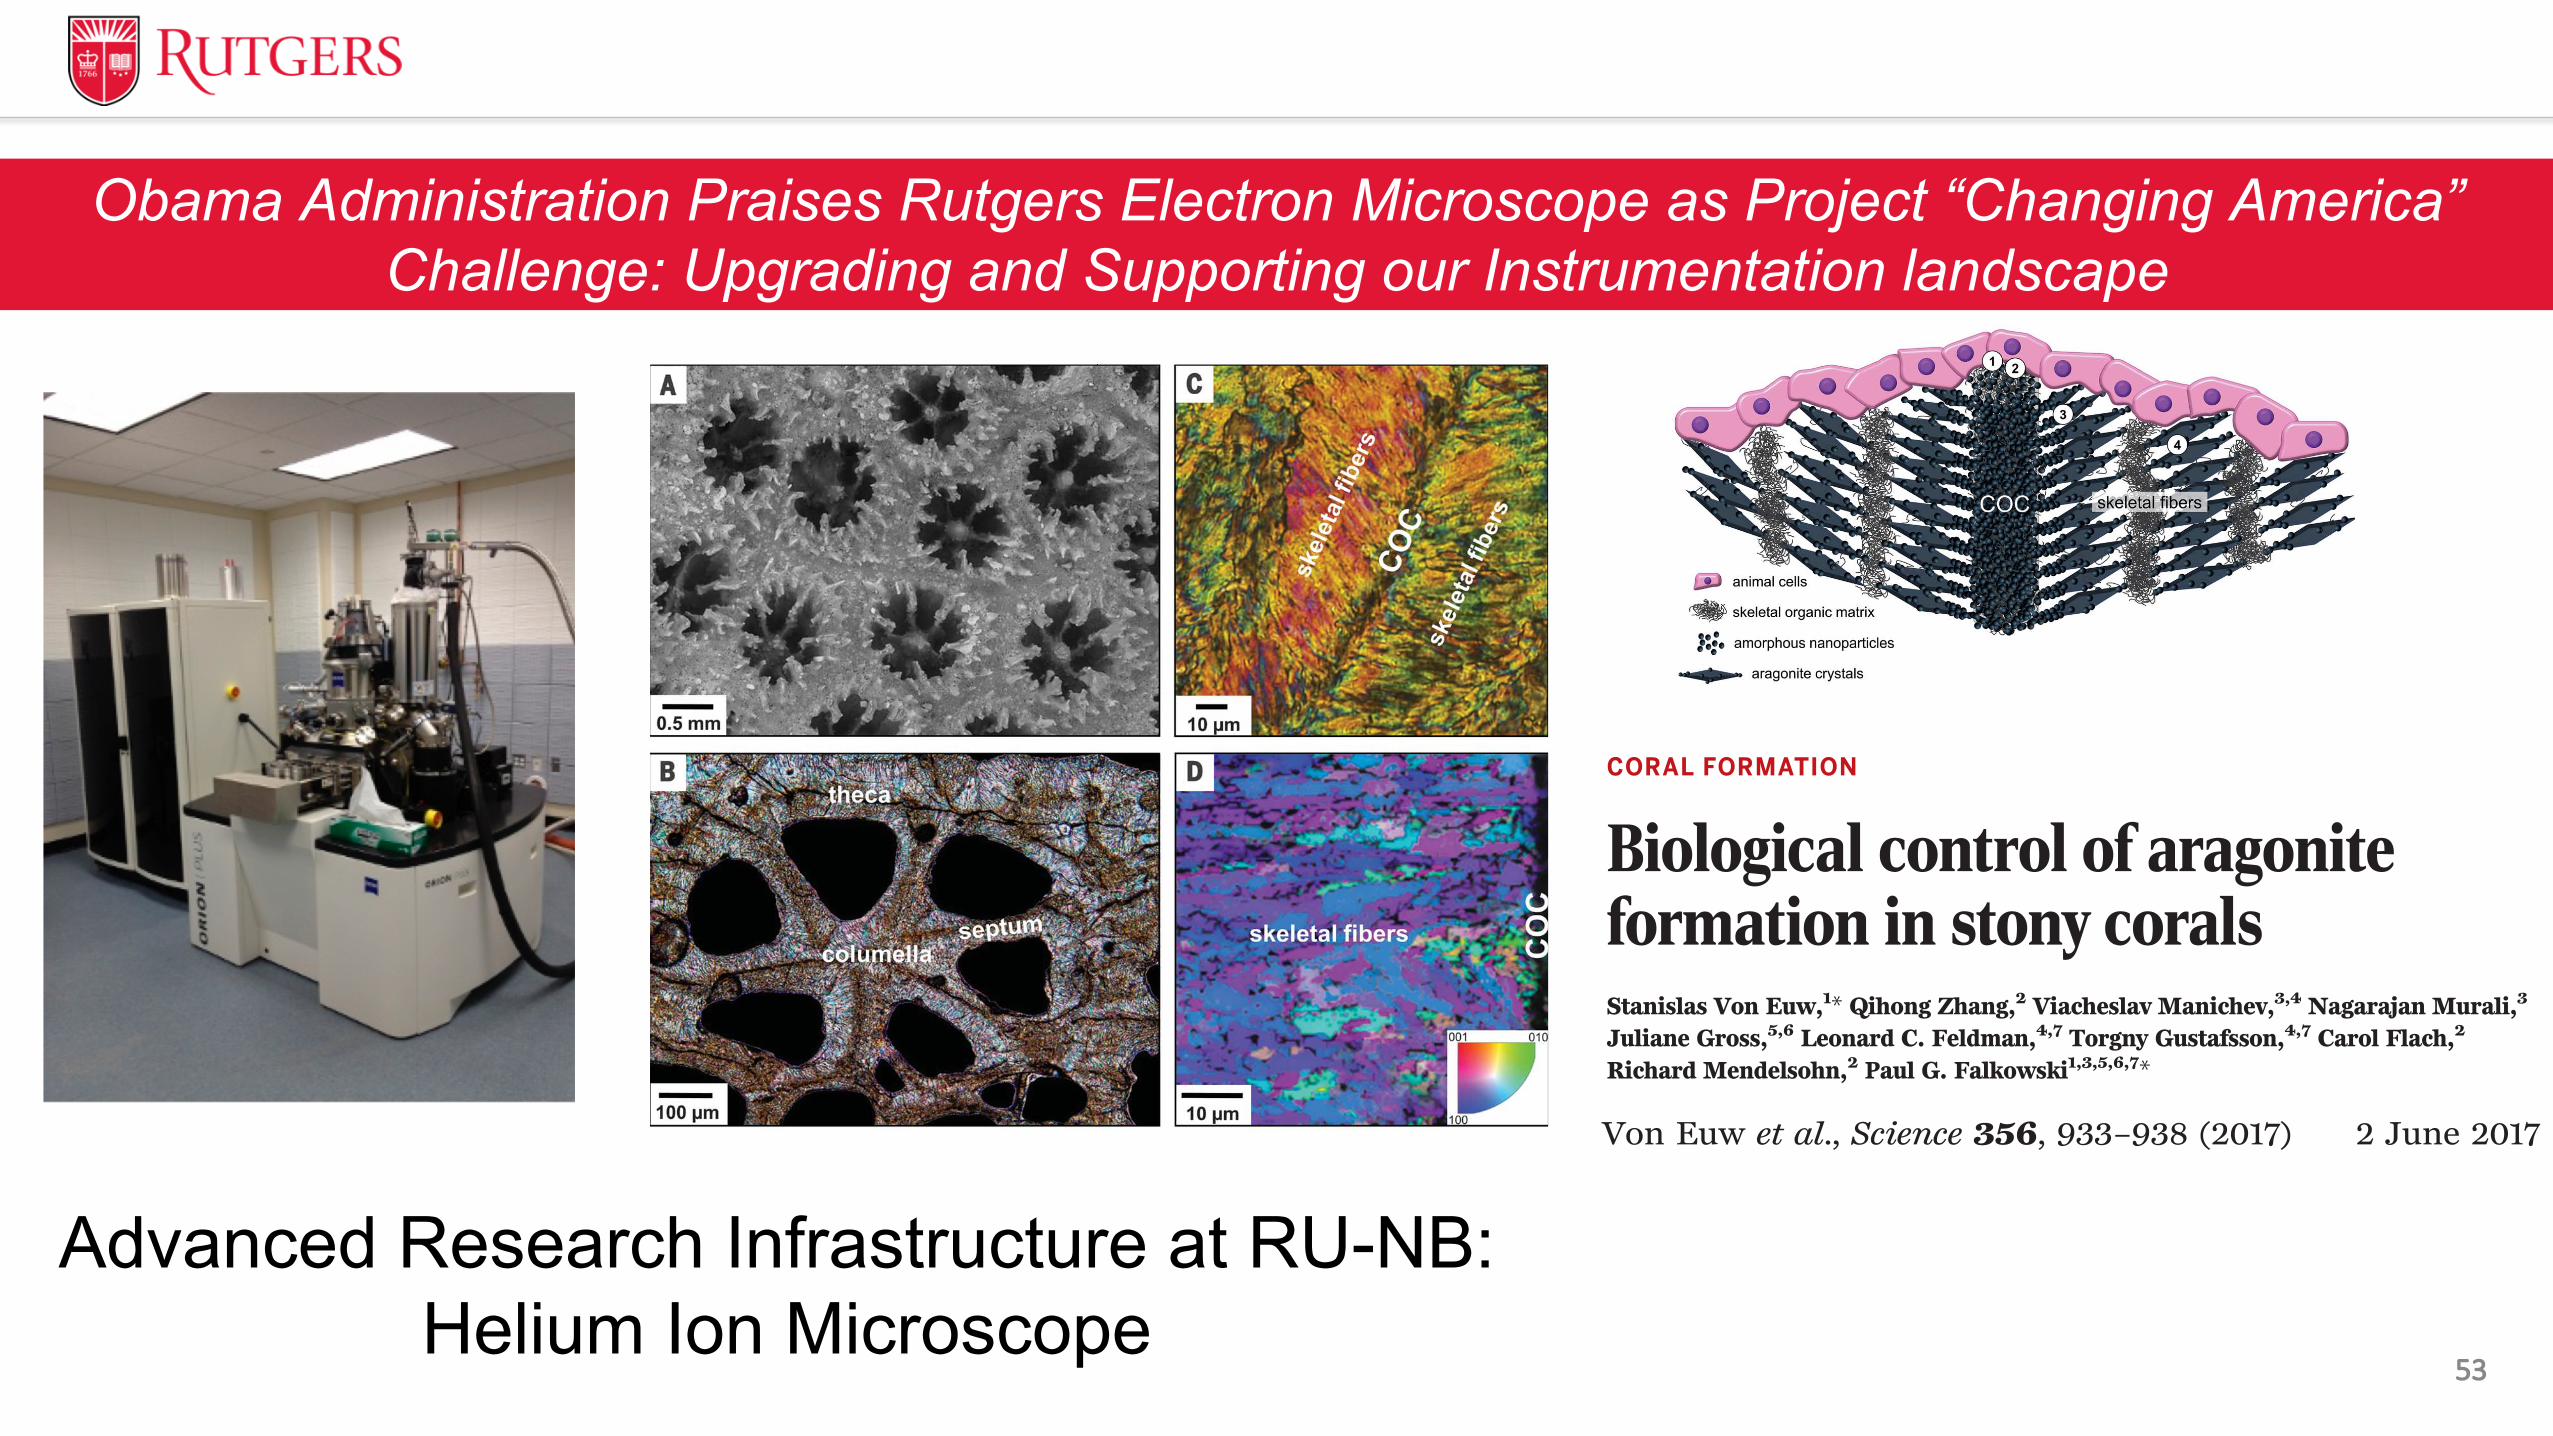
Advanced Research Infrastructure at RU-NB: Helium Ion Microscope
CORAL FORMATION
Biological control of aragoniteformation in stony coralsStanislas Von Euw,1* Qihong Zhang,2 Viacheslav Manichev,3,4 Nagarajan Murali,3
Juliane Gross,5,6 Leonard C. Feldman,4,7 Torgny Gustafsson,4,7 Carol Flach,2
Richard Mendelsohn,2 Paul G. Falkowski1,3,5,6,7*
Little is known about how stony corals build their calcareous skeletons. There are twoprevailing hypotheses: that it is a physicochemically dominated process and that it is abiologically mediated one. Using a combination of ultrahigh-resolution three-dimensionalimaging and two-dimensional solid-state nuclear magnetic resonance (NMR) spectroscopy,we show that mineral deposition is biologically driven. Randomly arranged, amorphousnanoparticles are initially deposited in microenvironments enriched in organic material; theythen aggregate and form ordered aragonitic structures through crystal growth by particleattachment. Our NMR results are consistent with heterogeneous nucleation of the solidmineral phase driven by coral acid-rich proteins. Such a mechanism suggests that stonycorals may be able to sustain calcification even under lower pH conditions that do notfavor the inorganic precipitation of aragonite.
The process by which stony corals deposittheir calcium carbonate skeleton in theform of aragonite has been extensively dis-cussed for decades without the emergenceof a clear consensus (1). There are two pre-
vailing hypotheses: Geochemists generally advo-cate for a physicochemically dominated process(2, 3) based on complex metabolic controls ofcalcifying fluid chemistry, whereas biologistsargue for a biologically controlled process (4–7 )in which the skeletal organic matrix (SOM) se-creted by the animal plays the most importantroles (8). The first hypothesis contends that anincrease (compared with seawater) in pH andthe concentrations of calcium and dissolved in-organic carbon species at the calcification site(9–11) generates metastable conditions suitablefor the nucleation of the mineral phase. The sec-ond hypothesis supposes a template-induced nu-cleation of the mineral phase mediated by theSOM (12, 13) and, in particular, the acid-rich pro-teins (14, 15).Here we examine which of these two hypothe-
ses is valid for stony corals. To this end, we usedthe well-studied, ubiquitous Indo-Pacific stonycoral Stylophora pistillata as a model for inves-
tigating the coral biomineralization process. Weapplied a materials science approach that com-bines Raman imaging and spectroscopy, scan-ning helium ionmicroscopy (SHIM), and solid-statenuclear magnetic resonance (NMR) spectros-copy. This approach reveals the crystallizationpathway of aragonite in corals and provides un-precedented insights into the relation between
the mineral phase and the SOM across differ-ent spatial scales.
Features common to all stony corals
Scanning electron microscope (SEM) images ofthe skeleton of S. pistillata reveal juxtaposedcuplike structures (i.e., calices) whose calcareouswalls constitute the corallites (Fig. 1A). A repre-sentative image of a single corallite shows darkline structures observable along the different mi-cromorphological elements of the skeleton: thecolumella, the septa, and the theca (Fig. 1B). Thesestructures, which appear to be enriched in organ-ic molecules, are called centers of calcification(COCs) (16) and correspond to the initial sites ofcalcification. Higher-resolution images obtainedusing polarized light microscopy (PLM) and elec-tron backscatter diffraction (EBSD) give direct ev-idence that acicular aragonite crystals are orientedoutward from the COCs with homogeneous crys-tallographic orientations (Fig. 1, C and D). Thecrystals form densely packed ordered structurescalled skeletal fibers. These images suggest thatthe skeletal fibers arise from the organic matter–rich environments that constitute the COCs,which supports the hypothesis that the SOMis critical for initiating the deposition of themineral phase (4, 5).
Spatial distribution of the SOM andorientation of the skeletal fibers
We investigated the relation between the SOMand the mineral phase by applying confocal Raman
RESEARCH
Von Euw et al., Science 356, 933–938 (2017) 2 June 2017 1 of 6
1Environmental Biophysics and Molecular Ecology Program,Department of Marine and Coastal Sciences, RutgersUniversity, 71 Dudley Road, New Brunswick, NJ 08901, USA.2Department of Chemistry, Rutgers University, 73 WarrenStreet, Newark, NJ 07102, USA. 3Department of Chemistryand Chemical Biology, Rutgers University, 610 Taylor Road,Piscataway, NJ 08854, USA. 4Institute of AdvancedMaterials, Devices, and Nanotechnology, Rutgers University,607 Taylor Road, Piscataway, NJ 08854, USA. 5Departmentof Earth and Planetary Sciences, Rutgers University, 610Taylor Road, Piscataway, NJ 08854, USA. 6Department ofEarth and Planetary Sciences, The American Museum ofNatural History, Central Park West, 79th Street, New York,NY 10024, USA. 7Department of Physics and Astronomy,Rutgers University, 136 Frelinghuysen Road, Piscataway, NJ08854, USA.*Corresponding author. Email: [email protected](S.V.E.); [email protected] (P.G.F.)
Fig. 1. Morphological skeletal features common to all stony corals. (A) Combination of SEMimages showing the intact surface of a skeletal branch. (B and C) PLM micrographs of a singlecorallite and a trabecula, respectively. (D) EBSD inverse pole figure orientation map of a trabecula.
on January 29, 2018
http://science.sciencemag.org/
Dow
nloaded from
nanoparticles that were also observed by trans-mission electron microscopy (fig. S11).The edge of a COC, where the adjoining skel-
etal fibers start to form, was also closely examined(Fig. 5). This section reveals a clear spatiotemporalevolution of the crystal growth process, showing(i) initially deposited ACC nanoparticles in the
COC (top); (ii) highly textured nascent arago-nite crystals next to the ACC nanoparticles; and(iii) less textured and more “mature,” aciculararagonite crystals on the bottom. All of theseobservations support the hypothesis that ACCnanoparticles are initially deposited in the COCs;they further aggregate and serve as building
blocks for constructing aragonite crystal struc-tures through a crystal growth process referredto as crystallization by particle attachment (25).
Chemical composition of the initialmineral deposits
Cathodoluminescence microscopy (CLM), back-scattered electron imaging, and wavelength-dispersive x-ray spectroscopy (WDXS) mappingwere coupled in an electron microprobe (fig. S12).CLM reveals the localization of the COCs andenables WDXS maps to show variations in thechemical composition across the trabeculae. Theelongated white regions of the CLM image cor-respond to COCs (fig. S12A and Fig. 2A3), whichcoincide with magnesium-rich regions, accord-ing to the WDXS map (fig. S12B). Further, aSHIM micrograph confirms the presence ofspherical nanoparticles in a COC exposed byCLM and CRM (fig. S12C). These observationsand measurements support that the initial min-eral deposits consist of magnesium-rich ACC nano-particles. This confirms previous observations incorals (26, 27 ) and supports the hypothesis thatmagnesium stabilizes ACC (28).
Conclusions
Our results elucidate the basic steps of the min-eral deposition process in stony corals (Fig. 6).The process is initiated by the formation of atransient disordered precursor phase, which isprobably in the form of ACC nanoparticles.This is not specific to stony corals; analogousACC precursor phases have been observed inother marine organisms, including in the arag-onitic nacre layer of abalone shells (24), thecalcitic spicules of sea urchin larvae (29), andthe spines of sea urchins (30). Our measure-ments indicate that the lifetime of these ACCnanoparticles is likely to be prolonged becausethey are rich in magnesium (28). Whether theinitial mineral deposits are formed by the cellsinside vesicles (31) or extracellularly at the cal-cifying interface between the calicoblastic ec-todermal cells and the skeleton (6, 7 ) remainsunclear. However, our results not only revealthat ACC precursor nanoparticles are depositedin microenvironments that are enriched in SOMsecreted by the animal (i.e., the COCs), butalso show that an organic substrate, in the formof fibers, appears to serve as a nucleation site.Further, our results suggest the presence ofskeletal proteins strongly bound to and/or trap-ped within the highly disordered calcium carbon-ate environments that coat the aragonite crystals.These features are consistent with a heteroge-neous nucleation of the solid mineral phasecatalyzed by coral acid-rich proteins (12), whichare present in the COCs (32) and can precip-itate aragonite directly from seawater (15). Asmore and more ACC nanoparticles are formed,they migrate from the COCs, lose magnesium,and grow to become acicular aragonite crystalsby attachment of amorphous precursor nano-particles (25).Last, our results strongly suggest that the abil-
ity of corals to calcify is biologically controlled
Von Euw et al., Science 356, 933–938 (2017) 2 June 2017 5 of 6
Fig. 5. The crystal growth process.SHIM micrograph from a restrictedarea of a trabecula composed of skeletalfibers (bottom region) that arisefrom the COC (top region). Theseobservations were obtained from thebroken, unpolished, etched surfaceof a skeletal branch that wastransversely sectioned.
Fig. 6. Working model of coral biomineralization. Step 1, secretion of the SOM by the animalcells. Step 2, deposition of magnesium-rich ACC nanoparticles mediated by the SOM. Steps 1and 2 might happen simultaneously. Step 3, growth of acicular aragonite crystals by attachment ofamorphous precursor nanoparticles. Step 4, formation of the skeletal fibers through the “layeredmodel” (38) of skeletal growth.
RESEARCH | RESEARCH ARTICLE
on January 29, 2018
http://science.sciencemag.org/
Dow
nloaded from
CORAL FORMATION
Biological control of aragoniteformation in stony coralsStanislas Von Euw,1* Qihong Zhang,2 Viacheslav Manichev,3,4 Nagarajan Murali,3
Juliane Gross,5,6 Leonard C. Feldman,4,7 Torgny Gustafsson,4,7 Carol Flach,2
Richard Mendelsohn,2 Paul G. Falkowski1,3,5,6,7*
Little is known about how stony corals build their calcareous skeletons. There are twoprevailing hypotheses: that it is a physicochemically dominated process and that it is abiologically mediated one. Using a combination of ultrahigh-resolution three-dimensionalimaging and two-dimensional solid-state nuclear magnetic resonance (NMR) spectroscopy,we show that mineral deposition is biologically driven. Randomly arranged, amorphousnanoparticles are initially deposited in microenvironments enriched in organic material; theythen aggregate and form ordered aragonitic structures through crystal growth by particleattachment. Our NMR results are consistent with heterogeneous nucleation of the solidmineral phase driven by coral acid-rich proteins. Such a mechanism suggests that stonycorals may be able to sustain calcification even under lower pH conditions that do notfavor the inorganic precipitation of aragonite.
The process by which stony corals deposittheir calcium carbonate skeleton in theform of aragonite has been extensively dis-cussed for decades without the emergenceof a clear consensus (1). There are two pre-
vailing hypotheses: Geochemists generally advo-cate for a physicochemically dominated process(2, 3) based on complex metabolic controls ofcalcifying fluid chemistry, whereas biologistsargue for a biologically controlled process (4–7 )in which the skeletal organic matrix (SOM) se-creted by the animal plays the most importantroles (8). The first hypothesis contends that anincrease (compared with seawater) in pH andthe concentrations of calcium and dissolved in-organic carbon species at the calcification site(9–11) generates metastable conditions suitablefor the nucleation of the mineral phase. The sec-ond hypothesis supposes a template-induced nu-cleation of the mineral phase mediated by theSOM (12, 13) and, in particular, the acid-rich pro-teins (14, 15).Here we examine which of these two hypothe-
ses is valid for stony corals. To this end, we usedthe well-studied, ubiquitous Indo-Pacific stonycoral Stylophora pistillata as a model for inves-
tigating the coral biomineralization process. Weapplied a materials science approach that com-bines Raman imaging and spectroscopy, scan-ning helium ionmicroscopy (SHIM), and solid-statenuclear magnetic resonance (NMR) spectros-copy. This approach reveals the crystallizationpathway of aragonite in corals and provides un-precedented insights into the relation between
the mineral phase and the SOM across differ-ent spatial scales.
Features common to all stony corals
Scanning electron microscope (SEM) images ofthe skeleton of S. pistillata reveal juxtaposedcuplike structures (i.e., calices) whose calcareouswalls constitute the corallites (Fig. 1A). A repre-sentative image of a single corallite shows darkline structures observable along the different mi-cromorphological elements of the skeleton: thecolumella, the septa, and the theca (Fig. 1B). Thesestructures, which appear to be enriched in organ-ic molecules, are called centers of calcification(COCs) (16) and correspond to the initial sites ofcalcification. Higher-resolution images obtainedusing polarized light microscopy (PLM) and elec-tron backscatter diffraction (EBSD) give direct ev-idence that acicular aragonite crystals are orientedoutward from the COCs with homogeneous crys-tallographic orientations (Fig. 1, C and D). Thecrystals form densely packed ordered structurescalled skeletal fibers. These images suggest thatthe skeletal fibers arise from the organic matter–rich environments that constitute the COCs,which supports the hypothesis that the SOMis critical for initiating the deposition of themineral phase (4, 5).
Spatial distribution of the SOM andorientation of the skeletal fibers
We investigated the relation between the SOMand the mineral phase by applying confocal Raman
RESEARCH
Von Euw et al., Science 356, 933–938 (2017) 2 June 2017 1 of 6
1Environmental Biophysics and Molecular Ecology Program,Department of Marine and Coastal Sciences, RutgersUniversity, 71 Dudley Road, New Brunswick, NJ 08901, USA.2Department of Chemistry, Rutgers University, 73 WarrenStreet, Newark, NJ 07102, USA. 3Department of Chemistryand Chemical Biology, Rutgers University, 610 Taylor Road,Piscataway, NJ 08854, USA. 4Institute of AdvancedMaterials, Devices, and Nanotechnology, Rutgers University,607 Taylor Road, Piscataway, NJ 08854, USA. 5Departmentof Earth and Planetary Sciences, Rutgers University, 610Taylor Road, Piscataway, NJ 08854, USA. 6Department ofEarth and Planetary Sciences, The American Museum ofNatural History, Central Park West, 79th Street, New York,NY 10024, USA. 7Department of Physics and Astronomy,Rutgers University, 136 Frelinghuysen Road, Piscataway, NJ08854, USA.*Corresponding author. Email: [email protected](S.V.E.); [email protected] (P.G.F.)
Fig. 1. Morphological skeletal features common to all stony corals. (A) Combination of SEMimages showing the intact surface of a skeletal branch. (B and C) PLM micrographs of a singlecorallite and a trabecula, respectively. (D) EBSD inverse pole figure orientation map of a trabecula.
on January 29, 2018
http://science.sciencemag.org/
Downloaded from
Obama Administration Praises Rutgers Electron Microscope as Project “Changing America”Challenge: Upgrading and Supporting our Instrumentation landscape

VP for Research & Economic DevelopmentRutgers University
• Pre- and post-award grants support
• Research analytics
• IP and Commercialization
• Economic Development/outreach to
industries
• Regulatory Affairs
• Animal Facilities (IACUC)
• Research Computing Services
• Innovation Park
Vice Chancellor for Research & InnovationRutgers University—New Brunswick
• Recognize high quality
research/grants/initiatives
• Develop faculty mentoring mechanisms
• Ideate new research initiatives and centers
• Seed and assist new training programs
(predoctoral, postdoctoral)
• Oversee the growth of current research
centers and next phase
• Develop strategic research partnerships
with industry
• Align RU-NB research to federal and state
research agency opportunities
OVCRI –ORED
54
Vice Chancellor for Research & InnovationWe welcome your ideas and engagement

55
Questions/Comments?
Ideas for Future Conversations?
THANK YOU!