cAMP - bio-connectdiagnostics.nl · (agonist or antagonist). The optimal assay conditions will also...
34
A Guide To Optimizing Antagonists of Gαi/o www.cisbio.com/cAMP-Gi cAMP
Transcript of cAMP - bio-connectdiagnostics.nl · (agonist or antagonist). The optimal assay conditions will also...

A Guide To Optimizing Antagonists of Gαi/o
www.cisbio.com/cAMP-Gi
cAMP


Purpose.............................................................................. 5Background....................................................................... 5Reagents and optimization workflow ........................... 8Cell Preparation ............................................................. 11
Before You Begin 12Freshly Harvested Cells 13Cryopreserved Cells 14Plate Formats And Volumes 14
Gαi Agonist Assay Optimization .................................. 15Dispensing Formats 16Standard Curve 19Choice Of Stimulation Buffer 21Forskolin Concentration Optimization 22Cell Density 23Phosphodiesterase (PDE) Inhibitors 25Optimized Condition For Antagonist Testing 26
Gαi Antagonist Assay Optimization ............................ 27Dispensing Formats 28Stimulation Time 30Antagonist Dose Response 31
Data Reduction And Analysis ...................................... 32Contact............................................................................. 34Summary
Summary............................................................................ 3

Purpose
Background
6www.cisbio.com/cAMP-Gi
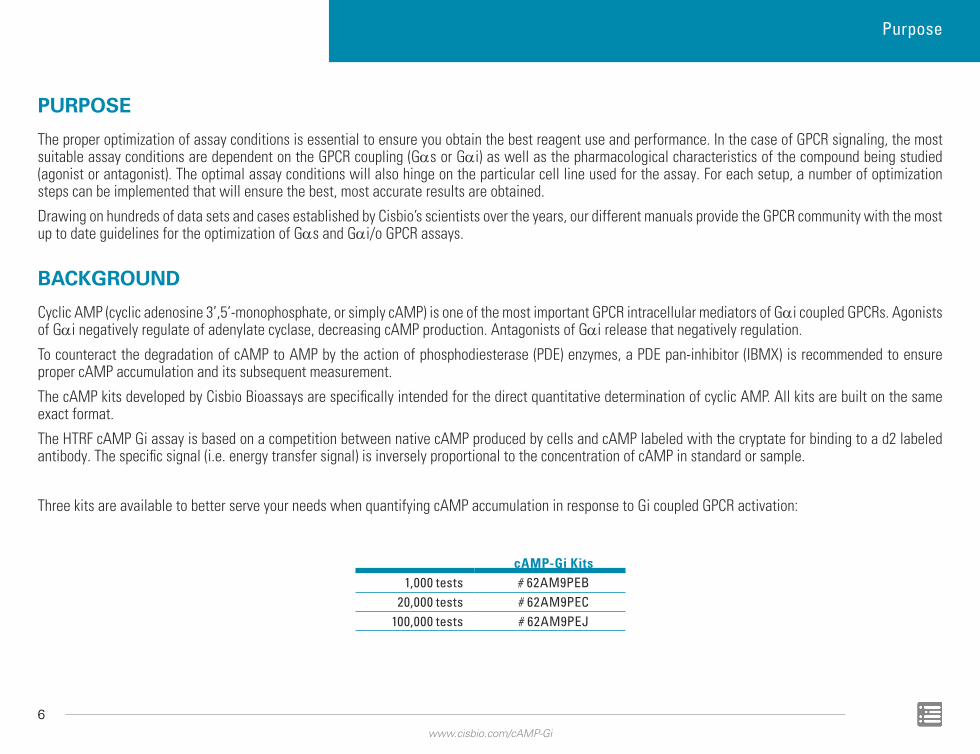
PURPOSE
The proper optimization of assay conditions is essential to ensure you obtain the best reagent use and performance. In the case of GPCR signaling, the most suitable assay conditions are dependent on the GPCR coupling (Gαs or Gαi) as well as the pharmacological characteristics of the compound being studied (agonist or antagonist). The optimal assay conditions will also hinge on the particular cell line used for the assay. For each setup, a number of optimization steps can be implemented that will ensure the best, most accurate results are obtained.
Drawing on hundreds of data sets and cases established by Cisbio’s scientists over the years, our different manuals provide the GPCR community with the most up to date guidelines for the optimization of Gαs and Gαi/o GPCR assays.
BACKGROUND
Cyclic AMP (cyclic adenosine 3’,5’-monophosphate, or simply cAMP) is one of the most important GPCR intracellular mediators of Gαi coupled GPCRs. Agonists of Gαi negatively regulate of adenylate cyclase, decreasing cAMP production. Antagonists of Gαi release that negatively regulation.
To counteract the degradation of cAMP to AMP by the action of phosphodiesterase (PDE) enzymes, a PDE pan-inhibitor (IBMX) is recommended to ensure proper cAMP accumulation and its subsequent measurement.
The cAMP kits developed by Cisbio Bioassays are specifically intended for the direct quantitative determination of cyclic AMP. All kits are built on the same exact format.
The HTRF cAMP Gi assay is based on a competition between native cAMP produced by cells and cAMP labeled with the cryptate for binding to a d2 labeled antibody. The specific signal (i.e. energy transfer signal) is inversely proportional to the concentration of cAMP in standard or sample.
Three kits are available to better serve your needs when quantifying cAMP accumulation in response to Gi coupled GPCR activation:
cAMP-Gi Kits1,000 tests # 62AM9PEB
20,000 tests # 62AM9PEC100,000 tests # 62AM9PEJ
Purpose

7www.cisbio.com/cAMP-Gi
Gi/o pathway A Gi antagonist prevents the negative regulation of adenylate cyclase by an agonist. In the presence of a Gi antagonist, Forskolin is free to positively stimulate adenylate cyclase, resulting in an increase in cAMP production.
Background
Reagents and optimization workflow
9www.cisbio.com/cAMP-Gi
REAGENTS
REAGENT PREPARATION
Phosphodiesterase inhibitorsPDEs are represented by a large super-family of enzymes whose role is to hydrolyze cAMP into AMP, and cGMP into GMP. It should be emphasized that while not all PDEs lead to the specific hydrolysis of cAMP, the non-selective PDE inhibitor IBMX is often the preferred chemical used in most cAMP accumulation assays. The use of a Pan-PDE inhibitor ensures that the hydrolysis effect of most PDEs will be inhibited, which in turn guarantees high levels of cAMP accumulation in the cell.IBMX stock solution is offred as spare reagents in DMSO at a concentration of 500 nM (40 µl size Cat # 62AMXADA / 500 µl size Cat # 62AMXADC).Ideally, the IBMX concentration to be used in the assay should be optimized, and a procedure for this optimization is provided in the Phosphodiesterase inhibitor section of the manual (Page 27). Alternatively, a recommended concentration of 0.5 mM in the stimulation buffer can be selected, and should be enough to study cAMP accumulation in most cell types.
Choice of stimulation bufferStimulation buffer included in the kits is used to prepare the cells and all the chemicals and compounds needed in the assay. Note that Cisbio’s cAMP kits are also compatible with all suitable nutrient media (DMEM, HAM-F12, HBSS, note that PBS is not recommended) and any of them can be used in the assay as an alternative to the supplied stimulation buffer.The stimulation buffer should be supplemented with IBMX, as previously described. Example: To prepare 10 mL of complete stimulation buffer, add 10 µl of IBMX stock solution at 500 mM to 9.990 ml of buffer or medium. Adding the IBMX just before use leads to improved assay performance.
StandardsThe standard vial contains a known concentration of cAMP. Further dilutions of this standard can be used to establish a standard curve. Using the standard curve, the fluorescence units from the assay can be converted into concentrations of cAMP. It is recommended to use the same stimulation as that used for the cell based assay to quantify cAMP released by the cells.Example: If DMEM + 0.5 mM IBMX were used to prepare the cells, then the same solution should also be used to reconstitute the standard and then dilute it.
Adenylyl cyclase activatorForskolin activates the adenylyl cyclase enzyme and increases the intracellular level of cAMP. It is used as a positive control for Gs applications ( biological models validation, maximal intracellular cAMP modulation determination). It is highly used for Gi coupled receptor study as a pre-activation step to reveal a cAMP inhibition upon cell stimulation.The forskolin stock solution is provided in DMSO at 10 mM (40 µl size Cat # 62AMYADA / 800 µl size Cat # 62AMYADC).For reconstitution, refer to the package insert of the kit.
Reagents and optimization workflow / Reagents
10www.cisbio.com/cAMP-Gi
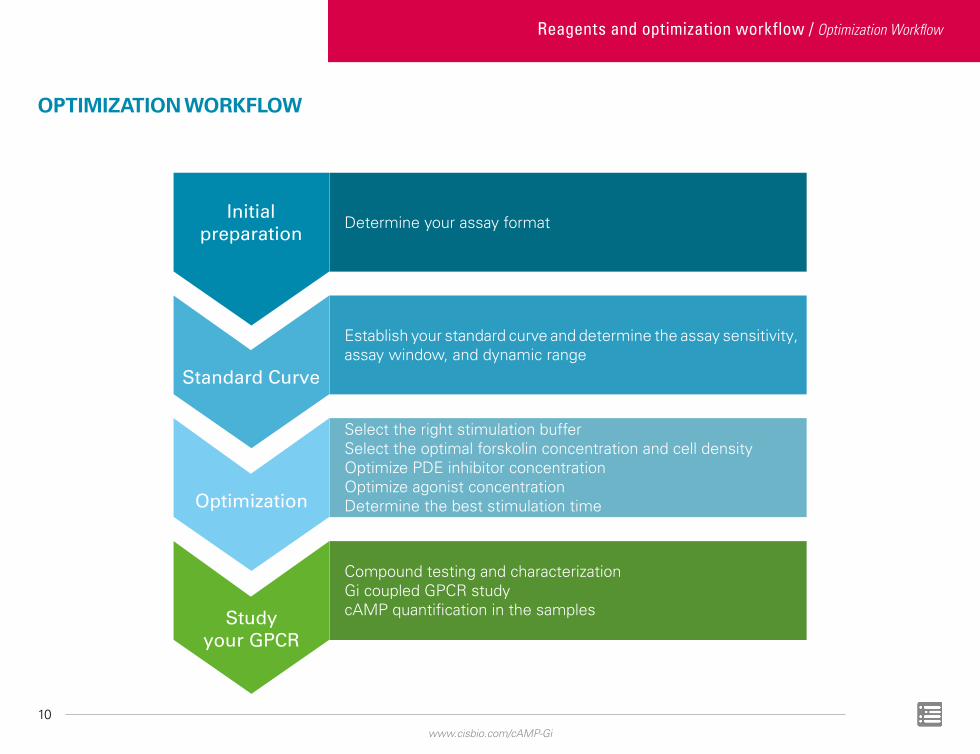
OPTIMIZATION WORKFLOW
Initial preparation
Standard Curve
Optimization
Study your GPCR
Determine your assay format
Establish your standard curve and determine the assay sensitivity, assay window, and dynamic range
Select the right stimulation buffer Select the optimal forskolin concentration and cell density Optimize PDE inhibitor concentrationOptimize agonist concentration Determine the best stimulation time
Compound testing and characterization Gi coupled GPCR study cAMP quantification in the samples
Reagents and optimization workflow / Optimization Workflow
Cell Preparation
12www.cisbio.com/cAMP-Gi
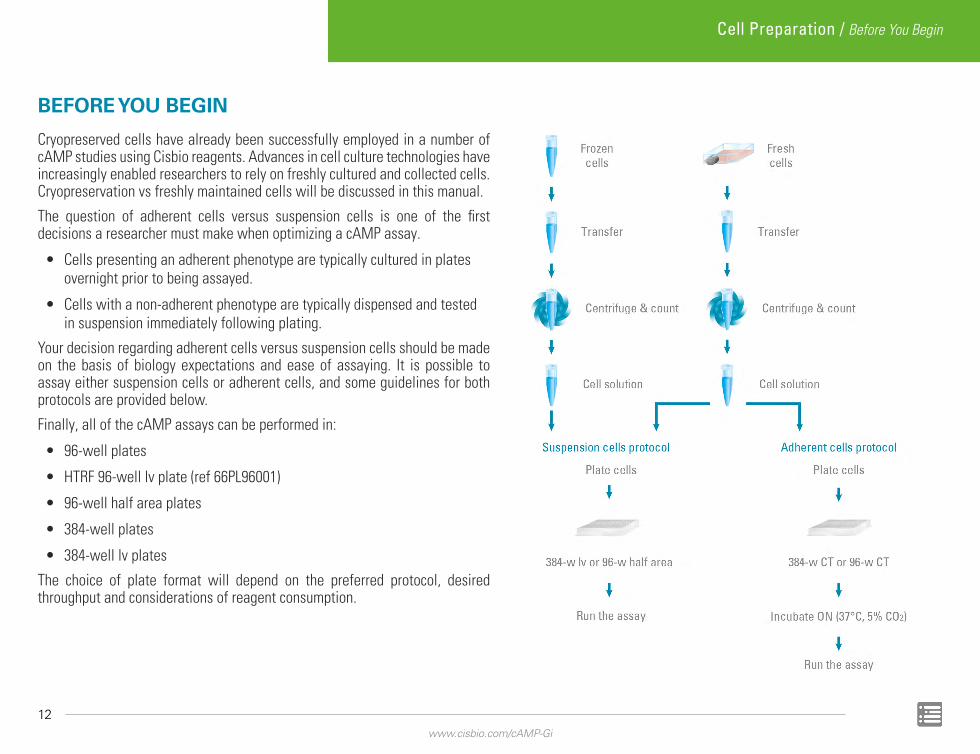
BEFORE YOU BEGIN
Cryopreserved cells have already been successfully employed in a number of cAMP studies using Cisbio reagents. Advances in cell culture technologies have increasingly enabled researchers to rely on freshly cultured and collected cells. Cryopreservation vs freshly maintained cells will be discussed in this manual.
The question of adherent cells versus suspension cells is one of the first decisions a researcher must make when optimizing a cAMP assay.
• Cells presenting an adherent phenotype are typically cultured in plates overnight prior to being assayed.
• Cells with a non-adherent phenotype are typically dispensed and tested in suspension immediately following plating.
Your decision regarding adherent cells versus suspension cells should be made on the basis of biology expectations and ease of assaying. It is possible to assay either suspension cells or adherent cells, and some guidelines for both protocols are provided below.
Finally, all of the cAMP assays can be performed in:
• 96-well plates
• HTRF 96-well lv plate (ref 66PL96001)
• 96-well half area plates
• 384-well plates
• 384-well lv plates
The choice of plate format will depend on the preferred protocol, desired throughput and considerations of reagent consumption.
Cell Preparation / Before You Begin

13www.cisbio.com/cAMP-Gi
FRESHLY HARVESTED CELLS
Suspension protocol (for biologically adherent cells) • Cells from T175 cm2 flasks should be near 80% confluency before collection. • Remove culture medium and gently rinse flask using PBS.• Add cell dissociating solution (5 ml for a T175 cm2 flask), incubate the plate at 37 °C and 5% CO2 for 5–10 min or until cells are dislodged.• Add 5 ml of PBS to a final volume of 10 mL and pipette up and down until cells are homogeneously dispersed in the solution.• Spin the cell suspension at 340 g for 3 min.• Calculate the volume of stimulation buffer needed to re-suspend the cell pellet, achieving an optimal cell density. • Always use the stimulation buffer, as previously discussed, when re-suspending the cells. Cell density should be optimized.
Refer to the later sections of this manual for recommendations regarding cell density optimization.• The cells are ready to be dispensed into the assay plate. Refer to table on next page for recommended dispensing volumes.
• Run the assay.
Adherent protocol • Cells from T175 cm2 flasks should be near 80% confluency before collection.• Remove culture medium and gently rinse flask using PBS.• Add cell dissociating solution (5 ml for a T175 cm2 flask), incubate the plate at 37 °C and 5% CO2 for 5–10 min or until cells are dislodged.• Add 5 ml of PBS to a final volume of 10 mL and pipette up and down until cells are homogeneously dispersed in solution.• Spin the cell suspension at 340 g for 3 min. • Calculate the volume of complete growth medium needed to re-suspend the cell pellet, achieving an optimal cell density. • Cell density should be optimized. Refer to the later sections of this manual for recommendations regarding cell density optimization.• The use of cell-culture treated well-plates or Poly-d-Lysine coated plates is preferable.• The cells are ready to be dispensed into the assay plate. Refer to table on next page for recommended dispensing volumes.• Incubate overnight at 37°C, 5% CO2. • Flip the plate to remove the cell supernatant.
• Run the assay.
Cell Preparation / Freshly Harvested Cells

14www.cisbio.com/cAMP-Gi
CRYOPRESERVED CELLS• Thaw frozen cells rapidly in a water bath at 37°C until completely thawed.
• Transfer cells into a vial and add 10 ml PBS.
• Centrifuge 3 min at 340 rcf (g).
• Discard supernatant and re-suspend the pellet in stimulation buffer.
• Determine cell concentration and viability.
• Dilute the cells in the stimulation buffer to reach the cell concentration required for the experiment.
• Dispense the cells into the plates (refer to the table below under «suspension protocol» for the recommended volumes).
• Run the assay.
PLATE FORMATS AND VOLUMESDispensing volumes for each step of each protocol are summarized in the table below.
CELL BASED ASSAY OR STANDARD CURVE
ADHERENT CELLS PROTOCOL
SUSPENSION CELLS PROTOCOL
Plate 384-w CT white 96-w CT white 1536-w white 384-w lv white HTRF 96- w lv plate 96-w half area white
Stimulation step
Cells or standard (4X) 10 µl* 50 µl* 2.5 µl 5 µl 5 µl 25 µl
Cell incubation step Overnight at 37°C, 5% CO2 No cell incubation
Compounds (2.5X) or Stimulation buffer 8 µl 40 µl 2 µl 4 µl 4 µl 20 µl
Agonist incubation step Necessary time at 37°C Necessary time at 37°C
Foskolin (10X) 2 µL 10 µL 0.5 µl 1 µl 1 µl 5 µl
Foskolin incubation step Necessary time at 37°C, Necessary time at 37°C
*If the cell supernatant is removed, add stimulation buffer in the recommended volume.
Cell Preparation / Cryopreserved Cells
Gαi Agonist Assay Optimization
DISPENSING FORMATS
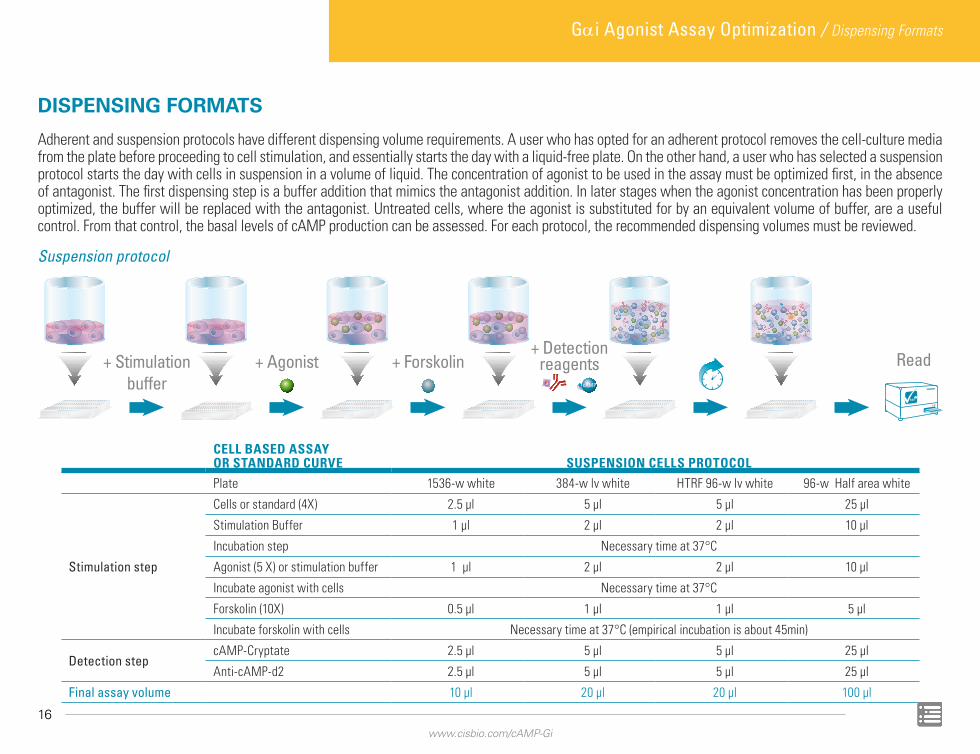
Adherent and suspension protocols have different dispensing volume requirements. A user who has opted for an adherent protocol removes the cell-culture media from the plate before proceeding to cell stimulation, and essentially starts the day with a liquid-free plate. On the other hand, a user who has selected a suspension protocol starts the day with cells in suspension in a volume of liquid. The concentration of agonist to be used in the assay must be optimized first, in the absence of antagonist. The first dispensing step is a buffer addition that mimics the antagonist addition. In later stages when the agonist concentration has been properly optimized, the buffer will be replaced with the antagonist. Untreated cells, where the agonist is substituted for by an equivalent volume of buffer, are a useful control. From that control, the basal levels of cAMP production can be assessed. For each protocol, the recommended dispensing volumes must be reviewed.
Suspension protocol
Read+ Agonist + Forskolin+ Detection
reagents+ Stimulationbuffer
CELL BASED ASSAY OR STANDARD CURVE SUSPENSION CELLS PROTOCOLPlate 1536-w white 384-w lv white HTRF 96-w lv white 96-w Half area white
Stimulation step
Cells or standard (4X) 2.5 µl 5 µl 5 µl 25 µl
Stimulation Buffer 1 µl 2 µl 2 µl 10 µl
Incubation step Necessary time at 37°C
Agonist (5 X) or stimulation buffer 1 µl 2 µl 2 µl 10 µl
Incubate agonist with cells Necessary time at 37°C
Forskolin (10X) 0.5 µl 1 µl 1 µl 5 µl
Incubate forskolin with cells Necessary time at 37°C (empirical incubation is about 45min)
Detection stepcAMP-Cryptate 2.5 µl 5 µl 5 µl 25 µl
Anti-cAMP-d2 2.5 µl 5 µl 5 µl 25 µl
Final assay volume 10 µl 20 µl 20 µl 100 µl
16www.cisbio.com/cAMP-Gi
Gαi Agonist Assay Optimization / Dispensing Formats
17www.cisbio.com/cAMP-Gi
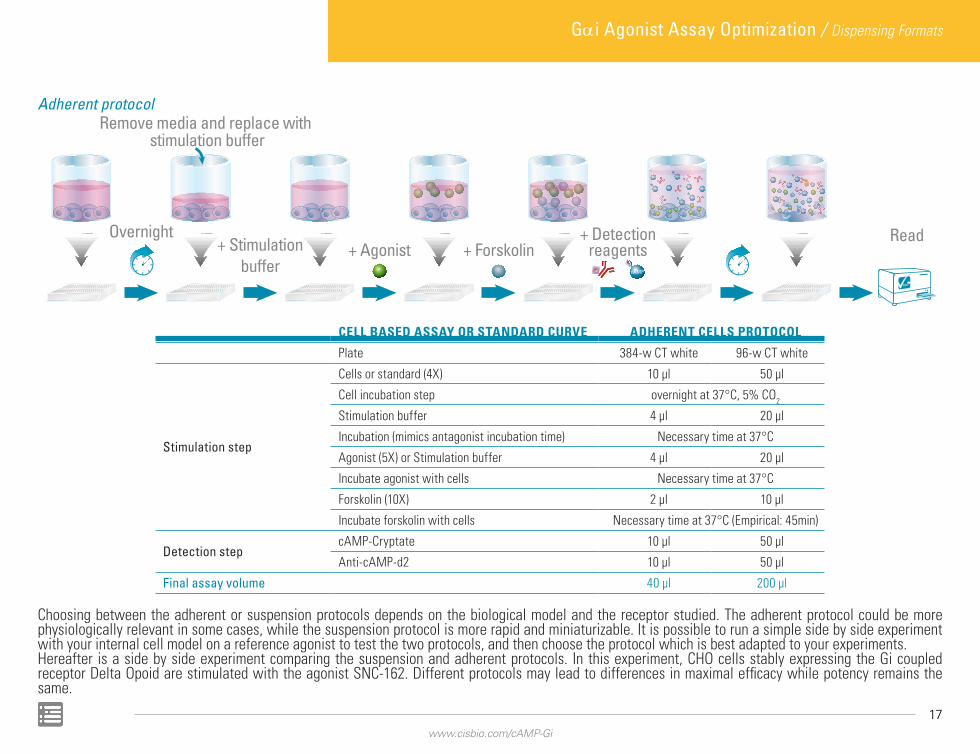
Adherent protocolRemove media and replace with
stimulation buffer
+ Agonist + ForskolinOvernight + Detection
reagentsRead+ Stimulation
buffer
CELL BASED ASSAY OR STANDARD CURVE ADHERENT CELLS PROTOCOL
Plate 384-w CT white 96-w CT white
Stimulation step
Cells or standard (4X) 10 µl 50 µl
Cell incubation step overnight at 37°C, 5% CO2
Stimulation buffer 4 µl 20 µl
Incubation (mimics antagonist incubation time) Necessary time at 37°C
Agonist (5X) or Stimulation buffer 4 µl 20 µl
Incubate agonist with cells Necessary time at 37°C
Forskolin (10X) 2 µl 10 µl
Incubate forskolin with cells Necessary time at 37°C (Empirical: 45min)
Detection stepcAMP-Cryptate 10 µl 50 µl
Anti-cAMP-d2 10 µl 50 µl
Final assay volume 40 µl 200 µl
Choosing between the adherent or suspension protocols depends on the biological model and the receptor studied. The adherent protocol could be more physiologically relevant in some cases, while the suspension protocol is more rapid and miniaturizable. It is possible to run a simple side by side experiment with your internal cell model on a reference agonist to test the two protocols, and then choose the protocol which is best adapted to your experiments.Hereafter is a side by side experiment comparing the suspension and adherent protocols. In this experiment, CHO cells stably expressing the Gi coupled receptor Delta Opoid are stimulated with the agonist SNC-162. Different protocols may lead to differences in maximal efficacy while potency remains the same.
Gαi Agonist Assay Optimization / Dispensing Formats

The following table describes the main protocols used for the experiment:
CELL BASED ASSAY ADHERENT CELLS PROTOCOL SUSPENSION CELLS PROTOCOL
Plate 384-w CT white 384-w lv white
Stimulation step
Cells 10 µl 5 µl
Incubation Overnight at 37°C, 5% CO2 No incubation
Stimulation buffer 4 µl 2 µl
Incubation (mimics antagonist incubation time) 45 min at 37°C
SNC-162 4 µl 2 µl
Incubate agonist 45 min at 37°C
Forskolin 2 µl 1 µl
Incubate Forskolin 45 min at 37°C
Detection stepcAMP-Cryptate 10 µl 5 µl
Anti-cAMP-d2 10 µl 5 µl
Final assay volume 40 µl 20 µl
Type of protocol adherent suspensionS/B 3.5 4.0
EC50 SNC-162 (nM) 1.5 1.5
Side by side comparison between suspension cell protocol and adherent cells protocol: CHO cells stably expressing the Delta opioid receptor (DOR) were dispensed at a density of 6,000 cells /well. Serial dilutions of SNC-162 were added and incubated for 45 min. Forskolin was added and incubated for 45 min. The HTRF® Ratio data was fitted to a sigmoidal dose response and SNC-162 potencies extracted
18www.cisbio.com/cAMP-Gi
Gαi Agonist Assay Optimization / Dispensing Formats

19www.cisbio.com/cAMP-Gi
STANDARD CURVE
The standard curve will be extremely useful in assessing the assay sensitivity (IC50), the maximum assay window, and the assay dynamic range (IC10-IC90)
Establishing the standard curve
Refer to the most recent package insert accompanying your test kit for complete instructions on standard reconstitution and dilutions. In all cases, the stimulation buffer must be used to reconstitute the standard and dilute it.
Curve analysis
The curve is analyzed by plotting the Ratio as a function of the [cAMP] of the different standards expressed as a logarithm. Graphpad Prism can be used to analyze the curve. The preferred fit is the log(inhibitor) vs. response -- Variable slope. Several parameters can be derived from the fit:
Maximum assay window & IC50
The standard curve assay window is obtained by dividing the Ratio obtained in the absence of cAMP by the Ratio obtained by testing the highest concentrated cAMP standard. It represents the highest achievable assay window it is possible to obtain from the system, and will always be higher than the assay window recorded when cells are added to the system.
Assay windows =Max HTRF® Ratio (No cAMP Std)Min HTRF® Ratio (Max cAMP Std)
The IC50 value is the concentration of cAMP at which 50% of the initial signal is lost. In other words at IC50, the concentration of cAMP present in the assay is such that half the initial FRET produced by the cAMP-Cryptate/Anti-cAMP-d2 has been competed off. The IC50 is a measurement of how efficient and responsive the system is at recording changes in cAMP concentrations.
Gαi Agonist Assay Optimization / Standard Curve

Dynamic range
The IC10 - IC90 determines the assay dynamic range. This range plays a central role in assay optimization. As will be explained later in this manual, it is of primary importance that the signal recorded when assaying cells lies within the assay linear range of the standard curve. Failure to restrict Ratio values to the assay dynamic range will result in significant potency inaccuracies when assaying compounds on cells.
Using Graphpad Prism, determine the standard curve IC10 and IC90 values, and record the corresponding Ratio and [cAMP].
Linear range HTRF® Ratio [cAMP] nMIC10 6124 0.76
IC90 870 12.1
The assay dynamic range indicates the concentration of cAMP the assay can accurately quantify. Samples with cAMP concentrations above IC90 or below IC10 cannot be reliably estimated. Similarly, samples with Ratio values below IC90 and above IC10 cannot be reliably quantified.
20www.cisbio.com/cAMP-Gi
Gαi Agonist Assay Optimization / Standard Curve
21www.cisbio.com/cAMP-Gi
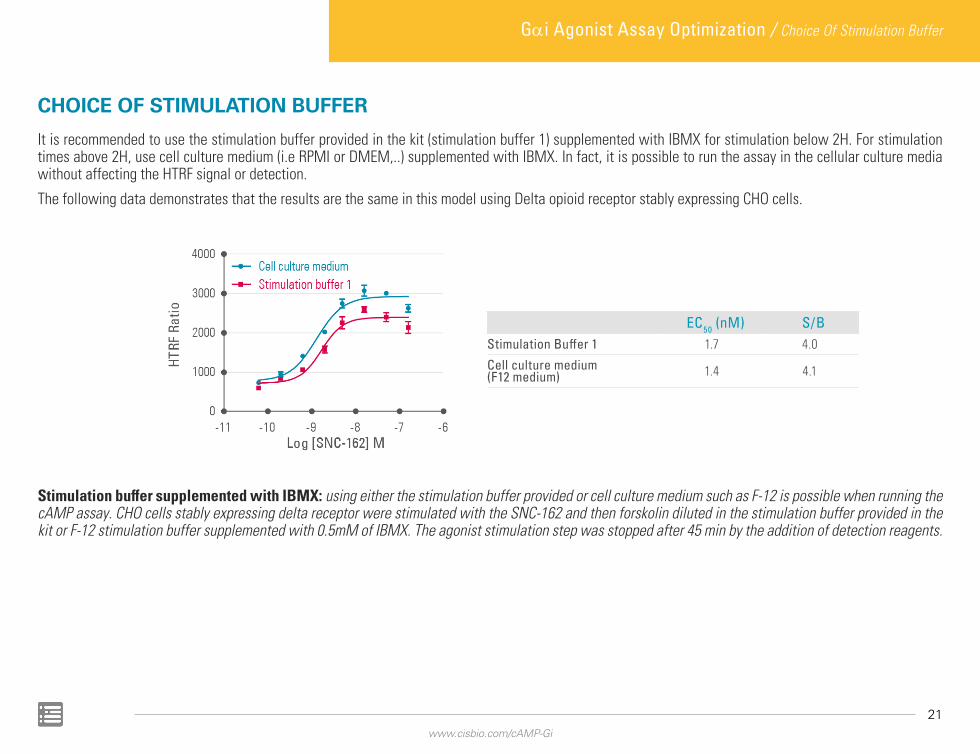
CHOICE OF STIMULATION BUFFER
It is recommended to use the stimulation buffer provided in the kit (stimulation buffer 1) supplemented with IBMX for stimulation below 2H. For stimulation times above 2H, use cell culture medium (i.e RPMI or DMEM,..) supplemented with IBMX. In fact, it is possible to run the assay in the cellular culture media without affecting the HTRF signal or detection.
The following data demonstrates that the results are the same in this model using Delta opioid receptor stably expressing CHO cells.
EC50 (nM) S/BStimulation Buffer 1 1.7 4.0
Cell culture medium(F12 medium) 1.4 4.1
Stimulation buffer supplemented with IBMX: using either the stimulation buffer provided or cell culture medium such as F-12 is possible when running the cAMP assay. CHO cells stably expressing delta receptor were stimulated with the SNC-162 and then forskolin diluted in the stimulation buffer provided in the kit or F-12 stimulation buffer supplemented with 0.5mM of IBMX. The agonist stimulation step was stopped after 45 min by the addition of detection reagents.
Gαi Agonist Assay Optimization / Choice Of Stimulation Buffer
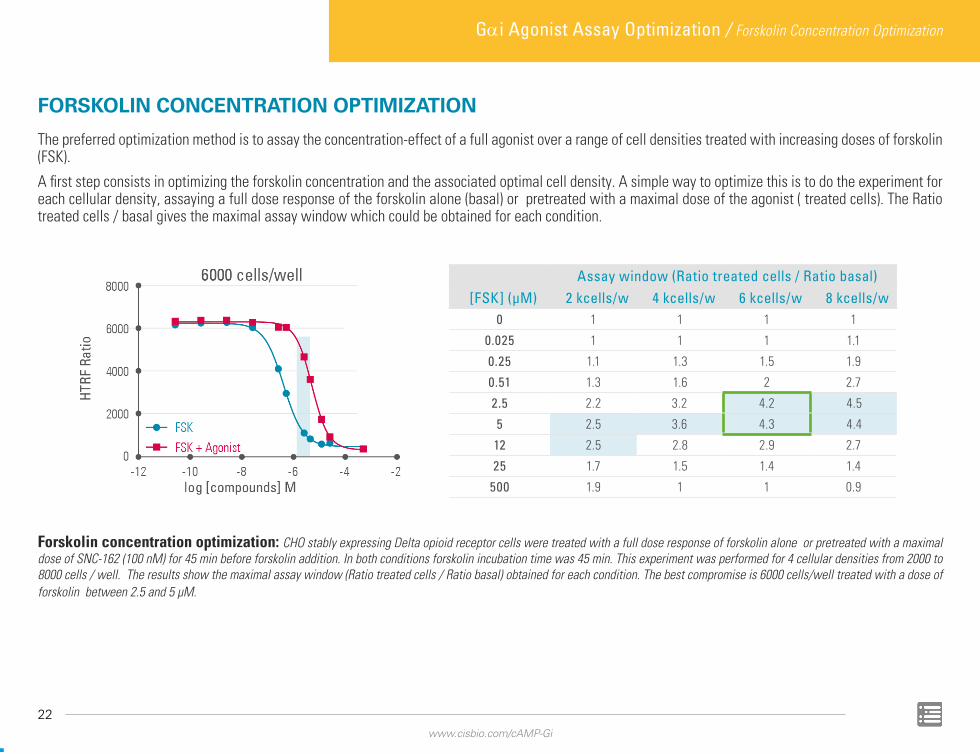
FORSKOLIN CONCENTRATION OPTIMIZATION
The preferred optimization method is to assay the concentration-effect of a full agonist over a range of cell densities treated with increasing doses of forskolin (FSK).
A first step consists in optimizing the forskolin concentration and the associated optimal cell density. A simple way to optimize this is to do the experiment for each cellular density, assaying a full dose response of the forskolin alone (basal) or pretreated with a maximal dose of the agonist ( treated cells). The Ratio treated cells / basal gives the maximal assay window which could be obtained for each condition.
Assay window (Ratio treated cells / Ratio basal)[FSK] (µM) 2 kcells/w 4 kcells/w 6 kcells/w 8 kcells/w
0 1 1 1 1
0.025 1 1 1 1.1
0.25 1.1 1.3 1.5 1.9
0.51 1.3 1.6 2 2.7
2.5 2.2 3.2 4.2 4.5
5 2.5 3.6 4.3 4.4
12 2.5 2.8 2.9 2.7
25 1.7 1.5 1.4 1.4
500 1.9 1 1 0.9
Forskolin concentration optimization: CHO stably expressing Delta opioid receptor cells were treated with a full dose response of forskolin alone or pretreated with a maximal dose of SNC-162 (100 nM) for 45 min before forskolin addition. In both conditions forskolin incubation time was 45 min. This experiment was performed for 4 cellular densities from 2000 to 8000 cells / well. The results show the maximal assay window (Ratio treated cells / Ratio basal) obtained for each condition. The best compromise is 6000 cells/well treated with a dose of forskolin between 2.5 and 5 µM.
22www.cisbio.com/cAMP-Gi
Gαi Agonist Assay Optimization / Forskolin Concentration Optimization

23www.cisbio.com/cAMP-Gi
CELL DENSITY
Optimizing the cell density is the key to obtaining the best possible results. Too low a cell density may not result in enough cAMP production for the assay to record (after treatment with forskolin). Too high a cell density may give a dramatical decrease in the assay window.
Low density Low density
log [cAMP] M
HTR
F R
atio
High density
High density
log [cAMP] M
HTR
F R
atio
The assay performance must be evaluated for a range of cell densities. The preferred optimization method is to assay the concentration-effect of a full agonist over a range of cell densities. Note that a full dose response is preferred to assaying a single concentration of agonist at this point.
Organizing the standard curve graph and the cell density graph side by side reveals at a glance which cell densities are within the assay range. Cell densities “in range” are those for which the reference agonist dose response lies within IC90-IC10 of the standard curve.
Gαi Agonist Assay Optimization / Cell Density

Cells 4,000 cells/w
6,000 cells/w
8,000 cells/w
12,000 cells/w
Assay window 3.7 4.5 4.4 4.3
EC50 SNC-162 (nM) 1.4 1.6 2.0 2.0
Dose response curves for CHO cells stably expressing the delta opioid receptor (DOR) treated with SNC-162, a reference agonist. 5 µl of cells were dispensed into a 384-lv white plate and treated 45 min at 37°C with the agonist and then stimulated with 5µM of forskolin (5µM) for 45 min at 37°C. 5 µl of each detection reagent were then added for detection. Reading was done on a Pherastar lamp reader after 1H incubation time at 22°C. A cell density of 6,000 cells per well was optimal. This density maximizes the assay window while ensuring the signal remains within the standard curve dynamic range. The highlighted cell densities in the table (in blue) represent the cell densities in which the quantification of cAMP is out of the dynamic range of the assay.
24www.cisbio.com/cAMP-Gi
Gαi Agonist Assay Optimization / Cell Density

25www.cisbio.com/cAMP-Gi
PHOSPHODIESTERASE (PDE) INHIBITORS
IBMX is by far the most widely-used non-specific inhibitor of cAMP and cGMP phosphodiesterases with EC50 in the range of 7 to 50 µM. By inhibiting PDEs, IBMX guarantees an accumulation of cAMP.
Alternatively, an empirical concentration of 0.5 mM in the stimulation buffer can be selected and should be enough to study cAMP accumulation in most cell types.If necessary, the IBMX concentration to be used in the assay could be further optimized.
A typical optimization step consists in preparing different stimulation buffers with increasing IBMX concentrations and assaying the cells using a known reference agonist. The optimal IBMX concentration is that for which the assay window has been maximized.
PDE inhibitor concentration optimization: Several different concentrations of IBMX were added to the stimulation buffer. CHO cells stably expressing delta opioid receptor were treated by the delta opioid agonist SNC-162 at 200 nM and dispensed at 6000 cells/well into a 384-lv white plate. 500 μM is the optimal IBMX concentration because it both maximizes the assay signal and ensures a robust accumulation of cAMP in the assay.
Gαi Agonist Assay Optimization / Phosphodiesterase (PDE) Inhibitors
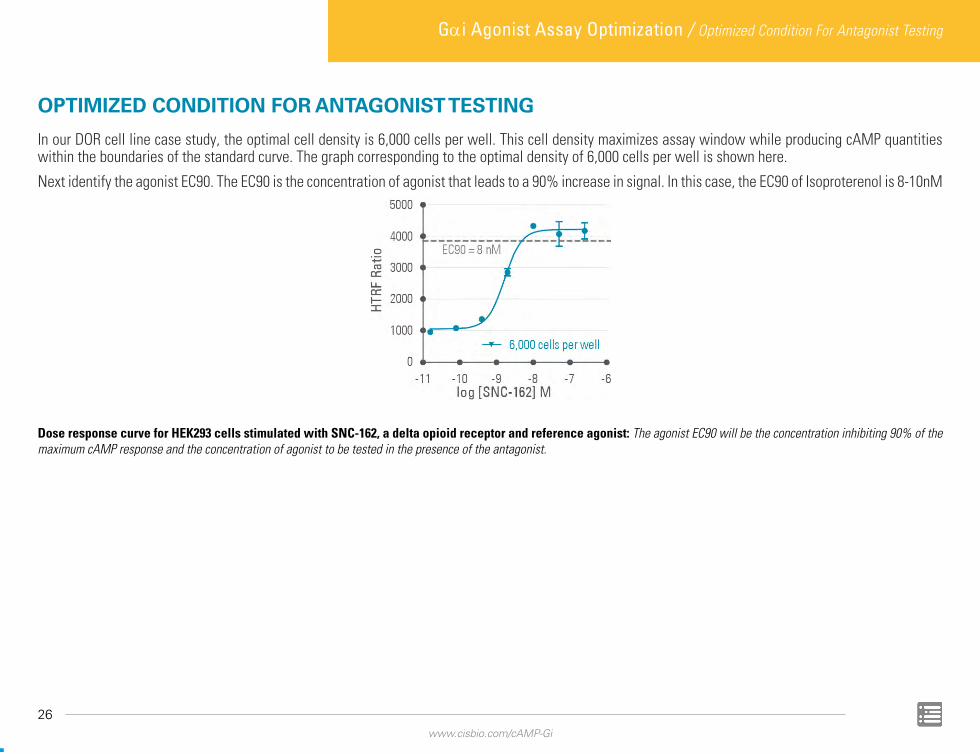
OPTIMIZED CONDITION FOR ANTAGONIST TESTING
In our DOR cell line case study, the optimal cell density is 6,000 cells per well. This cell density maximizes assay window while producing cAMP quantities within the boundaries of the standard curve. The graph corresponding to the optimal density of 6,000 cells per well is shown here.
Next identify the agonist EC90. The EC90 is the concentration of agonist that leads to a 90% increase in signal. In this case, the EC90 of Isoproterenol is 8-10nM
Dose response curve for HEK293 cells stimulated with SNC-162, a delta opioid receptor and reference agonist: The agonist EC90 will be the concentration inhibiting 90% of the maximum cAMP response and the concentration of agonist to be tested in the presence of the antagonist.
Gαi Agonist Assay Optimization / Optimized Condition For Antagonist Testing
26www.cisbio.com/cAMP-Gi

Gαi Antagonist Assay Optimization

DISPENSING FORMATS
Antagonist dilutions are prepared at 5X the desired final concentration and added before the agonist at EC90. Untreated cells, where the antagonist is substituted for by an equivalent volume of buffer, are a useful control. From that control, the basal levels of cAMP production can be assessed.
Suspension protocol
Read+ Antagonist + Agonist + Forskolin + Detectionreagents
CELL BASED ASSAY OR STANDARD CURVE SUSPENSION CELLS PROTOCOL
Plate 1536-w white 384-w lv white HTRF 96-w lv white 96-w Half area white
Stimulation step
Cells or standard (4X) 2.5 µl 5 µl 5 µl 25 µl
Antagonist (5X) or Stim Buffer 1 µl 2 µl 2 µl 10 µl
Incubate antagonist with cells Necessary time at 37°C
Agonist @EC90 (5X) 1 µl 2 µl 2 µl 10 µl
Incubate agonist with cells Necessary time at 37°C
Forskolin (10X) 0.5 µl 1 µl 1 µl 5 µl
Incubate forskolin with cells Necessary time at 37°C (empirical incubation is about 45 min)
Detection stepcAMP-cryptate 2.5 µl 5 µl 5 µl 25 µl
Anti-cAMP-d2 2.5 µl 5 µl 5 µl 25 µl
Final assay volume 10 µl 20 µl 20 µl 100 µl
28www.cisbio.com/cAMP-Gi
Gαi Antagonist Assay Optimization / Dispensing Formats

29www.cisbio.com/cAMP-Gi
Adherent protocol
Remove media and replace with stimulation buffer
+ Agonist + ForskolinOvernight + Detection
reagentsRead
+ Antagonist
CELL BASED ASSAY OR STANDARD CURVE ADHERENT CELLS PROTOCOL
Plate 384-w CT white 96-w CT white
Stimulation step
Cells or standard (4X) 10 µl 50 µl
Cell incubation step overnight at 37°C, 5% CO2
Antagonist (5X) or Stimulation Buffer 4 µl 20 µl
Incubate antagonist with cells Necessary time at 37°C
Agonist @EC90 (5X) 4 µl 20 µl
Incubate agonist with cells Necessary time at 37°C
Forskolin (10X) 2 µl 10 µl
Incubate forskolin with cells Necessary time at 37°C
Detection stepcAMP-cryptate 10 µl 50 µl
Anti-cAMP-d2 10 µl 50 µl
Final assay volume 40 µl 200 µl
Gαi Antagonist Assay Optimization / Dispensing Formats
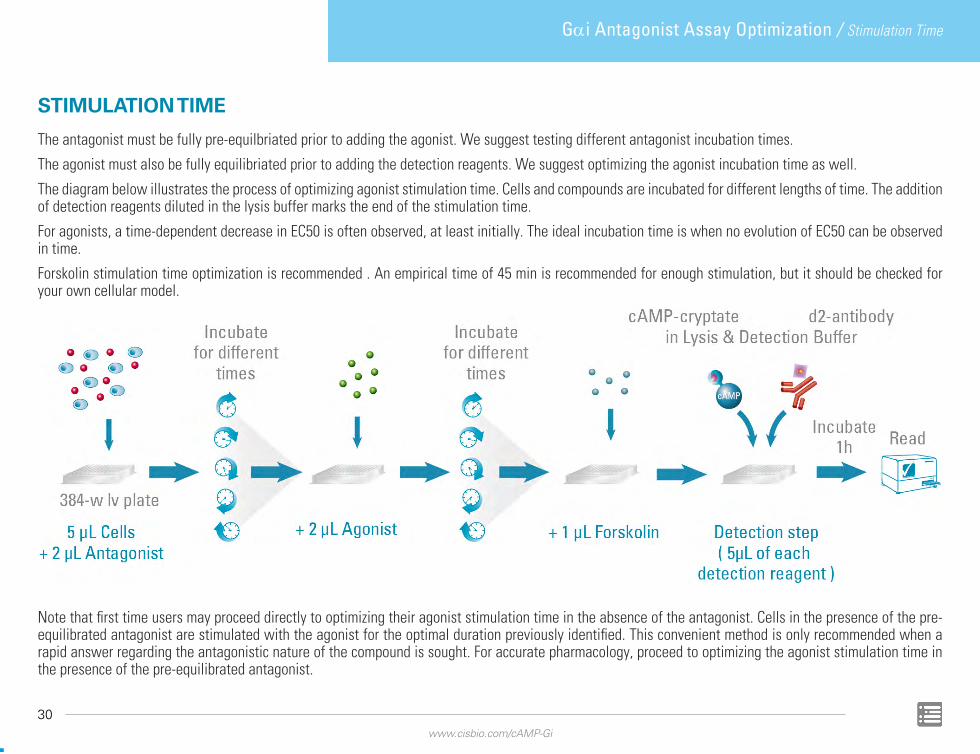
STIMULATION TIME
The antagonist must be fully pre-equilbriated prior to adding the agonist. We suggest testing different antagonist incubation times.
The agonist must also be fully equilibriated prior to adding the detection reagents. We suggest optimizing the agonist incubation time as well.
The diagram below illustrates the process of optimizing agonist stimulation time. Cells and compounds are incubated for different lengths of time. The addition of detection reagents diluted in the lysis buffer marks the end of the stimulation time.
For agonists, a time-dependent decrease in EC50 is often observed, at least initially. The ideal incubation time is when no evolution of EC50 can be observed in time.
Forskolin stimulation time optimization is recommended . An empirical time of 45 min is recommended for enough stimulation, but it should be checked for your own cellular model.
Note that first time users may proceed directly to optimizing their agonist stimulation time in the absence of the antagonist. Cells in the presence of the pre-equilibrated antagonist are stimulated with the agonist for the optimal duration previously identified. This convenient method is only recommended when a rapid answer regarding the antagonistic nature of the compound is sought. For accurate pharmacology, proceed to optimizing the agonist stimulation time in the presence of the pre-equilibrated antagonist.
30www.cisbio.com/cAMP-Gi
Gαi Antagonist Assay Optimization / Stimulation Time
31www.cisbio.com/cAMP-Gi
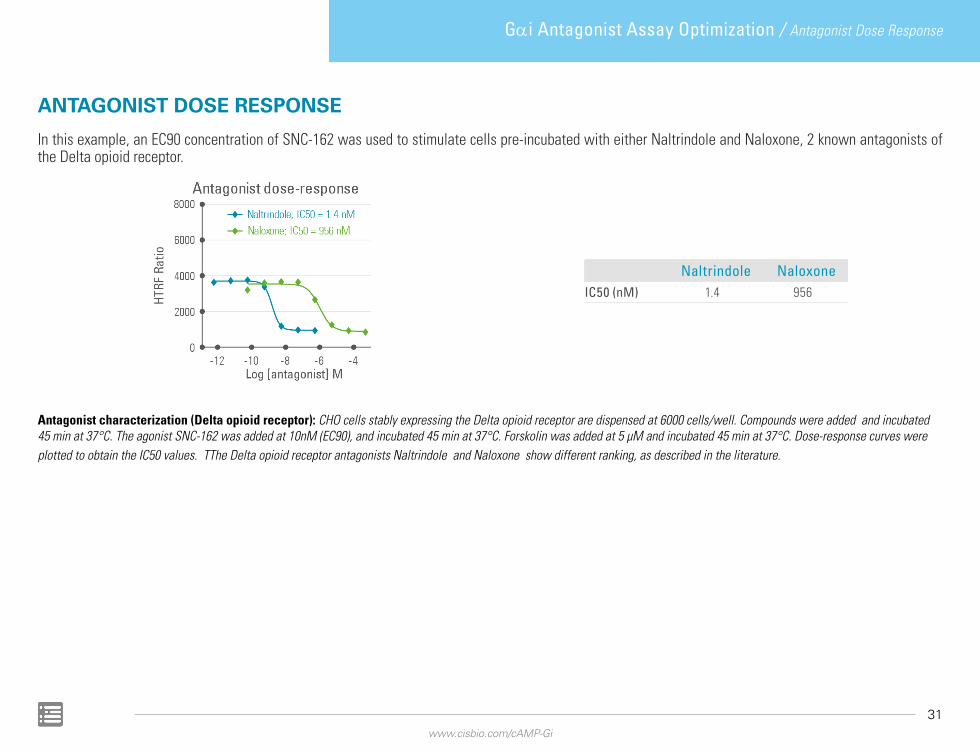
ANTAGONIST DOSE RESPONSE
In this example, an EC90 concentration of SNC-162 was used to stimulate cells pre-incubated with either Naltrindole and Naloxone, 2 known antagonists of the Delta opioid receptor.
Naltrindole NaloxoneIC50 (nM) 1.4 956
Antagonist characterization (Delta opioid receptor): CHO cells stably expressing the Delta opioid receptor are dispensed at 6000 cells/well. Compounds were added and incubated 45 min at 37°C. The agonist SNC-162 was added at 10nM (EC90), and incubated 45 min at 37°C. Forskolin was added at 5 µM and incubated 45 min at 37°C. Dose-response curves were plotted to obtain the IC50 values. TThe Delta opioid receptor antagonists Naltrindole and Naloxone show different ranking, as described in the literature.
Gαi Antagonist Assay Optimization / Antagonist Dose Response

Data Reduction And Analysis
33www.cisbio.com/cAMP-Gi
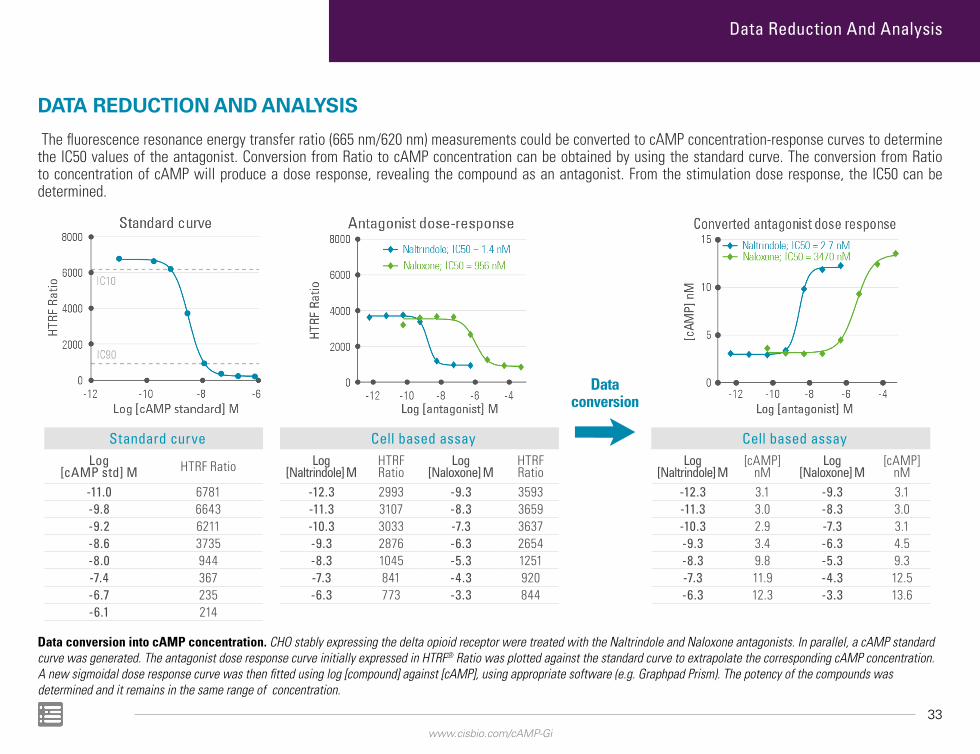
DATA REDUCTION AND ANALYSIS
The fluorescence resonance energy transfer ratio (665 nm/620 nm) measurements could be converted to cAMP concentration-response curves to determine the IC50 values of the antagonist. Conversion from Ratio to cAMP concentration can be obtained by using the standard curve. The conversion from Ratio to concentration of cAMP will produce a dose response, revealing the compound as an antagonist. From the stimulation dose response, the IC50 can be determined.
Data conversion
Standard curveLog
[cAMP std] M HTRF Ratio
-11.0 6781-9.8 6643-9.2 6211-8.6 3735-8.0 944-7.4 367-6.7 235-6.1 214
Cell based assayLog
[Naltrindole] M HTRF Ratio
Log [Naloxone] M
HTRF Ratio
-12.3 2993 -9.3 3593-11.3 3107 -8.3 3659-10.3 3033 -7.3 3637-9.3 2876 -6.3 2654-8.3 1045 -5.3 1251-7.3 841 -4.3 920-6.3 773 -3.3 844
Cell based assayLog
[Naltrindole] M [cAMP]
nMLog
[Naloxone] M[cAMP]
nM-12.3 3.1 -9.3 3.1-11.3 3.0 -8.3 3.0-10.3 2.9 -7.3 3.1-9.3 3.4 -6.3 4.5-8.3 9.8 -5.3 9.3-7.3 11.9 -4.3 12.5-6.3 12.3 -3.3 13.6
Data conversion into cAMP concentration. CHO stably expressing the delta opioid receptor were treated with the Naltrindole and Naloxone antagonists. In parallel, a cAMP standard curve was generated. The antagonist dose response curve initially expressed in HTRF® Ratio was plotted against the standard curve to extrapolate the corresponding cAMP concentration. A new sigmoidal dose response curve was then fitted using log [compound] against [cAMP], using appropriate software (e.g. Graphpad Prism). The potency of the compounds was determined and it remains in the same range of concentration.
Data Reduction And Analysis

www.cisbio.com/cAMP-Gi
Contact Europe and other countries
+33(0)466 796 705 | [email protected]
U.S. and Canada1-888-963-4567 | [email protected]
China +86 21 5018 9880 | [email protected]
Japan +81-(0)43-306-8712 | [email protected]
12/2
017
- 3M
D01
7 - H
TRF
is a
regi
ster
ed tr
adem
ark
of C
isbi
o Bi
oass
ays.