CAMEROON BAPTIST CONVENTION HEALTH SERVICES and reports/Annual Report... · CBCHS Cameroon Baptist...
60
1 CAMEROON BAPTIST CONVENTION HEALTH SERVICES ACIVITY REPORT, 2014
Transcript of CAMEROON BAPTIST CONVENTION HEALTH SERVICES and reports/Annual Report... · CBCHS Cameroon Baptist...

1
CAMEROON BAPTIST CONVENTION HEALTH SERVICES
ACIVITY REPORT, 2014

2
CAMEROON BAPTIST CONVENTION HEALTH SERVICES
ANNUAL REPORT, 2014
__________________________________ Prof. Tih Pius Muffih, MPH, PhD Director of Health Services Cameroon Baptist Convention Health Services P.O. BOX 1, Bamenda; North West Region; Cameroon, Africa Tel: (237) 677 76 47 81/ EMAIL: [email protected] Website: www.cbchealthservice.org
3
TABLE OF CONTENT
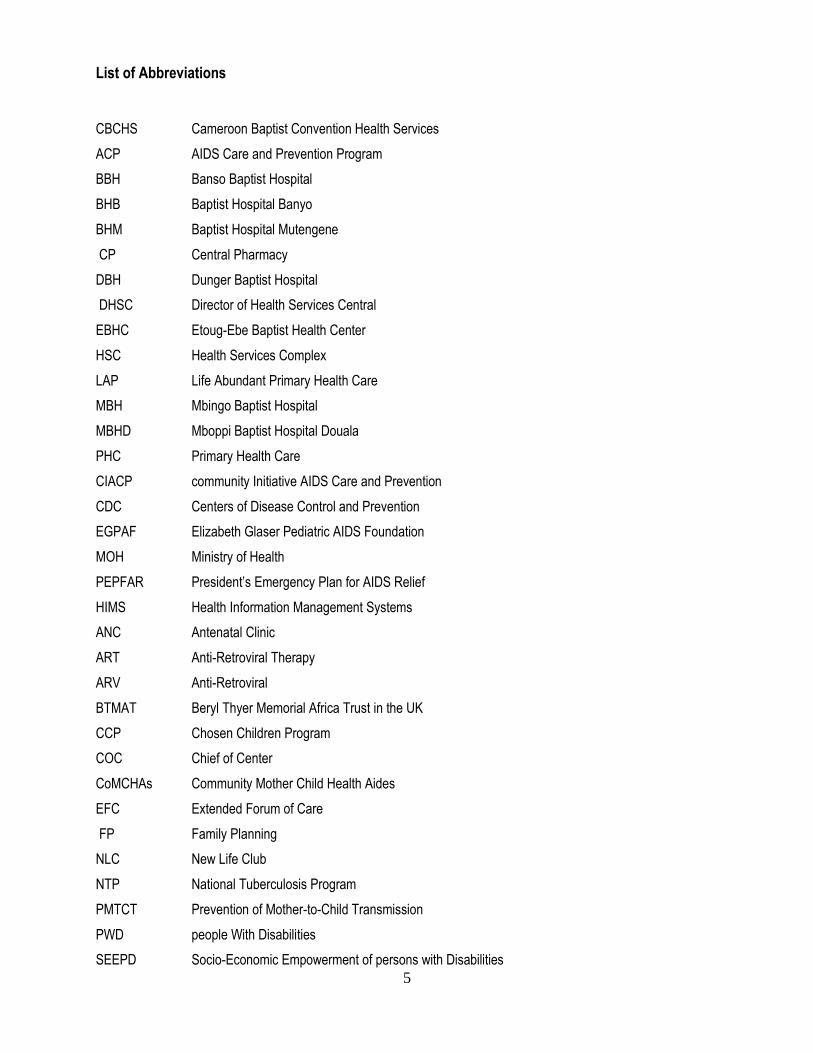
List of Abbreviations ...................................................................................................................................... 5
Mission Statement ......................................................................................................................................... 7
Acknowledgement ......................................................................................................................................... 8
A. NARRATIVE REPORT .............................................................................................................................. 8
Introduction .................................................................................................................................................... 9
Baptist Training School for Health Personnel (PTSHP), Banso ..................................................................... 9
Life Abundant Primary Health Care (LAP) ................................................................................................... 11
Technical Services Department (TSD) ........................................................................................................ 13
Chaplaincy Services .................................................................................................................................... 14
Social Services ............................................................................................................................................ 15
AIDS Care and Prevention Services ............................................................................................................ 15
CBCHS Burkitt Lymphoma/Childhood Cancer Service ................................................................................ 17
Socio-Economic Empowerment of Persons with Disabilities (SEEPD) Program ......................................... 19
Central Pharmacy (CP) ................................................................................................................................ 23
Health Services Complex (HSC), Mutengene .............................................................................................. 24
Banso Baptist Hospital (BBH) ...................................................................................................................... 24
Mbingo Baptist Hospital (MBH) .................................................................................................................... 26
Baptist Hospital Mutengene (BHM).............................................................................................................. 28
Baptist Hospital Banyo (BHB) ...................................................................................................................... 30
Mboppi Baptist Hospital Douala ................................................................................................................... 30
Etoug-Ebe Baptist Hospitaland Supervised Health Centers ........................................................................ 31
B. HEALTH INFORMATION MANAGEMENT SYSTEMS (HMIS) ............................................................... 33
Table 1 Summary performance of CBCHS institutions in 2014 ................................................................... 33
Table 2.2 Number of Beds distributed by ward, comparing 2013 and 2014 ................................................ 34
Table 3.1 Staff strength by institution and cadre .......................................................................................... 34
Table 3.2 staff strength by cadre comparing 2013 and 2014 ....................................................................... 35
Table 4.1 Outpatient Attendance ................................................................................................................. 36
Table 4.2 Distribution of Outpatient by gender ............................................................................................ 36
Figure 1 Distribution of Outpatient Attendance by Age Group ..................................................................... 36
Table 5.1 Five Health centers with Highest OPD Attendance in 2013 and 2014 ......................................... 37
Table 5.2 Five Health Centers with lowest OPD attendance in 2013 and 2014 ........................................... 37

4
Table 6.1 – Admissions by institutions and by wards ................................................................................... 37
Table 6.2 Admissions of 2014 compared to 2013 ........................................................................................ 38
Table 6.3 Bed occupancy rate of 201 4 compared to 2013 ......................................................................... 38
Table 6.3 Bed occupancy rate by Institution ................................................................................................ 38
Table 7 Patients flow per department for 2014 compared to 2013 .............................................................. 39
Table 8 Departmental Patient Flow for Hospitals and IHCs ......................................................................... 39
Table 9.1 Mother and Child Health (MCH) FOR 2014 COMPARED TO 2013 ............................................. 40
Table 9.2 Deliveries for 2014 compared to 2013 ......................................................................................... 40
Table 10 Immunization for 2014 compared with 2013 ................................................................................. 41
Figure 2 Immunization for 2014 compared to 2013 ..................................................................................... 41
Table 11 Surgeries ...................................................................................................................................... 42
Table 12 Distribution of Surgeries by Institution .......................................................................................... 42
Table 13 Notifiable Diseases ....................................................................................................................... 42
Table 14 HIV Prevalence ............................................................................................................................. 43
Table 15 Deaths .......................................................................................................................................... 43
Table 16 Ten Leading Diseases for 2013 and 2014 .................................................................................... 43
Table 17 Ten leading causes of death ......................................................................................................... 44
Table 18 HIV Care and Treatment Program Work load ............................................................................... 44
Table 19 Evolution of CBCHB PMTCT Activities ......................................................................................... 45
Table 20 CBCHS Tuberculosis activities ..................................................................................................... 45
Table 21 Evolution of Activities of Extended Forum of Care ........................................................................ 46
Table 22 Statistics of Burkitt Lymphoma/Childhood Cancer Service ........................................................... 46
Annex 1- Five Year Evolution of Number of Beds and Staff ........................................................................ 47
Annex 2 – Five Years Evolution of Outpatient Attendance .......................................................................... 47
Annex 3- Five Years Evolution of Inpatients Attendance ............................................................................. 48
Annex 4- Five Years Evolution of Pharmacy and Laboratory work load ...................................................... 48
Annex 5- Five Years Evolution of Department work load ............................................................................. 49
Annex 6- Five Years Evolution of MCH Activities ........................................................................................ 49
Conclusion 49
5
List of Abbreviations
CBCHS Cameroon Baptist Convention Health Services
ACP AIDS Care and Prevention Program
BBH Banso Baptist Hospital
BHB Baptist Hospital Banyo
BHM Baptist Hospital Mutengene
CP Central Pharmacy
DBH Dunger Baptist Hospital
DHSC Director of Health Services Central
EBHC Etoug-Ebe Baptist Health Center
HSC Health Services Complex
LAP Life Abundant Primary Health Care
MBH Mbingo Baptist Hospital
MBHD Mboppi Baptist Hospital Douala
PHC Primary Health Care
CIACP community Initiative AIDS Care and Prevention
CDC Centers of Disease Control and Prevention
EGPAF Elizabeth Glaser Pediatric AIDS Foundation
MOH Ministry of Health
PEPFAR President’s Emergency Plan for AIDS Relief
HIMS Health Information Management Systems
ANC Antenatal Clinic
ART Anti-Retroviral Therapy
ARV Anti-Retroviral
BTMAT Beryl Thyer Memorial Africa Trust in the UK
CCP Chosen Children Program
COC Chief of Center
CoMCHAs Community Mother Child Health Aides
EFC Extended Forum of Care
FP Family Planning
NLC New Life Club
NTP National Tuberculosis Program
PMTCT Prevention of Mother-to-Child Transmission
PWD people With Disabilities
SEEPD Socio-Economic Empowerment of persons with Disabilities
6
SG Support Group
PCR polymerase Chain Reaction
YONEFOH Youth Network for Health
BL Burkitt Lymphoma
CHF Congestive Heart Failure
LRTI lower Respiratory Tract Infection
URTI Upper Respiratory Tract Infection
UTI Urinary Tract Infection
7
Mission Statement
The Cameroon Baptist Convention Health Board seeks to assist in the provision of care to all who need it
as an expression of Christian love and as a means of witness in order that they might be brought to God
through Jesus Christ. Thus, the Health Board seeks to provide exemplary health care with genuine
compassion and with overriding purpose of evangelical witness.
Vision
Quality care to all
8
Acknowledgement
The results presented in this report are God’s mighty blessings to the Cameroon Baptist Convention Health
Services (CBCHS) through collaborative efforts with our patients, partners and friends who have supported
us in prayers and with material and financial resources. Special appreciations go to the HMIS team, all
Heads of service, and all CBCHS staff who worked together to develop this report.

9
A. NARRATIVE REPORT
Introduction
For over 60 years of existence, the Cameroon Baptist Convention Health Services (CBCHS) keeps making
giant strides in alleviating human suffering with an underlying philosophy of Christian love as enshrined in
her mission statement. The CBCHS addresses both clinical and public health problems affecting individuals
and communities in Cameroon in particular and Africa at large. The health facilities of CBC Health Services
include 6 hospitals, 27 integrated health centres, 50 primary health centres and a Pharmaceutical
procurement and distribution department. Other vital departments that help to enhance patient care include:
the Baptist Training School for Health Personnel that trains clinical personnel for our Services, a
comprehensive AIDS Care and Prevention Program and Services for People with Disabilities. The Health
Services also run some crucial programs like the Centre for Clinical Pastoral Education and Social
Services, and a Community Counseling Clinic. The services of the CBCHS are spread over six of ten
regions in Cameroon.
Baptist Training School for Health Personnel (PTSHP), Banso
In 2014, the school started a biomedical science department with the training of biomedical assistants. The
trainees of this department will maintain and repair equipment in the CBCHS institutions. Currently, the
school runs ten departments and 28 programs.
Of the total of 243 students that enrolled in various courses in the school in 2013/2014 academic year, 213
were successful and graduated. These include 40 nursing assistants, 16 Laboratory Auxiliaries, 19 APNA,
42 pharmacy auxiliaries, 46 nursing auxiliaries, 8 biomedical assistants, etc. The nursing assistant students
performed well in the certificate examination which was written at Shisong Centre in August 2014. Twenty
eight of the 40 candidates that wrote were successful, scoring 70%. At the end of 2014, the school had
eight ongoing programs with a total enrolment of 133 students. Five programs have been programmed to
start in January 2015. The school applied to the Ministry of Health to the start State Registered Nursing
(SRN), State Registered Midwifery (SRM), Pharmacy Technician, and Pharmacy Assistant. Feedback is
still awaited. This year, five orthopedic students and six Pharmacy Technician students were happy
recipients of partial scholarships from the SEEPD program and Ecumenical Pharmaceutical Network (EPN)
respectively. This will relieve students of their financial burden.

10
In April 2014, Sister Mantay and Dr. Helen Marie Schmidt
visited the school and were very impressed with the progress
being made over the years. Dr. Helen Marie Schmidt donated
midwifery teaching models to the school worth about one
million Francs CFA to the school. Also, Dr. Dennis Palmer and
the Infection Prevention and Control (IPAC) Canada donated
nursing and infection prevention text books. We remain thankful
to our partners.
Infrastructure wise, the first floor of the school building was
completed last year and is in use. The ground floor is about 80%
complete. Efforts are being made to get it ready for use by
January 2015. The roof phase remains the greatest challenge. A
total of 56 million Francs CFA is needed for this phase of the
project. After completion, the building will host most of the
courses in the training school. We are appealing for financial
support from partners. Considering the many years of Sister
Kathy Kroll’s devoted services to Cameroonians through the Baptist Training School for Health Personnel,
and her wish to have seen the new block built, the block will be named after completion as “Kathryn Kroll
Block” in recognition of her hardwork.
To ensure the name fully reflects the true status of a Baptist school, it was proposed and approved by the
BTSHP Administrative Board of May 08, 2014 that the name of the school should be changed from Private
Training School for Health Personnel (PTSHP) to Baptist Training School of Health Personnel, (BTSHP),
Banso
In addition to finances that is a challenge to complete the new school building, there is also need for
additional staff.
NEW BLOCK UNDER CONSTRUCTION (Side) view)
OB Models donated by Dr. Schmidt

11
Life Abundant Primary Health Care (LAP)
LAP staff worked hard in 2014 ensuring close supervision of the activities of her 50 primary health Centres
(PHCs).Through these PHCs, a total of 44,156 clients were served,1173 pregnant women went through the
PMTCT services and knew their HIV-status, 625 women with low risk delivered at PHCs.
LAP organized several training and refresher courses for the village health workers, field staff and
administrative staff. These trainings are summarized thus:
13 students from 8 communities were provided training to function as Health Promoters.
7 candidates from six communities participated in the basic training of CoMCHAs.
43 Promoters, 9 Field Supervisors, 6 PHC Nurses and 5 Administrative staff participated in continuous
education on mental health conditions on how to identify and refer people with mental health issues in
the communities.
42 village health workers participated in refresher courses to strengthen their capacities in the provision
of health care in their villages.
A total of 33 of administrative staff, Field supervisors, PHC Nurses participated in a capacity building
seminar to improve on the capacity of field and office staff in narrative and financial reporting as well as
the standard procedures for BftW.
28 participants of LAP staff were drilled in the Basic Life Support in obstetrics (BLSO) workshop to gain
knowledge and skills on how to manage obstetrical emergencies in the communities to reduce
maternal and infant morbidity and mortality.
LAP is implementing PMTCT services in 42 of her sites. There is Continuous sensitization and behaviour
change communication using varied approaches which has led to increase health awareness by population
leading to a drop in stigma and discrimination. This is impacting on uptake of PMTCT services and a
reduction on the number of home deliveries in communities.
A total of 17 PHCs are implementing the Nutrition Improvement Program. During the commemoration of the
World Breastfeeding Week on the theme Breastfeeding a Winning Goal for Life; 671 people were
sensitized.
An external evaluation of the LAP Bread for the World funded project for the period 2012 to 2014 was
carried out. The overall assessment showed that LAP project is matching with the designed approach and
there is a high level of satisfaction by the rural communities where LAP exists. A new project proposal was
also submitted to Bread for the World and the German Government for funding. We are awaiting the
results. Mr Johann Singers, the Project Officer of Bread for the World for Africa visited LAP and was very

12
impressed with LAP project implementation in Kamp-Vekovi PHC. This visit gave him the opportunity to
have more insight of LAP Ministry.
Cameroon-European Union Cooperation is funding a health care project call “Lake Nyos Project” through
the CBC Life Abundant Primary Health Care program. The goal of this project is to extend primary health
Care services to the Lake Nyos Zone to improve access to basic health care by the inhabitants and also as
a means to re-instate the survivors of the Lake Nyos toxic gas disaster of 1986. The 3 villages to benefit
from this project are Nyos Valley, Subum and Cha.
As part of the implementation of this project; LAP has carried out the following activities:
o A demographic health survey and community determined health care (CDHC) exercises were carried
out at Cha, Nyos valley and Subum villages to better understand the prevailing health problems in
these communities.
o 3 health committees were created that will be responsible for the day to day management of their
PHCs.
o 6 candidates were recruited and trained for Nyos valley and Subum PHCs.
o The building project started in October 2014 with the renovation of a structure in Subum. The building
project for Cha and Nyos valley will follow after the completion of the Subum PHC building.
o Health education on behaviour change, hygiene and environmental sanitation that were started are
ongoing.
LAP has continued to minister the gospel message and strengthen the spiritual lives of staff at LAP
coordination center and in the communities. A total of 2,801 people listened to the gospel message, 204
persons re-dedicated their lives to Christ, 48 people made first decision to accept Jesus Christ, 30 were
counseled on spiritual issues and 33 Village Health Workers encouraged.
Amidou Issa, LAP Field Assistant in Saah PHC has continued to have Bible studies with some Fulani
community members monthly. The LAP chaplains plan to accompany him in some of his outreach activities
and encourage in his ministry.
The Nwanti Primary Health Centre was closed after consultation with the Director of Health Services and
due to lack of ownership especially by the community leadership.
The LAP Multi-purpose building is ongoing. The basement was completed and put to use. The LAP prayer
Retreat Centre project was suspended temporary and will resume as soon as more building materials are

13
purchased. Thanks to the Field Director and Sister Daphne Dunger for raising funds through the NAB for
the project.
The challenges that LAP is experiencing include inadequate staff, especially in difficult areas like Akwaya
and Allat/Banyo. This was aggravated by the retirement of the senior staff, Mr.Kaibo David, Field
Supervisor of Ndu in December 2014. We also have limited funding to complete the multi-purpose building
and the retreat center. This notwithstanding, we are thankful to God, our funders, LAP internal and external
friends for their support.
Technical Services Department (TSD)
The TSD completed only four of the fourteen prioritized goals of 2014. Of the ten uncompleted goals, the
nine concerning Strategy 9 Project package (S9PP) were not started because funding was not available
yet. The other unmet goal was due to much work load. Some key activities of the department included work
on the technical files of the S9PP bringing them to 90 % completion, compilation of job description booklet
for the department staff, organization of a Seminar for Site Supervisors and a training on Auto Card.
Progress was made with projects as follows;
1. Lassin Baptist Health Centre OPD Block was completed.
2. BBH eye Department 3rd floor columns were raised.
3. BHM Maternity/surgical wards were 90% completed. The 3rd floor was put to use.
4. Sarkibarka OPD foundation was constructed
5. The LAP multipurpose Building basement was completed.
6. MBH Volunteer building was completed.
7. MBH Deaf school classrooms were renovated.
8. MBH Student hostel skeletal structure was raised and roofed.
9. MBH OPD (section over CIMS) was roofed.
10. The X-Ray section of the BHM X-Ray block was completed and put into use.
11. Started work on the extension of DHS office.
12. The Ekounou fence project was started
13. The PTSHP 1st floor classrooms were prepared for use.
14. Coordinated the construction of the Bangolan H/C incinerator.
15. The building of a primary Health Centre in the Nyos Area is ongoing. (EU LAP project)
14
The apprenticeship training program graduated 25 trainees this year. The total enrollment was 94. The
training program for Biomedical Assistant Technicians hosted by the PTSHP graduated the first batch and
has a second batch that started training this year.
Chaplaincy Services
The Chaplaincy Department as part of the interdisciplinary team within the CBCHS carried out some
activities, contributing in offering quality and holistic Care to all who need it. The Spiritual Emphasis took
place from the 25th -30th August 2014 on the theme “Declaring his praises to the Nations: Serving
beyond ourselves” which was drawn from 1Peter 2:9. The speakers for this year were chosen from church
Pastors, Chaplains, and Seminary teachers. The spiritual emphasis ended with the medical day of prayer
on 31st August 2014. On this day, staff from CBCHS institutions visited local Churches within their
communities and presented health education. We are appreciative to the churches for reception and
cooperation given to our Staff during this event. The offerings raised on that day was used to meet some
needs of the poor and needy within the communities of the congregations. We equally extend our gratitude
to the churches that willingly raised offerings on this day and gave to their closest health institution to be
used to support the needs of poor patients.
In 2014, both the staff and the patients continued to value the daily devotions for their spiritual
nourishments and growth. This is inferred from the willingness of staff and some patients to be punctual
and committed in beginning the day with morning devotions. We regularly offered devotions at key service
provision points and addressed spiritual needs of the patients. The spiritual life committees of most CBCHS
institutions were functional this year. Many institutions continued to work with either the Gospel Team or
Choir to evangelize during outreach programs.
In an effort to equip the chaplains for proper service provision, seminars were organized and sessions
included leadership and professional skills, Palliative Care, Supervision, Marriage, and the family. Through
regular Bible Studies and TEE program. The chaplaincy of the CBCHS has continued to intentionally
disciple the staff and some long term patients. A prayer chain was organized involving all the staff of our
institutions and it gave each staff an opportunity to pray for an hour for some particular concerns. Many of
the CBCHS institutions also organized Prayer Retreats and meetings depending on their local needs.
Two chaplains were ordained. One has gone through the ordination counsel and there will be ordination in
2015. Two other chaplains are in the process of writing and presenting of their doctrinal beliefs for
ordination. We are appreciative to the churches that recommended these chaplains for Ordination.
15
The challenge of the department includes the long admission process into the membership of some
churches which has been discouraging to some staff who do not easily get admission because of the
nature of their work.
Social Services
The department successfully accomplished the following this year;
Established a working relationship with the Northwest and Southwest Regional Delegations of Social
Affairs and other organizations like the Boastal Institute of Buea in the Southwest Region.
Followed- up the application process for subvention from the Ministry of Social Affairs.
Identified, assessed and followed-up support for three very destitute and vulnerable children from
Akwaya and they are presently benefiting from medical, nutritional and educational support from an
American Missionary.
Resolved many conjugal conflicts among clients.
Worked hard to integrate abandoned patients to their families. A major intervention in this light was the
intervention made by the BHM team, working with the Nigerian Consulate in Buea to send an
abandoned Nigerian patient to his family.
The department staff were involved in many trainings including; leadership seminar for heads of
department, palliative care, bible storytelling, Jim Schneider’s seminar, child protection and safeguard
seminar and social workers annual association meeting.
AIDS Care and Prevention Services
The AIDS Care and Prevention Program (ACP) activities have continued to increase and the staff are
working hard to effectively implement them, accomplishing visible results. The focus of ACP remains
prevention, treatment and the provision of psychosocial support to the infected and the affected persons.
In 2014, the community components of ACP (the ViiV project in the Northwest region and community
initiative AIDS Control Program in the Southwest region) continued to play the fore runner role in
communities; raising awareness on HIV and AIDS with a key focus on generating demand for ANC service
uptake for both pregnant women and their partners. The components equally facilitated clients’ retention in
HIV care and conducted voluntary counseling and testing in communities. The ViiV project ended in
October 2014 and a reapplication was submitted for a possible renewal.

16
We continued to support the provision of PMTCT services in the Northwest, Southwest, West and Adamawa regions in Cameroon. The President’s Emergency Plan for AIDS Relief (PEPFAR) through the Centers for Disease Control and Prevention (CDC) continued to support the provision of quality PMTCT services in the Northwest and Southwest regions while the Elizabeth Glaser Pediatric AIDS Foundation supported the implementation of these service in the West and Adamawa regions. Working with 714 PMTCT sites, we counseled and tested a total of 109,413 pregnant women; 4,811(4.4%) of whom were HIV positive and are being followed up to ensure they and their infants receive a complete PMTCT service package. We observed a decline in mother to child HIV transmission rate from 7% in 2013 to 6.5% in 2014. The HIV Care and Treatment and Tuberculosis Control Program continued to counsel clients enrolled on ART and TB medications in CBCHS clinics to ensure that they adhere to treatment. Cumulatively, at the end of 2014, a total of 23,331 clients have ever enrolled on ART in the five CBCHS care and treatment sites and 17,404 are current on ART. Others transferred out, died, were lost to follow up or stopped. The TB Program screened a total of 7,090 persons and identified 1,208 cases. The Women’s Health Program worked in collaboration with national and international partners and accomplished stated objectives. Outreach services were conducted in several communities. The department served a total of 9,554 clients who were enrolled in facility and community clinics. The program staff were trained on care HPV testing that will be used for preliminary screening of cervical cancer. This approach will be piloted as from January 2015 at Mutengene Baptist Hospital. The project is implemented in partnership with the University of Massachusetts. In 2014, the Chosen Children Program continued to implement regular activities like provision of medical,
psychosocial and education/vocational support to the orphan children. The program also carried out
advocacy activities, exposing the plight of orphan children. A total of 3,025 children were assisted this year,
many of whom were successful in end of year or course examination while some in vocations have
exceled.
The Extended Forum of Care (Contact Tracing) Program continued to integrate her services in PMTCT,
ensuring that contacts of HIV positive pregnant women are notified. In 2014, a total of 1995 index persons
and 2202 contact persons were identified, 1065 of the contact persons were notified and 762 tested for
HIV. Of those tested 382 (50%) were HIV positive.
The Youth Network for Health educated 30,462 young people on HIV/AIDS, STDs, smoking, drug abuse,
alcohol, dating, relationships, rape and values self-esteem. A total of 2,304 youths were counseled and
tested for HIV and 16 were positive.
The New Life Club (commercial sex workers) is continuing to identify persons involved in sex work. An
assessment of cases is done and they are enrolled in the club. The club activities include lessons on self-
awareness, character building, HIV testing and linkage to care and treatment.
The Support Group of People Living with HIV had a membership of about 1,058, who are predominantly
females. The association has facilitated assessment and treatment for many members. The Program

17
engages members in various capacity building activities like mushroom cultivation, telephone booths, mini
shops, etc.
The Nutrition Improvement Program is running in CBCHS facilities. Proper nutrition counselling was
provided to a total of over 20,000 patients. The program is conducting an evaluation project with external
funding from UK. The results of the evaluation will enable appropriate expansion in Cameroon and beyond.
The Palliative Care Program continued to conduct in and out patient care, counseling, home based care
and education on bereavement. The program served clients both in the facility and the communities.
The main challenges of the ACP have been limited funding for some of the programs who do not have any
obvious means of sustainability. The Program staff continue to work hard to accomplish the results
presented.
CBCHS Burkitt Lymphoma/Childhood Cancer Service
The work load of the program has been stable. A total of 112 (compared to 111 in the previous year) new
patients were recorded and treated (see details on table 22). The 3 main disease categories were Burkitt
lymphoma (BL), retinoblastoma (RB) and Wilms tumours (WT) which were all treated according to
internationally recommended and IRB approved protocols. An interesting observation is the relative
reduction in number of patients with BL, and an increase in number of patients with RB and WT. Other less
common cancers are treated with adapted protocols according to the availability of specific drugs. Primary
curative treatment (chemotherapy) for BL was provided at all hospitals, for RB (chemotherapy, surgery,
laser/cryotherapy) at MBH and BHM, and for WT (chemotherapy and surgery) at MBH. Secondary
chemotherapy and follow up is provided at the hospital closest to the patient’s home.
Pediatric palliative care home outreach was extended to include patients at both BBH and MBH. This
provided enormous relief to terminal patients and their families at their homes.
Supportive care to the patient while in hospital and to the guardian is a critical component of our
comprehensive care. Medical treatment is largely subsidized and parents only pay an initial fee of CFA
30,000 on admission. The cost of surgery, chemotherapy, laboratory investigations and surgery are largely
funded by the program. A food support program provides a daily egg to the child, and 2 cups of rice, a cup
of groundnuts and CFA 400 in cash to the attending guardian. A transport subsidy of up to CFA 10,000 per
family was available when needed. Patients who miss follow – up appointments were contacted by
telephone or visited at home by our research assistant nursing staff. All patients were registered in the
POND cancer registry, which enables us to generate health statistics, and to do health planning.

18
The Northwest Region Parent Support Group for children with cancer is a registered NGO. There are
established branches at MBH, Babessi and Ntaba. Their main objective is to improve on awareness of
childhood cancer amongst the public, to assist potential patients to travel to hospital, and to support
children with cancer and their parents while in hospital. A secondary objective is to generate income to
sustain the supportive care arm of our treatment. During the past year two families near BBH raised
chickens, 5 families at Babessi started small businesses and are paying interest on the capital loan, and 4
members at Ntaba are raising a pig and selling palm oil for shared profit. An interesting new venture is the
allocation of one hectare of farm land to the NGO at Ntaba by the local chairmen of the parents group. We
provided capital to be used to clean and prepare the land for planting corn and beans at the start of the
next rainy season. This has the potential to generate income. The program contributed capital last year to
improve on the pig houses managed by CBR at MBH. In exchange they will farm 10 pigs (sows) for us in
the coming year for shared profit when the piglets and old sows are sold. The philosophy is to utilize local
(farming) expertise in a way that benefits our program and equally benefits the participants.
Infrastructure wise, BHM registry office has been refurbished, and a Camtel modem was installed to
facilitate internet communications. At BBH a nice play room has been equipped next to the exiting
children’s cancer ward. At MBH the planned move of the X-ray and Ultrasound departments to the new
OPD wing has been approved, and the program will be able to develop a new 8 bed children’s cancer ward
adjacent to the existing children’s ward. The CBC Director of Health Services has in principle approved the
allocation of land to build a parents home with a garden within walking distance of the children’s cancer
ward. This will be an enormous service to the guardians, and will also make available hospital beds from
children who must remain near the hospital, but not necessarily as inpatients.
Dr Francine Kouya’s, our CBC Cancer Treatment Manager will leave for a planned 2 year visit to study
oncology at Stellenbosch University/Tygerberg Hospital, South Africa. Nurse practitioner Vera Njamnshi at
BBH left the CBC health services for further study. Dr Kifem Vincentia (a first Buea Medical School
graduate) joined the program at BBH. Dr Edouard Katayi who has competently supervised our program at
BHM from the onset in 2007, is now in charge of the PMTCT program for CBCHB. An internist, Dr Mbanga
Evans was appointed to act as the local supervisor for our program at BHM.

19
Following discussions with the trustees of BTMAT, Program Managers of WCC and Prof M Kruger at
Stellenbosch University it was agreed that a local Program Manager was needed to correlate activities
which are not the primary responsibility of our physicians. Prof Tih Pius Muffih approved the concept, and
Mbah Glenn was appointed the Program Manager. He is based in BBH.
In the area of research, the excellent patient records and good follow – up system offers many
opportunities which are being exploited:
The SIOP Africa Continental Conference in Dar Es Salaam in March 2014: presentations were given by
Dr Kouya (adolescent cancer), Mbah Glenn (nurses knowledge of cancer, CBC cancer statistics), Dr
Paul Wharin (palliative care in the CBC hospitals), Prof Hesseling (guest lecture on BL, outcome of
paraplegia in children with BL. A survey of the outcome of children with BL who present with
paraplegia was completed and the results presented at this conference
The SIOP International Conference in Toronto, October 2013: Dr Kouya presented our Africa
Collaborative WT Pilot Study and was awarded the best poster prize. An African Collaborative Study
for the treatment of WT has good patient recruitment, and is collated by nurse Nana Philippa. A study
of the very long term outcome of all patients treated for BL at CBC hospitals between 2003 and 2013
was commenced with the help of a Swiss Cancer League grant.
This year, CBCHS hospitals were visited twice by Prof Peter Hesseling (representing Stellenbosch
University) and Dr Paul Wharin (representing the Beryl Thyer Memorial Africa Trust) to review and support
the program. Mr Ed Minor (World Child Cancer) joined the aforementioned during their last visit.
We remain committed to providing the best possible care to as many children with cancer as possible. We
consider it of crucial importance to train and develop our Cameroonian members of staff. Equally important
to us is the promotion of knowledge of childhood cancer in the community, and also to mobilize local
resources that will promote sustainability of our program.
Socio-Economic Empowerment of Persons with Disabilities (SEEPD) Program
The second phase of the Socio-Economic Empowerment of Persons with Disabilities Project ended this
year. The goal of this phase was to contribute to general community development by reducing the proximity
in direct relation between poverty and disability. The overall objective was to improve on the quality of life of
persons with disabilities. The purpose of the program evolved from socially and economically empowering
PWDs in the first phase to enabling PWDs exploit their full potentials in inclusive settings during the second
phase. In 2014, activities to achieve the aforementioned purpose were implemented in five domains of

20
intervention: medical and rehabilitation care, inclusive education, livelihood, social inclusion of persons with
disabilities and research. The summary report below presents the 2014 accomplishments
Medical and Rehabilitation services: Following demand generation done in the first phase of the
Program, the second phase of the Program
focused on enhancing access to and
increasing utilization of quality medical care
at all levels. This was done by improving the
quality of services, maintaining affordable
prices, and introducing sub-specialties –
specifically in eye care. With increased
sensitization on existing services, increased
number of services, increased outreach to
communities, increased staffing at the
different facilities and capacity building, the
following results were achieved:
Awareness on existing services continues to increase with 627,188 people sensitized on existing
services.
Access to medical services increased from 145,024 people in phase I to 255,783 people in phase II.
Of the 255,783 (121,617 males and 134,166 females) people who accessed various health services,
126,868 directly accessed health services for the first time.
38,367 of those who accessed services were people with disabilities.
Education: In the second phase, the purpose of the inclusive education component was to increase
government involvement in the education for all
(including children with disabilities) in primary,
secondary and tertiary schools. In 2014, the
Program continued using the twin-track
approach- one being special education and the
other inclusive education to realize the following
results:
SEEPD Program Team led by Prof Tih (right)
handing over Braille Embosser and Laptop to Dr
Abety Peter (left), Chairman of the Board of Directors
of the GCE Board.
ENT Surgeon undertaking a nose surgery
21
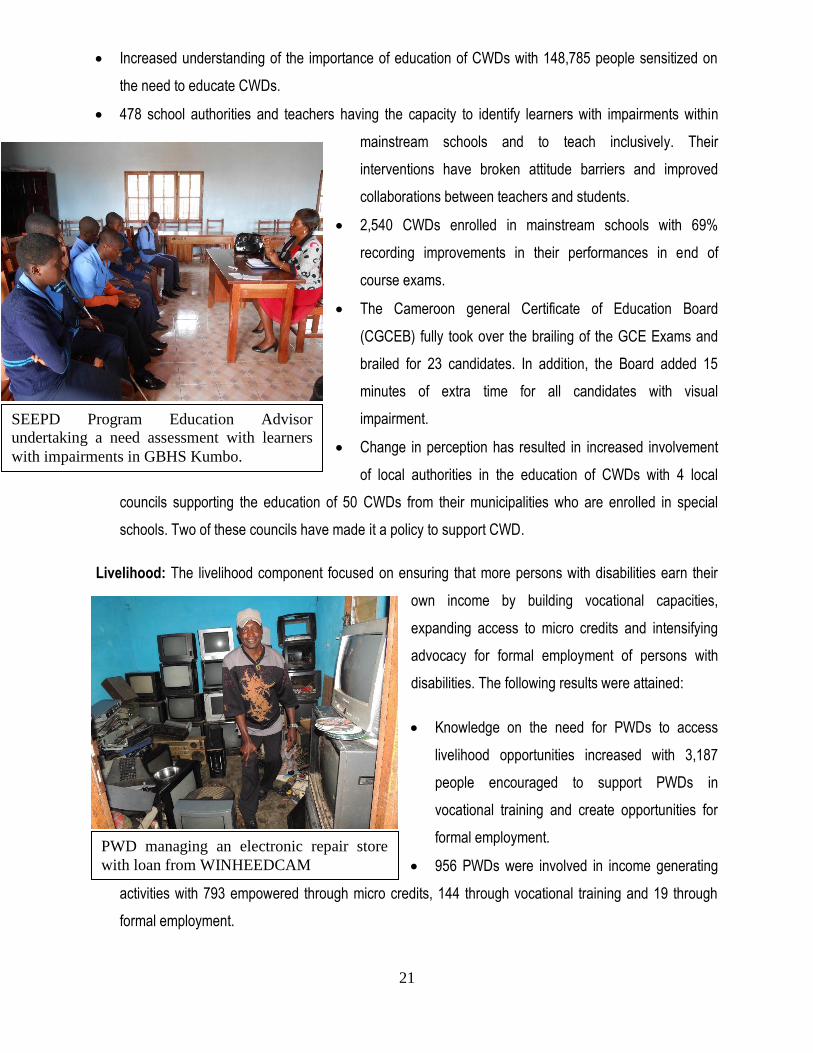
Increased understanding of the importance of education of CWDs with 148,785 people sensitized on
the need to educate CWDs.
478 school authorities and teachers having the capacity to identify learners with impairments within
mainstream schools and to teach inclusively. Their
interventions have broken attitude barriers and improved
collaborations between teachers and students.
2,540 CWDs enrolled in mainstream schools with 69%
recording improvements in their performances in end of
course exams.
The Cameroon general Certificate of Education Board
(CGCEB) fully took over the brailing of the GCE Exams and
brailed for 23 candidates. In addition, the Board added 15
minutes of extra time for all candidates with visual
impairment.
Change in perception has resulted in increased involvement
of local authorities in the education of CWDs with 4 local
councils supporting the education of 50 CWDs from their municipalities who are enrolled in special
schools. Two of these councils have made it a policy to support CWD.
Livelihood: The livelihood component focused on ensuring that more persons with disabilities earn their
own income by building vocational capacities,
expanding access to micro credits and intensifying
advocacy for formal employment of persons with
disabilities. The following results were attained:
Knowledge on the need for PWDs to access
livelihood opportunities increased with 3,187
people encouraged to support PWDs in
vocational training and create opportunities for
formal employment.
956 PWDs were involved in income generating
activities with 793 empowered through micro credits, 144 through vocational training and 19 through
formal employment.
SEEPD Program Education Advisor
undertaking a need assessment with learners
with impairments in GBHS Kumbo.
PWD managing an electronic repair store
with loan from WINHEEDCAM
22
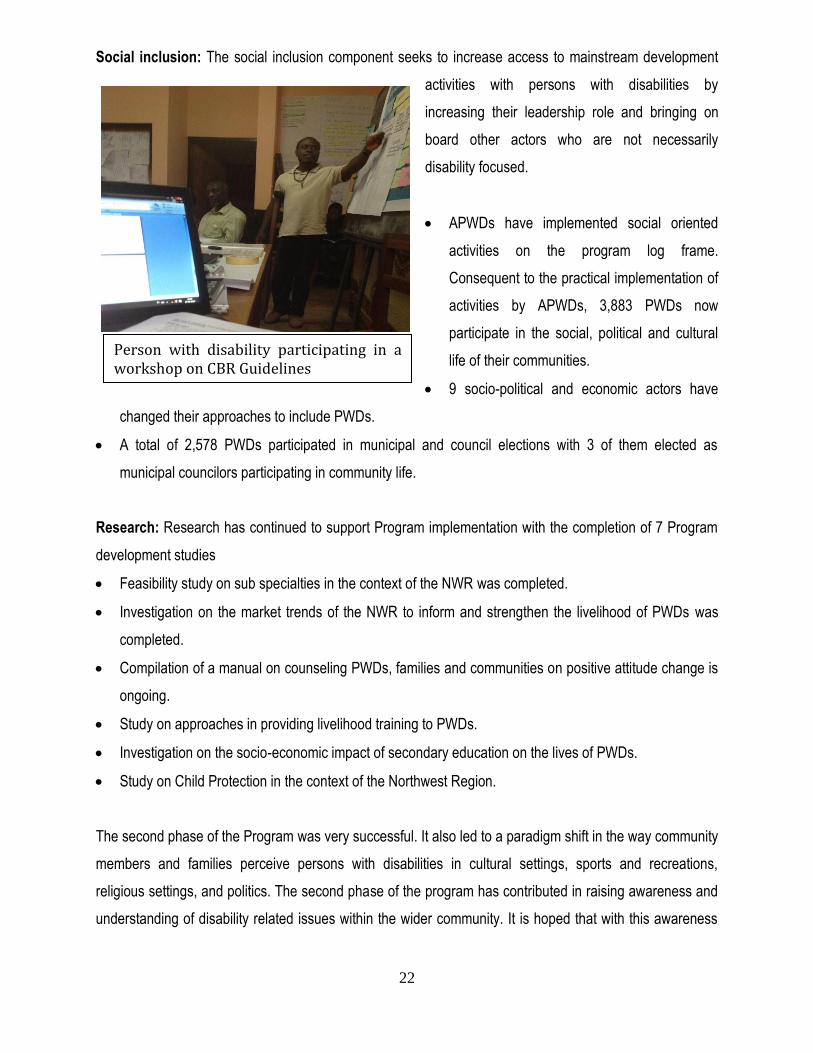
Social inclusion: The social inclusion component seeks to increase access to mainstream development
activities with persons with disabilities by
increasing their leadership role and bringing on
board other actors who are not necessarily
disability focused.
APWDs have implemented social oriented
activities on the program log frame.
Consequent to the practical implementation of
activities by APWDs, 3,883 PWDs now
participate in the social, political and cultural
life of their communities.
9 socio-political and economic actors have
changed their approaches to include PWDs.
A total of 2,578 PWDs participated in municipal and council elections with 3 of them elected as
municipal councilors participating in community life.
Research: Research has continued to support Program implementation with the completion of 7 Program
development studies
Feasibility study on sub specialties in the context of the NWR was completed.
Investigation on the market trends of the NWR to inform and strengthen the livelihood of PWDs was
completed.
Compilation of a manual on counseling PWDs, families and communities on positive attitude change is
ongoing.
Study on approaches in providing livelihood training to PWDs.
Investigation on the socio-economic impact of secondary education on the lives of PWDs.
Study on Child Protection in the context of the Northwest Region.
The second phase of the Program was very successful. It also led to a paradigm shift in the way community
members and families perceive persons with disabilities in cultural settings, sports and recreations,
religious settings, and politics. The second phase of the program has contributed in raising awareness and
understanding of disability related issues within the wider community. It is hoped that with this awareness
Person with disability participating in a workshop on CBR Guidelines

23
and understanding, mainstream structures will take affirmative action in promoting and sustaining the
participation of PWDs in all aspects of community life.
Central Pharmacy (CP)
The CBC Central Pharmacy will turn 25 on January 31st 2015 and this date has been fixed for the
celebration of this Silver Jubilee. We continued to work with the German Institute for Medical Mission,
Difaem to ensure the quality of pharmaceuticals that get into the CBC Health System by performing random
testing of pharmaceutical products from varied sources.
In 2014, we placed two major international orders for medicines and medical supplies. The consumption
data for all medicines, medical supplies, dental and laboratory items were reviewed and updated, and a
procurement time table prepared in preparation for 2015 orders.
The storekeepers’ workshop for 2014 took place successfully according to plan. The CP satellite store in
Kumba created, starting temporary at the Kumba Health Centre new building.
The production of IV infusion fluids was stable throughout the year compared to the past where there were
interruptions. The raw materials were available. Eye drops production was also consistent. However, eye
drops production is slow because the process is manual due to broken machine. The Non-Sterile unit is
responsible for the preparation of extemporaneous products for all the CBC Health Institutions. These
include ointments, creams, solutions, suspensions, emulsions, lotions, gels, etc. Production was consistent
in 2014 due to the availability of the raw materials. The chemical production unit met its target of 2014.
Three palm nurseries were created: in Sarkibaka, Nyamboya and Ngounso. Planting is envisaged for May
2015. Over 115 hectares of land is needed for the project. The palms are needed for palm kernels for the
extraction of oil for soap manufacturing.
The quality assurance department works with all Central Pharmacy production departments to ensure that
all production is done according to current Good Manufacturing Practices (cGMP) and also ensures the
implementation of ISO (International Organization for Standardization) guidelines. The department carried
out 520 quality control tests in 2014. Of these, 58 were done using MiniLab equipment for finished dosage
form imported from abroad. Products that fail were sent to Kenya, and subsequently to Germany for
confirmatory tests.
The water bottling unit changed the look of their product (HESCO). A total of 222,000 litres of water were
bottled and no breakdowns in machines were experienced. Jeff Brown’s Team has continued to provide

24
considerable amount of spares and tools to HESCO, including accounting software. The unit renewed its
business license and exploitation permits. Sales to CBC institutions are increasing with Kumba BHC,
Mboppi and Banso Baptist Hospitals leading in making the water available to patients. HESCO has
acquired an 18 ton truck to use for supply.
The major challenges that CP faced was inadequate personnel, shortage of raw materials and periodic
machine failures.
Health Services Complex (HSC), Mutengene
The HSC continued to host activities of the CBC Central Pharmacy and AIDS Care and Prevention
Program like the HIV free Southwest project, Community Initiative AIDS Care Program, Early Infant
Diagnosis (EID) Reference Laboratory, Chosen Children (Orphan care) Program and Regional Training
Center for Excellence amongst others.
The Regional Training Center for Excellence organized several workshops and seminars in 2014 to
sharpen the capacities and skills of health professionals of different cadres. Amongst the workshops and
seminars organized include Electrocardiogram Cardiovascular Monitoring and Ultra Sonography seminar,
Pediatric HIV AIDS workshops, Option B+ training workshops, Women’s Health Program coordination
workshops, Local Capacity Initiative workshops, etc.
The final judgment for the Health Services Complex, Mutengene property was delivered by the Supreme
Court in favour of the CBC on June 12, 2013. Concerning the parcel of land outside the fence, the
Divisional Officer (DO) of Tiko and the Divisional Delegate for Mines and water resources visited the site on
October 11, 2014 and are requesting for the names of those who bought that parcel of land from an interim
village traditional council after the death of Late Chief Luma, Chief of Mutengene. Presently, the Chief of
lands Brigade, Tiko is working to get the names for the Divisional Officer. Let us continue to pray that it is
reverted to CBC.
Banso Baptist Hospital (BBH)
The workload of the hospital increased and the staff worked hard to meet the needs of patients. A total of
93,954 patients were served on outpatient basis, 8,051 were admitted and 1,707 major surgeries
conducted.

25
The Administration of the hospital changed from Mr. Ngam Joseph to Mr. Kangong Joce. Mrs. Mbiydzenyuy
Margaret was appointed the Assistant Supervisor of Nursing Services. Other personnel issues occurred as
follow;
Bangolan Baptist Health Centre celebrated her Golden Jubilee. The main accomplishment of the center this
year was the construction of an incinerator. The Kouhouat Baptist Health Centre new block was roofed, and
two water tanks of 5000 litres each set up for better water supply. Led by the Director of Health Services, a
team met and discussed with the landlord of Lassin Baptist Health Centre who provided one hectare of land
adjacent the Health Centre for the construction of the center and staff quarter. The Lassin new Health
Centre building was completed. The former Mayor of Magba Council (Nji Vessah Tani Oliver) donated an
Ambulance, an Ultra Sound Machine, a stretcher and an office chair to the Ngounso Baptist Health Center.
BBH received several visitors this year. These include Dr. Helen Marie Schmidt, Sister Betty Mantay, Prof.
Koch, Wayne Martin and teams from partner organizations like the Center for Disease Control, and CBM.
The General Secretary visited the hospital during his visit to Nso Field on 18th October 2014. Our visitors
were impressed with the work going on in the hospital.
In line with infrastructure, the first phase of the maternity
renovations (delivery room) was completed and work is ongoing
at the training school and eye department buildings. The
skeleton of the BBH eye department was completed and roofed
this year.
BBH Eye Department New Building
Siamese twins were born at BBH Maternity on the 27th of August 2014. They are doing well while trusting
that funding will be secured to enable their separation as soon as possible.
Dr. Martin Maada Salia who served as general surgeon at BBH from September 2008 to January 2010 died
of Ebola on November 17, 2014. BBH held a memorial service in his honour on November 29, 2014

26
Mbingo Baptist Hospital (MBH)
Working as a team the entire MBH staff did everything possible to satisfy over 95% of the 79,653
outpatients and 10,202 inpatients that were served in 2014. Several other accomplishments and changes
occurred as follows;
Three leadership positions changed hands this year: Mr. Monono Hans took over from Mr. Kangong Joce
as Assistant Administrator for Finance, Pastor Kouya Bienvenu took over the position of head chaplain from
Rev. Tanni Moses and Miss Dhei Menu Keming took over from Mr. Fonchang Festus Fumbui as the
Bursar.
The third batch of CIMS and fourth batch PAACS graduated this 2014. Dr. Kamdem Jacob graduated as
an internist and was employed to serve with CBCHS at MBH while Dr. Ngoe Anthony Nesoah as a surgeon
was engaged at Hopital de Meskine in the Far North Region of Cameroon. Each of the specialization
programs enrolled two new residents – Dr Sama Akanyun and Dr. James Joseph for the PAACS program
and Dr. Nshom Ernest and Dr. Kinne Virginie for the CIMS program. In total the programs have eighteen
residents (10 for PAACS and 8 for CIMS)
The Mbingo I CBC Primary School and the Integrated School for the Deaf (ISFD) continue to excel in the
Common Entrance and First School Leaving Certificate examinations. The ISFD enrollment increased by
10.7% this year while that of the Mbingo I CBC School decreased by 11.4%. The decrease is due to the
fee increase in order to reduce the recurrent deficit. The school management anticipated the decrease but
predicted an increase thereafter.
This year we celebrated the 61st World Leprosy Day during which 6 leprosy patients treated and healed
were discharged while 4 physically impaired persons graduated from the vocational training in different
disciplines.
We carried out renovations and construction to improve wards and work space. The ceilings of the Men
and Orthopedic wards were replaced with synthetic battens (lambris) and the wall repainted. The
Orthopedic ward was swapped with the Female ward. This provided adequate space for the orthopedic
ward and made it possible to separate the male and female patients to provide privacy. The eye ward was

27
relocated to the ground floor (called Upper Ward) on the Isolation ward. This adjustment allowed for
increase bed capacity for general surgery in the surgical ward. The linen room was converted into a 5 bed
ward, increasing the bed capacity of the female ward to 29.
This year, twenty two SAAR students (17 from Ndop and 5 from Fundong) were received for a two month
internship. Similarly, we received 19 nurses and 3 teachers from Central African Republic. The main
purpose was to observe nursing practice in Cameroon because they could not practice in their hospitals
due to the civil war.
We purchased or received donations of several equipment including a digital x-ray machine, bipap
ventilator (donated by Annette Lievaart, a visiting respiratory therapist from Tenweck Hospital in Kenya), a
GeneXpert machine, a concrete mixer, and a four wheel drive hilux.
Infrastructure wise, we realized the following projects this year;
The surgical clinic at the new Outpatient Department was completed and put to use.
The Intensive Care Unit (ICU) was completed and opened for use

28
The Students Hostel consisting of a ground
floor and two floors was constructed and
roofed.
Also, the first floor of the new OPD was
decked, columns of the 2nd floor raised and
roofed.
Two urban health centres (Nkwen and Bafoussam) operated at sustainable level this year but for Belo
integrated health center, all the nine rural health centres operated at a deficit. Electricity was connected and
installed at Ashong Health Centre while a generator was bought and installed at Ndebaya Health Centre.
Three lawn mowers were purchased for Sabga, Belo and Ashong health centres.
Mbingo Baptist Hospital workers were blessed with the visit of retired medical missionaries; Dr. Schmidt,
Sr. Mantay and Dr. Cunnigham. Also, the Canadian and the American NAB Directors for White Cross
visited Mbingo Baptist Hospital.
Baptist Hospital Mutengene (BHM)
The hospital continued to experience expansion in services provided and consequently an increase in
workload. This year the staff worked hard serving in total 111,627 outpatients and 4,988 inpatients.
Construction work was ongoing at the imaging, maternity, and generator house. Following the finishing of
the right wing of the maternity building, space became available and the administration moved there. The
basement of the imaging structure was renovated and is being used as the chapel and for other combined
services. Over 300 plastic chairs were purchased to meet the needs of these services. There are plans to
make adjustments, relocating services so as to make the best use of the available space.
The Chief Medical Officer (CMO) Dr. Ndasi Henry was a recipient of the annual American Orthopedic
Trauma Association (OTA) and SIGN scholar award for 2014 for his work in developing orthopedic services
in the Mutengene area of the Southwest Region in Cameroon. This act of excellence enabled him to travel
and make presentations at the OTA annual congress in the state of Florida USA. Our Internist in the person
29
of Dr. Mbanga Evans started a chemotherapy services and will be assisted by Mrs. Chia Olivia Njang a
Nurse Assistant
A number of the BHM administration visited former CBC officials of the region like the former CBC
President, Pa Becke Samuel, the former CBC General Secretary, Rev. Khama Samson and Ma Beatrice
Nokuri with special gifts and prayed with them.
We conducted several upgrading seminars like COPE (Client oriented provide efficient) services, electro-
sonography and electro-cardiography, infection prevention, advance life support in obstetrics, nutrition
improvement, non- surgical fracture management and Ebola protection and management, etc.
Major equipment purchased included a heavy duty generator, a sound system for chapel services and
diagnostic equipment for the laboratory.
The performance based financing (PBF) initiative selected Kumba Baptist Health centre as the best health
facility in the Southwest Region with remarkable increase inpatient and outpatient attendance. To handle
the increasing workload without compromising quality, the staff strength of the center was increased from
57 to 97. Dr. Bong Yvonne is the pioneer Medical Doctor. Services that were started include the women’s
Health Program, physiotherapy, ultrasonography and social work. A Central Pharmacy satellite store was
created at the first floor of the existing structure. The construction of a structure to house the technical
services department, dormitory for technicians, carpentry workshop and patient toilets was carried out.
The Ekondo Titi Baptist Health Centre is fairly young (less than two years old) and is growing rapidly. In
2014, the center made significant achievements including the purchase of mosquito nets and setting them
up on all beds and the casting of a slap over the health center water well. The Bafia Baptist Health Center
has been existing for one year and its service uptake is steadily increasing.
30
Baptist Hospital Banyo (BHB)
The workers of Baptist Hospital Banyo and the satellite health centers worked hard to achieve most of the
goals planned for this year. Our missionaries, Dr. James and Mrs. Ina Smith are working extremely hard
towards steady growth of the institution. This year the hospital served in total 9,685 outpatients and 949
inpatients. Other accomplishments of the hospital are;
The dental unit was reopened.
The acquisition of a parcel of land around the main land. The registration process is ongoing.
A new building of five rooms was constructed on the piece of land where John Dallman earlier
constructed at the initiation of the center.
With assistance from Mr. & Mrs. Shinar Joshua and Dr. Zacs Shinar (visitors from USA) we scaled up
internet in the hospital and equally installed an intercommunication system.
A bore-hole well with electric motor pump was constructed on campus to boost water supply.
Sarkibaka Health Center completed construction work on the foundation of the new OPD.
The government gave a motor cycle to Allat Baptist Health Centre to facilitate outreach activities within
the Allat Health Area.
The challenges of the hospital are limited houses for staff and the decreasing presence of LAP posts in the
region which is affecting service uptake
Mboppi Baptist Hospital Douala
The volume of work continued to increase at Mboppi Baptist Hospital. In 2014, the staff of the hospital
worked had providing outpatient care to 254,956 clients and 6,698 inpatients. Highlights of the year are as
follows;
We received a donation of CD4 count machine from CDC/GAP/PEPFAR. It will facilitate the quality of care
provided to HIV and AIDS patients. Laboratory equipment bought this year included a backup chemistry
analyzer for creatinine, coagulation analyzer, Laboratory incubator and an autoclave. The eye department
received a surgical microscope from the White Cross Supplies Program and purchased a biometry
machine, cataract set, air pulse tonometry, eye autoclave and auto retractor keratometer. Theatre
equipment purchased were anesthetic machine and electro surgical unit. The hospital bought a new model
Toyota Hiace and extended the intercom system to all departments.

31
The women of Presbyterian Church Bonaberi paid a courtesy visit to the hospital and donated soap, water
and toilet tissues to the inpatients. They also sang songs of praises to the Almighty God and prayed with
the patients. To demonstrate practical Christianity, the women assisted two bill penders with the sum of 50
000 FCFA (fifty thousand francs). Also, a group of women from the CNPS visited Mboppi Hospital and
donated a variety of gifts to the children of the pediatric ward. This was one of their activities toward the
celebration of women’s day - March 8, 2014. The choice of Mboppi Baptist Hospital was in recognition of
the cordial relationship that exists between Mboppi Baptist Hospital and the CNPS.
The setting up of the pediatric ward was completed and children can now receive quality care from the
specialized staff using modern equipment at their disposal. The hospital is progressively purchasing and
installing air conditioners in all the departments.
The major challenges of the hospital are inadequate work space and waiting areas for patients and the lack
of staff accommodation.
Etoug-Ebe Baptist Hospital and Supervised Health Centers
The Etoug-Ebe Baptist Hospital was busy throughout the year and served in total 114,254 outpatients. The centre is now managed by a team of executives including the Administrator, Chief Medical Officer, Supervisor of Nursing Services and a Clinical Supervisor who ensure its smooth functioning. The center has good collaboration with the Ministry of Public Health, Biyem-Assi District Hospital and Mvog-Betsi Health Area.
The hospital now runs a split shift practiced from 6:45am to 6pm on Mondays to Fridays and from 6:45am
to 4pm on Saturdays. Also, registration and payments was decentralized. These measures have helped to
reduce clients waiting time and contributed to improve quality of care. We purchased a chemistry analyzer
and ELIZA this year.
The hospital has recorded a good number of accomplishments
The realization of the Bio-gaz Treatment Plant which will help reduce the sewage disposal.
The organization of COPE and Infection Prevention trainings which were very motivating to the staff
The availability of ARV drugs at the treatment centre.
The construction of a mini market which is helping clients and staff to have quality food in a decent
environment.
The training and installation of PIMA CD4 Counter by Clinton Health Access Initiative (CHAI) for free
CD4 count test for pregnant women and children below five years and 5000 frs for other clients.
32
Identifying Zoetele as another outreach area for eye consultation
Our challenges include inadequate work space, poor access road to Voundou especially during the rainy
season and high staff mobility.
The leadership of Ekounou Baptist Health Center changed from Mr. Sam Pius to Mr. Nkinen Martin. The
center installed water and electricity at their permanent site and construction work is ongoing on the fence.
The need to improve on work space is urgent for this center.
Voundou Baptist Health Center is fairly young and is offering basic services like outpatient department
consultation, laboratory, pharmacy, MCH and nutrition improvement activities. The centre is constructing
patient waiting area which will accommodate other services like the Maternity and Consultation. The center
was able to purchase a TV set and deck and drum incinerator and also installed some furniture like
cupboards in the various departments.

33
B. HEALTH INFORMATION MANAGEMENT SYSTEMS (HMIS)
In 2014, all the six hospitals and twenty seven health centers of CBCHS reported although timely submission of the
reports was a concern. Relative to 2013, outpatients’ service uptake increased and there was a proportionate
increase in admissions. The tables, figures and charts below summarize the key performances of 2014 compared to
2013
Table 1 Summary performance of CBCHS institutions in 2014
INDICATOR/DEPARTMENT BBH MBH BHM MBHD BHB DBH
SUPERVISED IHCs Total
Bed Capacity
239
294
97
84
42 40
561
1,357
Staff Strength*
498
709
260
311
72 19
819
2,688
OPD attendance
93,954
79,653
111,627
254,956
9,685 4,651
450,444
1,004,970
Inpatient Attendance
8,051
10,202
4,988
6,698
949 646 18,996 50,530
Deliveries
1,377
916
923
2,883
187 158 3,714 10,158
Major Surgeries
1,707
4,635
1,564
1,395
194 25 29 9,520
Minor Surgeries
8,046
4,471
1,608
2,596
384 153
22,042
39,300
Deaths
478
565
154
55
33
5 170 1,460
Patients served by Pharmacy
54,577
95,701
81,860
170,276
8,066 4,119 320,331 734,930
Patients served by Laboratory
51,996
57,820
41,954
68,521
6,736 1,796 196,408 425,231
Patients served by Doctors
17,171
34,144
32,437
68,311
2,496 527 23,700 178,786
Patients served by Screeners
28,153
45,415
72,554
186,645
7,849 10,654 260,460 611,730
Eye Department
11,598
14,284
11,928
26,080
587 137 45,094 109,708
Chaplaincy
8,730
5,663
3,082
1,924
588 270 11,645 31,902
Social Worker
3,768
3,160
4,385
3,764 - - 2,770 17,847
Dental Department
5,260
2,273
3,759
6,446
643 - 24,846 43,227
Ultrasound Department
7,930
12,276
5,050
10,010
1,305 - 5,686 42,257
Physiotherapy Department
6,991
11,037
2,839
10,599
199 - 12,102 43,767
X - Ray Department
4,700
10,711
3,813 -
881
- - 20,105
Nutrition
2,577
1,880
902
24,946 - 80 4,665 35,050
*: Staff of supervised IHCs includes those of LAP, DHS OFFICE, HSC AND TSD

34
Table 2.1 – Distribution of beds by Hospitals and Health Centers
Hospital Medical Maternity Pediatric Surgical Total %
BBH 105 39 51 44 239 17.5
MBH 181 22 26 65 294 21.5
BHM 46 21 10 20 97 7.1
MBHD 0 47 14 23 84 6.1
BHB 20 8 7 7 42 3.1
DBH 23 17 0 0 40 2.9
Other Institutions 276 212 84 572 41.8
Total 651 366 192 159 1368 100
Table 2.2 Number of Beds distributed by ward, comparing 2013 and 2014
S/N WARD 2013 2014 % CHANGE
1 Medical 654 651 -0.5
2 Maternity 366 366 0
3 Pediatric 175 192 9.7
4 Surgical 126 159 26.2
TOTAL 1321 1368 3.6
The number of beds in CBCHS institutions increased from 1,321 in 2013 to 1,368 in 2014. This represents
a 3.6% increase. Institutions that contributed to this increase include Baptist Hospital Mutengnene, Mboppi
Baptist Hospital Douala, Banyo Baptist Hospital and the health centers put together. These institutions
either carried out some construction or renovations that increased their bed capacity.
Table 3.1 Staff strength by institution and cadre
ST
AT
ION
DO
CT
OR
S
NU
RS
ES
AU
XIL
LA
RY
PA
RA
ME
DIC
AL
AD
MIN
IST
RA
TO
RS
AD
MIN
IST
RA
TIV
E S
TA
FF
CH
AP
LA
INS
& S
OC
IAL
WO
RK
ER
S
CL
ER
ICA
L S
TA
FF
NU
TR
ITIO
N
CO
UN
SE
LO
RS
OT
HE
RS
TO
TA
L
BHM 12 101 33 35 3 2 8 22 2 65 283
BBH 17 164 69 54 4 7 15 31 2 136 499
MBH 20 189 55 72 4 9 11 43 5 200 611
MBHD 10 94 26 43 2 2 6 25 1 69 278
BHB 0 17 5 9 1 0 1 4 0 16 53
HSC 0 4 11 26 3 11 1 13 0 79 148

35
LAP 0 13 0 2 1 1 1 2 1 15 36
DHS CENTRAL 0 5 1 5 3 36 6 12 0 54 122
Supervised IHCs 12 223 120 121 1 4 16 61 7 229 794
TOTAL 71 810 320 367 22 72 65 213 18 863 2824
Table 3.2 staff strength by cadre comparing 2013 and 2014
S/N CADRE 2013 2014 % CHANGE
1 Doctors 68 71
4.2
2 Nurses 675 810
16.7
3 Auxiliary 363 320 -13.4
4 Paramedical 332 367
9.5
5 Administrators 19 22
13.6
6 Administrative staff 84 72 -16.7
7 Chaplains 50 65
23.1
8 Others 1095 1097
0.2
TOTAL 2,686 2824
4.9
There was a 4.9% increase in the staff strength of CBCHS. Auxiliary and administrative staff decreased
while the rest of the cadre of staff increased. The decrease is a result of the staff going to school while most
of the increase is due to recruitment.

36
Table 4.1 Outpatient Attendance
SN INSTITUTION 2013 2014 % CHANGE
1 BBH 93,147 93,954 0.9
2 MBH 82,290 79,653 -3.2
3 BHM 106,894 111,627 4.4
4 MBHD 240,029 254,956 6.2
5 BHB 9,588 9,685 1
6 DBH 4,367 4,651 6.5
7 Other Institutions (IHCs) 409,185 450,444 10.1
TOTAL 945,500 1,004,970
6.3
There was 6.3% increase in the outpatient attendance of 2014 compared to 2013. Other than MBH, all the institutions
witnessed an increase in outpatient attendance.
Table 4.2 Distribution of Outpatient by gender
SN GENDER 2013 2014 % CHANGE
1 Male 368,715 391,612 6.2
2 Female 576,785 613,358 6.3
TOTAL 945,500 1,004,970 6.3
More females were provided healthcare at CBCHS institutions than male in 2014. There was a similar
increase in the number of females and males who were attended to on outpatient basis in 2014 relative to
2013.
Figure 1 Distribution of Outpatient Attendance by Age Group
37
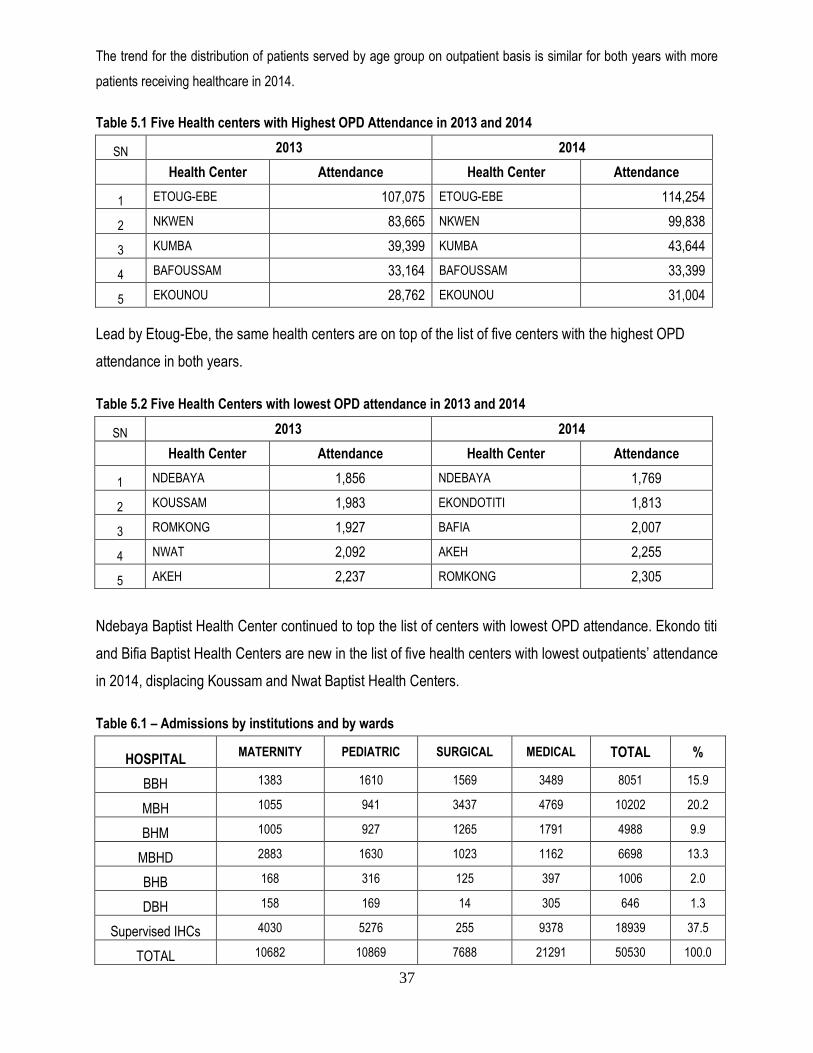
The trend for the distribution of patients served by age group on outpatient basis is similar for both years with more
patients receiving healthcare in 2014.
Table 5.1 Five Health centers with Highest OPD Attendance in 2013 and 2014
SN 2013 2014
Health Center Attendance Health Center Attendance
1 ETOUG-EBE 107,075 ETOUG-EBE 114,254
2 NKWEN 83,665 NKWEN 99,838
3 KUMBA 39,399 KUMBA 43,644
4 BAFOUSSAM 33,164 BAFOUSSAM 33,399
5 EKOUNOU 28,762 EKOUNOU 31,004
Lead by Etoug-Ebe, the same health centers are on top of the list of five centers with the highest OPD
attendance in both years.
Table 5.2 Five Health Centers with lowest OPD attendance in 2013 and 2014
SN 2013 2014
Health Center Attendance Health Center Attendance
1 NDEBAYA 1,856 NDEBAYA 1,769
2 KOUSSAM 1,983 EKONDOTITI 1,813
3 ROMKONG 1,927 BAFIA 2,007
4 NWAT 2,092 AKEH 2,255
5 AKEH 2,237 ROMKONG 2,305
Ndebaya Baptist Health Center continued to top the list of centers with lowest OPD attendance. Ekondo titi
and Bifia Baptist Health Centers are new in the list of five health centers with lowest outpatients’ attendance
in 2014, displacing Koussam and Nwat Baptist Health Centers.
Table 6.1 – Admissions by institutions and by wards
HOSPITAL MATERNITY PEDIATRIC SURGICAL MEDICAL TOTAL %
BBH 1383 1610 1569 3489 8051 15.9
MBH 1055 941 3437 4769 10202 20.2
BHM 1005 927 1265 1791 4988 9.9
MBHD 2883 1630 1023 1162 6698 13.3
BHB 168 316 125 397 1006 2.0
DBH 158 169 14 305 646 1.3
Supervised IHCs 4030 5276 255 9378 18939 37.5
TOTAL 10682 10869 7688 21291 50530 100.0
38
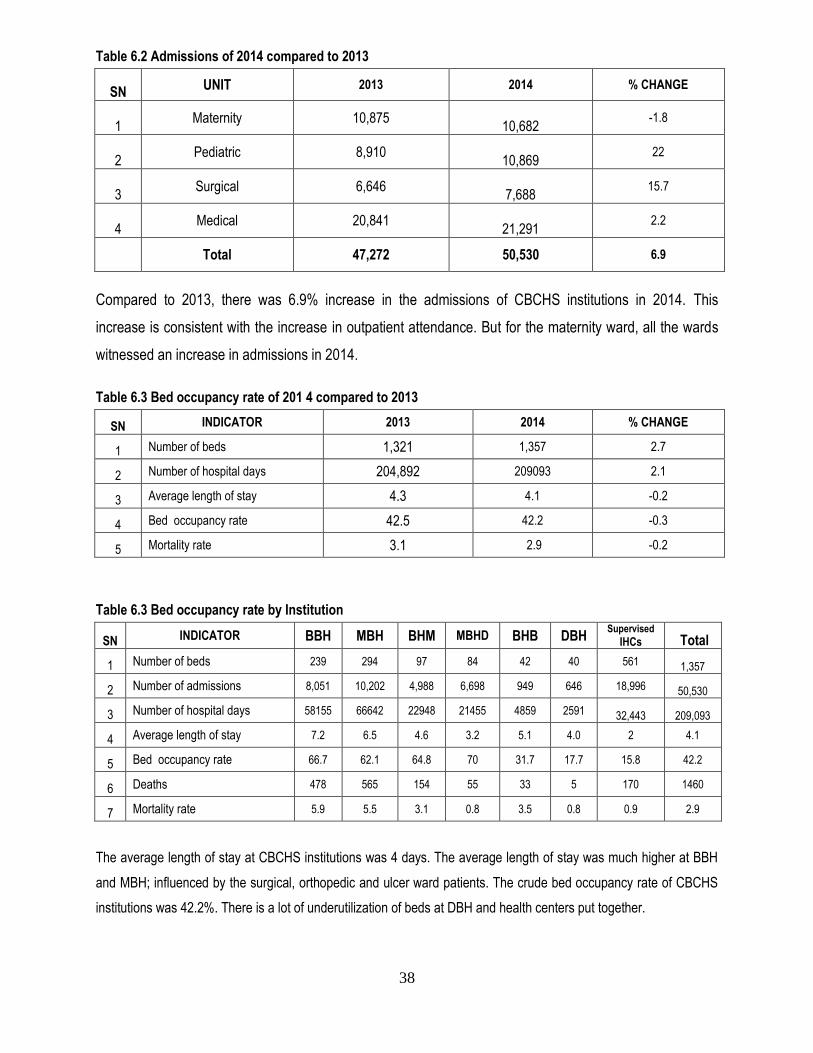
Table 6.2 Admissions of 2014 compared to 2013
SN UNIT 2013 2014 % CHANGE
1 Maternity 10,875
10,682
-1.8
2 Pediatric 8,910
10,869
22
3 Surgical 6,646
7,688
15.7
4 Medical 20,841
21,291
2.2
Total 47,272 50,530 6.9
Compared to 2013, there was 6.9% increase in the admissions of CBCHS institutions in 2014. This
increase is consistent with the increase in outpatient attendance. But for the maternity ward, all the wards
witnessed an increase in admissions in 2014.
Table 6.3 Bed occupancy rate of 201 4 compared to 2013
SN INDICATOR 2013 2014 % CHANGE
1 Number of beds 1,321 1,357 2.7
2 Number of hospital days 204,892 209093 2.1
3 Average length of stay 4.3 4.1 -0.2
4 Bed occupancy rate 42.5 42.2 -0.3
5 Mortality rate 3.1 2.9 -0.2
Table 6.3 Bed occupancy rate by Institution
SN INDICATOR BBH MBH BHM MBHD BHB DBH Supervised
IHCs Total
1 Number of beds 239 294 97 84 42 40 561 1,357
2 Number of admissions 8,051 10,202 4,988 6,698 949 646 18,996 50,530
3 Number of hospital days 58155 66642 22948 21455 4859 2591 32,443 209,093
4 Average length of stay 7.2 6.5 4.6 3.2 5.1 4.0 2 4.1
5 Bed occupancy rate 66.7 62.1 64.8 70 31.7 17.7 15.8 42.2
6 Deaths 478 565 154 55 33 5 170 1460
7 Mortality rate 5.9 5.5 3.1 0.8 3.5 0.8 0.9 2.9
The average length of stay at CBCHS institutions was 4 days. The average length of stay was much higher at BBH
and MBH; influenced by the surgical, orthopedic and ulcer ward patients. The crude bed occupancy rate of CBCHS
institutions was 42.2%. There is a lot of underutilization of beds at DBH and health centers put together.

39
Table 7 Patients flow per department for 2014 compared to 2013
SN DEPARTMENTS 2013 2014 % CHANGE
1 Eye 101,307 109,708 8.3
2 X-Ray 20,286 20,105 -0.9
3 Physiotherapy 37,025 43,767 18.2
4 Ultra-Sound 36,814 42,257 14.8
5 Dental 40,186 43,227 7.6
6 Laboratory 395,976 425,231 7.4
7 Pharmacy 680,026 734,930 8.1
8 Chaplaincy 25,064 31,902 27.3
9 Social workers 13,607 17,847 31.2
10 Patients served by doctors 155,882 178,786 14.7
11 Patients served by screeners 585,692 611,730 4.4
12 Nutrition NA 35,050 NA
13 Cervical Cancer 7617 9413 23.6
Other than the x-ray department whose work load decreased, there was an increase in the workload of the
rest of the departments.
Table 8 Departmental Patient Flow for Hospitals and IHCs
DEPARTMENT BBH MBH BHM MBHD DBH BHB IHCs TOTAL
Eye 11,598 14,284 11,928 26,080 137 587 45,094
109,708
X-ray 4,700 10,711 3,813 - - 881 -
20,105
Physiotherapy 6,991 11,037 2,839 10,599 - 199 12,102
43,767
Ultra-sound 7,930 12,276 5,050 10,010 - 1,305 5,686
42,257
Dental 5,260 2,273 3,759 6,446 - 643 24,846
43,227
Laboratory 51,996 57,820 41,954 68,521 1,796 6,736 196,408
425,231
Pharmacy 54,577 95,701 81,860 170,276 4,119 8,066 320,331
734,930
Chaplaincy 8,730 5,663 3,082 1,924 270 588 11,645
31,902
social workers 3,768 3,160 4,385 3,764 - - 2,770
17,847
Patients seen by doctors 17,171 34,144 32,437 68,311 527 2,496 23,700
178,786
Patients seen by screeners 28,153 45,415 72,554 186,645 10,654 7,849 260,460
611,730

40
Table 9.1 Mother and Child Health (MCH) FOR 2014 COMPARED TO 2013
ACTIVITY 2013 2014 % CHANGE
Antenatal Clinic 79,214 73,127 -7.7
Family Planning 9,989 10,798 8.1
Infant Welfare Clinic 53,581 47,930 -10.5
Preschool Clinic 5,506 6,888 25.1
Total 148,290 138,743 -6.4
There was an unexplained drop in ANC attendance in 2014. The drop in IWC is a logical consequence of the drop in ANC.
Table 9.2 Deliveries for 2014 compared to 2013
DELIVERIES 2013 2014 % CHANGE
Total delivery 10,412 10,158 -2.4
Live birth 10,156 9,876 -2.8
Pre-term 303 271 -10.6
NEOD 45 41 -8.9
BBA 67 80 19.4
SB 235 183 -22.1
AB 148 174 17.6
There was a decrease in deliveries following the drop in ANC attendance in table 9.1. There was a desired
decrease in the number of pre-term, neonatal deaths and still births but births before arrival and abortions
continued to increase.
Table 9.3 Abortions by category
SN INSTITUTION ABORTION
TOTAL SPONTANEOUS INDUCED CRIMINAL
1 BBH 8 0 0 8
2 MBH 40 7 4 51
3 BHM 13 0 4 17
4 BHB 6 0 0 6
5 MBHD 42 0 0 42
6 BANGOLAN 25 5 1 31
7 ALLAT 10 0 0 10
8 NYAMBOYA 17 0 1 18
TOTAL 161 12 10 183
% 88 7 5 100

41
Most of the abortions are spontaneous while similar proportions are induced or criminal. However some of
the abortions reported as spontaneous are based on information from the clients which may not be
accurate. Some clients are likely to have taken something before arrival to the facility and will not disclose.
Table 10 Immunization for 2014 compared with 2013
SN VACCINE 2013 2014 % CHANGE
1 MENINGITIS 931 1,052 13
2 BCG 10,535 11,040 4.8
3 DPT 26,267 26,115 -0.6
4 POLIO 36,627 37,186 1.5
5 TITANUS 22,019 21,366 -3
6 MEASLES 7,327 7,440 1.5
Figure 2 Immunization for 2014 compared to 2013
The trends for immunization were similar for both years with 2014 activities generally being more than
those of 2013
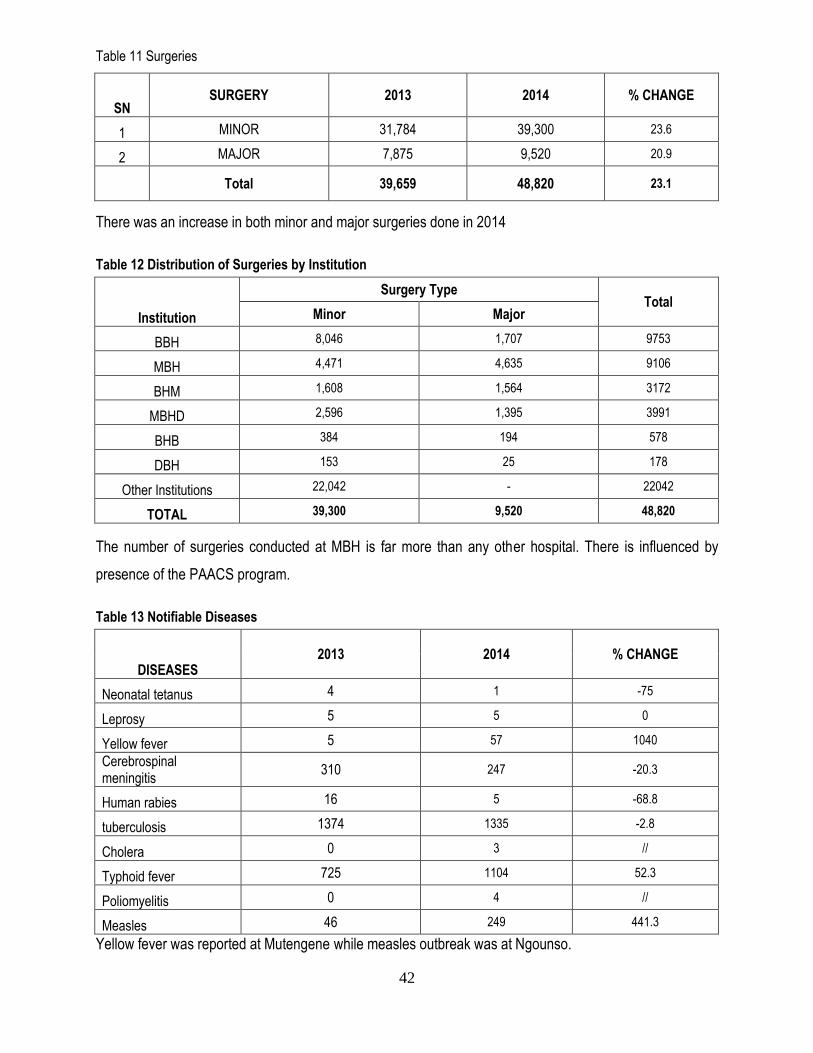
42
Table 11 Surgeries
SN SURGERY 2013 2014 % CHANGE
1 MINOR 31,784 39,300 23.6
2 MAJOR 7,875 9,520 20.9
Total 39,659 48,820 23.1
There was an increase in both minor and major surgeries done in 2014
Table 12 Distribution of Surgeries by Institution
Institution
Surgery Type Total
Minor Major
BBH 8,046 1,707 9753
MBH 4,471 4,635 9106
BHM 1,608 1,564 3172
MBHD 2,596 1,395 3991
BHB 384 194 578
DBH 153 25 178
Other Institutions 22,042 - 22042
TOTAL 39,300 9,520 48,820
The number of surgeries conducted at MBH is far more than any other hospital. There is influenced by
presence of the PAACS program.
Table 13 Notifiable Diseases
DISEASES 2013 2014 % CHANGE
Neonatal tetanus 4 1 -75
Leprosy 5 5 0
Yellow fever 5 57 1040
Cerebrospinal meningitis
310 247 -20.3
Human rabies 16 5 -68.8
tuberculosis 1374 1335 -2.8
Cholera 0 3 //
Typhoid fever 725 1104 52.3
Poliomyelitis 0 4 //
Measles 46 249 441.3
Yellow fever was reported at Mutengene while measles outbreak was at Ngounso.
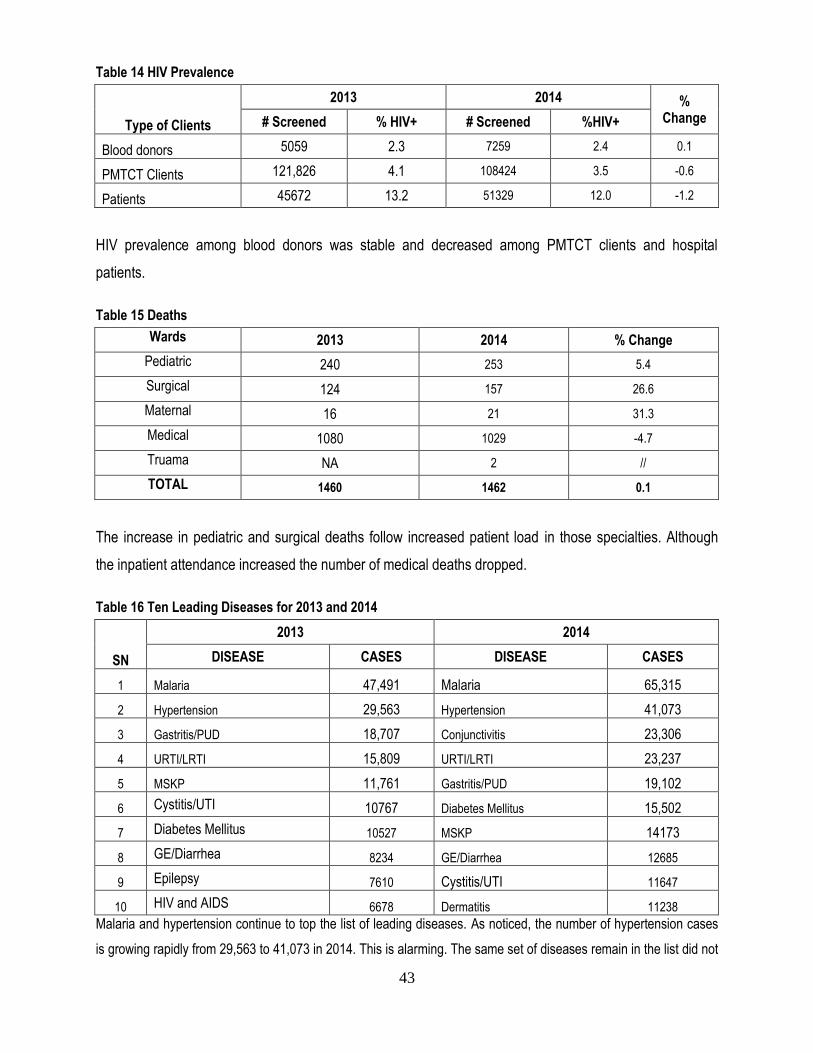
43
Table 14 HIV Prevalence
Type of Clients
2013 2014 % Change # Screened % HIV+ # Screened %HIV+
Blood donors 5059 2.3 7259 2.4 0.1
PMTCT Clients 121,826 4.1 108424 3.5 -0.6
Patients 45672 13.2 51329 12.0 -1.2
HIV prevalence among blood donors was stable and decreased among PMTCT clients and hospital
patients.
Table 15 Deaths
Wards 2013 2014 % Change
Pediatric 240 253 5.4
Surgical 124 157 26.6
Maternal 16 21 31.3
Medical 1080 1029 -4.7
Truama NA 2 //
TOTAL 1460 1462 0.1
The increase in pediatric and surgical deaths follow increased patient load in those specialties. Although
the inpatient attendance increased the number of medical deaths dropped.
Table 16 Ten Leading Diseases for 2013 and 2014
SN
2013 2014
DISEASE CASES DISEASE CASES
1 Malaria 47,491 Malaria 65,315
2 Hypertension 29,563 Hypertension 41,073
3 Gastritis/PUD 18,707 Conjunctivitis 23,306
4 URTI/LRTI 15,809 URTI/LRTI 23,237
5 MSKP 11,761 Gastritis/PUD 19,102
6 Cystitis/UTI 10767 Diabetes Mellitus 15,502
7 Diabetes Mellitus 10527 MSKP 14173
8 GE/Diarrhea 8234 GE/Diarrhea 12685
9 Epilepsy 7610 Cystitis/UTI 11647
10 HIV and AIDS 6678 Dermatitis 11238
Malaria and hypertension continue to top the list of leading diseases. As noticed, the number of hypertension cases
is growing rapidly from 29,563 to 41,073 in 2014. This is alarming. The same set of diseases remain in the list did not

44
change in 2014. Conjunctivitis and dermatitis were new in the list of ten leading disease in 2014, displacing epilepsy
and HIV
Table 17 Ten leading causes of death
SN
2013 2014
DISEASE CASES DISEASE CASES
1 AIDS 263 AIDS 148
2 Congestive Heart Failure (CHF) 108 Malaria 64
3 Meningitis 102 Congestive Heart Failure 62
4 Cancers/ Tumors 82 Meningitis 62
5 Septicaemia sepsis 75 Tuberculosis 55
6 Pneumonia 69 Cancers/ Tumors 45
7 Tuberculosis 55 Septicaemia 39
8 Malaria 40 Hypertension 38
9 Hepatitis/Cirrhosis 40 Pneumonia 37
10 Hypertension 35 Anaemias 35
Although reducing in magnitude AIDS continue to be on top of the list of leading killer diseases. In 2014, malaria
displaced CHF from the second position to the third. Hypertension displaced hepatitis from the list of ten leading killer
diseases this year.
Table 18 HIV Care and Treatment Program Work load
SN SITE 2014 GENERAL ENROLMENT
2014 ART INITIATION
CUMULATIVE ON ART
CURRENT ON ART
1 BBH 584 545 5,858 3,991
2 MBH 305 255 2,075 1281
3 BHM 778 472 4,155 3,445
4 NKWEN 508 403 5,814 4,575
5 MBOPPI 1006 730 5,429 4,112
TOTAL 3,181 2,405 23,331 17,404
Over the years, 23,331clients have been initiated on ART at the five CBCHS care and treatment centres and
currently, 17,404 of them are on treatment. About 50% of clients that dropped out of care were transferred to other
care and treatment centers, others died, some were lost to follow up and others were stopped for clinical reasons or
chose to stop it themselves

45
Table 19 Evolution of CBCHB PMTCT Activities Indicator
/ Year2000 2001 2002 2003 2004 2005 2006 2007 2008 2009 2010 2011 2012 2013 2014 TOTAL
Number of
sites5 9 58 89 115 180 250 374 391 427 403 453 742 772 772 772
Total # of
women
counseled
1,469 4,049 12,624 22,043 30,822 47,571 62,154 79,388 94,505 100,055 103,388 101,960 132,070 125,363 110,352 1,027,813
Total # of
women
tested
1,391 3,849 11,536 20,537 27,641 42,125 58,031 76,132 91,270 97,643 100,555 101,960 131,640 125,406 108,601 998,317
Total # of
women who
return for
results
1,343 3,841 11,422 20,229 27,063 40,344 57,312 75,015 89,531 97,137 99,970 99,651 129,956 124,389 108,560 985,763
Total # of
women
Positive
146 384 1,100 1,613 2,530 3,594 4,962 5,838 6,118 5,755 5,578 5,563 6,871 5,900 3,711 59,663
Total # of
women
treated
55 143 456 531 1,004 2,577 3,903 5,356 4,969 5,349 8,530 8,172 6,656 4,837 3,317 55,855
Total # of
infants
treated
55 145 434 548 913 1,411 2,203 2,551 3,124 3,554 3,912 3,728 5,297 4,898 4,007 36,780
% return for
results96.5 99.8 99 98.5 97.9 95.8 98.8 98.5 99 99.5 99.4 97.7 98.7 99.2 99.9622 98.7
% HIV
positive10.5 10 9.5 7.9 9.2 8.5 8.6 7.7 6.3 5.9 5.5 5.5 5.2 4.7 3.4171 6.0
% of women
treated37.7 37.2 41.5 32.9 39.7 71.7 78.7 77.4 88 92.9 73.9 70.2 96.9 82 89.3829 93.6
% of infants
treated37.7 37.8 39.5 34 36.1 39.3 44.4 43.7 54 61.8 70.1 67 77.1 83 94 61.6
% MTCT-
PCR- - - - 17.8 - - - - - 13.3 14.6 11.6 6.7 6.5
% MTCT-
Rapid Test- - - 7 11.3 26.5 38.9 20.5 20.9 19.4 17.7 34.9 NA NA NA
% of
partners HIV
+
- - - 25 - - - - 23.5 11.7 9.3 14 13.1 5.7 10.3
Table 20 CBCHS Tuberculosis activities
Indicators 2013 2014 % CHANGE
Total # of TB patients 1,282 1,208 -5.8
Number screened for AFB 6,858 7,090 3.4
Number of pulmonary TB 1,001 964 -3.7
Number of Smear Positive 868 888 2.3
Number of Smear Negative 134 85 -36.6
Number of Extra Pulmonary TB 281 236 -16
Number tested For HIV 1,267 1,204 -5
Acceptance rate 99 100 0.9
Number tested HIV+ 589 553 -6.1
% of Co-infection 47 46 -1.3
There was an increase in the number of patients screened for TB in 2014. The TB/HIV co-infection rate
decreased by 1.3%
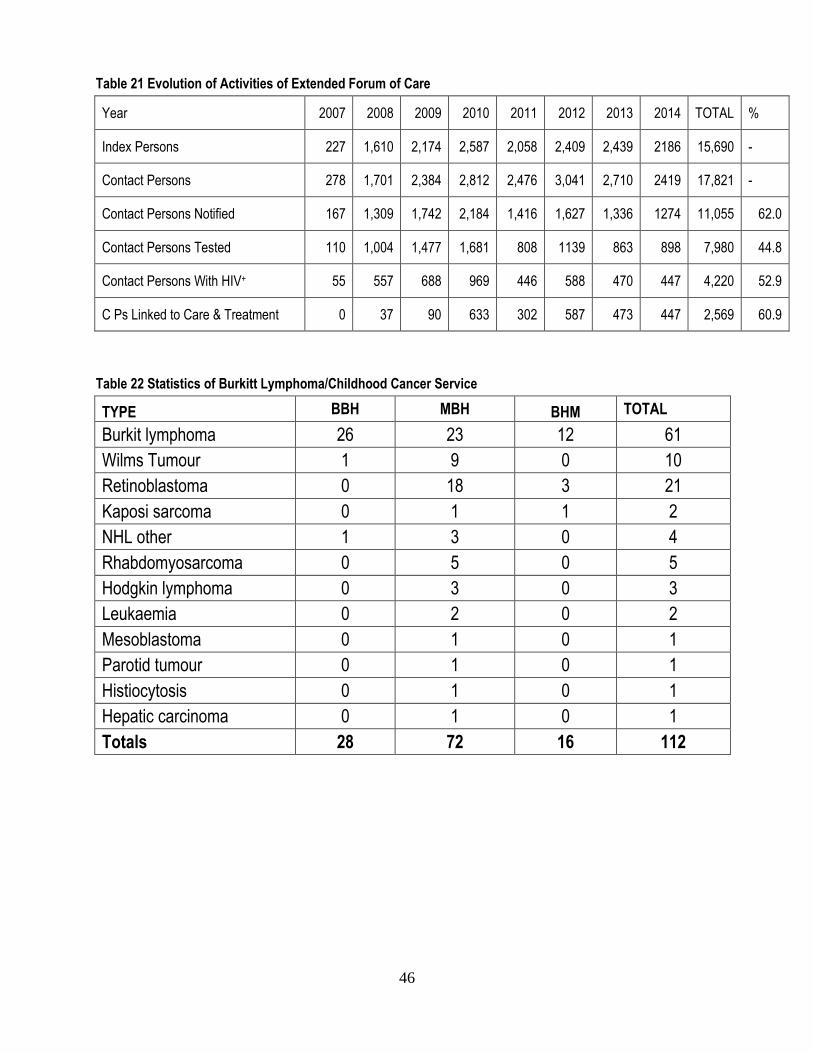
46
Table 21 Evolution of Activities of Extended Forum of Care
Year 2007 2008 2009 2010 2011 2012 2013 2014 TOTAL %
Index Persons 227 1,610 2,174 2,587 2,058 2,409 2,439 2186 15,690 -
Contact Persons 278 1,701 2,384 2,812 2,476 3,041 2,710 2419 17,821 -
Contact Persons Notified 167 1,309 1,742 2,184 1,416 1,627 1,336 1274 11,055 62.0
Contact Persons Tested 110 1,004 1,477 1,681 808 1139 863 898 7,980 44.8
Contact Persons With HIV+ 55 557 688 969 446 588 470 447 4,220 52.9
C Ps Linked to Care & Treatment 0 37 90 633 302 587 473 447 2,569 60.9
Table 22 Statistics of Burkitt Lymphoma/Childhood Cancer Service
TYPE BBH MBH BHM TOTAL
Burkit lymphoma 26 23 12 61
Wilms Tumour 1 9 0 10
Retinoblastoma 0 18 3 21
Kaposi sarcoma 0 1 1 2
NHL other 1 3 0 4
Rhabdomyosarcoma 0 5 0 5
Hodgkin lymphoma 0 3 0 3
Leukaemia 0 2 0 2
Mesoblastoma 0 1 0 1
Parotid tumour 0 1 0 1
Histiocytosis 0 1 0 1
Hepatic carcinoma 0 1 0 1
Totals 28 72 16 112

47
ANNEX – FIVE YEARS EVOLUTION OF CBCHS KEY ACTIVITIES
Annex 1- Five Year Evolution of Number of Beds and Staff
Annex 2 – Five Years Evolution of Outpatient Attendance

48
Annex 3- Five Years Evolution of Inpatients Attendance
Annex 4- Five Years Evolution of Pharmacy and Laboratory work load

49
Annex 5- Five Years Evolution of Department work load
Annex 6- Five Years Evolution of MCH Activities
Conclusion
We are thankful to God for the successes of 2014. All our staff worked happily delivering quality care to all with
compassion. We enjoy the support of many national and international partners without which we could not have
achieved all these results. We are very grateful. The Board is thankful to all the staff of CBCHS for their commitment
to its mission statement as evident in the successes recorded.

50
Appendix 1 – Bed Capacity and Staff Strength
BED CAPACITY
M F M F M F M F M F M F M F M F M F M F M/F M F M F M F M F M F M F M/F
1 ALLAT AD 9 3 3 0 15 0 0 2 2 3 0 0 0 0 0 1 1 0 0 5 1 0 0 10 4 14 0 0 1 1 2 1 1 0 1 0 6 2 8
2 BANYO AD 20 8 7 7 42 1 0 7 13 3 6 8 4 1 0 3 3 2 0 15 12 7 14 40 33 72 3 6 1 1 3 8 2 2 2 4 8 18 25
3 BANGOLAN NW 26 19 0 0 45 0 0 3 10 1 7 0 0 0 0 2 2 1 0 6 3 1 2 13 22 33 0 0 2 1 1 7 0 1 1 4 4 12 15
4 BBH NW 105 39 51 44 239 9 8 43 99 35 32 38 32 3 1 5 6 5 8 118 57 0 0 255 243 498 18 17 14 32 9 43 2 7 23 48 66 147 213
5 JIKIJEM NW 14 18 6 0 38 0 0 1 5 1 4 3 3 0 0 4 2 1 0 5 2 1 0 13 14 25 0 0 1 3 0 4 0 2 1 4 2 11 12
6 KOUHOUAT WE 15 4 8 0 27 0 0 3 2 2 3 1 1 0 0 1 2 0 1 5 3 4 3 11 12 23 0 1 1 3 2 0 0 1 2 3 5 6 11
7 LASSIN NW 11 8 5 0 19 0 0 2 3 1 4 2 0 0 0 1 1 0 0 2 2 2 1 9 9 17 0 0 2 0 0 2 0 0 1 2 2 4 6
8 MBEM NW 23 17 0 0 40 0 0 1 4 2 2 2 0 0 1 2 0 1 0 6 2 6 0 16 6 19 0 1 1 1 2 3 0 0 2 0 5 4 8
9 NDU NW 22 14 7 0 43 0 0 5 8 3 6 0 0 0 0 0 4 0 1 9 4 0 0 16 23 38 0 0 1 5 2 5 1 2 1 2 5 12 17
10 NGEPTANG NW 12 9 0 0 21 0 0 1 5 0 0 1 0 0 0 0 1 0 0 4 3 3 0 6 8 13 0 0 1 1 0 3 0 0 0 3 1 5 6
11 NGOUNSO WE 25 17 8 0 50 1 0 8 9 6 6 1 0 0 0 1 1 1 0 13 9 1 4 30 29 59 0 0 3 5 4 8 1 5 6 6 13 7 20
12 NYAMBOYA AD 17 6 6 0 29 0 0 1 1 2 6 1 1 0 0 1 1 0 0 3 1 1 1 9 11 19 0 0 0 0 2 3 1 1 1 4 4 8 10
13 ROMKONG NW 4 4 4 0 12 0 0 0 1 0 5 0 0 0 0 0 1 0 0 4 2 0 0 4 8 11 0 0 0 1 0 1 0 1 0 5 0 7 7
14 SARKI BARKA AD 7 5 7 0 19 0 0 4 1 0 2 3 1 0 0 1 0 4 0 4 4 1 1 10 6 14 0 0 1 3 3 0 1 0 0 2 5 5 7
15 NWAT NW 23 17 0 0 40 0 0 2 3 3 2 2 1 0 2 2 1 1 0 6 0 4 1 16 7 20 0 0 1 1 2 3 0 1 3 2 6 4 10
16 KOUSSAM WE 6 3 3 0 12 0 0 3 0 3 0 2 1 0 0 1 0 0 0 1 0 1 0 10 1 11 0 0 1 0 2 0 0 0 3 0 6 0 6
17 AKEH NW 4 5 4 0 13 0 0 1 0 4 3 0 0 0 0 0 1 0 0 2 2 0 0 7 6 12 0 0 1 0 0 1 0 0 4 3 5 4 8
18 BAFOUSSAM WE 0 0 0 0 0 0 1 1 8 2 5 8 3 0 0 2 0 1 0 7 12 0 0 21 29 50 0 0 0 0 0 0 0 0 0 0 0 0 0
19 BELO NW 12 29 14 0 55 0 0 3 8 0 0 0 0 0 0 0 1 0 0 6 3 0 0 9 12 21 0 0 1 0 0 1 0 1 2 8 3 10 13
20 FINKWI NW 8 8 4 0 20 0 0 1 2 1 2 0 0 0 0 1 1 0 0 3 3 0 2 6 10 16 0 0 3 0 0 3 0 1 1 3 4 7 11
21 KWIGHE NW 17 7 0 0 24 0 0 3 0 0 4 0 0 0 0 1 1 0 0 3 3 1 0 7 8 13 1 0 0 0 1 9 0 0 0 2 2 11 13
22 ASHONG NW 11 4 0 0 15 0 0 2 3 1 2 0 0 0 0 0 1 0 1 2 2 1 1 6 10 16 0 1 1 1 1 1 0 0 1 2 3 5 8
23 MBH NW 181 22 26 65 294 12 8 47 99 30 58 36 37 2 1 10 38 6 5 150 140 28 4 320 389 709 9 14 25 30 43 65 3 10 21 32 101 151 252
24 NKWEN NW 0 0 0 0 0 1 2 5 20 3 26 6 7 0 1 1 9 1 1 21 19 0 0 37 85 122 1 1 0 5 0 3 0 4 0 7 1 20 21
25 SABGA NW 10 4 5 0 19 0 0 4 1 1 2 0 0 0 0 0 0 0 2 5 4 0 0 9 9 17 0 0 1 0 2 1 0 1 0 2 3 3 6
26 BAYANGAM WE 7 3 0 0 10 0 0 1 0 0 2 2 0 0 0 0 1 0 0 2 3 0 0 5 6 11 1 0 1 0 0 1 0 0 0 1 1 2 3
27 NDEBAYA SW 8 7 0 0 15 0 0 1 1 2 0 0 0 0 0 1 1 0 0 1 1 0 1 5 4 8 0 0 1 0 0 1 0 0 0 0 1 1 2
28 EKOUNOU CE 0 0 0 0 0 0 0 3 8 2 3 3 4 0 0 1 4 1 0 13 5 0 2 22 25 47 0 0 1 2 0 4 0 1 2 2 3 7 9
29 ETOUGEBE CE 0 0 0 0 0 0 5 4 20 9 11 12 13 1 2 2 10 0 1 20 11 1 2 49 75 124 2 8 1 4 1 8 1 2 0 2 5 24 29
30 KUMBA SW 7 12 0 0 19 0 1 5 16 5 6 5 8 0 0 2 6 1 1 12 17 0 1 27 53 80 1 2 2 2 1 8 0 2 1 2 5 16 21
31 MBOPPI LT 0 47 14 23 84 7 6 32 63 10 8 25 33 1 1 8 21 1 3 28 29 30 5 142 169 311 6 15 6 9 4 18 6 6 0 0 22 48 70
32 VOUDOU CE 3 3 0 0 6 0 0 0 1 0 1 2 0 0 0 1 1 0 0 3 3 0 0 6 6 12 0 0 0 1 0 2 0 0 3 3 3 6 9
33 MUTENGENE SW 46 21 10 20 97 10 4 29 82 11 20 17 27 2 1 7 2 4 3 17 9 14 12 103 157 260 5 14 10 9 9 33 2 11 4 20 29 82 111
34 EKONDO TITI SW 6 4 0 0 10 0 0 1 2 1 0 4 0 0 0 1 0 0 0 2 2 0 0 9 4 13 0 0 1 0 1 1 0 1 1 0 3 2 5
TOTA
L M
ALE
S
TOTA
L FE
MA
LES
GR
AN
D T
OTA
L
GR
AN
D T
OTA
L
NP
/BS
N/R
SN
Bre
vete
/AP
NA
Nur
se A
ssis
tant
/ Nur
sing
Aux
iliar
y
Nur
se M
idw
ife/ M
idw
ife
War
d A
uxili
ary
AD
M. S
TAFF
CH
AP
LAIN
S
OTH
ER
SU
PP
OR
T S
TAFF
CA
SU
AL
TOTA
L M
ALE
S
TOTA
L FE
MA
LES
TOTA
L
DR
S
TRA
INE
D N
UR
SE
S
AU
XIL
IAR
Y
TRA
INE
D P
AR
A M
ED
.
AD
MIN
ISTR
ATO
RS
SE
RIA
L #
INS
TIT
UT
ION
/ M
ON
TH
Reg
ion
GE
NE
RA
L
MA
TER
NIT
Y
PE
DIA
TRIC
SU
RG
ICA
L
IDENTIFICATION PERSONNEL NURSES

51
Appendix 2- Outpatient attendance
Male
Fem
ale
To
tal
Male
Fem
ale
To
tal
Male
Fem
ale
To
tal
Male
Fem
ale
To
tal
Male
Fem
ale
To
tal
1 ALLAT AD 95 85 180 213 177 390 168 132 300 447 980 1427 191 198 389 2686
2 BANYO AD 235 169 401 364 243 607 364 373 737 2014 3809 5823 1347 770 2117 9685
3 BANGOLAN NW 174 180 327 270 235 505 276 342 618 1191 5341 6532 1191 1846 3037 11019
4 BBH NW 1244 1314 2558 1806 1599 3405 3261 3185 6446 18084 32911 50995 15024 15526 30550 93954
5 JIKIJEM NW 238 202 440 236 284 520 536 642 1178 1720 3128 4848 644 747 1391 8377
6 KOUHOUAT WE 82 74 156 270 193 463 201 319 520 952 1308 2260 922 845 1767 5166
7 LASSIN NW 96 88 184 258 201 459 2265 200 380 407 1170 1589 414 651 1100 3457
8 MBEM NW 201 167 368 108 109 217 155 181 336 585 1439 2024 720 986 1706 4651
9 NDU NW 221 328 549 654 505 1159 479 463 942 2077 4586 6663 2536 3704 6240 15553
10 NGEPTANG NW 49 29 78 102 108 210 130 149 279 367 1156 1523 319 533 852 2942
11 NGOUNSO WE 281 230 511 710 656 1366 441 531 972 1530 4817 6347 1035 996 2031 11227
12 NYAMBOYA AD 136 96 232 276 242 518 197 286 483 786 1569 2355 225 233 458 4046
13 ROMKONG NW 46 34 67 96 78 174 80 53 133 330 863 1095 226 497 723 2305
14 SARKI BARKA AD 120 136 256 284 292 576 219 270 489 389 1155 1544 235 207 442 3307
15 NWAT NW 79 80 159 274 254 528 199 175 374 823 1709 2532 445 722 1167 4760
16 KOUSSAM WE 60 32 94 154 93 247 88 86 174 298 792 1090 302 449 751 2356
17 AKEH NW 47 56 103 95 102 197 142 132 274 284 778 1062 232 387 619 2255
18 BAFOUSSAM WE 382 362 744 1304 1195 2499 1303 1669 3360 4608 10182 14790 4760 7246 12006 33399
19 BELO NW 245 191 436 309 181 577 347 334 681 1370 1795 3165 1329 1399 2728 7587
20 FINKWI NW 148 141 289 247 217 464 238 255 493 1379 2986 4365 835 1564 2399 8010
21 KWIGHE NW 63 34 97 126 118 244 147 165 312 395 1594 1989 269 640 909 3551
22 ASHONG NW 100 76 176 187 176 363 354 278 632 908 1534 2442 593 896 1489 5102
23 MBH NW 844 792 1636 1839 1147 2986 2998 2323 5321 14482 20291 34773 14490 20447 34937 79653
24 NKWEN NW 3288 3563 6851 5615 5630 11245 6280 9520 15800 20487 24091 44578 9915 11449 21364 99838
25 SABGA NW 67 83 150 127 165 280 149 220 357 805 1362 2167 445 916 1361 4315
26 BAYANGAM WE 50 28 78 131 99 230 145 157 302 411 712 1123 644 905 1549 3282
27 NDEBAYA SW 45 33 78 165 110 275 61 72 136 447 525 916 184 197 364 1769
28 EKOUNOU CE 861 823 1684 2293 1943 3990 1691 2001 3813 5605 8970 14575 3092 3850 6942 31004
29 ETOUGEBE CE 3599 2607 6206 5654 4630 10284 4419 4461 8880 21323 47276 68599 8234 12051 20285 114254
30 KUMBA SW 1889 1731 3620 4013 3749 7762 2758 3083 5841 8354 14861 23215 1388 1818 3206 43644
31 MBOPPI LT 7697 7959 15656 8619 8098 16717 5902 7582 13484 36887 108862 145749 24524 38826 63350 254956
32 VOUDOU CE 262 255 517 688 540 1228 212 251 463 967 2544 3511 174 184 358 6077
33 MUTENGENE SW 1826 2015 3841 3406 3299 6705 3734 4475 8209 21738 39395 61133 13498 18241 31739 111627
34 EKONDO TITI SW 71 46 117 198 181 379 80 117 197 345 469 814 119 187 306 1813
<1 1 to 5 6 to 15 16 to 45 45+
G.T
ot
(M&
F)
OUTPATIENT
SE
RIA
L #
INS
TIT
UT
ION
/ M
ON
TH
Reg
ion
IDENTIFICATION ATTENDANCE
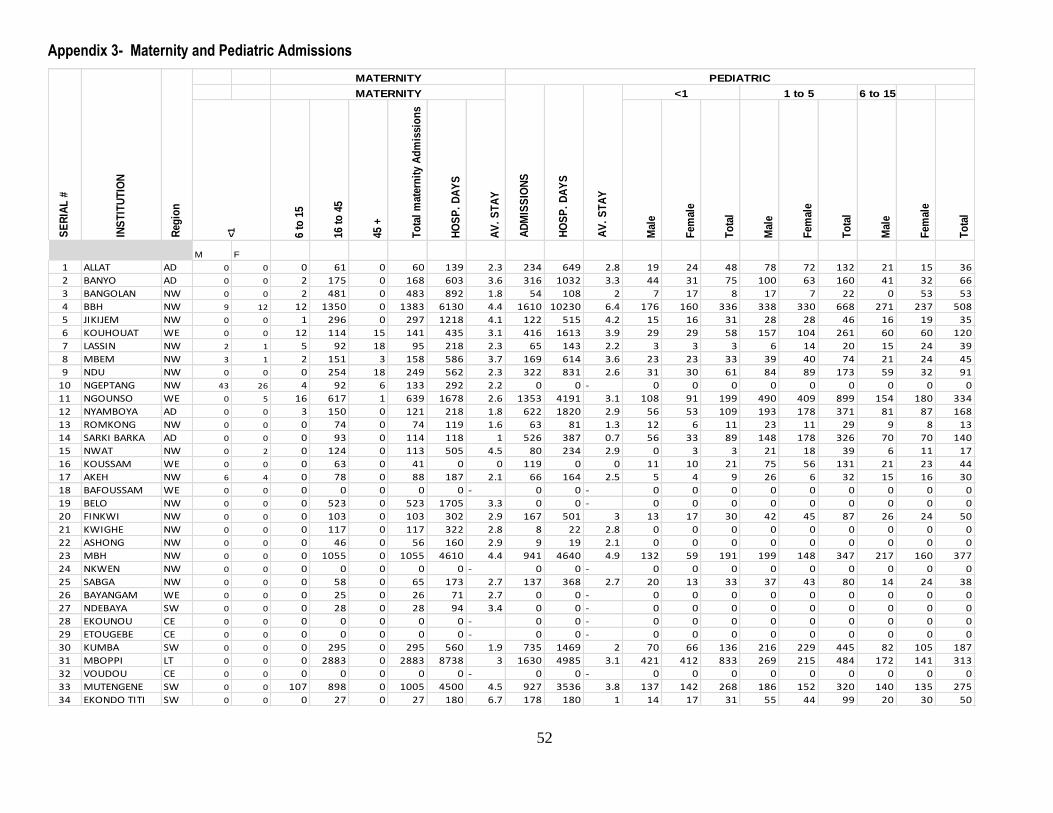
52
Appendix 3- Maternity and Pediatric Admissions
6 to 15
6 to
15
16 t
o 4
5
45 +
To
tal
mat
ern
ity
Ad
mis
sio
ns
HO
SP
. D
AY
S
AV
. S
TA
Y
Mal
e
Fem
ale
To
tal
Mal
e
Fem
ale
To
tal
Mal
e
Fem
ale
To
tal
M F
1 ALLAT AD 0 0 0 61 0 60 139 2.3 234 649 2.8 19 24 48 78 72 132 21 15 36
2 BANYO AD 0 0 2 175 0 168 603 3.6 316 1032 3.3 44 31 75 100 63 160 41 32 66
3 BANGOLAN NW 0 0 2 481 0 483 892 1.8 54 108 2 7 17 8 17 7 22 0 53 53
4 BBH NW 9 12 12 1350 0 1383 6130 4.4 1610 10230 6.4 176 160 336 338 330 668 271 237 508
5 JIKIJEM NW 0 0 1 296 0 297 1218 4.1 122 515 4.2 15 16 31 28 28 46 16 19 35
6 KOUHOUAT WE 0 0 12 114 15 141 435 3.1 416 1613 3.9 29 29 58 157 104 261 60 60 120
7 LASSIN NW 2 1 5 92 18 95 218 2.3 65 143 2.2 3 3 3 6 14 20 15 24 39
8 MBEM NW 3 1 2 151 3 158 586 3.7 169 614 3.6 23 23 33 39 40 74 21 24 45
9 NDU NW 0 0 0 254 18 249 562 2.3 322 831 2.6 31 30 61 84 89 173 59 32 91
10 NGEPTANG NW 43 26 4 92 6 133 292 2.2 0 0 - 0 0 0 0 0 0 0 0 0
11 NGOUNSO WE 0 5 16 617 1 639 1678 2.6 1353 4191 3.1 108 91 199 490 409 899 154 180 334
12 NYAMBOYA AD 0 0 3 150 0 121 218 1.8 622 1820 2.9 56 53 109 193 178 371 81 87 168
13 ROMKONG NW 0 0 0 74 0 74 119 1.6 63 81 1.3 12 6 11 23 11 29 9 8 13
14 SARKI BARKA AD 0 0 0 93 0 114 118 1 526 387 0.7 56 33 89 148 178 326 70 70 140
15 NWAT NW 0 2 0 124 0 113 505 4.5 80 234 2.9 0 3 3 21 18 39 6 11 17
16 KOUSSAM WE 0 0 0 63 0 41 0 0 119 0 0 11 10 21 75 56 131 21 23 44
17 AKEH NW 6 4 0 78 0 88 187 2.1 66 164 2.5 5 4 9 26 6 32 15 16 30
18 BAFOUSSAM WE 0 0 0 0 0 0 0 - 0 0 - 0 0 0 0 0 0 0 0 0
19 BELO NW 0 0 0 523 0 523 1705 3.3 0 0 - 0 0 0 0 0 0 0 0 0
20 FINKWI NW 0 0 0 103 0 103 302 2.9 167 501 3 13 17 30 42 45 87 26 24 50
21 KWIGHE NW 0 0 0 117 0 117 322 2.8 8 22 2.8 0 0 0 0 0 0 0 0 0
22 ASHONG NW 0 0 0 46 0 56 160 2.9 9 19 2.1 0 0 0 0 0 0 0 0 0
23 MBH NW 0 0 0 1055 0 1055 4610 4.4 941 4640 4.9 132 59 191 199 148 347 217 160 377
24 NKWEN NW 0 0 0 0 0 0 0 - 0 0 - 0 0 0 0 0 0 0 0 0
25 SABGA NW 0 0 0 58 0 65 173 2.7 137 368 2.7 20 13 33 37 43 80 14 24 38
26 BAYANGAM WE 0 0 0 25 0 26 71 2.7 0 0 - 0 0 0 0 0 0 0 0 0
27 NDEBAYA SW 0 0 0 28 0 28 94 3.4 0 0 - 0 0 0 0 0 0 0 0 0
28 EKOUNOU CE 0 0 0 0 0 0 0 - 0 0 - 0 0 0 0 0 0 0 0 0
29 ETOUGEBE CE 0 0 0 0 0 0 0 - 0 0 - 0 0 0 0 0 0 0 0 0
30 KUMBA SW 0 0 0 295 0 295 560 1.9 735 1469 2 70 66 136 216 229 445 82 105 187
31 MBOPPI LT 0 0 0 2883 0 2883 8738 3 1630 4985 3.1 421 412 833 269 215 484 172 141 313
32 VOUDOU CE 0 0 0 0 0 0 0 - 0 0 - 0 0 0 0 0 0 0 0 0
33 MUTENGENE SW 0 0 107 898 0 1005 4500 4.5 927 3536 3.8 137 142 268 186 152 320 140 135 275
34 EKONDO TITI SW 0 0 0 27 0 27 180 6.7 178 180 1 14 17 31 55 44 99 20 30 50
<1Reg
ion
INS
TIT
UT
ION
SE
RIA
L #
MATERNITY
AD
MIS
SIO
NS
HO
SP
. D
AY
S
AV
. S
TA
Y
<1
MATERNITY PEDIATRIC
1 to 5
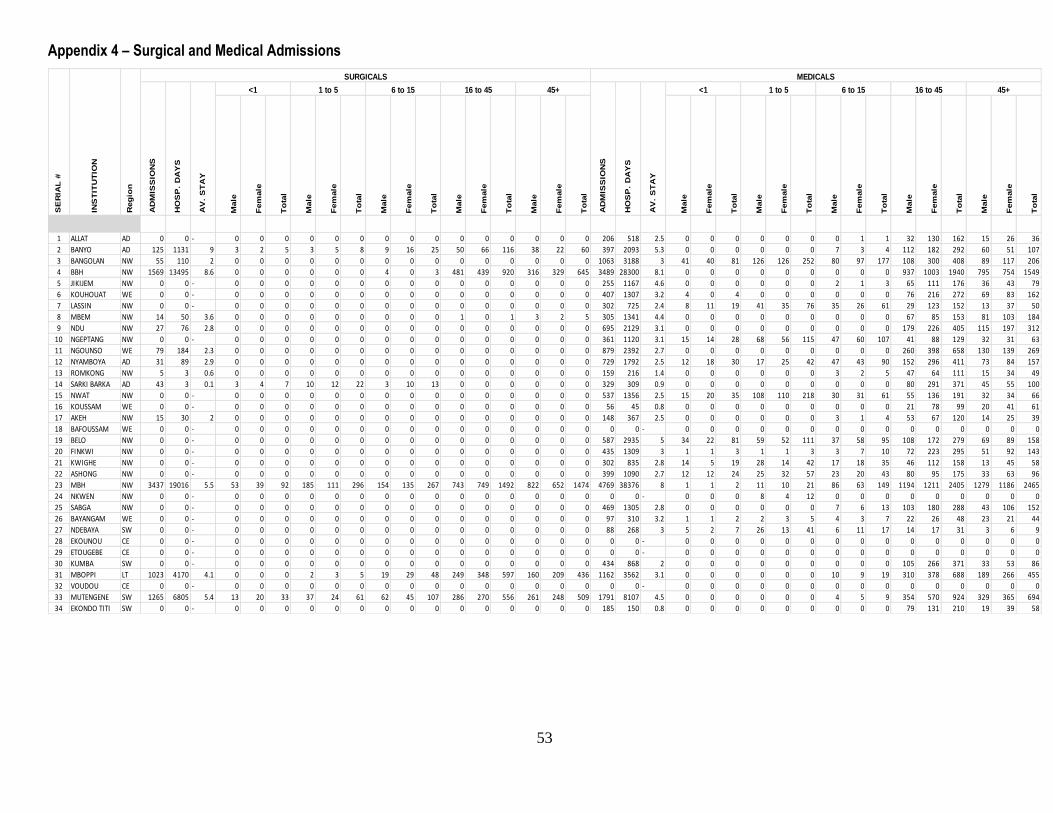
53
Appendix 4 – Surgical and Medical Admissions
Male
Fem
ale
To
tal
Male
Fem
ale
To
tal
Male
Fem
ale
To
tal
Male
Fem
ale
To
tal
Male
Fem
ale
To
tal
Male
Fem
ale
To
tal
Male
Fem
ale
To
tal
Male
Fem
ale
To
tal
Male
Fem
ale
To
tal
Male
Fem
ale
To
tal
1 ALLAT AD 0 0 - 0 0 0 0 0 0 0 0 0 0 0 0 0 0 0 206 518 2.5 0 0 0 0 0 0 0 1 1 32 130 162 15 26 36
2 BANYO AD 125 1131 9 3 2 5 3 5 8 9 16 25 50 66 116 38 22 60 397 2093 5.3 0 0 0 0 0 0 7 3 4 112 182 292 60 51 107
3 BANGOLAN NW 55 110 2 0 0 0 0 0 0 0 0 0 0 0 0 0 0 0 1063 3188 3 41 40 81 126 126 252 80 97 177 108 300 408 89 117 206
4 BBH NW 1569 13495 8.6 0 0 0 0 0 0 4 0 3 481 439 920 316 329 645 3489 28300 8.1 0 0 0 0 0 0 0 0 0 937 1003 1940 795 754 1549
5 JIKIJEM NW 0 0 - 0 0 0 0 0 0 0 0 0 0 0 0 0 0 0 255 1167 4.6 0 0 0 0 0 0 2 1 3 65 111 176 36 43 79
6 KOUHOUAT WE 0 0 - 0 0 0 0 0 0 0 0 0 0 0 0 0 0 0 407 1307 3.2 4 0 4 0 0 0 0 0 0 76 216 272 69 83 162
7 LASSIN NW 0 0 - 0 0 0 0 0 0 0 0 0 0 0 0 0 0 0 302 725 2.4 8 11 19 41 35 76 35 26 61 29 123 152 13 37 50
8 MBEM NW 14 50 3.6 0 0 0 0 0 0 0 0 0 1 0 1 3 2 5 305 1341 4.4 0 0 0 0 0 0 0 0 0 67 85 153 81 103 184
9 NDU NW 27 76 2.8 0 0 0 0 0 0 0 0 0 0 0 0 0 0 0 695 2129 3.1 0 0 0 0 0 0 0 0 0 179 226 405 115 197 312
10 NGEPTANG NW 0 0 - 0 0 0 0 0 0 0 0 0 0 0 0 0 0 0 361 1120 3.1 15 14 28 68 56 115 47 60 107 41 88 129 32 31 63
11 NGOUNSO WE 79 184 2.3 0 0 0 0 0 0 0 0 0 0 0 0 0 0 0 879 2392 2.7 0 0 0 0 0 0 0 0 0 260 398 658 130 139 269
12 NYAMBOYA AD 31 89 2.9 0 0 0 0 0 0 0 0 0 0 0 0 0 0 0 729 1792 2.5 12 18 30 17 25 42 47 43 90 152 296 411 73 84 157
13 ROMKONG NW 5 3 0.6 0 0 0 0 0 0 0 0 0 0 0 0 0 0 0 159 216 1.4 0 0 0 0 0 0 3 2 5 47 64 111 15 34 49
14 SARKI BARKA AD 43 3 0.1 3 4 7 10 12 22 3 10 13 0 0 0 0 0 0 329 309 0.9 0 0 0 0 0 0 0 0 0 80 291 371 45 55 100
15 NWAT NW 0 0 - 0 0 0 0 0 0 0 0 0 0 0 0 0 0 0 537 1356 2.5 15 20 35 108 110 218 30 31 61 55 136 191 32 34 66
16 KOUSSAM WE 0 0 - 0 0 0 0 0 0 0 0 0 0 0 0 0 0 0 56 45 0.8 0 0 0 0 0 0 0 0 0 21 78 99 20 41 61
17 AKEH NW 15 30 2 0 0 0 0 0 0 0 0 0 0 0 0 0 0 0 148 367 2.5 0 0 0 0 0 0 3 1 4 53 67 120 14 25 39
18 BAFOUSSAM WE 0 0 - 0 0 0 0 0 0 0 0 0 0 0 0 0 0 0 0 0 - 0 0 0 0 0 0 0 0 0 0 0 0 0 0 0
19 BELO NW 0 0 - 0 0 0 0 0 0 0 0 0 0 0 0 0 0 0 587 2935 5 34 22 81 59 52 111 37 58 95 108 172 279 69 89 158
20 FINKWI NW 0 0 - 0 0 0 0 0 0 0 0 0 0 0 0 0 0 0 435 1309 3 1 1 3 1 1 3 3 7 10 72 223 295 51 92 143
21 KWIGHE NW 0 0 - 0 0 0 0 0 0 0 0 0 0 0 0 0 0 0 302 835 2.8 14 5 19 28 14 42 17 18 35 46 112 158 13 45 58
22 ASHONG NW 0 0 - 0 0 0 0 0 0 0 0 0 0 0 0 0 0 0 399 1090 2.7 12 12 24 25 32 57 23 20 43 80 95 175 33 63 96
23 MBH NW 3437 19016 5.5 53 39 92 185 111 296 154 135 267 743 749 1492 822 652 1474 4769 38376 8 1 1 2 11 10 21 86 63 149 1194 1211 2405 1279 1186 2465
24 NKWEN NW 0 0 - 0 0 0 0 0 0 0 0 0 0 0 0 0 0 0 0 0 - 0 0 0 8 4 12 0 0 0 0 0 0 0 0 0
25 SABGA NW 0 0 - 0 0 0 0 0 0 0 0 0 0 0 0 0 0 0 469 1305 2.8 0 0 0 0 0 0 7 6 13 103 180 288 43 106 152
26 BAYANGAM WE 0 0 - 0 0 0 0 0 0 0 0 0 0 0 0 0 0 0 97 310 3.2 1 1 2 2 3 5 4 3 7 22 26 48 23 21 44
27 NDEBAYA SW 0 0 - 0 0 0 0 0 0 0 0 0 0 0 0 0 0 0 88 268 3 5 2 7 26 13 41 6 11 17 14 17 31 3 6 9
28 EKOUNOU CE 0 0 - 0 0 0 0 0 0 0 0 0 0 0 0 0 0 0 0 0 - 0 0 0 0 0 0 0 0 0 0 0 0 0 0 0
29 ETOUGEBE CE 0 0 - 0 0 0 0 0 0 0 0 0 0 0 0 0 0 0 0 0 - 0 0 0 0 0 0 0 0 0 0 0 0 0 0 0
30 KUMBA SW 0 0 - 0 0 0 0 0 0 0 0 0 0 0 0 0 0 0 434 868 2 0 0 0 0 0 0 0 0 0 105 266 371 33 53 86
31 MBOPPI LT 1023 4170 4.1 0 0 0 2 3 5 19 29 48 249 348 597 160 209 436 1162 3562 3.1 0 0 0 0 0 0 10 9 19 310 378 688 189 266 455
32 VOUDOU CE 0 0 - 0 0 0 0 0 0 0 0 0 0 0 0 0 0 0 0 0 - 0 0 0 0 0 0 0 0 0 0 0 0 0 0 0
33 MUTENGENE SW 1265 6805 5.4 13 20 33 37 24 61 62 45 107 286 270 556 261 248 509 1791 8107 4.5 0 0 0 0 0 0 4 5 9 354 570 924 329 365 694
34 EKONDO TITI SW 0 0 - 0 0 0 0 0 0 0 0 0 0 0 0 0 0 0 185 150 0.8 0 0 0 0 0 0 0 0 0 79 131 210 19 39 58
Reg
ion
INS
TIT
UT
ION
SE
RIA
L #
6 to 15 16 to 45 45+45+
AD
MIS
SIO
NS
HO
SP
. D
AY
S
AV
. S
TA
Y
<1 1 to 5
HO
SP
. D
AY
S
AV
. S
TA
Y
<1 1 to 5 6 to 15 16 to 45
SURGICALS MEDICALS
AD
MIS
SIO
NS

54
Appendix 5- Departments and Referrals
COUNTER REFERALS
NU
TR
ITIO
N
1 ALLAT AD 0 0 0 0 0 1722 2514 0 0 2362 0 0 0 0 2 1 21 23 0 0 0 1 0
2 BANYO AD 587 881 199 1305 643 6736 8066 588 2496 7849 0 0 0 2 0 0 16 22 0 0 0 1 0
3 BANGOLAN NW 37 0 0 0 0 6942 7696 1386 166 10879 0 425 0 33 5 0 56 67 0 1 0 0 0
4 BBH NW 11598 4700 6991 7930 5260 51996 54577 8730 17171 28153 3768 2577 1974 0 0 0 0 0 0 0 0 0 0
5 JIKIJEM NW 915 0 0 0 0 3019 5274 450 361 5913 0 0 0 39 28 0 52 45 0 0 0 0 8
6 KOUHOUAT WE 55 0 0 0 2 3766 5162 210 264 4130 0 0 84 14 4 0 66 54 3 0 0 5 7
7 LASSIN NW 58 0 0 0 0 2225 2970 0 119 3415 0 3 0 0 2 1 24 38 0 0 0 1 2
8 MBEM NW 137 0 0 0 0 1796 4119 270 527 10654 0 80 0 0 2 0 7 10 0 1 0 0 0
9 NDU NW 1542 0 0 0 0 5929 10908 922 371 8769 0 6 0 19 23 2 72 183 0 0 0 0 0
10 NGEPTANG NW 0 0 0 0 0 1742 2583 0 66 2241 0 7 0 3 7 0 18 6 0 0 0 0 0
11 NGOUNSO WE 0 0 0 0 0 8978 9371 1033 449 10670 0 348 0 7 12 2 54 31 0 0 1 0 0
12 NYAMBOYA AD 0 0 0 0 0 1902 3399 0 0 2845 0 0 0 6 12 1 57 46 24 45 68 15 27
13 ROMKONG NW 0 0 0 0 0 868 1697 0 0 2156 0 9 0 1 2 0 0 9 0 7 0 12 2
14 SARKI BARKA AD 0 0 0 0 0 2076 3137 0 0 3415 0 0 0 2 11 0 15 5 0 0 0 0 0
15 NWAT NW 0 0 0 0 0 2537 3460 40 222 3866 0 0 57 7 1 1 19 48 0 0 0 0 0
16 KOUSSAM WE 0 0 0 0 0 1503 1939 0 0 2354 0 0 0 8 2 0 17 43 2 0 0 0 2
17 AKEH NW 22 0 0 0 0 943 2593 7 73 2033 0 5 0 1 3 2 2 3 0 0 0 0 0
18 BAFOUSSAM WE 8376 0 2813 200 1634 15953 28280 588 280 20221 1 353 0 0 0 0 0 0 0 0 0 0 0
19 BELO NW 0 0 0 0 0 5893 7796 0 93 7578 0 1 0 0 4 0 14 60 0 0 0 0 0
20 FINKWI NW 0 0 0 0 0 4307 5918 0 0 7970 0 0 0 4 2 1 15 132 2 1 0 11 29
21 KWIGHE NW 0 0 0 0 0 1827 2188 0 0 3444 0 0 0 0 1 0 19 15 0 0 0 2 1
22 ASHONG NW 0 0 0 0 0 2657 4288 505 0 4183 0 0 0 0 0 0 5 1 0 0 0 2 0
23 MBH NW 14284 10711 11037 12276 2273 57820 95701 5663 34144 45415 3160 1880 1652 0 0 0 3 3 0 0 0 0 0
24 NKWEN NW 12424 0 3489 1576 8785 25364 55608 3277 2029 47954 1492 1104 1442 0 0 0 0 0 0 0 0 0 0
25 SABGA NW 184 0 0 0 0 2759 4463 493 272 1992 0 33 0 0 0 0 12 0 0 0 0 0 0
26 BAYANGAM WE 61 0 0 0 0 936 2518 4 356 3067 3 4 0 0 0 0 7 78 0 0 0 0 9
27 NDEBAYA SW 31 0 0 0 0 1149 1591 0 0 1965 0 11 0 1 1 0 4 12 2 0 0 0 5
28 EKOUNOU CE 3764 0 1396 0 2595 15197 24864 720 1040 17312 0 326 0 54 0 0 5 79 35 0 0 0 20
29 ETOUGEBE CE 14514 0 3686 3440 9834 42619 73415 919 15591 42434 928 713 1084 110 0 0 0 162 0 0 0 0 4
30 KUMBA SW 2927 0 718 470 1996 25784 34502 1087 1843 28632 346 634 181 0 0 0 94 627 0 1 0 38 194
31 MBOPPI LT 26080 0 10599 10010 6446 68521 170276 1924 68311 186645 3764 24946 2032 0 0 1 5 0 0 0 0 1 0
32 VOUDOU CE 0 0 0 0 0 2347 5457 0 46 1057 0 674 0 3 5 0 0 57 0 0 0 0 0
33 MUTENGENE SW 11928 3813 2839 5050 3759 41954 81860 3082 32437 72554 4385 902 831 0 0 0 17 0 0 0 0 0 0
34 EKONDO TITI SW 131 0 0 0 0 1537 2116 0 59 1970 0 0 76 0 3 0 0 23 0 0 0 0 0
Reg
ion
INS
TIT
UT
ION
SE
RIA
L #
LA
BO
UR
NE
ON
AT
ES
INP
TS
OU
TP
TS
AN
TE
NA
TA
LS
LA
BO
UR
NE
ON
AT
ES
INP
TS
OU
TP
TS
AN
TE
NA
TA
LS
PH
AR
MA
CY
CH
AP
LA
INC
Y
PA
TIE
NT
SE
EN
BY
DR
S
PA
TIE
NT
SE
EN
BY
SC
RE
EN
ER
PA
TIE
NT
S S
EE
N B
Y S
OC
IAL
WO
RK
ER
CE
RV
ICA
L C
AN
CE
R S
CR
EE
NIN
G
EY
E
X -
RA
Y
P T
UT
RA
- S
OU
ND
DE
NT
AL
LA
BO
RA
TO
RY
REFERALS

55
Appendix 6 – MCH
1 ALLAT AD 133 151 284 213 316 529 156 252 408 53 10 63 58 53 5 2 2 4 16
2 BANYO AD 198 779 977 116 192 308 10 59 69 27 49 76 187 171 4 3 2 12 5
3 BANGOLAN NW 532 1690 2222 535 1650 2185 24 97 121 277 43 320 502 477 11 0 0 4 29
4 BBH NW 880 3498 4347 533 996 1555 393 1673 2090 637 535 1172 1377 1344 48 3 19 33 20
5 JIKIJEM NW 396 1867 2263 352 2389 2741 15 7 22 125 204 329 304 298 5 2 9 0 0
6 KOUHOUAT WE 274 984 1258 178 304 482 47 39 86 40 41 81 152 143 1 0 1 0 0
7 LASSIN NW 145 424 569 359 794 1153 5 48 53 22 44 66 94 93 0 0 3 0 1
8 MBEM NW 352 543 895 239 404 643 0 0 0 36 63 99 158 158 0 0 2 0 0
9 NDU NW 290 1509 1799 197 1882 2079 0 0 0 66 80 146 271 267 0 0 5 4 4
10 NGEPTANG NW 136 352 488 127 152 279 56 79 135 27 20 47 102 99 1 0 2 1 4
11 NGOUNSO WE 613 1349 1962 218 299 517 0 0 0 50 98 148 307 293 10 2 6 5 2
12 NYAMBOYA AD 356 514 870 255 770 1025 0 0 0 18 18 36 156 155 0 0 0 3 17
13 ROMKONG NW 77 315 392 25 506 531 17 143 154 21 51 72 72 70 0 1 1 2 0
14 SARKI BARKA AD 167 352 519 2 3 5 0 0 0 6 5 11 105 104 2 0 0 0 2
15 NWAT NW 176 385 561 102 218 320 30 43 67 21 9 30 108 131 2 0 3 2 2
16 KOUSSAM WE 89 239 328 14 32 46 80 217 297 6 10 16 57 55 0 0 1 2 1
17 AKEH NW 94 212 306 121 668 789 0 0 0 26 29 55 84 80 2 1 1 4 0
18 BAFOUSSAM WE 544 1678 2222 78 677 755 40 329 369 114 128 242 0 0 0 0 0 0 0
19 BELO NW 538 2155 2693 313 1880 2193 68 74 142 97 122 219 458 458 5 1 0 0 0
20 FINKWI NW 135 356 516 49 114 172 0 0 0 144 257 401 103 103 2 0 6 0 1
21 KWIGHE NW 99 495 594 77 328 405 0 92 105 61 24 80 109 117 1 0 1 0 4
22 ASHONG NW 91 156 247 62 224 286 9 1 10 40 8 48 57 61 4 0 0 0 0
23 MBH NW 409 1928 2337 324 731 1055 0 0 0 473 244 717 916 859 46 6 1 40 8
24 NKWEN NW 666 3351 4017 434 3449 3883 41 268 309 649 282 931 0 0 0 0 0 0 0
25 SABGA NW 56 257 313 75 299 374 2 3 5 60 35 95 62 62 0 0 0 0 0
26 BAYANGAM WE 27 53 72 20 94 114 3 8 11 10 12 22 18 18 1 0 0 0 0
27 NDEBAYA SW 37 60 97 15 50 65 0 0 0 18 21 39 28 28 1 0 0 0 0
28 EKOUNOU CE 452 1793 2245 570 2414 2984 58 255 313 142 141 283 0 0 0 0 0 0 0
29 ETOUGEBE CE 2326 5994 8320 975 2932 3907 0 0 0 443 439 882 0 0 0 0 0 0 0
30 KUMBA SW 636 1096 1732 585 765 1350 76 81 157 229 222 451 295 295 0 0 0 0 0
31 MBOPPI LT 4579 18360 22939 4746 6358 11104 190 87 277 2092 734 2826 2883 2772 69 18 11 49 50
32 VOUDOU CE 281 640 921 166 476 642 0 0 0 50 83 133 157 157 0 0 0 0 3
33 MUTENGENE SW 991 2490 3481 1200 2203 3403 460 1253 1713 334 281 615 923 899 51 2 3 18 5
34 EKONDO TITI SW 55 94 149 20 40 60 0 0 0 2 6 8 27 27 0 0 1 0 0
Reg
ion
INS
TIT
UT
ION
SE
RIA
L #
AB
TO
TA
L
NE
W
OL
D
TO
TA
L
TO
TA
L D
EL
IVE
RY
LIV
E B
IRT
H
TO
TA
L
NE
W
OL
D
TO
TA
L
NE
W
OL
D
NE
W
OL
D
DELIVERIES
PR
E-T
ER
M
NE
OD
BB
A
SB
ANC INFANT WELFARE PRESCHOOL CLINIC FAMILY PLANNING

56
Appendix 7 – Immunization
1 ALLAT AD 0 440 490 464 396 440 490 464 396 182 131 68 16 2 452 452 4883
2 BANYO AD 0 139 78 74 71 124 89 79 73 127 65 3 1 1 51 23 998
3 BANGOLAN NW 0 527 531 451 381 527 531 451 381 164 170 140 95 86 260 304 4999
4 BBH NW 0 1116 582 498 492 1116 555 494 487 506 310 108 51 27 461 650 7453
5 JIKIJEM NW 0 291 268 277 246 291 268 273 251 220 133 21 21 18 157 466 3201
6 KOUHOUAT WE 0 158 126 114 81 158 126 114 81 155 101 18 8 3 21 0 1264
7 LASSIN NW 0 311 135 132 157 289 132 133 155 76 48 16 3 4 122 125 1838
8 MBEM NW 0 205 117 83 56 218 123 87 63 202 146 0 0 0 44 291 1635
9 NDU NW 0 322 332 335 273 330 349 353 291 169 133 61 21 5 449 936 4359
10 NGEPTANG NW 0 138 126 152 150 142 129 151 141 67 21 4 3 2 143 75 1444
11 NGOUNSO WE 0 285 141 119 100 285 141 119 100 42 8 4 1 0 136 147 1628
12 NYAMBOYA AD 0 538 486 502 491 351 491 508 481 219 124 14 29 10 411 1743 6398
13 ROMKONG NW 0 106 44 40 39 106 44 40 39 52 18 9 10 6 42 42 607
14 SARKI BARKA AD 1 35 18 5 4 23 28 7 6 13 20 30 9 8 2 0 209
15 NWAT NW 0 91 63 45 48 70 57 57 52 89 86 8 1 5 61 83 805
16 KOUSSAM WE 0 74 46 47 31 66 42 47 30 66 47 25 21 8 37 27 614
17 AKEH NW 0 169 154 139 162 169 159 139 170 99 85 16 1 0 114 105 1598
18 BAFOUSSAM WE 0 0 72 79 88 0 72 79 88 249 115 100 25 16 86 0 1069
19 BELO NW 0 439 444 363 347 545 441 352 357 290 243 75 50 21 219 558 4744
20 FINKWI NW 0 88 82 95 69 84 78 88 64 108 219 176 74 20 80 63 1388
21 KWIGHE NW 0 149 139 130 128 149 139 128 128 129 64 3 0 13 107 445 1851
22 ASHONG NW 0 69 68 71 63 69 68 73 63 22 21 0 14 14 35 31 681
23 MBH NW 0 436 163 104 92 705 163 104 94 147 95 37 30 21 23 57 2271
24 NKWEN NW 0 0 357 382 387 0 357 382 387 402 229 126 60 24 373 373 3839
25 SABGA NW 7 68 74 72 90 72 78 80 94 80 52 23 24 14 71 324 1223
26 BAYANGAM WE 0 15 13 16 14 13 13 16 14 1 2 3 0 0 4 17 113
27 NDEBAYA SW 0 30 40 32 38 34 40 32 38 23 13 2 4 12 55 58 451
28 EKOUNOU CE 15 257 372 390 406 225 367 404 376 290 176 47 31 70 458 1056 4940
29 ETOUGEBE CE 405 740 945 900 857 674 945 900 863 1631 850 370 202 108 985 1461 12836
30 KUMBA SW 42 265 289 230 175 259 291 233 190 538 347 82 28 19 185 371 3544
31 MBOPPI LT 499 2491 1726 1577 1537 2491 1726 1577 1537 2773 1919 705 353 175 1290 3024 25347
32 VOUDOU CE 0 166 121 133 121 167 98 94 99 165 97 17 3 3 79 164 1527
33 MUTENGENE SW 83 861 629 568 593 861 629 568 593 787 503 244 103 69 426 426 7943
34 EKONDO TITI SW 0 21 15 11 16 20 17 11 18 35 21 4 0 1 1 4 195
Reg
ion
INS
TIT
UT
ION
SE
RIA
L #
TIT
AN
US
5
PO
LIO
2
PO
LIO
3
TIT
AN
US
1
TIT
AN
US
2
TIT
AN
US
3
TIT
AN
US
4
DP
T 1
DP
T 2
DP
T 3
PO
LIO
0
PO
LIO
1
ME
AS
LE
S
OT
HE
RS
TO
TA
L I
MM
UN
IZA
TIO
N
Men
ing
itis
BC
G
DPT POLIO TITANUS
IMMUNIZATIONIDENTIFICATION
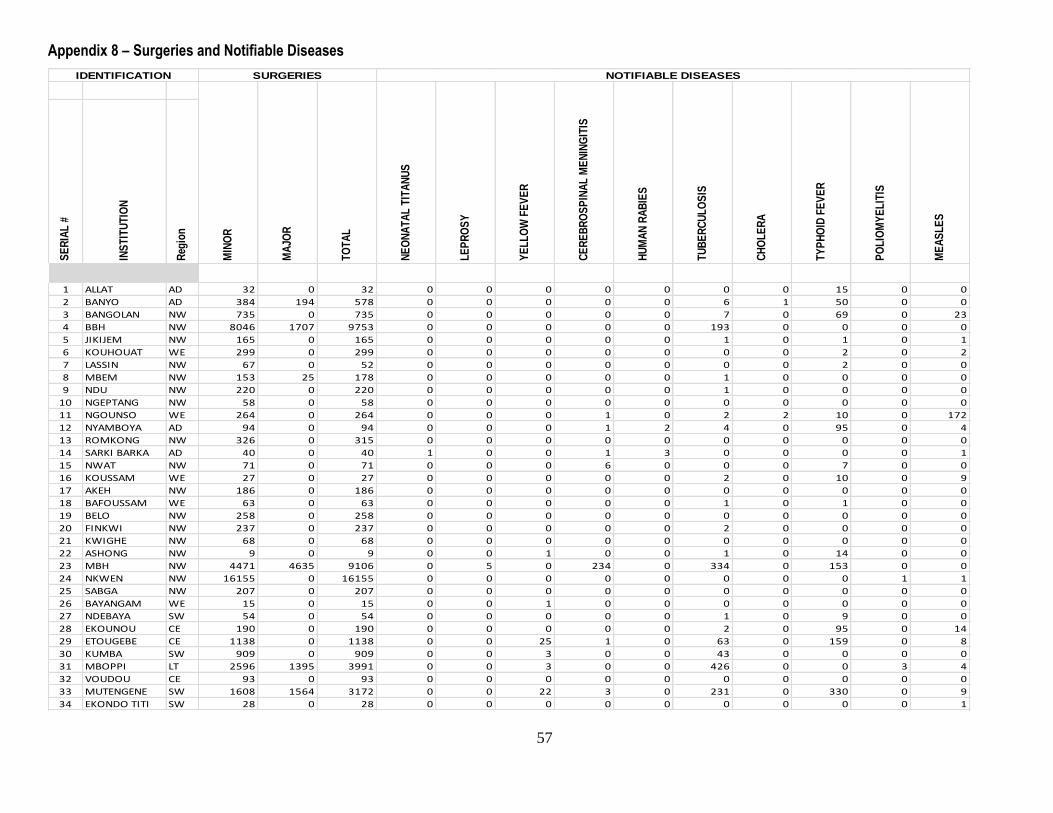
57
Appendix 8 – Surgeries and Notifiable Diseases
1 ALLAT AD 32 0 32 0 0 0 0 0 0 0 15 0 0
2 BANYO AD 384 194 578 0 0 0 0 0 6 1 50 0 0
3 BANGOLAN NW 735 0 735 0 0 0 0 0 7 0 69 0 23
4 BBH NW 8046 1707 9753 0 0 0 0 0 193 0 0 0 0
5 JIKIJEM NW 165 0 165 0 0 0 0 0 1 0 1 0 1
6 KOUHOUAT WE 299 0 299 0 0 0 0 0 0 0 2 0 2
7 LASSIN NW 67 0 52 0 0 0 0 0 0 0 2 0 0
8 MBEM NW 153 25 178 0 0 0 0 0 1 0 0 0 0
9 NDU NW 220 0 220 0 0 0 0 0 1 0 0 0 0
10 NGEPTANG NW 58 0 58 0 0 0 0 0 0 0 0 0 0
11 NGOUNSO WE 264 0 264 0 0 0 1 0 2 2 10 0 172
12 NYAMBOYA AD 94 0 94 0 0 0 1 2 4 0 95 0 4
13 ROMKONG NW 326 0 315 0 0 0 0 0 0 0 0 0 0
14 SARKI BARKA AD 40 0 40 1 0 0 1 3 0 0 0 0 1
15 NWAT NW 71 0 71 0 0 0 6 0 0 0 7 0 0
16 KOUSSAM WE 27 0 27 0 0 0 0 0 2 0 10 0 9
17 AKEH NW 186 0 186 0 0 0 0 0 0 0 0 0 0
18 BAFOUSSAM WE 63 0 63 0 0 0 0 0 1 0 1 0 0
19 BELO NW 258 0 258 0 0 0 0 0 0 0 0 0 0
20 FINKWI NW 237 0 237 0 0 0 0 0 2 0 0 0 0
21 KWIGHE NW 68 0 68 0 0 0 0 0 0 0 0 0 0
22 ASHONG NW 9 0 9 0 0 1 0 0 1 0 14 0 0
23 MBH NW 4471 4635 9106 0 5 0 234 0 334 0 153 0 0
24 NKWEN NW 16155 0 16155 0 0 0 0 0 0 0 0 1 1
25 SABGA NW 207 0 207 0 0 0 0 0 0 0 0 0 0
26 BAYANGAM WE 15 0 15 0 0 1 0 0 0 0 0 0 0
27 NDEBAYA SW 54 0 54 0 0 0 0 0 1 0 9 0 0
28 EKOUNOU CE 190 0 190 0 0 0 0 0 2 0 95 0 14
29 ETOUGEBE CE 1138 0 1138 0 0 25 1 0 63 0 159 0 8
30 KUMBA SW 909 0 909 0 0 3 0 0 43 0 0 0 0
31 MBOPPI LT 2596 1395 3991 0 0 3 0 0 426 0 0 3 4
32 VOUDOU CE 93 0 93 0 0 0 0 0 0 0 0 0 0
33 MUTENGENE SW 1608 1564 3172 0 0 22 3 0 231 0 330 0 9
34 EKONDO TITI SW 28 0 28 0 0 0 0 0 0 0 0 0 1
Reg
ion
INS
TIT
UT
ION
SE
RIA
L #
CH
OL
ER
A
TY
PH
OID
FE
VE
R
PO
LIO
MY
EL
ITIS
ME
AS
LE
S
NE
ON
AT
AL
TIT
AN
US
LE
PR
OS
Y
YE
LL
OW
FE
VE
R
CE
RE
BR
OS
PIN
AL
ME
NIN
GIT
IS
HU
MA
N R
AB
IES
TU
BE
RC
UL
OS
IS
MIN
OR
MA
JOR
TO
TA
L
SURGERIES NOTIFIABLE DISEASESIDENTIFICATION

58
Appendix 9 – HIV Test
BLOOD DONORSPATIENTS SCREENED
1 ALLAT AD 15 1 26 10 199 11 0 0 0 0 0 0 3 0 0 0 3
2 BANYO AD 57 2 143 122 444 124 0 0 0 0 0 0 69 0 0 0 69
3 BANGOLAN NW 99 0 30 35 1621 35 22 0 13 0 0 0 0 0 0 0 35
4 BBH NW 193 73 1181 768 5500 1349 546 7 65 19 3 16 6 0 0 2 664
5 JIKIJEM NW 3 0 0 6 249 36 8 0 0 0 0 0 0 0 0 0 8
6 KOUHOUAT WE 4 3 24 35 483 38 0 0 14 0 0 0 0 0 0 0 11
7 LASSIN NW 2 0 0 16 181 13 7 0 0 0 0 0 0 0 0 0 7
8 MBEM NW 1 0 16 14 352 17 8 2 0 0 0 0 2 0 0 0 10
9 NDU NW 1 0 22 78 725 78 51 0 0 0 0 0 0 0 0 0 51
10 NGEPTANG NW 0 1 19 21 134 14 0 0 0 0 0 0 0 0 0 0 0
11 NGOUNSO WE 187 5 268 107 469 112 2 0 96 1 0 0 0 0 0 1 100
12 NYAMBOYA AD 106 1 76 51 448 52 0 0 0 0 0 0 37 0 0 0 37
13 ROMKONG NW 0 0 0 3 48 3 0 0 0 0 0 0 0 0 0 0 0
14 SARKI BARKA AD 6 0 67 12 360 12 0 0 0 0 0 0 228 0 0 0 228
15 NWAT NW 13 2 75 45 341 53 20 0 0 0 0 0 0 0 0 0 20
16 KOUSSAM WE 21 0 25 21 185 21 0 0 18 0 0 0 0 0 0 0 18
17 AKEH NW 0 0 0 10 198 10 0 0 0 0 0 0 0 0 0 0 0
18 BAFOUSSAM WE 2 0 0 113 964 113 0 0 0 0 0 0 0 0 0 0 0
19 BELO NW 0 0 0 22 150 22 0 0 0 0 0 0 0 0 0 0 0
20 FINKWI NW 2 0 2 91 2066 174 0 0 0 0 0 0 0 0 0 0 0
21 KWIGHE NW 0 0 0 16 237 16 2 0 0 0 0 0 0 0 0 0 2
22 ASHONG NW 16 0 4 29 203 45 3 1 0 0 0 0 0 0 0 0 4
23 MBH NW 726 72 3139 556 5429 628 0 0 0 0 0 0 0 0 0 0 0
24 NKWEN NW 2 0 0 598 2566 598 0 0 0 0 0 0 0 0 0 0 0
25 SABGA NW 0 0 15 46 455 46 0 0 0 0 0 0 0 0 0 0 0
26 BAYANGAM WE 1 0 0 9 84 9 0 0 1 0 0 0 0 0 0 0 1
27 NDEBAYA SW 8 0 23 51 116 51 0 0 0 0 0 0 0 0 0 0 0
28 EKOUNOU CE 111 0 0 125 918 125 0 0 1 68 0 0 0 0 0 0 0
29 ETOUGEBE CE 256 0 0 328 2556 328 0 0 0 280 0 0 0 0 0 0 0
30 KUMBA SW 46 2 68 257 1553 463 0 386 0 0 0 0 0 0 0 0 186
31 MBOPPI LT 436 7 827 1229 11744 1236 0 0 0 0 0 1236 0 0 0 0 1139
32 VOUDOU CE 0 0 37 17 332 17 0 0 0 0 0 0 0 0 0 0 0
33 MUTENGENE SW 595 6 954 1227 3400 1233 9 821 0 6 0 170 0 0 0 1 1007
34 EKONDO TITI SW 1 0 3 29 131 29 12 9 2 0 0 3 0 0 0 0 0
Reg
ion
INS
TIT
UT
ION
SE
RIA
L #
Eas
t
To
tal
Cen
ter
So
uth
Lit
tora
l
Ad
amaw
a
No
rth
Far
No
rth
TO
TA
L
PO
SIT
IVE
NE
GA
TIV
E
PO
SIT
IVE
NE
GA
TIV
E
Distribution per Province
G.
TO
TA
L P
OS
ITIV
E
No
rth
wes
t
So
uth
w
est
WE
ST
HIV PREVALENCEIDENTIFICATION
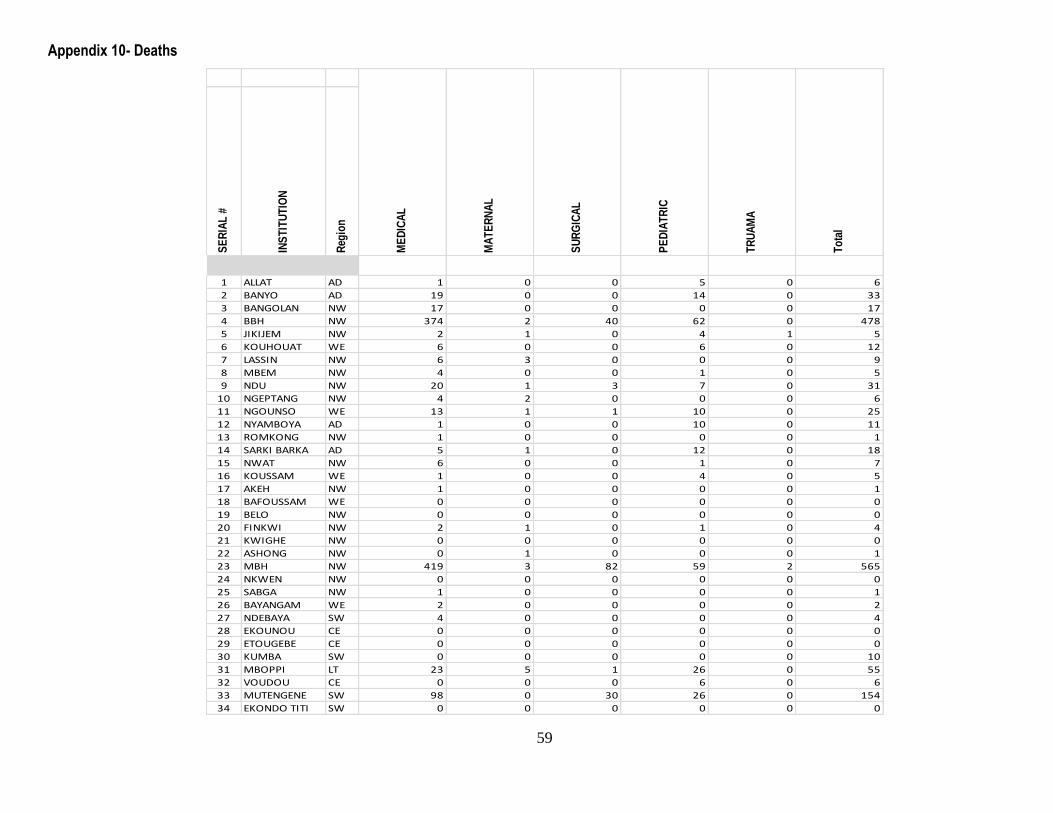
59
Appendix 10- Deaths
1 ALLAT AD 1 0 0 5 0 6
2 BANYO AD 19 0 0 14 0 33
3 BANGOLAN NW 17 0 0 0 0 17
4 BBH NW 374 2 40 62 0 478
5 JIKIJEM NW 2 1 0 4 1 5
6 KOUHOUAT WE 6 0 0 6 0 12
7 LASSIN NW 6 3 0 0 0 9
8 MBEM NW 4 0 0 1 0 5
9 NDU NW 20 1 3 7 0 31
10 NGEPTANG NW 4 2 0 0 0 6
11 NGOUNSO WE 13 1 1 10 0 25
12 NYAMBOYA AD 1 0 0 10 0 11
13 ROMKONG NW 1 0 0 0 0 1
14 SARKI BARKA AD 5 1 0 12 0 18
15 NWAT NW 6 0 0 1 0 7
16 KOUSSAM WE 1 0 0 4 0 5
17 AKEH NW 1 0 0 0 0 1
18 BAFOUSSAM WE 0 0 0 0 0 0
19 BELO NW 0 0 0 0 0 0
20 FINKWI NW 2 1 0 1 0 4
21 KWIGHE NW 0 0 0 0 0 0
22 ASHONG NW 0 1 0 0 0 1
23 MBH NW 419 3 82 59 2 565
24 NKWEN NW 0 0 0 0 0 0
25 SABGA NW 1 0 0 0 0 1
26 BAYANGAM WE 2 0 0 0 0 2
27 NDEBAYA SW 4 0 0 0 0 4
28 EKOUNOU CE 0 0 0 0 0 0
29 ETOUGEBE CE 0 0 0 0 0 0
30 KUMBA SW 0 0 0 0 0 10
31 MBOPPI LT 23 5 1 26 0 55
32 VOUDOU CE 0 0 0 6 0 6
33 MUTENGENE SW 98 0 30 26 0 154
34 EKONDO TITI SW 0 0 0 0 0 0
Reg
ion
INS
TIT
UT
ION
SE
RIA
L #
MA
TE
RN
AL
SU
RG
ICA
L
PE
DIA
TR
IC
TR
UA
MA
To
tal
ME
DIC
AL

60
Appendix 11- Diabetes
16 to 45
Male
Fem
ale
To
tal
Male
Fem
ale
To
tal
Male
Fem
ale
To
tal
Male
Fem
ale
To
tal
Male
Fem
ale
To
tal
1 ALLAT AD 9 3 12 20 17 37 0 44 44 43 4 4 51 0 0 0 0 0 0 0 1 0 2 8 10 24 15 39 49
2 BANYO AD 8 7 40 128 60 188 5 14 19 0 0 0 0 0 0 0 0 0 0 0 0 0 22 17 39 100 66 166 173
3 BANGOLAN NW 88 120 199 13 31 45 57 174 226 166 43 0 209 0 0 0 0 0 0 0 0 0 33 42 75 54 99 153 172
4 BBH NW 239 272 534 721 744 1465 0 0 0 124 30 0 154 0 0 0 0 1 1 0 1 1 90 92 182 148 271 257 328
5 JIKIJEM NW 34 37 71 83 67 150 0 39 39 14 5 0 19 0 0 0 0 0 0 0 0 0 43 52 95 73 51 124 219
6 KOUHOUAT WE 31 31 56 83 100 127 35 1 36 164 56 10 191 2 3 18 7 0 7 5 6 11 44 52 96 86 71 157 289
7 LASSIN NW 11 5 14 25 21 46 6 6 12 0 0 0 0 0 2 2 2 0 2 0 0 0 16 8 24 22 20 42 70
8 MBEM NW 13 18 30 44 23 67 3 0 4 3 0 0 3 0 0 0 0 0 0 0 0 0 0 0 0 0 0 0 0
9 NDU NW 28 64 92 145 270 415 69 558 627 503 63 355 921 0 0 0 0 0 0 0 0 0 26 41 67 149 342 491 558
10 NGEPTANG NW 4 8 12 13 29 42 0 8 8 34 7 0 38 0 0 0 0 0 0 0 0 0 5 18 23 10 14 24 47
11 NGOUNSO WE 29 32 63 63 42 105 16 207 220 187 29 0 216 2 2 4 13 15 28 1 3 4 36 33 69 77 56 133 238
12 NYAMBOYA AD 26 42 68 37 42 79 8 9 17 8 9 0 17 0 0 0 0 0 0 0 0 0 2 3 4 8 7 15 19
13 ROMKONG NW 0 4 4 27 59 78 81 1 74 68 11 0 71 0 0 0 0 0 0 0 0 0 1 7 7 22 60 75 82
14 SARKI BARKA AD 0 0 0 2 6 8 1 7 8 4 4 0 8 0 0 0 0 0 0 0 0 0 0 2 2 0 0 0 2
15 NWAT NW 1 0 1 42 66 108 0 103 113 101 2 0 103 0 0 0 2 7 9 0 0 0 10 5 18 26 50 76 103
16 KOUSSAM WE 4 6 10 10 13 23 0 0 0 0 0 0 0 0 0 0 0 0 0 0 0 0 4 6 10 46 78 124 134
17 AKEH NW 0 0 0 17 17 34 1 21 22 14 2 0 16 2 1 3 0 0 0 0 0 0 1 5 6 13 11 24 34
18 BAFOUSSAM WE 67 113 180 491 887 1378 0 0 0 0 0 0 0 0 0 0 3 2 5 1 5 5 18 40 71 527 911 1438 1519
19 BELO NW 16 19 35 155 150 305 0 0 0 0 0 0 0 0 0 0 0 0 0 8 11 1 50 47 97 120 127 247 434
20 FINKWI NW 0 0 0 0 0 0 0 0 0 0 0 0 0 0 0 0 0 0 0 0 0 0 0 0 0 0 0 0 0
21 KWIGHE NW 0 1 1 17 43 60 0 0 0 0 0 0 0 0 0 0 0 0 0 0 0 0 3 13 16 12 27 39 52
22 ASHONG NW 1 1 2 17 8 25 5 0 5 3 2 0 5 0 0 0 0 0 0 0 0 0 8 4 12 10 10 20 32
23 MBH NW 6 11 17 115 110 225 27 224 251 226 25 250 501 0 0 0 0 0 0 0 0 0 3 11 14 115 124 235 249
24 NKWEN NW 16 33 49 156 107 263 0 268 268 81 166 0 247 0 0 0 0 0 0 0 4 4 111 91 202 69 123 192 398
25 SABGA NW 0 0 0 3 5 8 0 0 0 0 0 0 0 0 0 0 0 0 0 0 1 1 2 7 9 5 6 11 26
26 BAYANGAM WE 20 29 49 77 123 200 172 61 233 66 13 18 97 0 0 0 0 0 0 0 0 0 16 19 35 78 122 200 235
27 NDEBAYA SW 2 6 8 17 9 26 0 2 2 29 0 0 29 0 0 0 0 0 0 0 0 0 15 1 16 8 12 20 36
28 EKOUNOU CE 4 0 4 615 696 1311 771 482 1253 1178 93 0 0 1272 0 0 0 0 0 0 0 0 0 147 86 233 458 530 988
29 ETOUGEBE CE 244 245 489 742 876 1618 29 513 542 513 29 0 542 0 0 0 0 0 0 0 13 13 186 415 601 847 710 1557 1980
30 KUMBA SW 34 63 384 946 1463 1701 722 2067 2361 1664 950 157 2589 0 0 0 4 3 5 3 8 70 284 459 637 783 1134 1852 1912
31 MBOPPI LT 29 32 61 1502 1986 3488 1358 2230 3588 2642 907 3549 7098 0 0 0 0 0 0 0 0 0 602 831 1433 892 1224 2406 3839
32 VOUDOU CE 0 0 0 0 0 0 0 0 0 0 0 0 0 0 0 0 0 0 0 0 0 0 0 0 0 0 0 0 0
33 MUTENGENE SW 12 28 40 401 554 955 230 757 948 404 585 0 989 0 0 0 0 0 0 0 1 1 151 180 331 272 380 652 921
34 EKONDO TITI SW 0 0 0 0 0 0 0 0 0 0 0 0 0 0 0 0 0 0 0 0 0 0 0 0 0 0 0 0 0
45+
G.T
ot
(M&
F)
Reg
ion
INS
TIT
UT
ION
SE
RIA
L #
<1 1 to 5 6 to 15
To
tal
OR
AL
INJE
CT
ION
DIE
T
To
tal
Male
Fem
ale
To
tal
Male
OLD TYPE DRUG
AGE GROUP/SEX DISTRIBUTION
Fem
ale
To
tal
ON
E
TW
O
NEW