Camel
33
INDIAN INSTITUTE OF PLANNING AND MANAGEMENT NEW DELHI “FINANCIAL PERFORMANCE OF PUBLIC SECTOR BANKS VERSUS PRIVATE SECTOR BANKS” SUBMITTED TO: SUBMITTED BY: 1
Transcript of Camel
INDIAN INSTITUTE OF PLANNING AND MANAGEMENT NEW DELHI
“FINANCIAL PERFORMANCE OF PUBLIC SECTOR BANKS VERSUS PRIVATE SECTOR BANKS”
SUBMITTED TO:
SUBMITTED BY:
1
ABSTRACT
The banking sector has been undergoing a complex, but comprehensive phase of
restructuring since 1991, with a view to make it sound, efficient, and at the same time
forging its links firmly with the real sector for promotion of savings, investment and
growth. Although a complete turnaround in banking sector performance is not
expected till the completion of reforms, signs of improvement are visible in some
indicators under the CAMEL framework. Under this bank is required to enhance
capital adequacy, strengthen asset quality, improve management, increase earnings
and reduce sensitivity to various financial risks. The almost simultaneous nature of
these developments makes it difficult to disentangle the positive impact of reform
measures. Keeping this in mind, signs of improvements and deteriorations are
discussed for the three groups of scheduled banks in the following sections.
CAMELS Framework
Supervisory framework, consistent with international norms, covers risk-monitoring
factors for evaluating the performance of banks. This framework involves the
analyses of six groups of indicators reflecting the health of financial institutions. The
indicators are as follows:
CAPITAL ADEQUACY
ASSET QUALITY
MANAGEMENT SOUNDNESS
EARNINGS & PROFITABILITY
LIQUIDITY
SENSITIVITY TO MARKET RISK
The whole banking scenario has changed in the very recent past on the
recommendations of Narasimham Committee. Further BASELL II Norms were
introduced to internationally standardize processes and make the banking industry
more adaptive to the sensitive market risks. The fact that banks work under the most
volatile conditions and the banking industry as such in the booming phase makes it an
interesting subject of study. Amongst these reforms and restructuring the CAMELS
2
Framework has its own contribution to the way modern banking is looked up on now.
The attempt here is to see how various ratios have been used and interpreted to reveal
a banks performance and how this particular model encompasses a wide range of
parameters making it a widely used and accepted model in today’s scenario.
Performance Analysis of Nationalized Banks in India an Application of Camel
Model using different parameters:
(A)CAPITAL ADEQUACY:
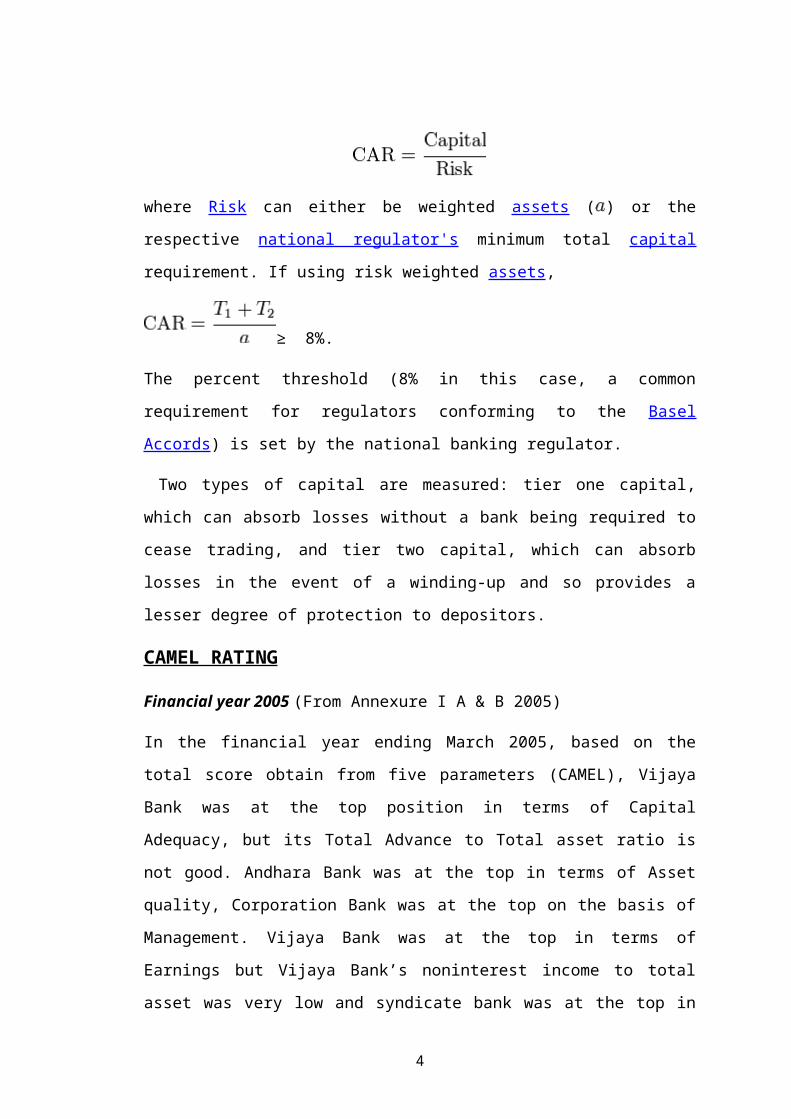
Capital adequacy ratio is defined as
where Risk can either be weighted assets ( ) or the respective national regulator's
minimum total capital requirement. If using risk weighted assets,
≥ 8%.
The percent threshold (8% in this case, a common requirement for regulators
conforming to the Basel Accords) is set by the national banking regulator.
Two types of capital are measured: tier one capital, which can absorb losses without a
bank being required to cease trading, and tier two capital, which can absorb losses in
the event of a winding-up and so provides a lesser degree of protection to depositors.
CAMEL RATING
Financial year 2005 (From Annexure I A & B 2005)
In the financial year ending March 2005, based on the total score obtain from five
parameters (CAMEL), Vijaya Bank was at the top position in terms of Capital
Adequacy, but its Total Advance to Total asset ratio is not good. Andhara Bank was
at the top in terms of Asset quality, Corporation Bank was at the top on the basis of
Management. Vijaya Bank was at the top in terms of Earnings but Vijaya Bank’s
noninterest income to total asset was very low and syndicate bank was at the top in
3
terms of liquidity. Syndicate Bank capital adequacy ratio and management seems to
be very poor.
In 2005, Punjab and Sind Bank was at the bottom position because of its bad overall capital
adequacy position but they were good at maintaining a substantial capital in government
securities leading to the liquidity. Dena Bank was at bottom in term of its Asset Quality.
Punjab and Sind Bank was bottom in terms of its Management, Bank of Baroda is at bottom
in terms of its earning and bank of India is at the bottom in terms of its liquidity position.
Table:-Outcome of Analysis for the year 2005
Outcome of Analysis for the year 2005
Parameter Bank at Top Position Bank at Bottom Position
Capital Adequacy Corporation Bank Punjab & Sind Bank
Asset Quality Andhra Bank Dena Bank
Management Corporation Bank Punjab & Sind Bank
Earnings Vijaya Bank Dena Bank
Liquidity Syndicate Bank Bank of India
On the overall banks performance Vijaya Bank was at the top position, Management of
Vijaya Bank was the point where they were not good; they were on 6th position from 20
Banks. Corporation Bank was at 2nd position but its govt. securities to total asset ratio was
not good which leads to the lower rank in capital adequacy. Its liquidity position was also not
good. Andhara Bank was at 3rd position. Punjab national bank was at 4th position but they
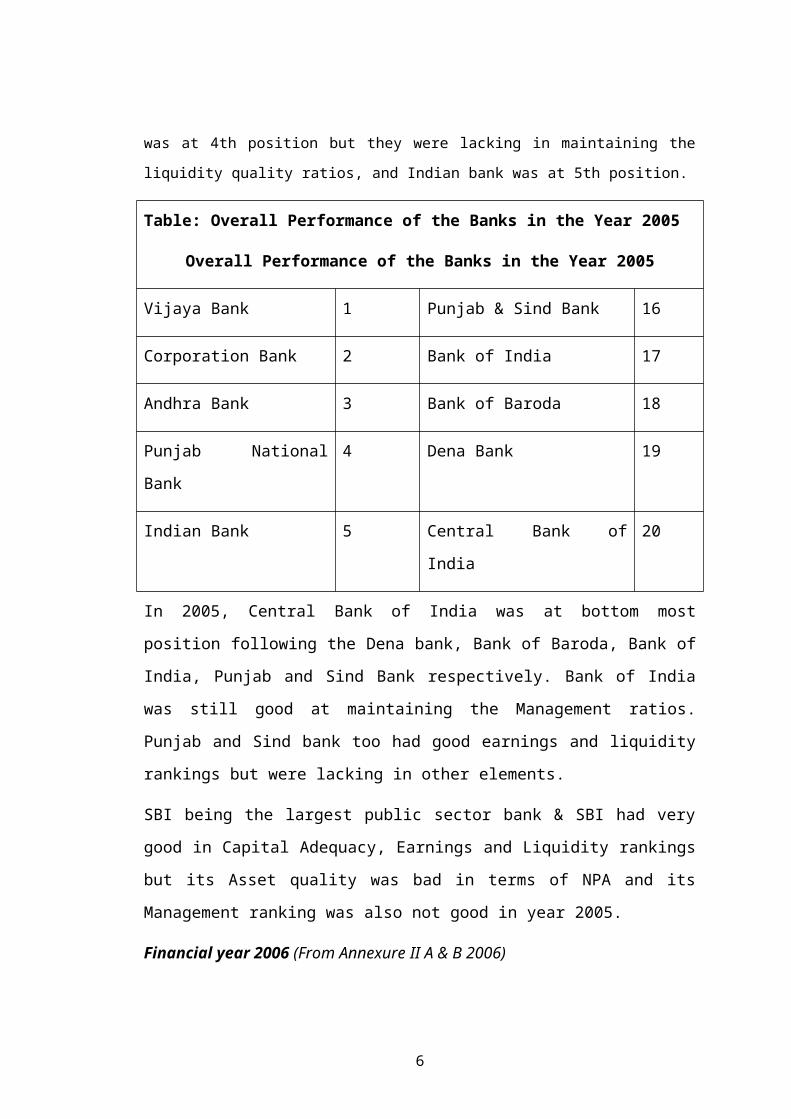
were lacking in maintaining the liquidity quality ratios, and Indian bank was at 5th position.
Table: Overall Performance of the Banks in the Year 2005
Overall Performance of the Banks in the Year 2005
Vijaya Bank 1 Punjab & Sind Bank 16
Corporation Bank 2 Bank of India 17
Andhra Bank 3 Bank of Baroda 18
4

Punjab National Bank 4 Dena Bank 19
Indian Bank 5 Central Bank of India 20
In 2005, Central Bank of India was at bottom most position following the Dena bank,
Bank of Baroda, Bank of India, Punjab and Sind Bank respectively. Bank of India
was still good at maintaining the Management ratios. Punjab and Sind bank too had
good earnings and liquidity rankings but were lacking in other elements.
SBI being the largest public sector bank & SBI had very good in Capital Adequacy,
Earnings and Liquidity rankings but its Asset quality was bad in terms of NPA and its
Management ranking was also not good in year 2005.
Financial year 2006 (From Annexure II A & B 2006)
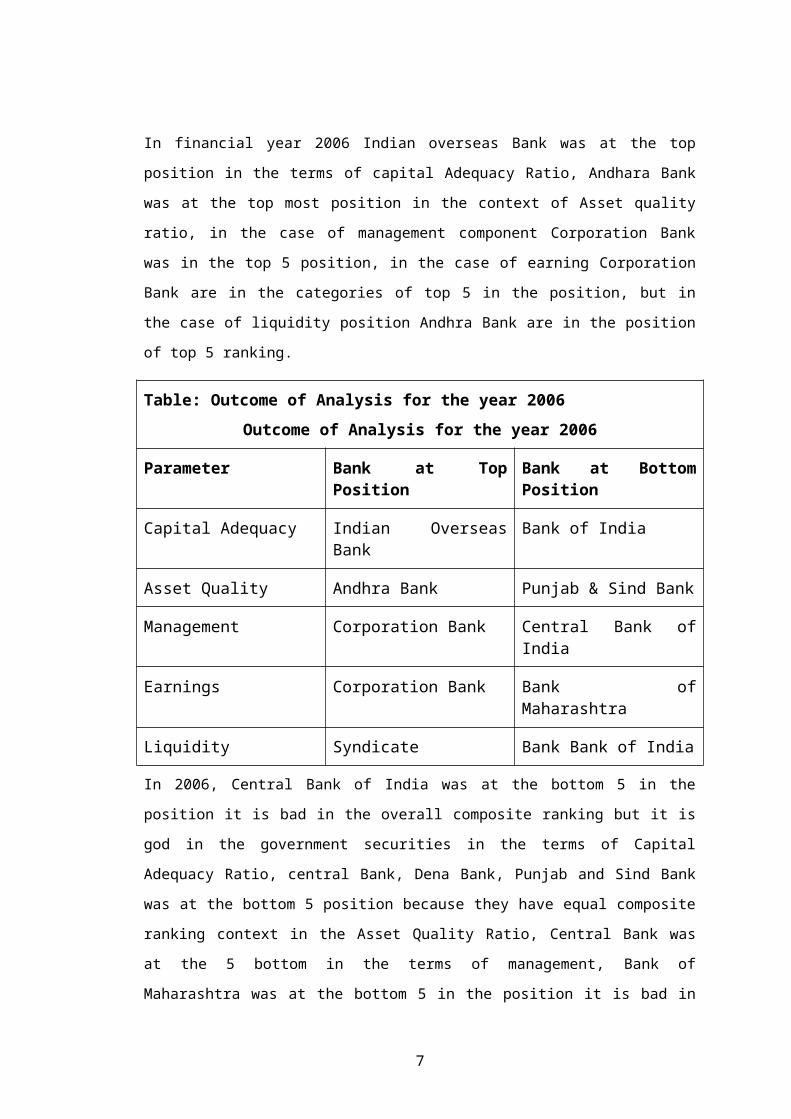
In financial year 2006 Indian overseas Bank was at the top position in the terms of capital
Adequacy Ratio, Andhara Bank was at the top most position in the context of Asset quality
ratio, in the case of management component Corporation Bank was in the top 5 position, in
the case of earning Corporation Bank are in the categories of top 5 in the position, but in the
case of liquidity position Andhra Bank are in the position of top 5 ranking.
Table: Outcome of Analysis for the year 2006
Outcome of Analysis for the year 2006
Parameter Bank at Top Position Bank at Bottom Position
Capital Adequacy Indian Overseas Bank Bank of India
Asset Quality Andhra Bank Punjab & Sind Bank
Management Corporation Bank Central Bank of India
Earnings Corporation Bank Bank of Maharashtra
Liquidity Syndicate Bank Bank of India
In 2006, Central Bank of India was at the bottom 5 in the position it is bad in the overall
composite ranking but it is god in the government securities in the terms of Capital
Adequacy Ratio, central Bank, Dena Bank, Punjab and Sind Bank was at the bottom 5
position because they have equal composite ranking context in the Asset Quality Ratio,
Central Bank was at the 5 bottom in the terms of management, Bank of Maharashtra was at
5
the bottom 5 in the position it is bad in the composite ranking but god in dividend payout
ratio and interest income to total income in the terms of earning, central Bank was at the
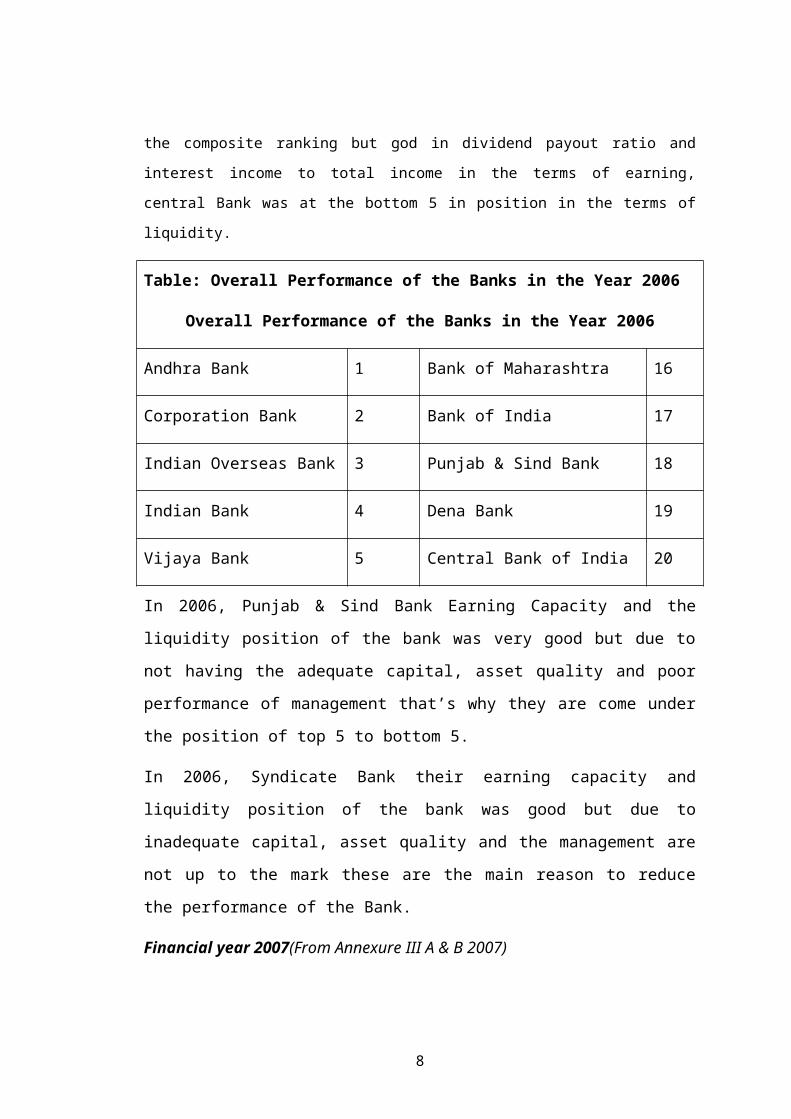
bottom 5 in position in the terms of liquidity.
Table: Overall Performance of the Banks in the Year 2006
Overall Performance of the Banks in the Year 2006
Andhra Bank 1 Bank of Maharashtra 16
Corporation Bank 2 Bank of India 17
Indian Overseas Bank 3 Punjab & Sind Bank 18
Indian Bank 4 Dena Bank 19
Vijaya Bank 5 Central Bank of India 20
In 2006, Punjab & Sind Bank Earning Capacity and the liquidity position of the bank
was very good but due to not having the adequate capital, asset quality and poor
performance of management that’s why they are come under the position of top 5 to
bottom 5.
In 2006, Syndicate Bank their earning capacity and liquidity position of the bank was
good but due to inadequate capital, asset quality and the management are not up to the
mark these are the main reason to reduce the performance of the Bank.
Financial year 2007(From Annexure III A & B 2007)
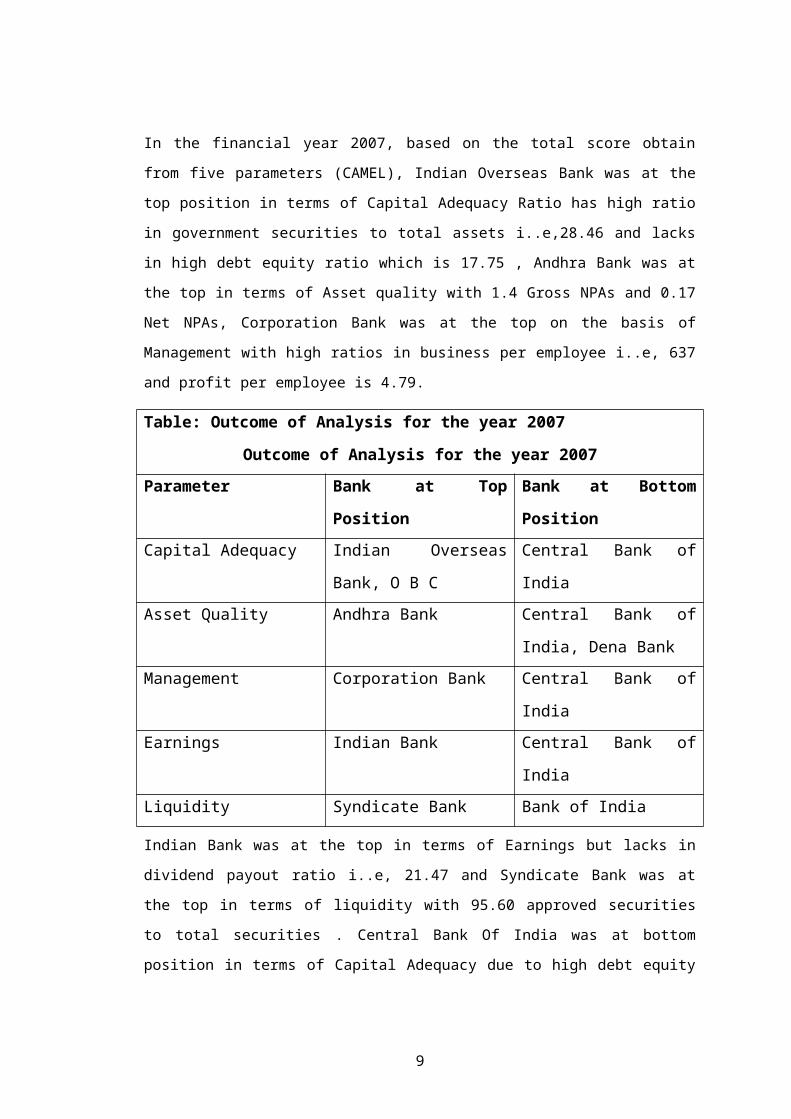
In the financial year 2007, based on the total score obtain from five parameters (CAMEL),
Indian Overseas Bank was at the top position in terms of Capital Adequacy Ratio has high
ratio in government securities to total assets i..e,28.46 and lacks in high debt equity ratio
which is 17.75 , Andhra Bank was at the top in terms of Asset quality with 1.4 Gross NPAs
and 0.17 Net NPAs, Corporation Bank was at the top on the basis of Management with high
ratios in business per employee i..e, 637 and profit per employee is 4.79.
Table: Outcome of Analysis for the year 2007
Outcome of Analysis for the year 2007
Parameter Bank at Top Position Bank at Bottom Position
6
Capital Adequacy Indian Overseas Bank, O
B C
Central Bank of India
Asset Quality Andhra Bank Central Bank of India,
Dena Bank
Management Corporation Bank Central Bank of India
Earnings Indian Bank Central Bank of India
Liquidity Syndicate Bank Bank of India
Indian Bank was at the top in terms of Earnings but lacks in dividend payout ratio i..e, 21.47
and Syndicate Bank was at the top in terms of liquidity with 95.60 approved securities to
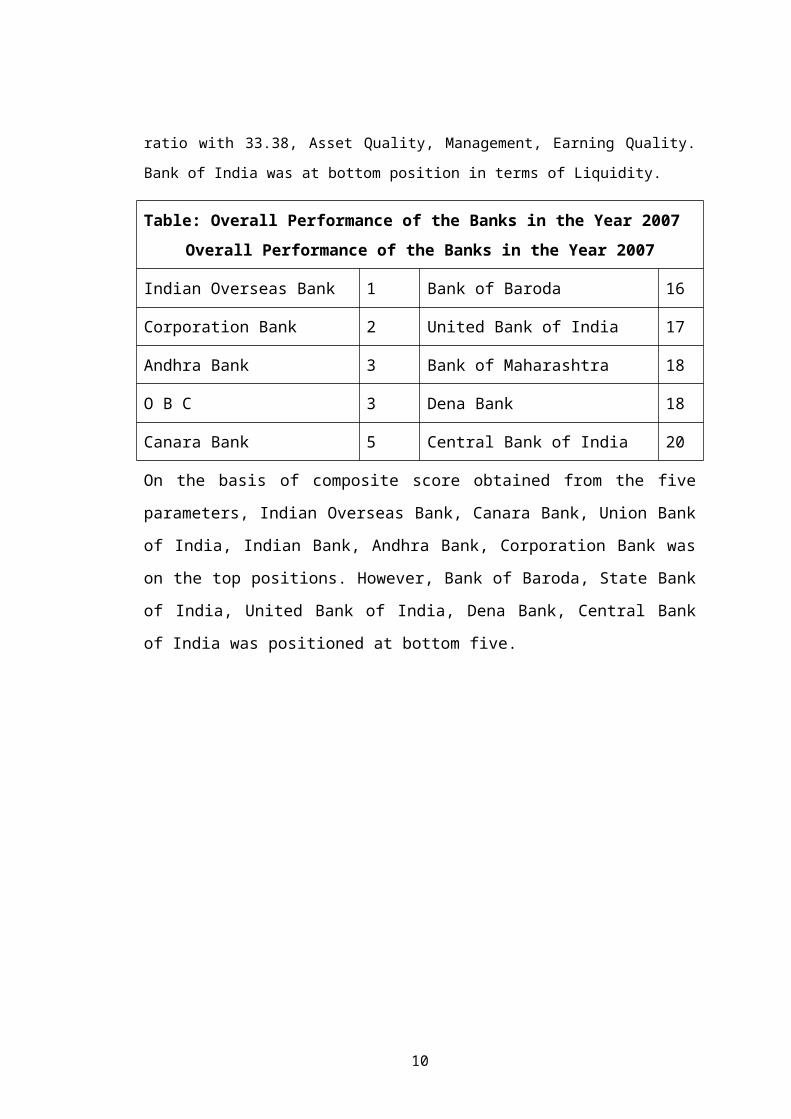
total securities . Central Bank Of India was at bottom position in terms of Capital Adequacy
due to high debt equity ratio with 33.38, Asset Quality, Management, Earning Quality. Bank
of India was at bottom position in terms of Liquidity.
Table: Overall Performance of the Banks in the Year 2007
Overall Performance of the Banks in the Year 2007
Indian Overseas Bank 1 Bank of Baroda 16
Corporation Bank 2 United Bank of India 17
Andhra Bank 3 Bank of Maharashtra 18
O B C 3 Dena Bank 18
Canara Bank 5 Central Bank of India 20
On the basis of composite score obtained from the five parameters, Indian Overseas
Bank, Canara Bank, Union Bank of India, Indian Bank, Andhra Bank, Corporation
Bank was on the top positions. However, Bank of Baroda, State Bank of India, United
Bank of India, Dena Bank, Central Bank of India was positioned at bottom five.
7
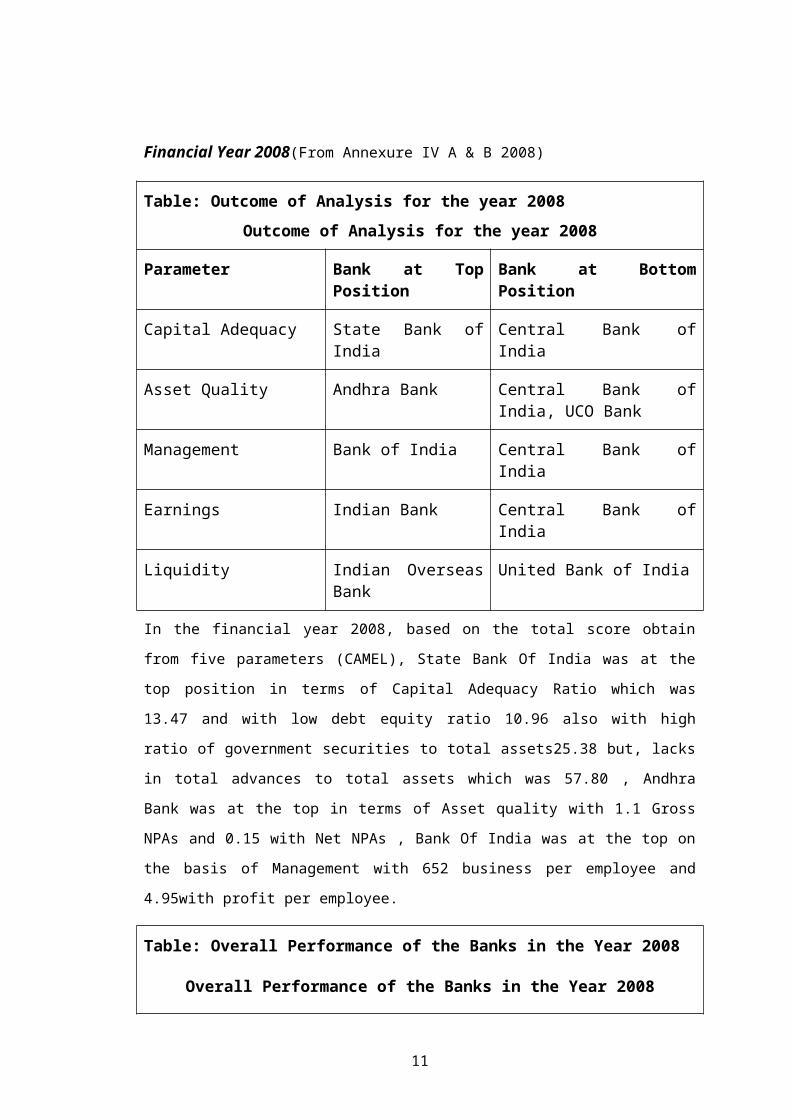
Financial Year 2008(From Annexure IV A & B 2008)
Table: Outcome of Analysis for the year 2008
Outcome of Analysis for the year 2008
Parameter Bank at Top Position Bank at Bottom Position
Capital Adequacy State Bank of India Central Bank of India
Asset Quality Andhra Bank Central Bank of India, UCO Bank
Management Bank of India Central Bank of India
Earnings Indian Bank Central Bank of India
Liquidity Indian Overseas Bank United Bank of India
In the financial year 2008, based on the total score obtain from five parameters (CAMEL),
State Bank Of India was at the top position in terms of Capital Adequacy Ratio which was
13.47 and with low debt equity ratio 10.96 also with high ratio of government securities to
total assets25.38 but, lacks in total advances to total assets which was 57.80 , Andhra Bank
was at the top in terms of Asset quality with 1.1 Gross NPAs and 0.15 with Net NPAs , Bank
Of India was at the top on the basis of Management with 652 business per employee and
4.95with profit per employee.
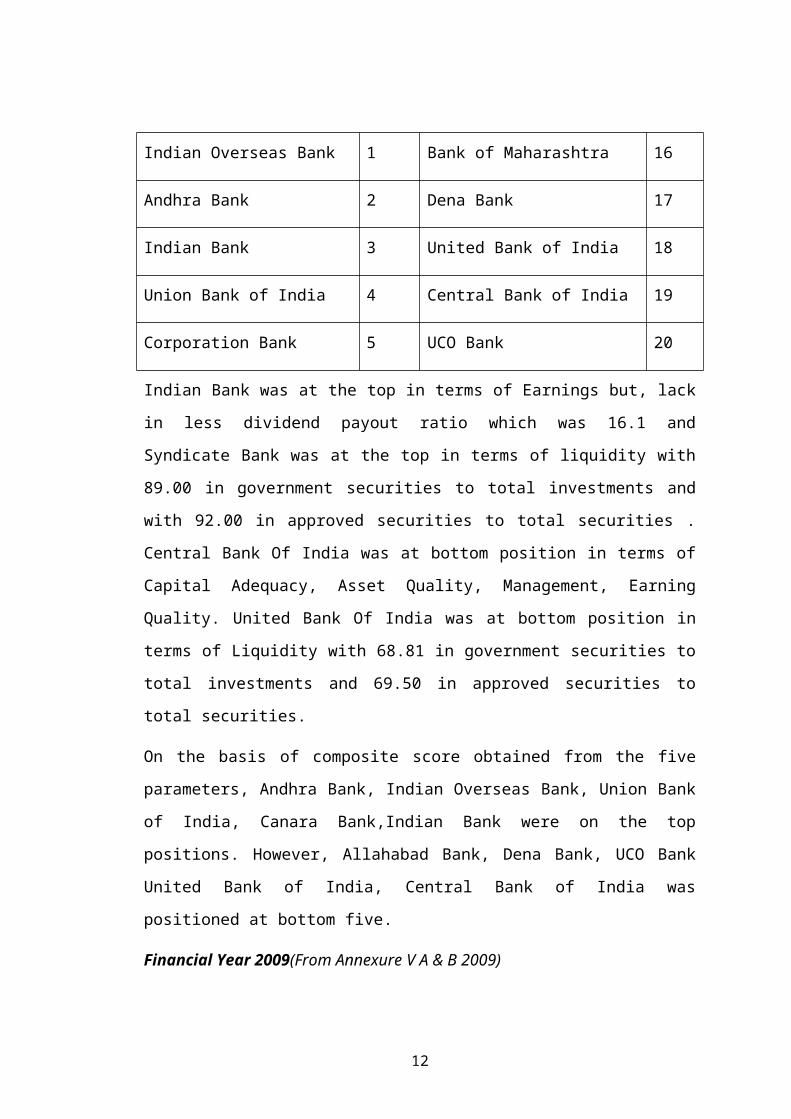
Table: Overall Performance of the Banks in the Year 2008
Overall Performance of the Banks in the Year 2008
Indian Overseas Bank 1 Bank of Maharashtra 16
Andhra Bank 2 Dena Bank 17
Indian Bank 3 United Bank of India 18
Union Bank of India 4 Central Bank of India 19
Corporation Bank 5 UCO Bank 20
8
Indian Bank was at the top in terms of Earnings but, lack in less dividend payout ratio
which was 16.1 and Syndicate Bank was at the top in terms of liquidity with 89.00 in
government securities to total investments and with 92.00 in approved securities to
total securities . Central Bank Of India was at bottom position in terms of Capital
Adequacy, Asset Quality, Management, Earning Quality. United Bank Of India was
at bottom position in terms of Liquidity with 68.81 in government securities to total
investments and 69.50 in approved securities to total securities.
On the basis of composite score obtained from the five parameters, Andhra Bank,
Indian Overseas Bank, Union Bank of India, Canara Bank,Indian Bank were on the
top positions. However, Allahabad Bank, Dena Bank, UCO Bank United Bank of
India, Central Bank of India was positioned at bottom five.
Financial Year 2009(From Annexure V A & B 2009)
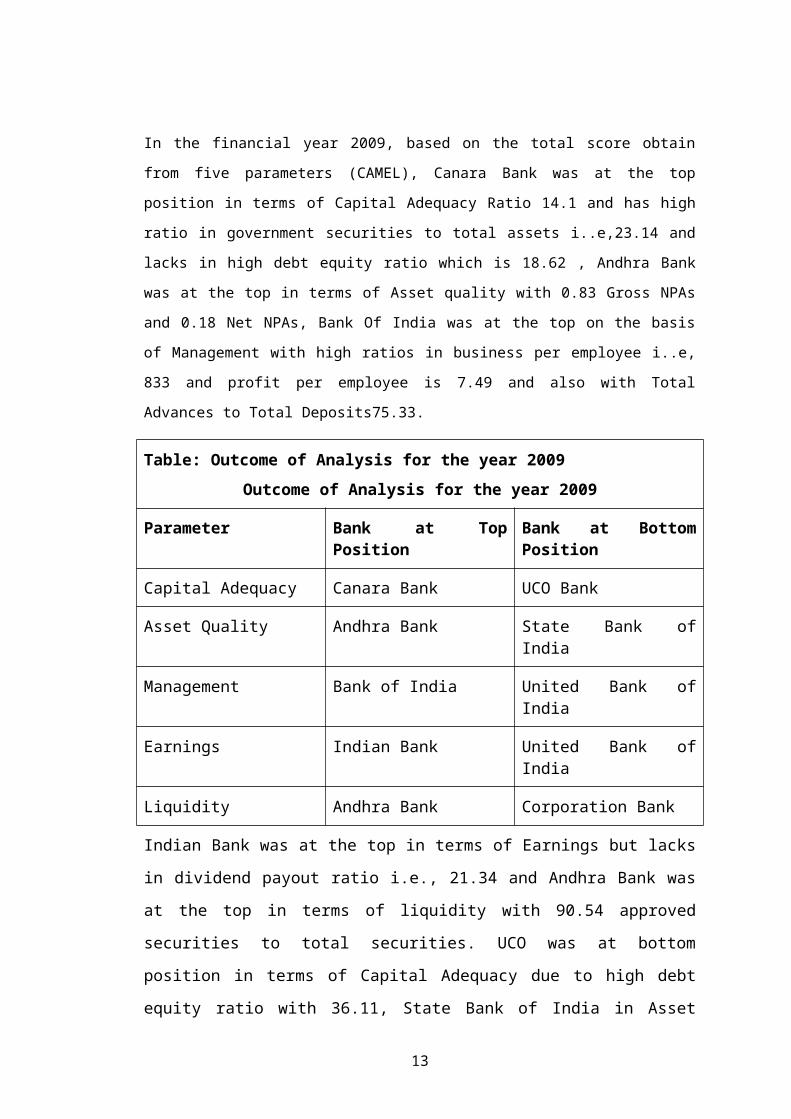
In the financial year 2009, based on the total score obtain from five parameters (CAMEL),
Canara Bank was at the top position in terms of Capital Adequacy Ratio 14.1 and has high
ratio in government securities to total assets i..e,23.14 and lacks in high debt equity ratio
which is 18.62 , Andhra Bank was at the top in terms of Asset quality with 0.83 Gross NPAs
and 0.18 Net NPAs, Bank Of India was at the top on the basis of Management with high
ratios in business per employee i..e, 833 and profit per employee is 7.49 and also with Total
Advances to Total Deposits75.33.
Table: Outcome of Analysis for the year 2009
Outcome of Analysis for the year 2009
Parameter Bank at Top Position Bank at Bottom Position
Capital Adequacy Canara Bank UCO Bank
Asset Quality Andhra Bank State Bank of India
Management Bank of India United Bank of India
Earnings Indian Bank United Bank of India
Liquidity Andhra Bank Corporation Bank
Indian Bank was at the top in terms of Earnings but lacks in dividend payout ratio i.e.,
21.34 and Andhra Bank was at the top in terms of liquidity with 90.54 approved
9
securities to total securities. UCO was at bottom position in terms of Capital
Adequacy due to high debt equity ratio with 36.11, State Bank of India in Asset
Quality, United Bank of India in Management and Earning Quality Ratio. Corporation
Bank was at bottom position in terms of Liquidity.
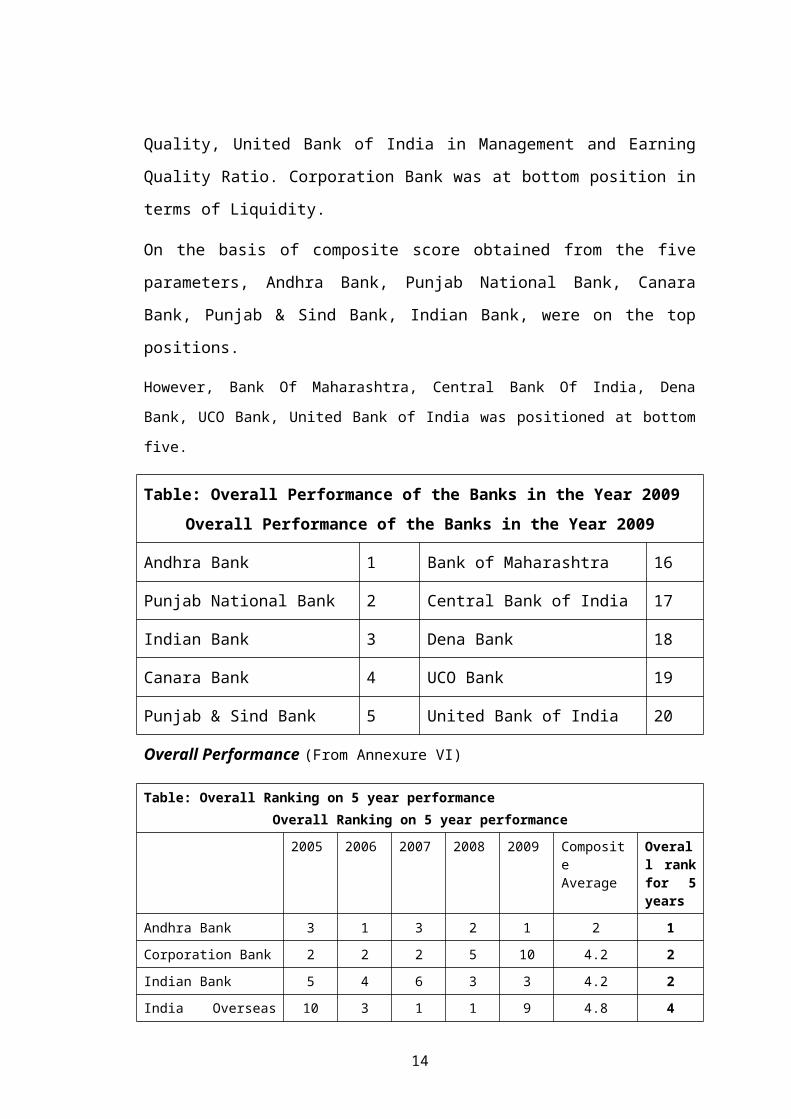
On the basis of composite score obtained from the five parameters, Andhra Bank,
Punjab National Bank, Canara Bank, Punjab & Sind Bank, Indian Bank, were on the
top positions.
However, Bank Of Maharashtra, Central Bank Of India, Dena Bank, UCO Bank, United Bank
of India was positioned at bottom five.
Table: Overall Performance of the Banks in the Year 2009
Overall Performance of the Banks in the Year 2009
Andhra Bank 1 Bank of Maharashtra 16
Punjab National Bank 2 Central Bank of India 17
Indian Bank 3 Dena Bank 18
Canara Bank 4 UCO Bank 19
Punjab & Sind Bank 5 United Bank of India 20
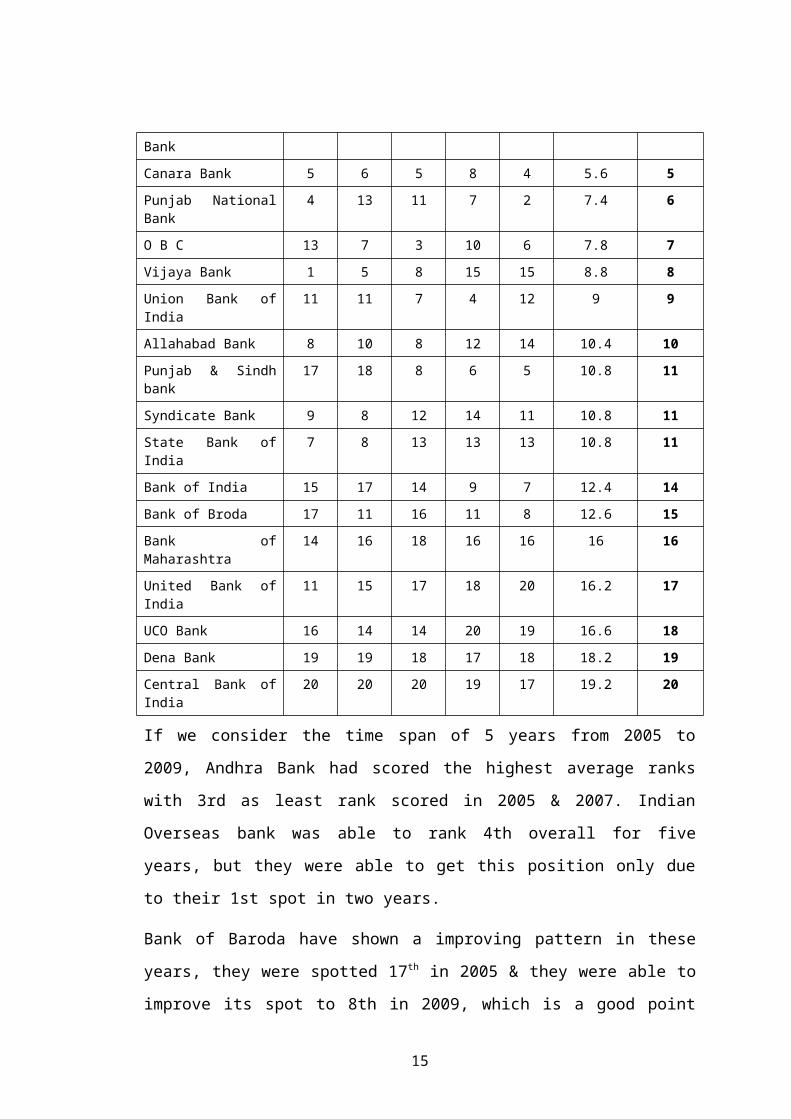
Overall Performance (From Annexure VI)
Table: Overall Ranking on 5 year performance
Overall Ranking on 5 year performance
2005 2006 2007 2008 2009 Composite Average
Overall rank for 5 years
Andhra Bank 3 1 3 2 1 2 1
Corporation Bank 2 2 2 5 10 4.2 2
Indian Bank 5 4 6 3 3 4.2 2
India Overseas Bank 10 3 1 1 9 4.8 4
Canara Bank 5 6 5 8 4 5.6 5
Punjab National Bank 4 13 11 7 2 7.4 6
O B C 13 7 3 10 6 7.8 7
Vijaya Bank 1 5 8 15 15 8.8 8
Union Bank of India 11 11 7 4 12 9 9
Allahabad Bank 8 10 8 12 14 10.4 10
10
Punjab & Sindh bank 17 18 8 6 5 10.8 11
Syndicate Bank 9 8 12 14 11 10.8 11
State Bank of India 7 8 13 13 13 10.8 11
Bank of India 15 17 14 9 7 12.4 14
Bank of Broda 17 11 16 11 8 12.6 15
Bank of Maharashtra 14 16 18 16 16 16 16
United Bank of India 11 15 17 18 20 16.2 17
UCO Bank 16 14 14 20 19 16.6 18
Dena Bank 19 19 18 17 18 18.2 19
Central Bank of India 20 20 20 19 17 19.2 20
If we consider the time span of 5 years from 2005 to 2009, Andhra Bank had scored
the highest average ranks with 3rd as least rank scored in 2005 & 2007. Indian
Overseas bank was able to rank 4th overall for five years, but they were able to get
this position only due to their 1st spot in two years.
Bank of Baroda have shown a improving pattern in these years, they were spotted 17 th
in 2005 & they were able to improve its spot to 8th in 2009, which is a good point for
the bank Canara Bank has shown a consistent position in all these years, Canara Bank
have been spotted around average ranks ranging between 4 to 8 & so the overall rank
for 5 years is 5th & same was the case with Allahabad Bank with overall rank of 10
for 5 years.
Punjab & Sind Bank has also shown a substantial growth, by raising its position of
17th in 2005 to 8th in 2007 & 5th in 2009, but due to bad position in previous years it
was able to rank only 11th in overall performance ranking same was the case with
Bank of India which was at 15th rank in 2007 & later in 2009 they were spotted at 7 th
rank.
Performance of Vijaya Bank has been declining year by year, they were at 1st
position in 2005 but later on they were at 15th in 2009.
Position of State Bank of India has shown a mixed results, we came to know that even
though it is a biggest bank in India but SBI has not availed good ranks over the time
period, they were just near the top five banks in 2005 & 2006 at 7th & 8th rank
respectively but later on in all SBI was able to get only 13th in all years. So overall
rank of SBI was just 11th rank.
11
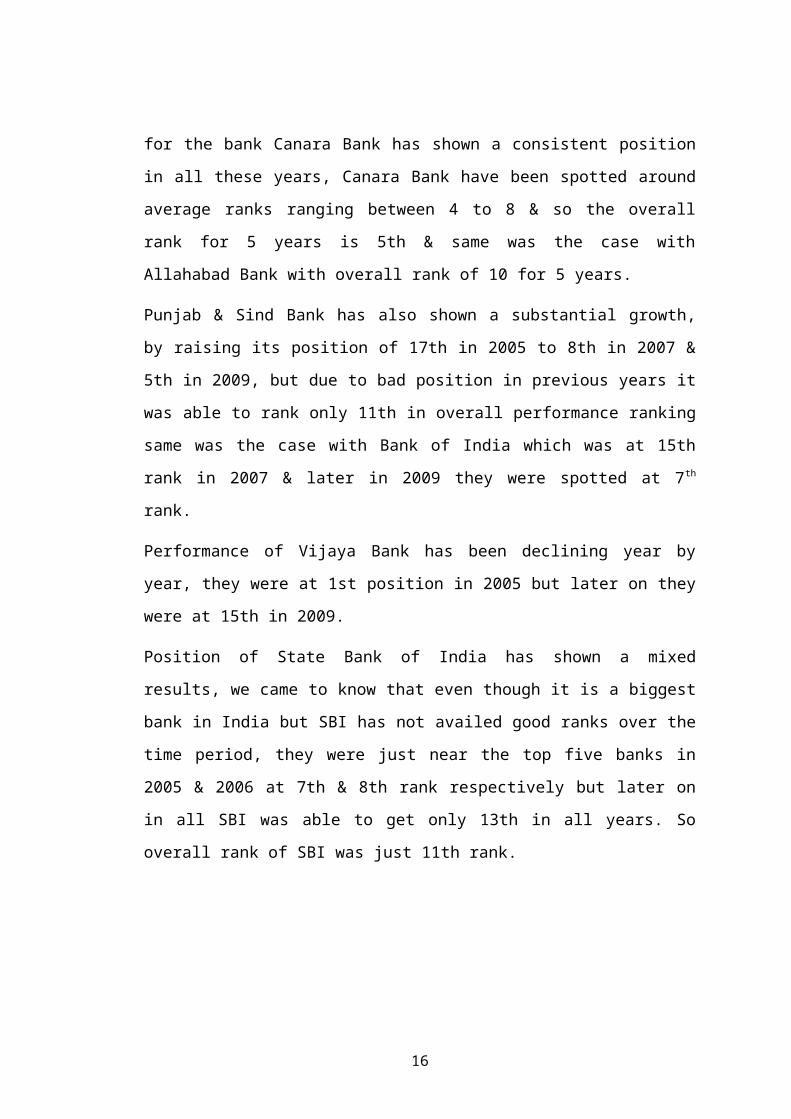
THE CAPITAL ADEQUACY RATIO FOR 3 MAJOR PRIVATE BANKS IN
INDIA
Particulars 2004 2005 2006 2007 2008
ICICI Bank 10.36% 11.78% 13.35% 11.69% 13.97%
HDFC Bank 11.66% 12.16% 11.40% 13.08% 13.73%
AXIS Bank 11.21% 12.66% 11.08% 11.57% 13.99%
INTERPRETATIONS:-
Reserve Bank of India prescribes Banks to maintain a minimum Capital to risk-
weighted Assets Ratio (CRAR) of 9 percent with regard to credit risk, market risk and
operational risk on an ongoing basis, as against 8 percent prescribed in Basel
Documents. Capital adequacy ratio of the ICICI Bank, was well above the industry
average of 13.97% t.CAR of HDFC bank is below the ratio of ICICI bank. HDFC
Bank’s total Capital Adequacy stood at 13.6% as of March 31, 2008. The Bank
adopted the Basel 2 framework as of March 31, 2009 and the CAR computed as per
Basel 2 guidelines stands higher against the regulatory minimum of 9.0%.And the
capital adequacy ratio of Axis bank is the highest among the three banks and it is
12
above the industry average, which shows the improvement from the last 5 years.
Higher the ratio the banks are in a comfortable position to absorb losses.
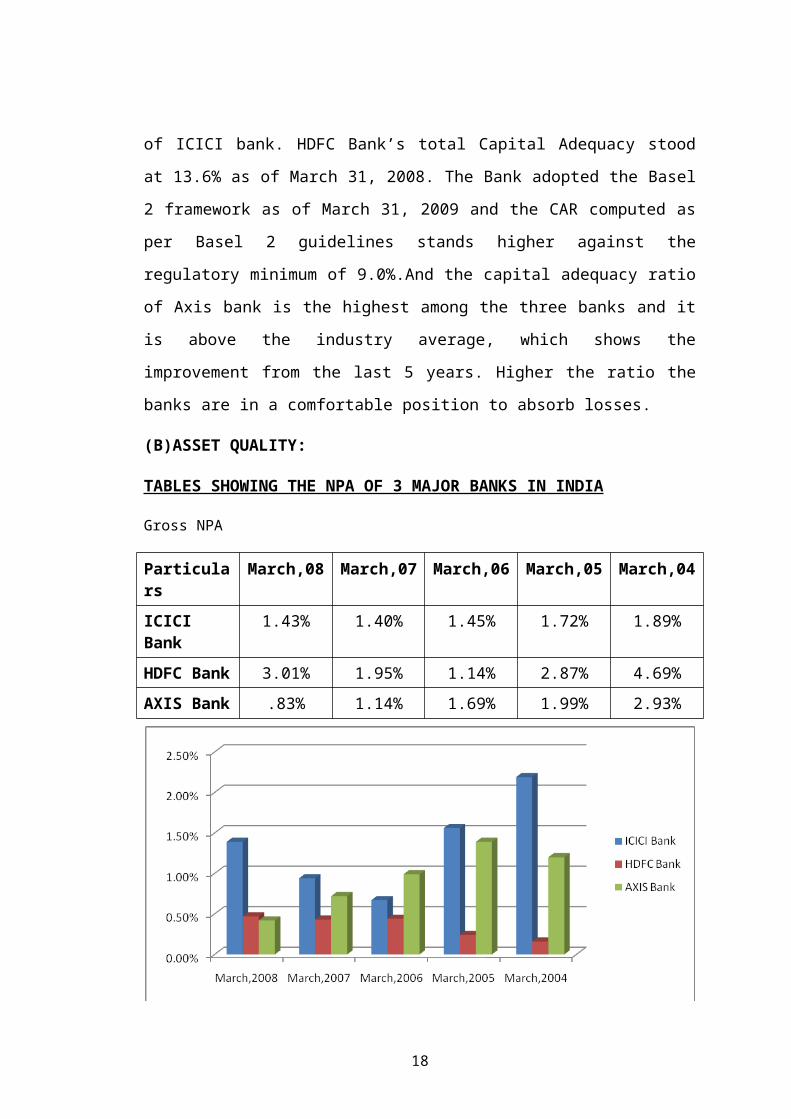
(B)ASSET QUALITY:
TABLES SHOWING THE NPA OF 3 MAJOR BANKS IN INDIA
Gross NPA
Particulars March,08 March,07 March,06 March,05 March,04
ICICI Bank 1.43% 1.40% 1.45% 1.72% 1.89%
HDFC Bank 3.01% 1.95% 1.14% 2.87% 4.69%
AXIS Bank .83% 1.14% 1.69% 1.99% 2.93%
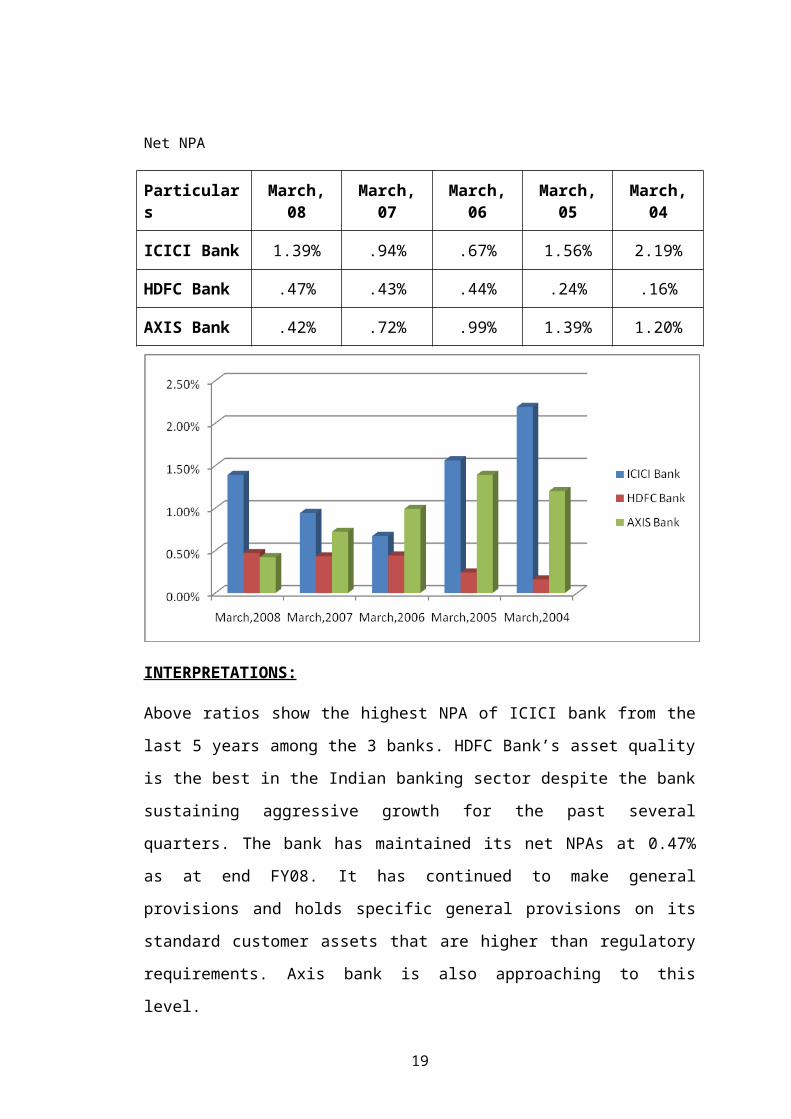
Net NPA
Particulars March, 08 March, 07 March, 06 March, 05 March, 04
ICICI Bank 1.39% .94% .67% 1.56% 2.19%
HDFC Bank .47% .43% .44% .24% .16%
AXIS Bank .42% .72% .99% 1.39% 1.20%
13
INTERPRETATIONS:
Above ratios show the highest NPA of ICICI bank from the last 5 years among the 3
banks. HDFC Bank’s asset quality is the best in the Indian banking sector despite the
bank sustaining aggressive growth for the past several quarters. The bank has
maintained its net NPAs at 0.47% as at end FY08. It has continued to make general
provisions and holds specific general provisions on its standard customer assets that
are higher than regulatory requirements. Axis bank is also approaching to this level.
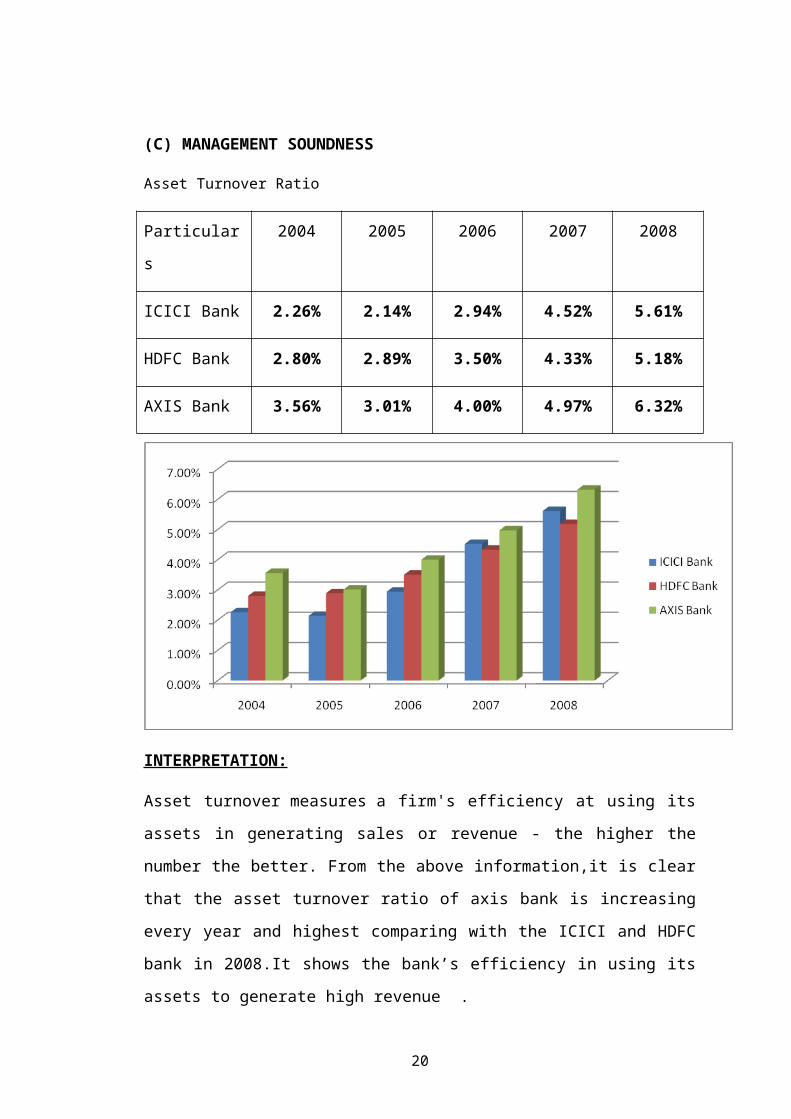
(C) MANAGEMENT SOUNDNESS
Asset Turnover Ratio
Particulars 2004 2005 2006 2007 2008
ICICI Bank 2.26% 2.14% 2.94% 4.52% 5.61%
HDFC Bank 2.80% 2.89% 3.50% 4.33% 5.18%
AXIS Bank 3.56% 3.01% 4.00% 4.97% 6.32%
14
INTERPRETATION:
Asset turnover measures a firm's efficiency at using its assets in generating sales or
revenue - the higher the number the better. From the above information,it is clear that
the asset turnover ratio of axis bank is increasing every year and highest comparing
with the ICICI and HDFC bank in 2008.It shows the bank’s efficiency in using its
assets to generate high revenue .
15
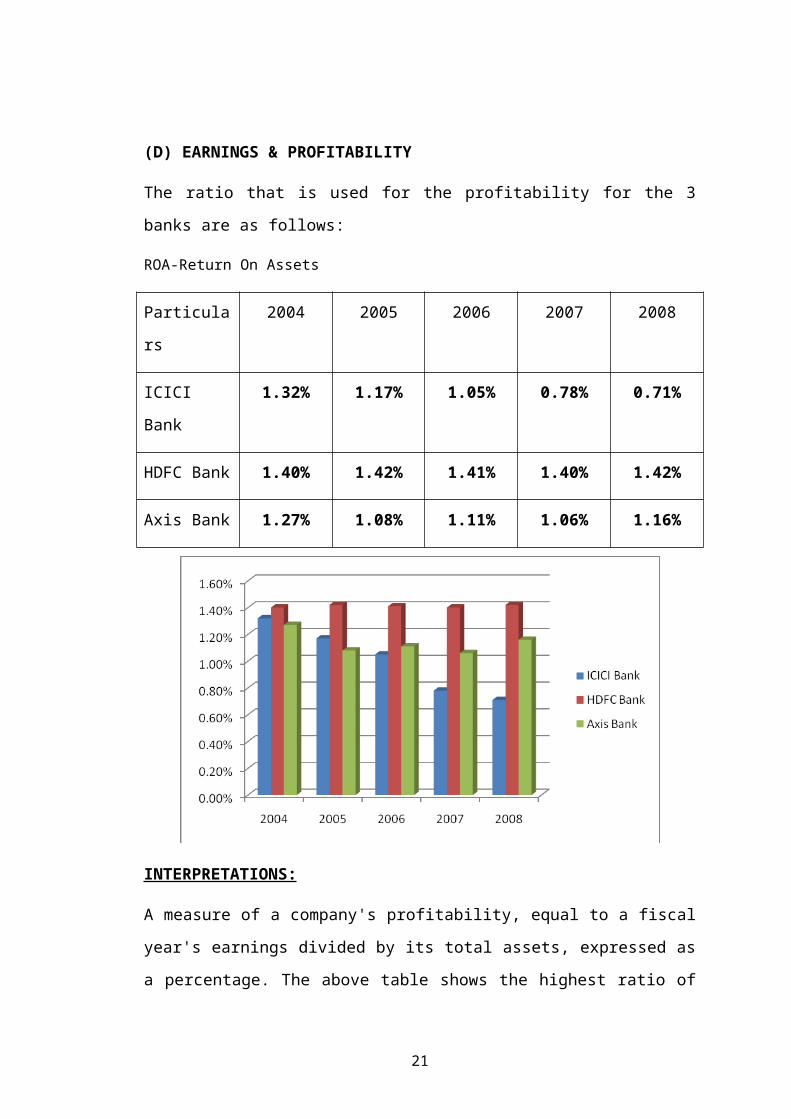
(D) EARNINGS & PROFITABILITY
The ratio that is used for the profitability for the 3 banks are as follows:
ROA-Return On Assets
Particulars 2004 2005 2006 2007 2008
ICICI Bank 1.32% 1.17% 1.05% 0.78% 0.71%
HDFC Bank 1.40% 1.42% 1.41% 1.40% 1.42%
Axis Bank 1.27% 1.08% 1.11% 1.06% 1.16%
INTERPRETATIONS:
A measure of a company's profitability, equal to a fiscal year's earnings divided by its
total assets, expressed as a percentage. The above table shows the highest ratio of
HDFC Bank for the last 5 years.ROA of ICICI bank is falling every year .And Axis
Bank has maintained almost the same level of the ratio for the last 5 years.
16
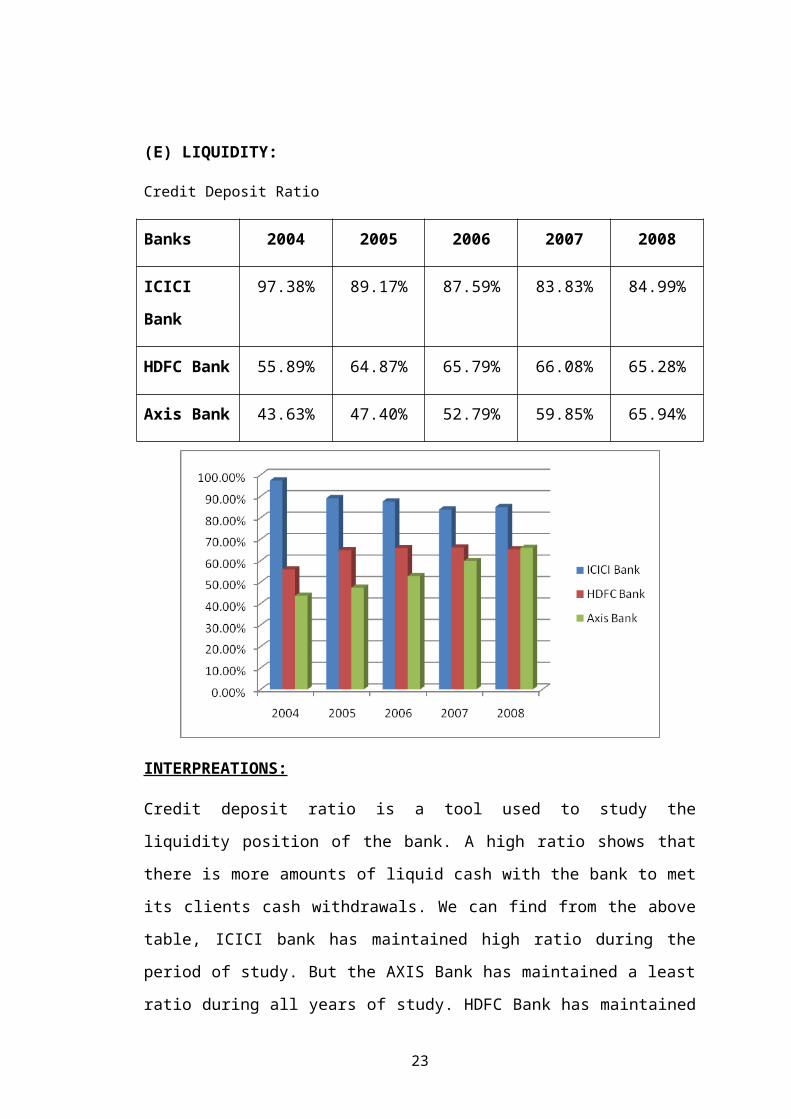
(E) LIQUIDITY:
Credit Deposit Ratio
Banks 2004 2005 2006 2007 2008
ICICI Bank 97.38% 89.17% 87.59% 83.83% 84.99%
HDFC Bank 55.89% 64.87% 65.79% 66.08% 65.28%
Axis Bank 43.63% 47.40% 52.79% 59.85% 65.94%
INTERPREATIONS:
Credit deposit ratio is a tool used to study the liquidity position of the bank. A high
ratio shows that there is more amounts of liquid cash with the bank to met its clients
cash withdrawals. We can find from the above table, ICICI bank has maintained high
ratio during the period of study. But the AXIS Bank has maintained a least ratio
during all years of study. HDFC Bank has maintained the cdr ratio lower than ICICI
but higher than Axis bank.But in 2008 CDR of Axis bank was more than HDFC bank.
17
FINDINGS, RECOMMENDATIONS & SUGGESTIONS
This study investigates the performance of the nationalized banks through the help of
the CAMEL model. For the purpose, a sample of 20 nationalized banks is taken. For
the CAMEL Analysis, the data of five years, i.e., from 2004-05 to 2008-09, has been
used. After making an analysis of the CAMEL parameters, all the banks were first
individually ranked for each ratio on a single parameter. Then the composite some of
each bank for each parameter was arrived at by taking an average of the individual
ranks achieved by the banks for each ratio in a single parameter. Then, all the banks
for each parameter were ranked in the proper order i.e., ascending/descending based
on the parameter.
According to the model, there are various parameters which tell us about the
performance of the banks in comparison to other banks. These parameters are
CCapital Adequacy, A- Asset Quality, M-management, E- Earnings and L- Liquidity.
There are various ratios in all of these parameters for example in Capital Adequacy
the various ratios are Capital Adequacy Ratio, Debt/Equity, Advances/Assets and
Government Securities/Investment.
The analysis was done, by calculating each of the ratios individually for the five
financial years and then ranking the banks on the basis of their performance in
comparison to other banks. Then, the ratios of the various parameters on a particular
year were combined with each year and group average was calculated. After that,
group rank was calculated which was again in comparison to other banks. When, all
the ratios of all the parameters of all the years were calculated, the next step was to
find the best performing bank for each year.
The ranks of all parameters of a year were combined and then a composite rank was
calculated. This process of calculating composite rank was repeated for all the next
financial years too. The composite rank was calculated by adding up the ranks of all
the parameters for that year and dividing by five. After that, again the banks were
ranked using the rank formula in Microsoft excel sheet, in comparison to other ranks.
Here, the bank which had the least composite average was the best and so was ranked
the best that is 1st.
18
Economic development of any country is mainly influenced by the growth of the
banking industry in that country. The banking industry has gone through innumerable
twists and turns in the post independence era. The banking industry in India is
growing at a fast pace. Increased economic activity coupled with de-regulation has
further strengthened the position of Indian bank. The growth has not been restricted to
any specific sector, all sectors (public sector, private sector and foreign) have shown
good growth.
CAMEL provides a measurement of a bank’s current overall financial, managerial,
and operational and compliance performance. It is a diagnostic model and
management tool that measures capital adequacy, asset quality, management, earnings
and liquidity of Financial Institutions. During the course of the rating procedure,
attention is focused on the financial strength and payment capacity of the Financial
Institution based on its historical trends, typically going back five years, and
compared against its peers.
Overall performance ranking table shows that Andhra Bank had scored the highest
average ranks with 3rd as least rank scored in 2005 & 2007. Indian Overseas bank
was able to rank 4th overall for five years, but they were able to get this position only
due to their 1st spot in two out of five years.
Bank of Baroda have shown a improving pattern in these years, they were spotted 17 th
in 2005 & they were able to improve its spot to 8th in 2009, which is a good point for
the bank, they were able to attain such a growth improving itself on all parameters of
CAMEL model.
Canara Bank has shown a consistent position in all these years, Canara Bank have
been spotted around average ranks ranging between 4 to 8 & so the overall rank for 5
years is 5th & same was the case with Allahabad Bank with overall rank of 10 for 5
years.
Punjab & Sind Bank has also shown a substantial growth, by raising its position of
17th in 2005 to 8th in 2007 & 5th in 2009, but due to bad position in previous years it
was able to rank only 11th in overall performance ranking same was the case with
Bank of India which was at 15th rank in 2007 & later in 2009 they were spotted at 7 th
rank.
19
Performance of Vijaya Bank has been declining year by year, they were at 1st
position in 2005 but later on they were at 15th in 2009. Decreasing Asset Quality
ratios & Management ratios were the main reason for the fall in their rank.
Position of State Bank of India has shown a mixed results, we came to know that even
though it is a biggest bank in India but SBI has not availed good ranks over the time
period, they were just near the top five banks in 2005 & 2006 at 7th & 8th rank
respectively but later on in all SBI was able to get only 13th in all years. So overall
rank of SBI was just 11th rank. Asset quality was the main are that has to be focused
by the SBI for improving its position.
In bottom five Central Bank of India was on the last position i.e. 20th rank, following
the other banks like Dena Bank, UCO, and United & Bank of Maharashtra.
The capital adequacy ratio of all the three private sector banks is above the minimum
requirements and above the industry average. HDFC Bank has maintained a standard
for the NPA’s in the period of 2004-2008. AXIS has shown remarkable decrease in
NPA’s in the same period. But the NPA of ICICI bank is increasing every year.
Professional approach that has been adopted by the banks in the recent past is in right
direction & also it is the right decision. HDFC has shown a good growth record for its
ROA. But ICICI Bank has gone down in its performance with negative growth.
AXIS’s performance has been average. Banks should maintain quality securities with
good liquidity to meet contingencies. ICICI Bank is fulfilling this requirement by
maintaining highest credit deposit ratio. All banks have ventured into many financial
areas and are in the league of Universal Banking. They have also become sensitive to
customer needs.
RECOMMENDATIONS:
Allahabad Bank need to improve its Earning, Liquidity position as they have
been ranked 10th on overall performance for 5 years, but these are the two
parameters were the bank is lacking.
Bank of Baroda & Bank of India both need to improve its investments in
government & approved securities, as this was the parameter where bank was
not able to outperform.
20
Bank of Maharashtra should decrease its debt equity ratio so as to attract new
investors & also decrease fixed charge on bank’s earnings.
Canara Bank should improve their advancing techniques, as they are lacking
in controlling their net NPAs & also all ratios considered under Earnings
parameter need be raised.
Corporation bank has shown a declining trend in its Capital adequacy ranks,
specially its Government securities to total assets ratio is very low, which also
reduced the liquidity. So we recommend Corporation bank to improve its
Government Securities holdings.
State Bank of India, which is the largest bank of Indian banking industry, is
performing good under the capital adequacy parameter in all years but the
main are of concern for the bank is the Asset quality & the Management where
they have been ranked 15th in Asset quality in all years & 11th in
Management. So we recommend the body to improve its NPAs position
In Punjab & Sind Bank, debt equity ratio is continuously rising over the years
which are not good so they have to increase equity or reduce debts in their
capital structure.
United Bank of India has comparatively less total advance to total asset ratio.
So, bank has to give more advances in order to earn more interest. But they
should have to also keep in mind the credit worthiness of the customers.
Indian Overseas Bank need to improve its asset quality ratio, as its rank has
been going down year by year, so they must make necessary arrangements to
make sure that they have lower NPAs or should work on more careful
advancing activities.
Vijaya Bank should improve its earning capacity ratios, as its operating profit
to average working fund is very low, which also hinders its management
quality. The Liquidity position of the bank has also not been so good, Vijaya
Bank need to increase its holdings in government securities.
The banks should adapt themselves quickly to the changing norms.
21

The system is getting internationally standardized with the coming of
BASELL II accords so the Indian banks should strengthen internal processes
so as to cope with the standards.
The banks should maintain a 0% NPA by always lending and investing or
creating quality assets which earn returns by way of interest and profits.
The banks should find more avenues to hedge risks as the market is very
sensitive to risk of any type.
Have good appraisal skills, system, and proper follow up to ensure that banks
are above the risk.
SUGGESTIONS FOR FURTHER RESEARCH
Research on which industries are best suited for the use of the CAMELS
Framework.
Research on how other variables can be added or how variables can be
selected to suit the industry needs.
Research on why the CAMELS Framework can not be used as a tool of
performance evaluation.
Websites Visited
http://www.stock-picks-focus.com/hdfc-bank.html
http://www.stock-picks-focus.com/axis-bank.html
http://www.stock-picks-focus.com/icici-bank.html
http://www.basel2implementation.com/pillars.htm
http://www.icicibank.com
http:// www.hdfcbank.com
http:// www.axisbank.com
http://www.allbankingsolutions.com/camels.htm
http://www.shkfd.com.hk/glossary/eng/RA.htm
"http://www.wikinvest.com/wiki/CAPITAL_ADEQUACY_RATIO"
22
http://www.answers.com/topic/basel-ii
http://chestofbooks.com/finance/banking/English-Manual/Chapter-I-The-
Origin-And-Uses-Of-Banks.html
http://www.allbankingsolutions.com/CAMEL.htm Accessed on 27/2/2010
23