static.cambridge.orgcambridge... · Web viewCorresponding author: MDM, [email protected] Fig S1. A...
20
Supplemental Information for Earliest direct evidence of monument building at the archaeological site of Nan Madol (Pohnpei, Micronesia) identified using 230 Th/U coral dating and geochemical sourcing of megalithic architectural stone Mark D. McCoy a , Helen A. Alderson b , Richard Hemi c , Hai Cheng d,e , and R. Lawrence Edwards e a Department of Anthropology, Southern Methodist University, Dallas, TX 75275, USA b Division of Archaeology, University of Cambridge, Downing Street, Cambridge, CB2 3DZ, UK c School of Surveying, University of Otago, PO Box 56, Dunedin 9054, New Zealand d Institute of Global Environmental Change, Xi’an Jiaotong University, Xi’an 710049, China e Department of Earth Sciences, University of Minnesota, Minneapolis, MN 55455, USA Corresponding author: MDM, [email protected]
Transcript of static.cambridge.orgcambridge... · Web viewCorresponding author: MDM, [email protected] Fig S1. A...

Supplemental Information for
Earliest direct evidence of monument building at the archaeological site of Nan Madol (Pohnpei, Micronesia) identified using 230Th/U coral dating and geochemical sourcing of megalithic architectural stone
Mark D. McCoy a, Helen A. Alderson b, Richard Hemi c, Hai Cheng d,e, and R. Lawrence Edwards e
a Department of Anthropology, Southern Methodist University, Dallas, TX 75275, USAb Division of Archaeology, University of Cambridge, Downing Street, Cambridge, CB2 3DZ, UKc School of Surveying, University of Otago, PO Box 56, Dunedin 9054, New Zealandd Institute of Global Environmental Change, Xi’an Jiaotong University, Xi’an 710049, China e Department of Earth Sciences, University of Minnesota, Minneapolis, MN 55455, USA
Corresponding author: MDM, [email protected]
Fig S1. A simplified plan view map of Nandauwas Islet (H-113) showing locations (A to J) where architectural stones (S-) were assayed by pXRF. Black areas are freestanding walls, gray are coral-filled terraces and platforms, and white squares represent tomb vaults.
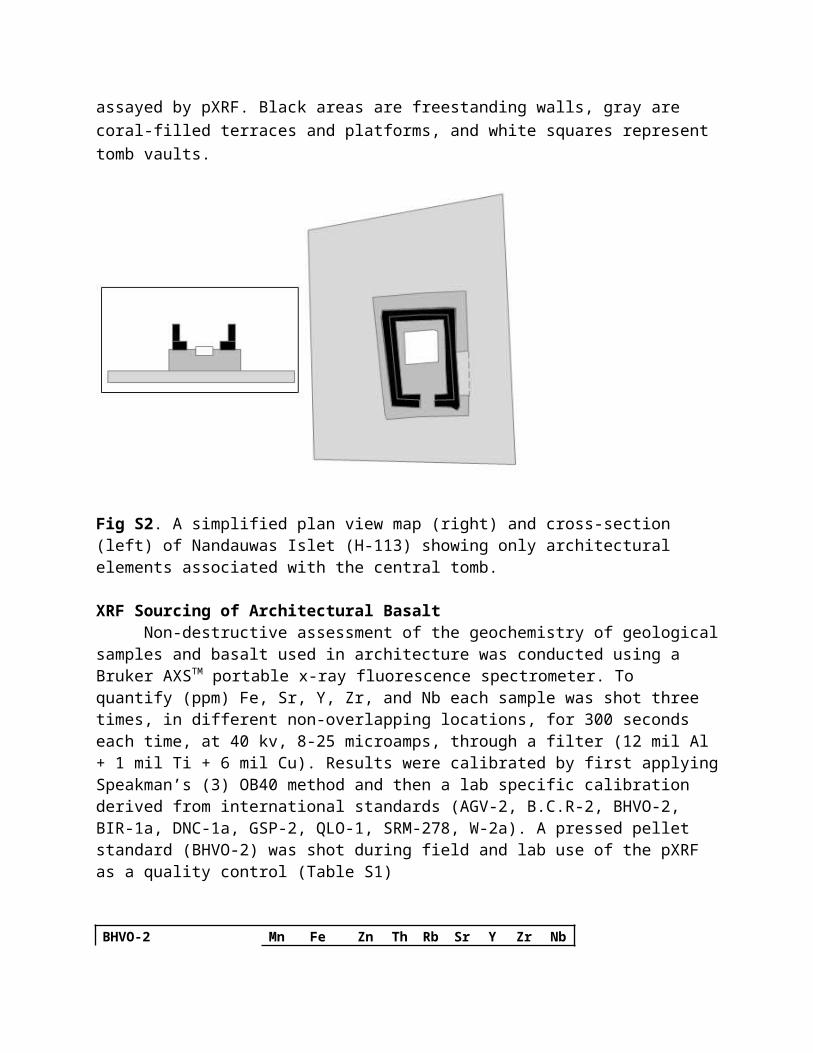
Fig S2. A simplified plan view map (right) and cross-section (left) of Nandauwas Islet (H-113) showing only architectural elements associated with the central tomb.
Fig S3. Example of how architectural basalt was recorded in the field.
Fig S4. Experimentally derived relative standard deviation (RSD, %) demonstrated the number of times a sample should be assayed to produce optimal results. Elements Zr, Nb shown.
Fig S5. To test for the effects of weathering on pXRF samples of Pohnpei basalts were assayed on the weathered surface (left), then ground down (0.5mm), and assayed again, to a depth of 5.0 mm (right).
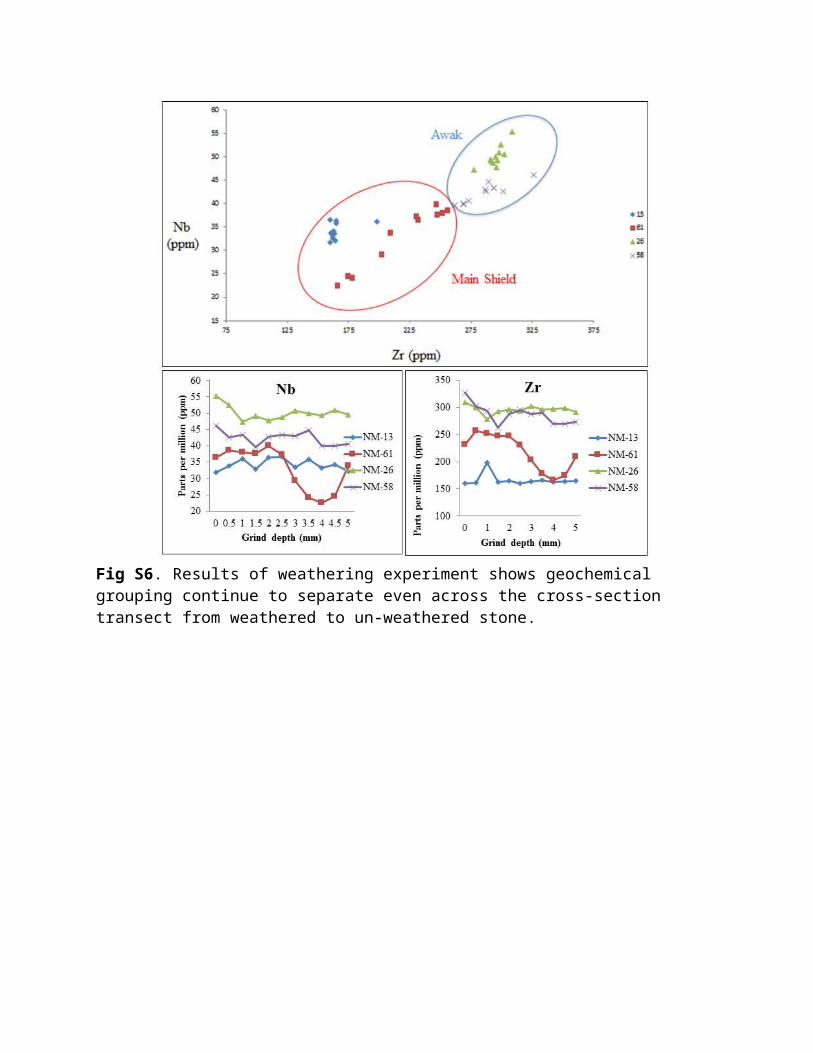
Fig S6. Results of weathering experiment shows geochemical grouping continue to separate even across the cross-section transect from weathered to un-weathered stone.
Fig S7. Geochemical groupings of geological and archaeological samples of basalt in this study.
Fig S8. PCA of all Awak aged samples showing grouping of architectural samples with PM geological samples.
Fig S9. Coral samples after having been crush and hand sorted for uranium series dating.
Fig S10. Cross-section from 3D scan data of architecture to show locations of where coral samples were collected from central crypt.
Table S1. Quality control results on international standards BHVO-2 (Hawaiian basalt).
Table S2. Architectural stone samples discussed in McCoy and Athens (2012). Highlighted samples are those re-classified from Main Shield (MS) to Awak (AWK).
Table S3. Architectural basalt geochemically classified at Nan Madol.Table S4. Architectural basalt geochemically classified at Nan Madol. Islets are referred to here by their H- numbers (e.g., Nandauwas is H-113); an identification system that refers back to the original survey of the site and is described in detail in McCoy et al. (2015).Table S5. Results of uranium series dating.

Supplemental Data: Geochemical Results.
The research described here took place in three stages. In mid-2012, pre-fieldwork experiments were conducted to define a method of geochemical sourcing based on protocols set out in McCoy and Athens (2012). Next, field survey was conducted from 3 November to 20 December 2012 at the site of Nan Madol, Pohnpei, Federated States of Micronesia, referred to as the Nan Madol XRF Survey 2012 or NMXS12. After fieldwork was completed, coral samples were sent away for uranium series dating, with results completed mid-2013.
Terrestrial Lasers Scanning of Architecture at Nandauwas Islet, Nan MadolSurvey controls. Target base disks were either screwed into the trunks of solid trees, or
into wooden wedges that were then driven into gaps in the stones to provide fixed survey control points. The spheres have a strong magnet on the base which allowed us to start and finish on common points and also to create points that could be returned to with the sphere targets at a later stage. This was also necessary at the end of a day’s works to allow a return to the same control points. At this resolution sphere targets generally receive sufficient scanned measurements to provide an acceptable calculation of the control point coordinate. This is indicated by a green coloring of the sphere in the post-processing software (Scene, Faro).
The exterior wall required 24 scans going right around the islet with the scanner and interior scan, including the inner courtyard, took a further 32 scans. On some occasions the scanner was moved across the bordering canal to an adjoining islet where typically the distance to the wall got up to 20-25m. A scan resolution of 1/4 (or 6 mm in 10 m) was chosen for almost all scans primarily on consideration of the scan time. This was typically 7 minutes with an additional minute to collect images. When scanning the exterior the field of view was normally set to 180 degrees to capture data only on the wall side of the Faro Focus 3D Laser Scanner. While this reduces the amount of data it does not make a significant difference to the time of the scan.
Survey conditions. In Micronesia, heat and precipitation are a concern for operating survey equipment. In direct sunlight the instrument worked close to its maximum operating temperature, but never went into the orange or warning zone, indicated within the sensor menu. On a few occasions the scanner was used in light rain, but with a large umbrella over it. While this creates some noise directly above the instrument where the umbrella is scanned the actual scan data of the walls through the rain did not seem to be affected.
Construction phases. The immediate value of the 3D laser scan model for this project was in creating plan view and cross-sections of architecture in order to confirm the assignment of architectural stones to specific stages of islet construction. For example, Figure S1 is a simplified example of a plan view map where pXRF survey locations (A through J) representing groups of samples (S- identifications). We noted a high frequency of PM basalt on the islet and so needed to isolate only those locations that belonged to construction of the central tomb. Figure S2 shows a simplified plan view, and cross-section, of only those architectural elements on the islet that are associated with the tomb. This helped confirm that locations F, E, and C all belong the central tomb.

Fig S1. A simplified plan view map of Nandauwas Islet (H-113) showing locations (A to J) where architectural stones (S-) were assayed by pXRF. Black areas are freestanding walls, gray are coral-filled terraces and platforms, and white squares represent tomb vaults.
Fig S2. A simplified plan view map (right) and cross-section (left) of Nandauwas Islet (H-113) showing only architectural elements associated with the central tomb.
XRF Sourcing of Architectural BasaltNon-destructive assessment of the geochemistry of geological samples and basalt used in
architecture was conducted using a Bruker AXSTM portable x-ray fluorescence spectrometer. To quantify (ppm) Fe, Sr, Y, Zr, and Nb each sample was shot three times, in different non-

overlapping locations, for 300 seconds each time, at 40 kv, 8-25 microamps, through a filter (12 mil Al + 1 mil Ti + 6 mil Cu). Results were calibrated by first applying Speakman’s (3) OB40 method and then a lab specific calibration derived from international standards (AGV-2, B.C.R-2, BHVO-2, BIR-1a, DNC-1a, GSP-2, QLO-1, SRM-278, W-2a). A pressed pellet standard (BHVO-2) was shot during field and lab use of the pXRF as a quality control (Table S1)
BHVO-2 Mn Fe Zn Th Rb Sr Y Zr NbUSGS recommended 1290 78144 103 1.2 9.8 389 26 172 18
Otago n=7 (8microamps)1308 69572 150 4 11 385 24 162 16
Standard deviation158 2573 77 4 2 25 2 11 3
Otago n=9 (25 microamps)1362 80640 99 2 13 405 26 176 19
Standard deviation173 3743 8 3 2 23 2 10 2
Table S1. Quality control results on international standards BHVO-2 (Hawaiian basalt).
Fig S3. Example of how architectural basalt was recorded in the field.
Accuracy. Potts et al. (1997) illustrated that greater accuracy in pXRF could be achieved by assessing stones in several different places and averaging the result. In light of this, we shot 48 samples of Nan Madol basalt that were used by McCoy and Athens (2012) in their study. The
samples were assayed ten times each – five on the weathered side and five on the unweathered side. There is a diminishing return in the amount of error minimized after assaying a sample more than three times (Fig. S2). Thus, we reduced the error in reading the samples’ geochemical composition from 8% (one XRF assay per sample) to 3% with three shots were taken and their results averaged.
Precision. Chemical weathering processes can compromise the precision and impact assigning basalt to source. Potts et al. (2006) conducted an experiment aimed at testing the impact that chemical weathering has on our ability to geochemically source stones which we re-created using four Pohnpei basalt samples. These included a representative sample was chosen from each columnar basalt source geochemically characterised by McCoy and Athens (2012) - Awak, Main Shield Subgroup 1, Main Shield Subgroup 2, and Main Shield Subgroup 3. By grinding down through the cortex of each sample, in 0.5mm layers, and irradiating the stones each time, we assessed how weathering affects element concentrations in the Pohnpeian basalts (Figs. S3, Fig. S4).
The results of the precision experiment showed that weathering did effect the chemical composition of Pohnpeian basalts. Nevertheless, it was ascertained that this was not to such an extent that it would be detrimental to geochemically sourcing the basalts. For example, while in two of the samples, iron (Fe) and strontium (Sr) are mobile, niobium (Nb) and zirconium (Zr) are stable enough for accurate geochemical sourcing at all layers. This means that when focusing on niobium (Nb) and zirconium (Zr) ppm, sources are still distinguishable from one another.
Assigning Basalt to Source. Using the improved methodology for quantifying key elements developed from the above experiments, the samples originally sourced by McCoy and Athens (2012) were re-examined (Fig. S5). A two-step cluster analysis of Main Shield stone samples illustrated that the in-group variation identified by McCoy and Athens (2012) was likely due to weathering. The first results confirmed that the majority of the samples, 42 of 48, were correctly assigned with weathering adversely impacting a small number of the previous classifications (identification numbers, NM-). As a result, six samples of architectural stone were reclassified, as was one geological sample: Q3. In all cases the stones were reclassified as Awak-aged basalts.
NM-ID
Geological Age
McCoy and Athens (2)
MS Sub
2 MS MS 33 AWK MS 14 MS MS 35 AWK MS 16 MS MS 17 MS MS 19 KUP KUP
10 MS MS 211 KUP KUP12 KUP KUP13 MS MS 2

14 KUP KUP15 MS MS 216 KUP KUP17 KUP KUP18 KUP KUP19 MS MS 120 MS MS 121 MS MS 122 MS MS 123 MS MS 125 MS MS 126 AWK AWK27 MS MS 129 MS MS 130 AWK AWK50 KUP KUP51 MS MS 152 MS MS 153 AWK MS 154 MS MS 155 MS MS 156 MS MS 157 MS MS 158 AWK MS 159 AWK MS 160 AWK MS 161 MS MS 362 MS MS 163 MS MS 164 MS MS 265 MS MS 166 MS MS 167 MS MS 368 MS MS 169 MS MS 170 MS MS 271 MS MS 1
Table S2. Architectural stone samples discussed in McCoy and Athens (2012). Highlighted samples are those re-classified from Main Shield (MS) to Awak (AWK).
Second, the reclassification of geological sample Q3 from the volcanic plug Pwisehn Malek as Awak, and a new geological sample from PM collected in 2012 (DP2), helped lead to the discovery that PM is the likely source of all Awak aged samples found at Nan Madol. This

was initially based on examining a bivariate plot of the niobium and zirconium parts per million (ppm), and confirmed using a PCA based on the five elements that can be measured with the greatest level of confidence (Fe, Sr, Y, Zr, Nb) (Fig S8).
Table S3 and Table S4 give a summary of stone matched to source. Readers are referred to Alderson (2013) and McCoy (2012) for full results of pXRF survey of Nan Madol.
MSAWK (PM) KUP Total
Islets Outside Nandauwas 93 14 8 115Nandauwas Islet 75 26 5 106
168 40 13 221
Table S3. Architectural basalt geochemically classified at Nan Madol.
IsletMS
AWK (PM)
KUP
H009 2 1 3H033 19 1 20H039 4 1 5H043 7 2 9H049 5 5H050 5 2 7H055 12 2 14H093 3 3H098 8 2 10H101 4 1 5H103 2 3 5H103-H104 3 2 5H104 5 5H110 1 1
H113 75 26 5106
H119 1 2 3
H122 3 1 4
H129 10 1 11168 40 13
221
Table S4. Architectural basalt geochemically classified at Nan Madol. Islets are referred to here by their H- numbers (e.g., Nandauwas is H-113); an identification system that refers back to the original survey of the site and is described in detail in McCoy et al. (2015).

Fig S4. Experimentally derived relative standard deviation (RSD, %) demonstrated the number of times a sample should be assayed to produce optimal results. Elements Zr, Nb shown.
Fig S5. To test for the effects of weathering on pXRF samples of Pohnpei basalts were assayed on the weathered surface (left), then ground down (0.5mm), and assayed again, to a depth of 5.0 mm (right).

Fig S6. Results of weathering experiment shows geochemical grouping continue to separate even across the cross-section transect from weathered to un-weathered stone.

Fig S7. Geochemical groupings of geological and archaeological samples of basalt in this study.
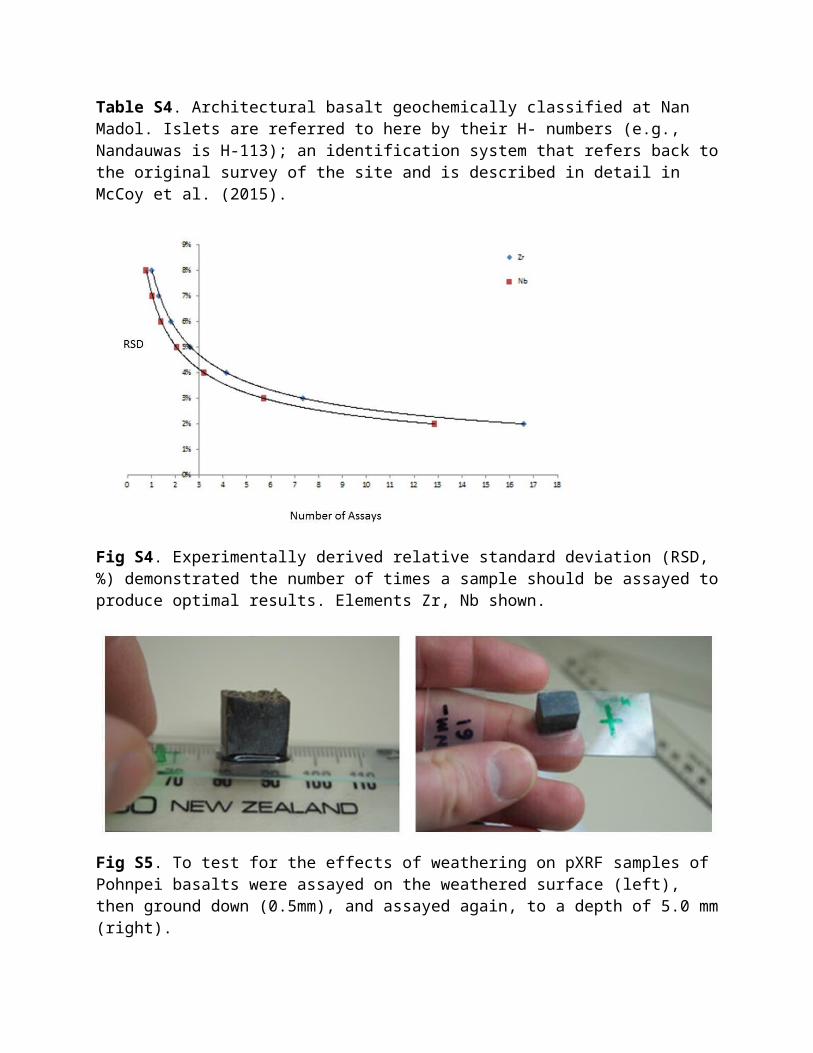
Fig S8. PCA of all Awak aged samples showing grouping of architectural samples with PM geological samples.
Coral Building MaterialOut of 37 examples of branch coral used as building material we chose 5 for dating to
represent different architectural elements of Nandauwas (Fig. S7). The central tomb is represented by a sample collected from a lower course of the wall enclosing the tomb (C-1), and a sample representing the fill material within the crypt itself (C-13) (Fig S10). The northern tomb was represented by a sample from the interior of its west wall (C-18). The southern tomb was represented by a sample from its east wall (C-19). The large exterior wall around Nandauwas was represented by a sample from its lower half (C-24). Samples C-1, C-13, and C-18 produced excellent results on clean, white samples, whereas high detritus content produced poor results for C-19 and C-24.
Our strategy of dating single samples from construction-fill in most cases returned results that were fossil corals (3 out of 5) that pre-date the target event. In a similar study, Richards et al.
(2015) found most coral used in construction fill at the site of Lelu (Leluh) were fossil corals but that corals likely harvested live for construction were also clearly present.
The 230Th dating work was performed at the Isotope Laboratory, Xi’an Jaiotong University using multi-collector inductively coupled plasma mass spectrometers (MC-ICP-MS) (Thermo-Finnigan Neptune-plus). We use standard chemistry procedures to separate uranium and thorium for dating (Edwards et al. 1987). Calcite checks on these geologically young samples were deemed unnecessary (Edwards et al. 1988). A triple-spike (229Th–233U–236U) isotope dilution method was employed to correct for instrumental fractionation and determine U/Th isotopic ratios and concentrations. The instrumentation, standardization and half-lives are reported in Cheng et al. (2000), Cheng et al. (2013), and Shen et al. (2012). All U/Th isotopes were measured on a MasCom multiplier behind the retarding potential quadrupole in the peak-jumping mode. We followed similar procedures of characterizing the multiplier as described in Cheng et al. (2000). Uncertainties in U/Th isotopic data were calculated offline at 2σ level, including corrections for blanks, multiplier dark noise, abundance sensitivity, and contents of the same nuclides in spike solution. Corrected 230Th ages assume the initial 230Th/232Th atomic ratio of 4.4 ±2.2 x10⁻⁶, the values for a material at secular equilibrium with the bulk earth 232Th/238U value of 3.8. The U decay constants are reported in Cheng et al (2013).

230Th dating results. The error is 2 error.Sample 238U 232Th 230Th / 232Th 234U* 230Th / 238U 230Th Age (yr) 230Th Age (yr) 234UInitial** 230Th Age (yr
BP)***Number (ppb) (ppt) (atomic x10-6) (measured) (activity) (uncorrected) (corrected) (corrected) (corrected )
C-1 2641±3 32 ±6 11862 ±2249 144.5
±1.4 0.0087 ±0.0001 834 ±7 834 ±7
144.8 ±1.4 771 ±7
C-13 2907±4 65 ±6 6258 ±580 143.7
±1.7 0.0085 ±0.0001 811 ±6 810 ±6
144.0 ±1.7 747 ±6
C-18 3515±6 90 ±7 13006 ±970 144.9
±1.8 0.0203 ±0.0001 1947 ±8 1947 ±8
145.7 ±1.8 1884 ±8
C-19 2506±3 38240 ±767 18 ±0 144.6
±1.6 0.0166 ±0.0001 1595 ±8 1207 ±275
145.0 ±1.6 1144 ±275
C-24 2771±5 6444 ±130 75 ±2 144.7
±1.9 0.0105 ±0.0001 1007 ±11 948 ±43
145.1 ±1.9 885 ±43
U decay constants: 238 = 1.55125x10⁻¹⁰ (Jaffey et al., 1971) and234 = 2.82206x10⁻⁶ (Cheng et al., 2013). Th decay constant: 230 = 9.1705x10⁻⁶ (Cheng et al., 2013).
*234U = ([234U/238U]activity – 1)x1000. ** 234Uinitial was calculated based on 230Th age (T), i.e., 234Uinitial = 234Umeasured x e234xT.
Corrected 230Th ages assume the initial 230Th/232Th atomic ratio of 4.4 ±2.2 x10⁻⁶. Those are the values for a material at secularequilibrium, with the bulk earth 232Th/238U value of 3.8. The errors are arbitrarily assumed to be 50%.***B.P. stands for “Before Present” where the “Present” is defined as the year 1950 A.D.
Table S5. Results of uranium series dating.

Fig S9. Coral samples after having been crush and hand sorted for uranium series dating.
Fig S10. Cross-section from 3D scan data of architecture to show locations of where coral samples were collected from central crypt.

References
Cheng, H., Edwards, R.L., Hoff, J., Gallup, C.D., Richards, D.A., Asmerom, Y. 2000. The half-lives of U-234 and Th-230. Chem. Geol. 169, 17–33.
Cheng, H., Edwards, R.L., Shen, C-C., Polyak, V.J., Asmerom, Y., Woodhead, J., Hellstrom, J., Yongjin, W., Xinggong, K., Spötl, C., Wang, X., Alexander, E.C. 2013. Improvements in 230Th dating, 230Th and 234U half-life values, and U–Th isotopic measurements by multi-collector inductively coupled plasma mass spectrometry. Earth and Planetary Science Letters 371-372:82-91.
Edwards, R. L., Chen, J. H., Wasserburg, G. J. 1987. 238U, 234U, 230Th, 232Th systematics and the precise measurement of time over the past 500,000 years. Earth Planet. Sci. Lett. 81, 175–192.
Edwards, R.L., Taylor, F.W., Wasserburg, G.J. 1988. Dating earthquakes with high-precision thorium-230 ages of very young corals. Earth and Planetary Science Letters 90:371-381.
McCoy, M.D. 2012. The origins and megalithic architecture Nan Mado, Pohnpei, Federated States of Micronesia. Report on file with the Historic Preservation Office, Kolonia, Pohnpei.
McCoy, M.D., Alderson, H.A., Thompson, A. 2015. A new archaeological field survey of the site of Nan Madol, Pohnpei. Rapa Nui Journal 29(1):5-22.
McCoy, M.D., Athens, J.S. 2012. Sourcing the Megalithic Stones of Nan Madol: an XRF Study of Architectural Basalt Stone from Pohnpei, Federated States of Micronesia. Journal Pacific Archaeology 3(1):105-114.
Potts, P.J., Bernardini, F., Jones, M.C., Williams-Thorpe, O., Webb, P.C. 2006. Effects of weathering on in situ portable X-ray fluorescence analyses of geological outcrops: dolerite and rhyolite outcrops from the Preseli Mountains, South Wales. X-Ray Spectrometry 35: 8-18.
Potts, P.J., Williams-Thorpe, O., Webb, P.C. 1997. The bulk analysis of silicate rocks by portable X‐ray fluorescence: effect of sample mineralogy in relation to the size of the excited volume. Geostandards Newsletter 21(1): 29-41.
Richards, Z.T., Shen, C-C., Hobbs, J-PA., Wu, C-C., Jiang, X., Beardsley, F. 2015. New precise dates for the ancient and sacred coral pyramidal tombs of Leluh (Kosrae, Micronesia) Sci Adv 1, e1400060.
Shen, C-C., Wu, C-C., Cheng, H., Edwards, R.L., Hsieh, Yu-Te, Gallet, S.G., Chang, C-C., Li, T-Y, Lam, D.D., Kano, A., Hori, M., Spötl, C. 2012. High-precision and high-resolution carbonate 230Th dating by MC-ICP-MS with SEM protocols. Geochimica et Cosmochimica Acta 99:71-86.
Speakman, R.J. 2012. Evaluation of Bruker's Tracer Family Factory Obsidian Calibration for Handheld Portable XRF Studies of Obsidian. Report prepared for Bruker AXS, Kennewick, WA. Available: http://www.bruker-axs.com/fileadmin/user_upload/PDFse/handhelds/Bruker_Obsidian_Report.pdf