Cambridge International Examinations Cambridge ... International... · You may use an HB pencil for...
20
This document consists of 18 printed pages, 2 blank pages and 1 Insert. DC (LEG/CGW) 99249/6 © UCLES 2015 [Turn over Cambridge International Examinations Cambridge International General Certificate of Secondary Education *5087193705* GEOGRAPHY 0460/41 Paper 4 Alternative to Coursework October/November 2015 1 hour 30 minutes Candidates answer on the Question Paper. Additional Materials: Calculator Ruler READ THESE INSTRUCTIONS FIRST Write your Centre number, candidate number and name in the spaces provided. Write in dark blue or black pen. You may use an HB pencil for any diagrams or graphs. Do not use staples, paper clips, glue or correction fluid. DO NOT WRITE IN ANY BARCODES. Write your answer to each question in the space provided. If additional space is required, you should use the lined pages at the end of this booklet. The question number(s) must be clearly shown. Answer all questions. The Insert contains Figs 1 and 2, Photographs A and B and Table 2 for Question 1, and Figs 6 and 9 and Tables 4, 5, 6 and 7 for Question 2. The Insert is not required by the Examiner. Sketch maps and diagrams should be drawn whenever they serve to illustrate an answer. At the end of the examination, fasten all your work securely together. The number of marks is given in brackets [ ] at the end of each question or part question. The syllabus is approved for use in England, Wales and Northern Ireland as a Cambridge International Level 1/Level 2 Certificate.
Transcript of Cambridge International Examinations Cambridge ... International... · You may use an HB pencil for...
This document consists of 18 printed pages, 2 blank pages and 1 Insert.
DC (LEG/CGW) 99249/6© UCLES 2015 [Turn over
Cambridge International ExaminationsCambridge International General Certificate of Secondary Education
*5087193705*
GEOGRAPHY 0460/41
Paper 4 Alternative to Coursework October/November 2015
1 hour 30 minutes
Candidates answer on the Question Paper.
Additional Materials: Calculator Ruler
READ THESE INSTRUCTIONS FIRST
Write your Centre number, candidate number and name in the spaces provided.Write in dark blue or black pen.You may use an HB pencil for any diagrams or graphs.Do not use staples, paper clips, glue or correction fluid.DO NOT WRITE IN ANY BARCODES.
Write your answer to each question in the space provided.If additional space is required, you should use the lined pages at the end of this booklet. The question number(s) must be clearly shown.
Answer all questions.
The Insert contains Figs 1 and 2, Photographs A and B and Table 2 for Question 1, and Figs 6 and 9 and Tables 4, 5, 6 and 7 for Question 2.The Insert is not required by the Examiner.Sketch maps and diagrams should be drawn whenever they serve to illustrate an answer.
At the end of the examination, fasten all your work securely together.The number of marks is given in brackets [ ] at the end of each question or part question.
The syllabus is approved for use in England, Wales and Northern Ireland as a Cambridge International Level 1/Level 2 Certificate.

2
0460/41/O/N/15© UCLES 2015
1 A class of students studied the Bradshaw model. This geographical model describes how a river’s characteristics vary between the upper course and lower course of a river. The model is shown in Fig. 1 (Insert).
Different groups of students in the class chose to investigate different aspects of the model. One group of six students chose the following hypotheses.
Hypothesis 1: The gradient (angle of slope) of the river bed decreases downstream.
Hypothesis 2: Load particle size decreases downstream.
Load particle size is a measurement of the size of individual particles carried by the river.
The students chose three sites to do their fieldwork at different distances downstream from the river source. The sites are shown in Fig. 2 (Insert).
(a) To collect data for Hypothesis 1 the students measured the angle of slope of the river bed using a clinometer, ranging poles and measuring tape. This method is shown in Photograph A (Insert).
(i) Describe how the students measured the angle of slope of the river bed.
...........................................................................................................................................
...........................................................................................................................................
...........................................................................................................................................
...........................................................................................................................................
...........................................................................................................................................
...........................................................................................................................................
...........................................................................................................................................
.......................................................................................................................................[4]
(ii) One student in the group then used a digital clinometer ‘app’ on his mobile phone to check the accuracy of the measurements. The digital clinometer is shown in Photograph B (Insert).
Suggest one advantage and one disadvantage of a digital clinometer compared with a traditional clinometer.
Advantage
...........................................................................................................................................
...........................................................................................................................................
Disadvantage
...........................................................................................................................................
.......................................................................................................................................[2]

3
0460/41/O/N/15© UCLES 2015 [Turn over
(iii) Each of the six students measured the angle of slope at the three sites. The results of their measurements are shown in Table 1 below.
Table 1
Angle of slope measurements
Site Angle measurement (degrees)
Student A
Student B
Student C
Student D
Student E
Student F
Average
1 18 4 19 16 18 15 17.2
2 9 13 10 12 18 12 11.2
3 7 5 5 4 8 6
The group decided to exclude the results of student B at site 1 and student E at site 2 from their analysis. Explain why they made this decision.
...........................................................................................................................................
...........................................................................................................................................
...........................................................................................................................................
.......................................................................................................................................[2]
(iv) Calculate the average angle of slope at site 3. Write your answer in Table 1. [1]

4
0460/41/O/N/15© UCLES 2015
(v) The students then plotted the results for each site on a graph, Fig. 3 below. Plot the average angle calculated in (a)(iv) on Fig. 3. [1]
0
1
2
site1
upstream downstream
site2
site3
3
4
5
6
7
8
9
10
Key
measurementaverage angle
measuredangle
(degrees)
measuredangle
(degrees)
11
12
13
14
15
16
17
18
19
20
0
1
2
3
4
5
6
7
8
9
10
11
12
13
14
15
16
17
18
19
20
Fig. 3
5
0460/41/O/N/15© UCLES 2015 [Turn over
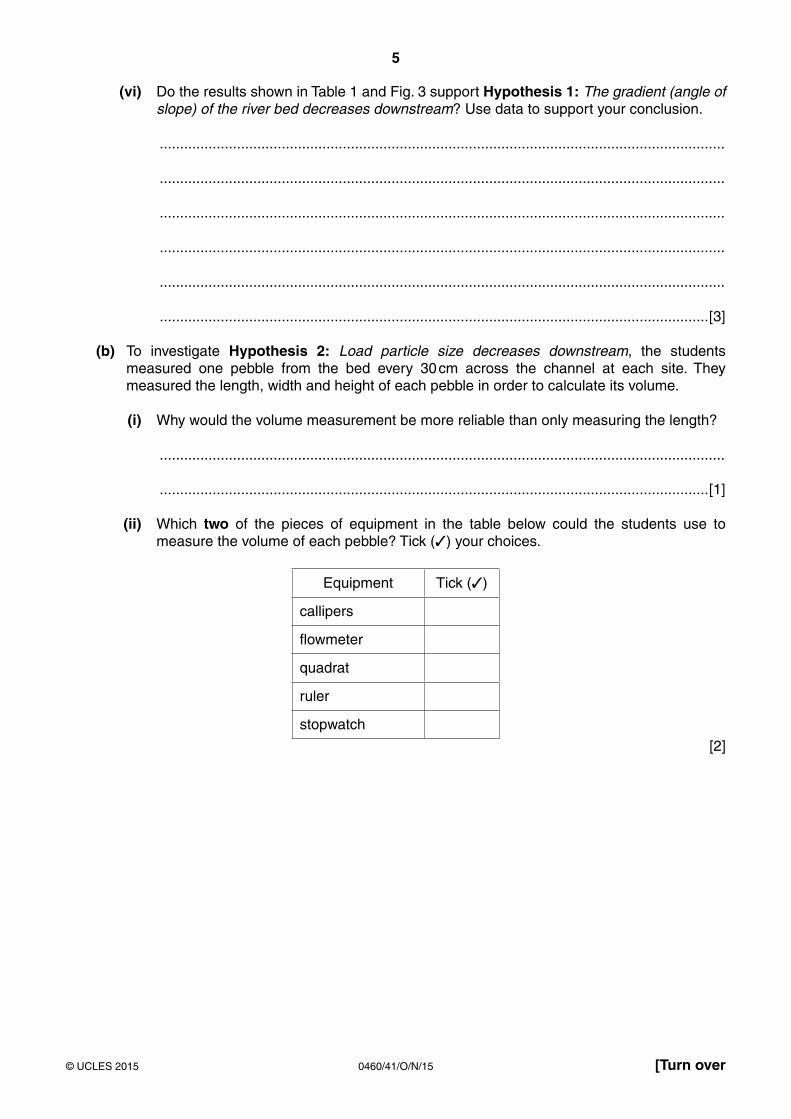
(vi) Do the results shown in Table 1 and Fig. 3 support Hypothesis 1: The gradient (angle of slope) of the river bed decreases downstream? Use data to support your conclusion.
...........................................................................................................................................
...........................................................................................................................................
...........................................................................................................................................
...........................................................................................................................................
...........................................................................................................................................
.......................................................................................................................................[3]
(b) To investigate Hypothesis 2: Load particle size decreases downstream, the students measured one pebble from the bed every 30 cm across the channel at each site. They measured the length, width and height of each pebble in order to calculate its volume.
(i) Why would the volume measurement be more reliable than only measuring the length?
...........................................................................................................................................
.......................................................................................................................................[1]
(ii) Which two of the pieces of equipment in the table below could the students use to measure the volume of each pebble? Tick (✓) your choices.
Equipment Tick (✓)
callipers
flowmeter
quadrat
ruler
stopwatch
[2]
6
0460/41/O/N/15© UCLES 2015
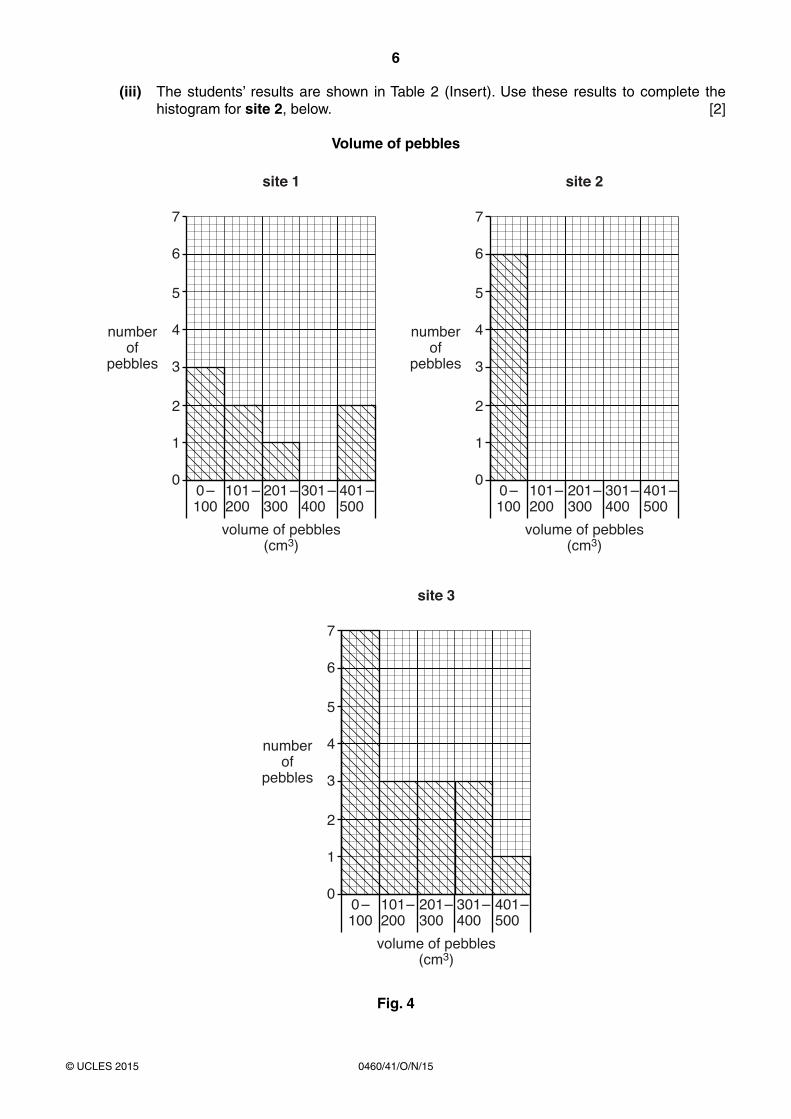
(iii) The students’ results are shown in Table 2 (Insert). Use these results to complete the histogram for site 2, below. [2]
Volume of pebbles
7
6
5
4numberof
pebbles
0 –100
101 –200
201 –300
volume of pebbles(cm3)
site 1
401 –500
301 –400
3
2
0
1
7
6
5
4numberof
pebbles
0 –100
101 –200
201 –300
volume of pebbles(cm3)
site 2
401 –500
301 –400
3
2
0
1
7
6
5
4numberof
pebbles
0 –100
101 –200
201 –300
volume of pebbles(cm3)
site 3
401 –500
301 –400
3
2
0
1
Fig. 4

7
0460/41/O/N/15© UCLES 2015 [Turn over
(iv) The students decided that there was no clear conclusion to Hypothesis 2: Load particle size decreases downstream. Use evidence from Fig. 4 and Table 2 to support this decision.
...........................................................................................................................................
...........................................................................................................................................
...........................................................................................................................................
...........................................................................................................................................
...........................................................................................................................................
.......................................................................................................................................[3]
(c) One student also plotted the measurements across the river at each site. These are shown in Fig. 5 below.
(i) Use the information in Table 2 (Insert) to complete Fig. 5 by plotting the volume of the pebbles at 1.2 m and 3.0 m from the inside bank at site 3. [2]
Volume of pebbles at site 3
0
50
100
150
0.30 0.6 0.9 1.2 1.5 1.8 2.1 2.4
distance from inside bank (m)
2.7 3.0 3.3 3.6 3.9 4.2 4.5 4.8 5.1
200
250volume
of pebbles(cm3)
300
350
400
450
500
Fig. 5
(ii) Site 3 is on a river meander. What pattern is shown by the results at site 3?
...........................................................................................................................................
.......................................................................................................................................[1]

8
0460/41/O/N/15© UCLES 2015
(iii) Using Fig. 5 and Table 2, explain why the results at site 3 show this pattern.
...........................................................................................................................................
...............................................................................................................................
...............................................................................................................................
.......................................................................................................................................[2]
(d) Suggest four ways that the students could have improved their data collection methods to make their results more reliable.
1 .................................................................................................................................................
......................................................................................................................................
2 ....................................................................................................................................
......................................................................................................................................
3 .................................................................................................................................................
......................................................................................................................................
4 ....................................................................................................................................
.................................................................................................................................. [4]
[Total: 30 marks]

9
0460/41/O/N/15© UCLES 2015 [Turn over
2 Some students in the UK wanted to compare areas of the town they lived in. They decided to divide their investigation into two parts. First they looked at the environment of different areas, and second they investigated the quality of life of people who live in the different areas.
Quality of life is a measurement of a person’s well-being and happiness which could include things such as safety, community spirit and level of crime.
The students chose five sites to investigate in different areas of the town. These are shown in Fig. 6 (Insert).
They decided to investigate the following hypotheses:
Hypothesis 1: The quality of the environment improves as distance from the town centre increases.
Hypothesis 2: People’s quality of life improves as distance from the town centre increases.
(a) To investigate Hypothesis 1 the students did an environmental quality survey at one site in each area. To make their survey more reliable the students produced brief descriptions of each category for the survey. An example for traffic is shown below.
Category: Traffic
Description Score
Very little traffic which is moving freely 4
Little traffic which is moving steadily 3
Lots of traffic which is moving slowly 2
Lots of traffic which is causing congestion and queues 1
(i) Put the following descriptions of public open space into the correct order in the table below. [1]
• Very little vegetation, land is derelict • Well kept vegetation which is regularly maintained • Vegetation is not maintained and is overgrown • Vegetation is maintained but not to a high level
Category: Public open space
Description Score
4
3
2
1
10
0460/41/O/N/15© UCLES 2015
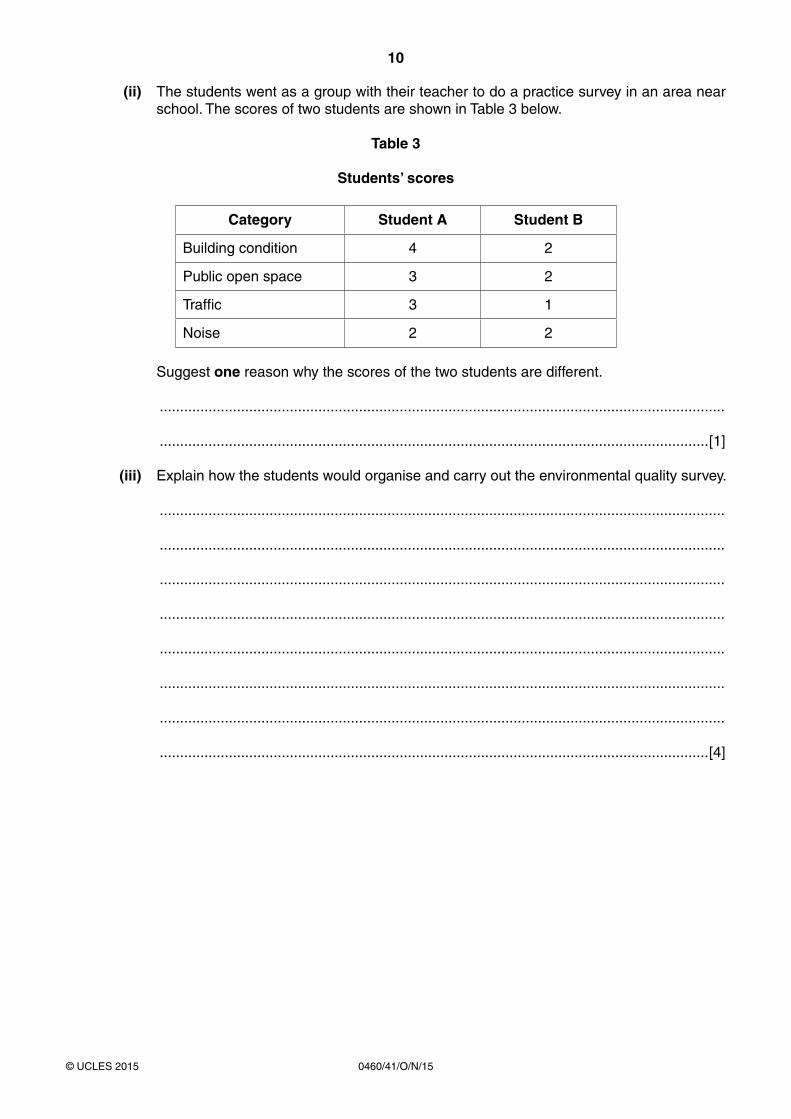
(ii) The students went as a group with their teacher to do a practice survey in an area near school. The scores of two students are shown in Table 3 below.
Table 3
Students’ scores
Category Student A Student B
Building condition 4 2
Public open space 3 2
Traffic 3 1
Noise 2 2
Suggest one reason why the scores of the two students are different.
...........................................................................................................................................
.......................................................................................................................................[1]
(iii) Explain how the students would organise and carry out the environmental quality survey.
...........................................................................................................................................
...........................................................................................................................................
........................................................................................................................................... ...........................................................................................................................................
...........................................................................................................................................
...........................................................................................................................................
...........................................................................................................................................
.......................................................................................................................................[4]
11
0460/41/O/N/15© UCLES 2015 [Turn over
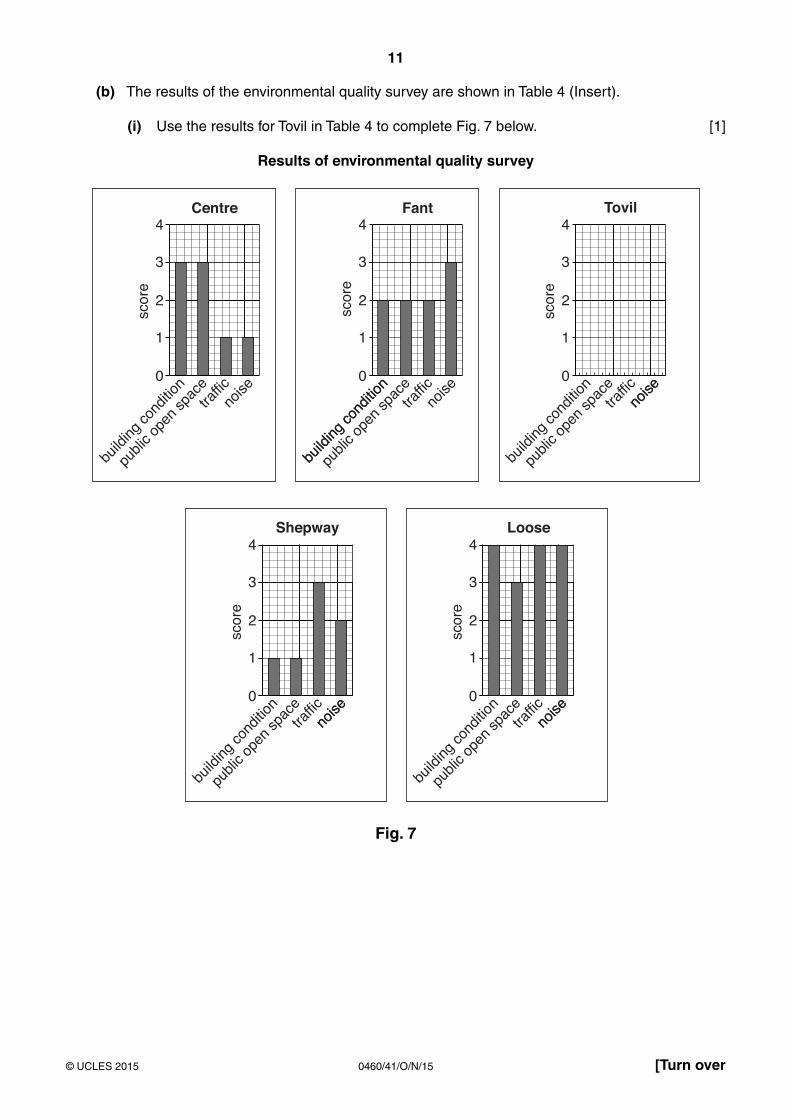
(b) The results of the environmental quality survey are shown in Table 4 (Insert).
(i) Use the results for Tovil in Table 4 to complete Fig. 7 below. [1]
Results of environmental quality survey
4
build
ing co
nditio
n
publi
c ope
n sp
acetra
fficno
ise
3
2
Centre
scor
e
0
1
build
ing co
nditio
n
Fant
scor
e
0
build
ing co
nditio
n
publi
c ope
n sp
acetra
fficno
ise
Tovil
scor
e
noise
4
build
ing co
nditio
n
publi
c ope
n sp
acetra
fficno
ise
3
2
1
0
4
3
2
1
Shepway
scor
e
Loose
build
ing co
nditio
n
publi
c ope
n sp
acetra
fficno
iseno
ise0
4
3
2
1
scor
e
build
ing co
nditio
n
publi
c ope
n sp
acetra
fficno
iseno
ise0
4
3
2
1
Fig. 7

12
0460/41/O/N/15© UCLES 2015
(ii) The students also calculated the total environmental quality score for each area. Use these results from Table 4 (Insert) to complete the scores for Centre and Fant in Fig. 8 below. [2]
0
2
4
6
0.0 0.5 1.0 1.5 2.0 2.5 3.0 3.5 4.0
distance from CBD (km)
Total environmental quality scores anddistance from the CBD
8
10
scor
e
12
14
16Loose
Shepway
Tovil
Fig. 8
(iii) Which one of the following conclusions to Hypothesis 1: The quality of the environment improves as distance from the town centre increases is most accurate? Circle your answer below.
Conclusion is false Conclusion is partly true Conclusion is true
Support your decision with evidence from Fig. 8 and Table 4.
...........................................................................................................................................
...........................................................................................................................................
...........................................................................................................................................
...........................................................................................................................................
...........................................................................................................................................
.......................................................................................................................................[4]

13
0460/41/O/N/15© UCLES 2015 [Turn over
(c) To investigate Hypothesis 2: People’s quality of life improves as distance from the town centre increases, the students needed to find out what residents thought about the area they lived in. To do this they produced an on-line questionnaire, which is shown in Fig. 9 (Insert).
The students delivered leaflets to 200 houses in each of the five areas. The leaflet asked residents to fill in the on-line questionnaire by using the link provided.
(i) Suggest two advantages and two disadvantages of using the on-line questionnaire rather than asking people in the street.
Advantages
1 .........................................................................................................................................
...........................................................................................................................................
2 .........................................................................................................................................
...........................................................................................................................................
Disadvantages
1 .........................................................................................................................................
...........................................................................................................................................
2 .........................................................................................................................................
.......................................................................................................................................[4]

14
0460/41/O/N/15© UCLES 2015
When the students received the completed questionnaires they recorded the results and converted them into percentages. These are shown in Tables 5, 6 and 7 (Insert).
(ii) The results to Question 1: How safe do you feel in the local area? are shown in Table 5. Use the results to complete the pie graph for Fant in Fig. 10, below. [2]
Answers to Question 1: How safe do you feel in the local area?
very safe
Key
safe
10
40
90
6050
%0
Centre
20
30
80
70
10
40
90
6050
%0
%0
%0
%0
Fant
20
30
80
70
10
40
90
6050
20
30
80
70
10
40
90
6050
20
30
80
70
10
40
90
6050
20
30
80
70
Tovil
unsafe
very unsafe
LooseShepway
Fig. 10

15
0460/41/O/N/15© UCLES 2015 [Turn over
(iii) The results to Question 2: Which one of the following best describes the community in the local area? are shown in Table 6. Use the results to complete the graph for Fant in Fig. 11, below. [2]
Centre
Fant
Tovil
Shepway
Loose
0 10 30 4020 60 7050 90
people carefor other people
Key
people do not mixwith other people
people are unfriendlyto other people
people are friendlyto other people
people are hostileto other people
10080
0 10 30 4020 60 7050 90 100%
%
80
Fig. 11
(iv) In which one of the five areas do residents have the best quality of life? Give one piece of evidence from Fig. 10 and one piece of evidence from Fig. 11 to
support your choice.
Chosen area ...................................
Fig. 10 ...........................................................................................................................................
...........................................................................................................................................
Fig. 11 ...........................................................................................................................................
.......................................................................................................................................[3]

16
0460/41/O/N/15© UCLES 2015
(v) The students decided that Hypothesis 2: People’s quality of life improves as distance from the town centre increases was false.
Support this conclusion with one piece of evidence from each of Fig. 10, Fig. 11 and Table 7 (Insert).
Fig. 10
...........................................................................................................................................
...........................................................................................................................................
Fig. 11
...........................................................................................................................................
...........................................................................................................................................
Table 7
...........................................................................................................................................
.......................................................................................................................................[3]
(d) What different methods could the students have used to extend their investigations into environmental quality and quality of life?
...................................................................................................................................................
...................................................................................................................................................
...................................................................................................................................................
...................................................................................................................................................
...................................................................................................................................................
...............................................................................................................................................[3]
[Total: 30 marks]

17
0460/41/O/N/15© UCLES 2015
Additional Pages
If you use the following lined pages to complete the answer(s) to any question(s), the question number(s) must be clearly shown.
..................................................................................................................................................................
..................................................................................................................................................................
..................................................................................................................................................................
..................................................................................................................................................................
..................................................................................................................................................................
..................................................................................................................................................................
..................................................................................................................................................................
..................................................................................................................................................................
..................................................................................................................................................................
..................................................................................................................................................................
..................................................................................................................................................................
..................................................................................................................................................................
..................................................................................................................................................................
..................................................................................................................................................................
..................................................................................................................................................................
..................................................................................................................................................................
..................................................................................................................................................................
..................................................................................................................................................................
..................................................................................................................................................................
..................................................................................................................................................................
..................................................................................................................................................................
..................................................................................................................................................................
..................................................................................................................................................................
..................................................................................................................................................................
..................................................................................................................................................................
..................................................................................................................................................................

18
0460/41/O/N/15© UCLES 2015
..................................................................................................................................................................
..................................................................................................................................................................
..................................................................................................................................................................
..................................................................................................................................................................
..................................................................................................................................................................
..................................................................................................................................................................
..................................................................................................................................................................
..................................................................................................................................................................
..................................................................................................................................................................
..................................................................................................................................................................
..................................................................................................................................................................
..................................................................................................................................................................
..................................................................................................................................................................
..................................................................................................................................................................
..................................................................................................................................................................
..................................................................................................................................................................
..................................................................................................................................................................
..................................................................................................................................................................
..................................................................................................................................................................
..................................................................................................................................................................
..................................................................................................................................................................
..................................................................................................................................................................
..................................................................................................................................................................
..................................................................................................................................................................
..................................................................................................................................................................
..................................................................................................................................................................
..................................................................................................................................................................

19
0460/41/O/N/15© UCLES 2015
BLANK PAGE

20
0460/41/O/N/15© UCLES 2015
Permission to reproduce items where third-party owned material protected by copyright is included has been sought and cleared where possible. Every reasonable effort has been made by the publisher (UCLES) to trace copyright holders, but if any items requiring clearance have unwittingly been included, the publisher will be pleased to make amends at the earliest possible opportunity.
To avoid the issue of disclosure of answer-related information to candidates, all copyright acknowledgements are reproduced online in the Cambridge International Examinations Copyright Acknowledgements Booklet. This is produced for each series of examinations and is freely available to download at www.cie.org.uk after the live examination series.
Cambridge International Examinations is part of the Cambridge Assessment Group. Cambridge Assessment is the brand name of University of Cambridge Local Examinations Syndicate (UCLES), which is itself a department of the University of Cambridge.
BLANK PAGE