Cambridge International Examinations Cambridge ... (0610)/0610_m17_qp_42.pdf · Cambridge...
16
This document consists of 15 printed pages and 1 blank page. DC (LK/SG) 129196/2 © UCLES 2017 [Turn over Cambridge International Examinations Cambridge International General Certificate of Secondary Education *0105482266* BIOLOGY 0610/42 Paper 4 Theory (Extended) February/March 2017 1 hour 15 minutes Candidates answer on the Question Paper. No Additional Materials are required. READ THESE INSTRUCTIONS FIRST Write your Centre number, candidate number and name on all the work you hand in. Write in dark blue or black pen. You may use an HB pencil for any diagrams or graphs. Do not use staples, paper clips, glue or correction fluid. DO NOT WRITE IN ANY BARCODES. Answer all questions. Electronic calculators may be used. You may lose marks if you do not show your working or if you do not use appropriate units. At the end of the examination, fasten all your work securely together. The number of marks is given in brackets [ ] at the end of each question or part question. The syllabus is approved for use in England, Wales and Northern Ireland as a Cambridge International Level 1/Level 2 Certificate.
Transcript of Cambridge International Examinations Cambridge ... (0610)/0610_m17_qp_42.pdf · Cambridge...
This document consists of 15 printed pages and 1 blank page.
DC (LK/SG) 129196/2© UCLES 2017 [Turn over
Cambridge International ExaminationsCambridge International General Certificate of Secondary Education
*0105482266*
BIOLOGY 0610/42Paper 4 Theory (Extended) February/March 2017 1 hour 15 minutesCandidates answer on the Question Paper.No Additional Materials are required.
READ THESE INSTRUCTIONS FIRST
Write your Centre number, candidate number and name on all the work you hand in.Write in dark blue or black pen.You may use an HB pencil for any diagrams or graphs.Do not use staples, paper clips, glue or correction fluid.DO NOT WRITE IN ANY BARCODES.
Answer all questions.
Electronic calculators may be used.You may lose marks if you do not show your working or if you do not use appropriate units.
At the end of the examination, fasten all your work securely together.The number of marks is given in brackets [ ] at the end of each question or part question.
The syllabus is approved for use in England, Wales and Northern Ireland as a Cambridge International Level 1/Level 2 Certificate.
2
0610/42/F/M/17© UCLES 2017
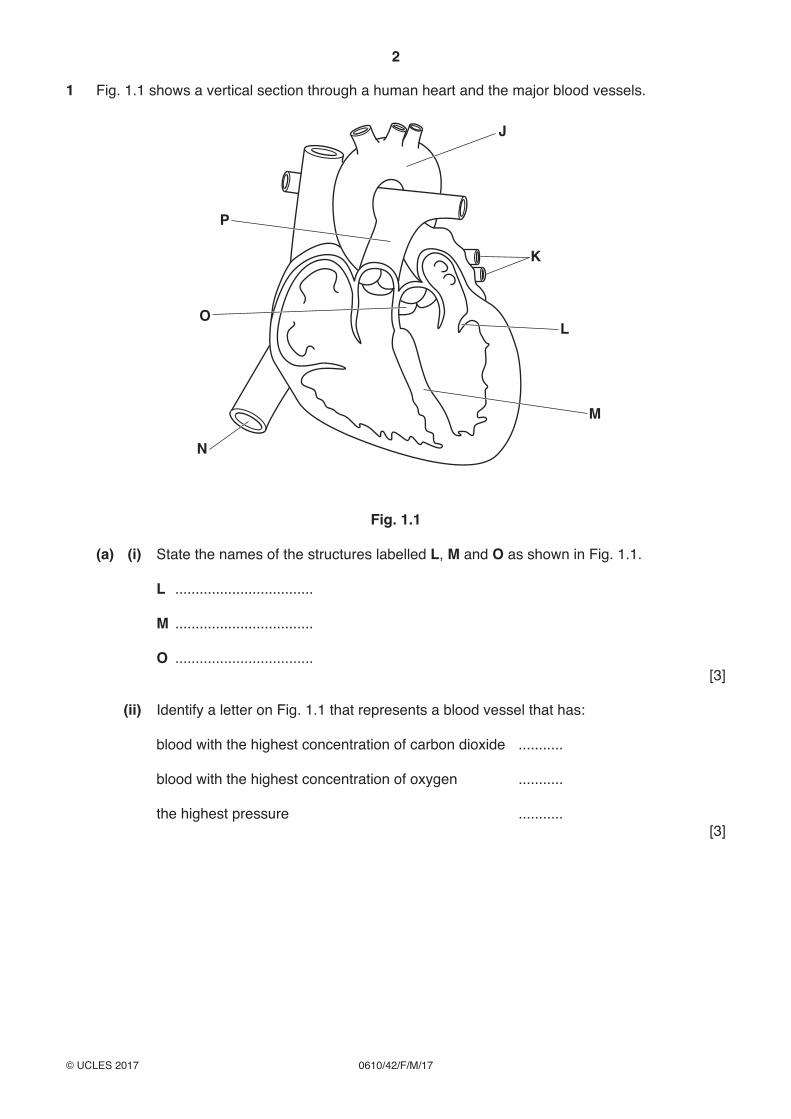
1 Fig. 1.1 shows a vertical section through a human heart and the major blood vessels.
J
K
L
M
N
O
P
Fig. 1.1
(a) (i) State the names of the structures labelled L, M and O as shown in Fig. 1.1.
L ..................................
M ..................................
O .................................. [3]
(ii) Identify a letter on Fig. 1.1 that represents a blood vessel that has:
blood with the highest concentration of carbon dioxide ...........
blood with the highest concentration of oxygen ...........
the highest pressure ........... [3]
3
0610/42/F/M/17© UCLES 2017 [Turn over
(b) (i) Describe how blood is moved by the heart from blood vessel K to blood vessel J.
...........................................................................................................................................
...........................................................................................................................................
...........................................................................................................................................
...........................................................................................................................................
...........................................................................................................................................
...........................................................................................................................................
...........................................................................................................................................
...........................................................................................................................................
...........................................................................................................................................
...........................................................................................................................................
.......................................................................................................................................[5]
(ii) Explain why the wall of the left ventricle is thicker than the wall of the right ventricle.
...........................................................................................................................................
...........................................................................................................................................
...........................................................................................................................................
...........................................................................................................................................
.......................................................................................................................................[2]
[Total: 13]
4
0610/42/F/M/17© UCLES 2017
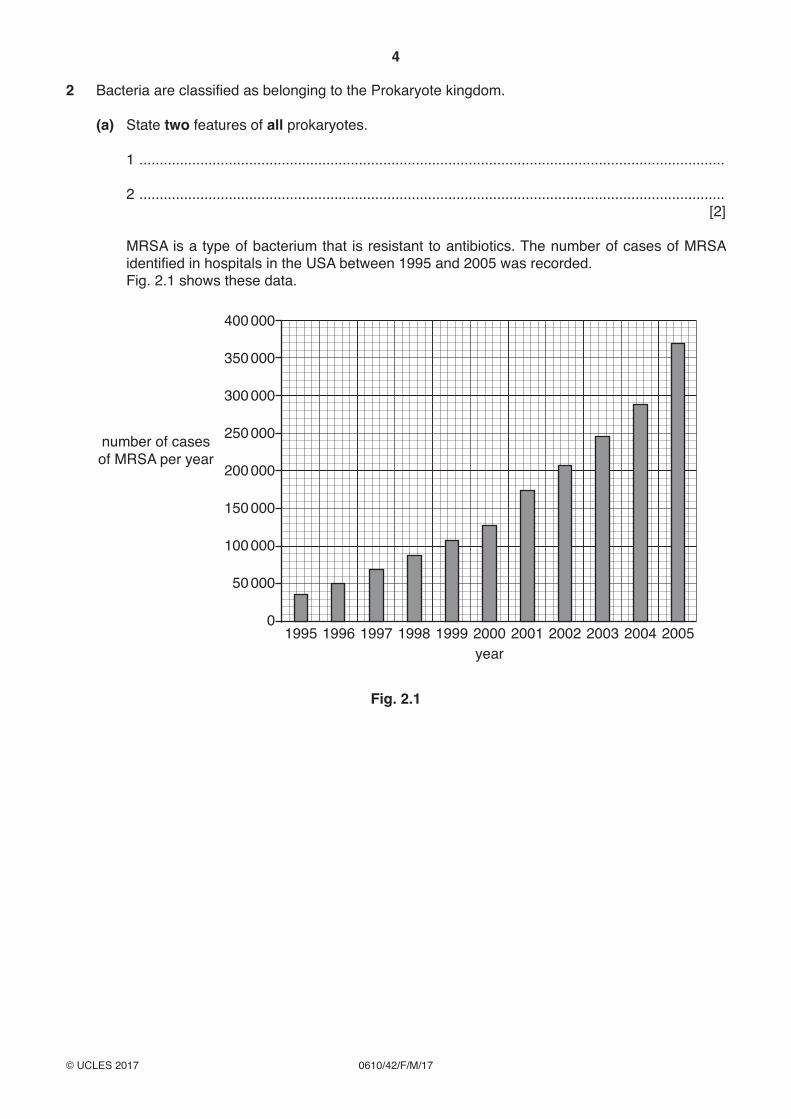
2 Bacteria are classified as belonging to the Prokaryote kingdom.
(a) State two features of all prokaryotes.
1 ................................................................................................................................................
2 ................................................................................................................................................ [2]
MRSA is a type of bacterium that is resistant to antibiotics. The number of cases of MRSA identified in hospitals in the USA between 1995 and 2005 was recorded.
Fig. 2.1 shows these data.
1995 1996 1997 1998 1999 2000 2001 2002 2003 2004 2005
400 000
350 000
300 000
250 000
200 000
150 000
100 000
50 000
0
number of casesof MRSA per year
year
Fig. 2.1
5
0610/42/F/M/17© UCLES 2017 [Turn over
(b) (i) Describe the results shown in Fig. 2.1.
...........................................................................................................................................
...........................................................................................................................................
...........................................................................................................................................
...........................................................................................................................................
.......................................................................................................................................[2]
(ii) Explain how bacteria become resistant to antibiotics.
...........................................................................................................................................
...........................................................................................................................................
...........................................................................................................................................
...........................................................................................................................................
...........................................................................................................................................
...........................................................................................................................................
...........................................................................................................................................
...........................................................................................................................................
.......................................................................................................................................[4]
(c) The number of cases of MRSA has decreased since 2005.
Suggest reasons for this decrease.
...................................................................................................................................................
...................................................................................................................................................
...................................................................................................................................................
...................................................................................................................................................
...............................................................................................................................................[2]
[Total: 10]
6
0610/42/F/M/17© UCLES 2017
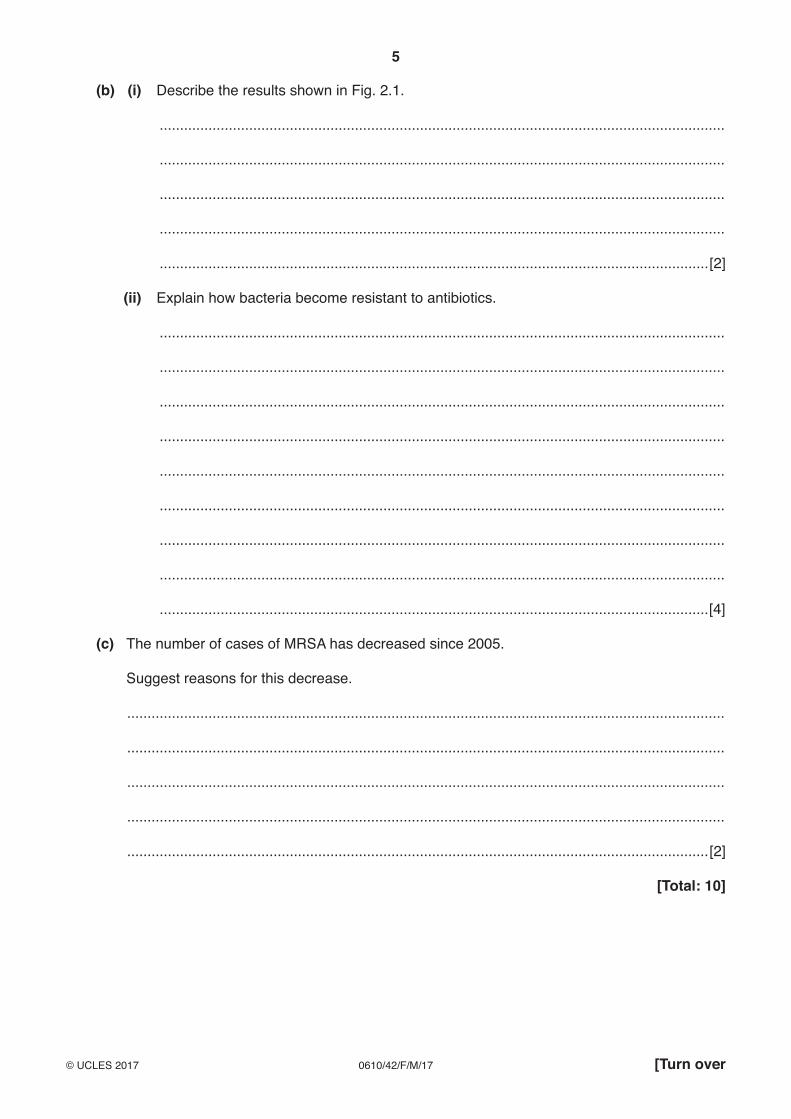
3 Colour blindness in humans is caused by a fault in some of the light receptor cells in the retina of the eye. Rod cells and cone cells are two types of light receptor.
(a) Complete Table 3.1 to state the function of three types of cell in the eye.
Table 3.1
type of cell in the eye function
rod cells ..........................................................................................
..........................................................................................
cone cells ..........................................................................................
..........................................................................................
sensory neurones ..........................................................................................
.......................................................................................... [3]
(b) The number of rod cells and cone cells at places across the retina were recorded.
The diagram of an eye in Fig. 3.1 shows the angles from the fovea where the recordings were made.
The graph in Fig. 3.1 shows the number of rod cells and cone cells across the retina.
Use Fig. 3.1 to describe and explain the distribution of rod cells and cone cells across the retina.
...................................................................................................................................................
...................................................................................................................................................
...................................................................................................................................................
...................................................................................................................................................
...................................................................................................................................................
...................................................................................................................................................
...................................................................................................................................................
...................................................................................................................................................
...................................................................................................................................................
...................................................................................................................................................
...............................................................................................................................................[5]

7
0610/42/F/M/17© UCLES 2017 [Turn over
706050403020100102030405060700
20 000
40 000
60 000
80 000
100 000
120 000
140 000
160 000
180 000
fovea optic nerve
blind spot
70°60°
40°20°
0°20°
40°60°70°
number ofrod cells
andcone cellsper mm2
angle from fovea / degrees
cone cellscone cells
rod cellsrod cells
blind spotfovea
Fig. 3.1
8
0610/42/F/M/17© UCLES 2017
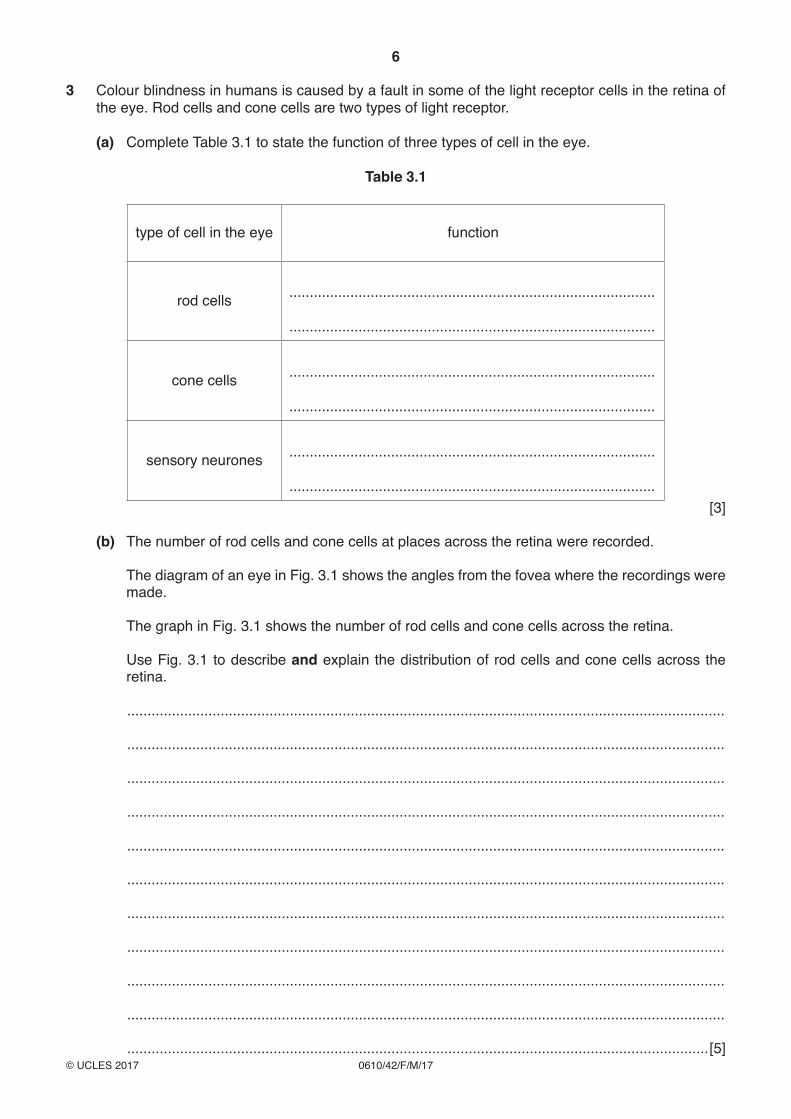
(c) Colour blindness is a sex-linked characteristic.
The gene for colour vision is on the X chromosome.
There are two alleles of this gene:
• B is the allele for normal colour vision
• b is the allele for colour blindness.
Fig. 3.2 is a pedigree chart showing the inheritance of colour blindness in a family. The key shows the sex chromosomes and the alleles of the gene for colour vision.
Key
male with normal colour vision XBY
colour-blind male XbY
female with normal colour vision XBXB
carrier female with normalcolour vision
XBXb
colour-blind female XbXb
Fig. 3.2
Describe evidence from Fig. 3.2 that shows that colour blindness is a sex-linked characteristic.
...................................................................................................................................................
...................................................................................................................................................
...................................................................................................................................................
...................................................................................................................................................
...............................................................................................................................................[2]
9
0610/42/F/M/17© UCLES 2017 [Turn over
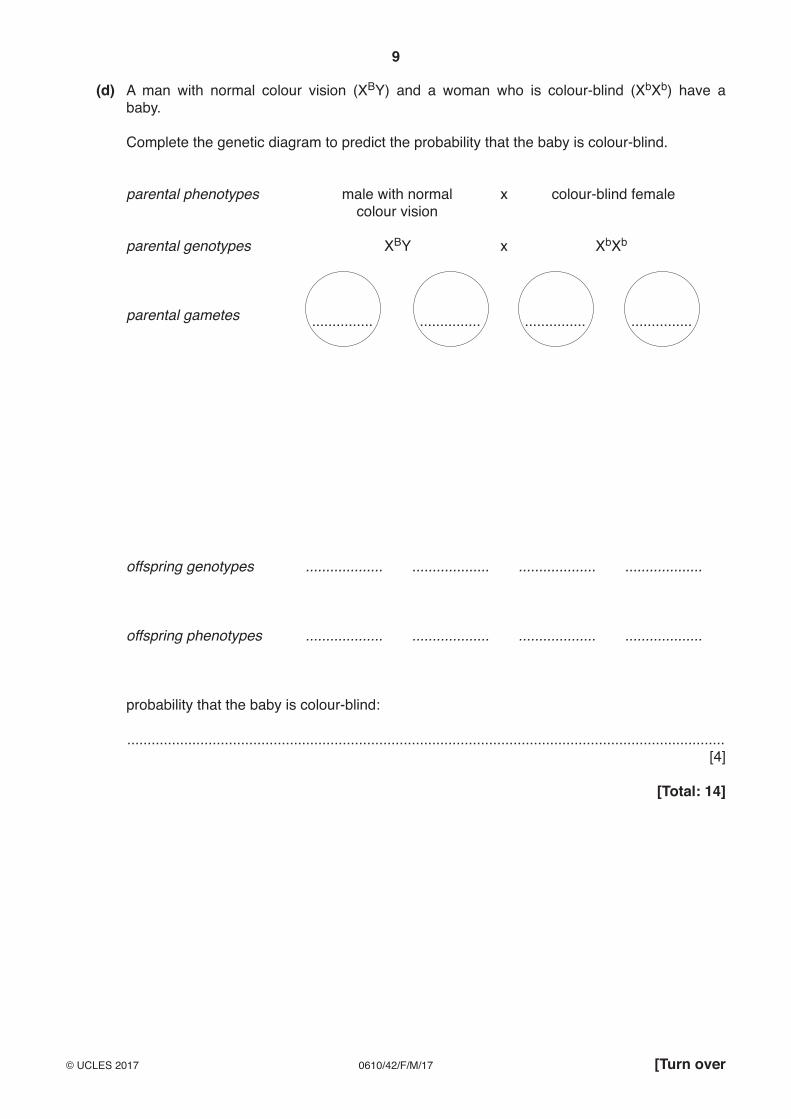
(d) A man with normal colour vision (XBY) and a woman who is colour-blind (XbXb) have a baby.
Complete the genetic diagram to predict the probability that the baby is colour-blind.
parental phenotypes male with normal x colour-blind female colour vision
parental genotypes XBY x XbXb
parental gametes ............... ............... ............... ...............
offspring genotypes ................... ................... ................... ...................
offspring phenotypes ................... ................... ................... ...................
probability that the baby is colour-blind:
...................................................................................................................................................[4]
[Total: 14]
10
0610/42/F/M/17© UCLES 2017
4 (a) Water is one requirement for photosynthesis.
State two other requirements needed by plants to carry out photosynthesis.
1 ................................................................................................................................................
2 ................................................................................................................................................ [2]
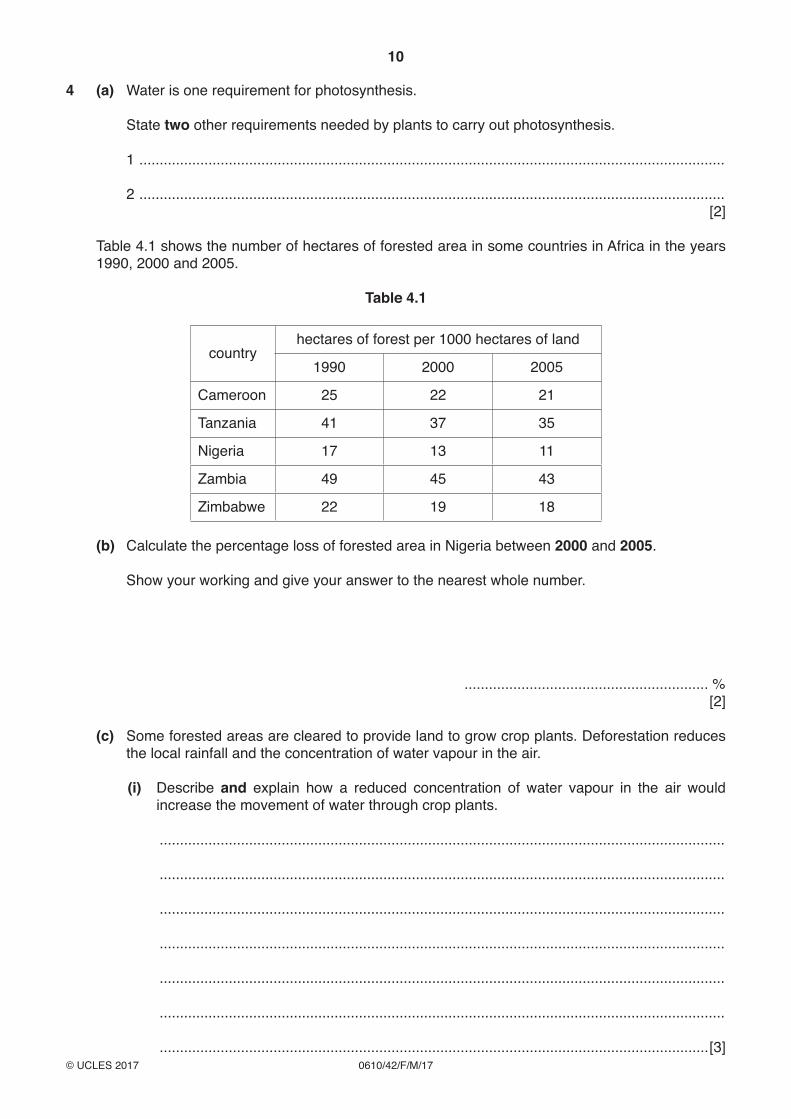
Table 4.1 shows the number of hectares of forested area in some countries in Africa in the years 1990, 2000 and 2005.
Table 4.1
countryhectares of forest per 1000 hectares of land
1990 2000 2005
Cameroon 25 22 21
Tanzania 41 37 35
Nigeria 17 13 11
Zambia 49 45 43
Zimbabwe 22 19 18
(b) Calculate the percentage loss of forested area in Nigeria between 2000 and 2005.
Show your working and give your answer to the nearest whole number.
............................................................ %[2]
(c) Some forested areas are cleared to provide land to grow crop plants. Deforestation reduces the local rainfall and the concentration of water vapour in the air.
(i) Describe and explain how a reduced concentration of water vapour in the air would increase the movement of water through crop plants.
...........................................................................................................................................
...........................................................................................................................................
...........................................................................................................................................
...........................................................................................................................................
...........................................................................................................................................
...........................................................................................................................................
.......................................................................................................................................[3]
11
0610/42/F/M/17© UCLES 2017 [Turn over
(ii) Describe how water moves from the soil into the roots of crop plants.
...........................................................................................................................................
...........................................................................................................................................
...........................................................................................................................................
...........................................................................................................................................
...........................................................................................................................................
...........................................................................................................................................
.......................................................................................................................................[3]
(d) Describe the consequences of deforestation on the animals that live in forests.
...................................................................................................................................................
...................................................................................................................................................
...................................................................................................................................................
...................................................................................................................................................
...................................................................................................................................................
...................................................................................................................................................
...................................................................................................................................................
...................................................................................................................................................
...............................................................................................................................................[4]
[Total: 14]
12
0610/42/F/M/17© UCLES 2017
5 (a) (i) Alcohol can be made by the microorganism yeast.
State the balanced chemical equation for the production of alcohol by yeast.
.......................................................................................................................................[2]
(ii) Name the organ that breaks down alcohol in the human body.
.......................................................................................................................................[1]
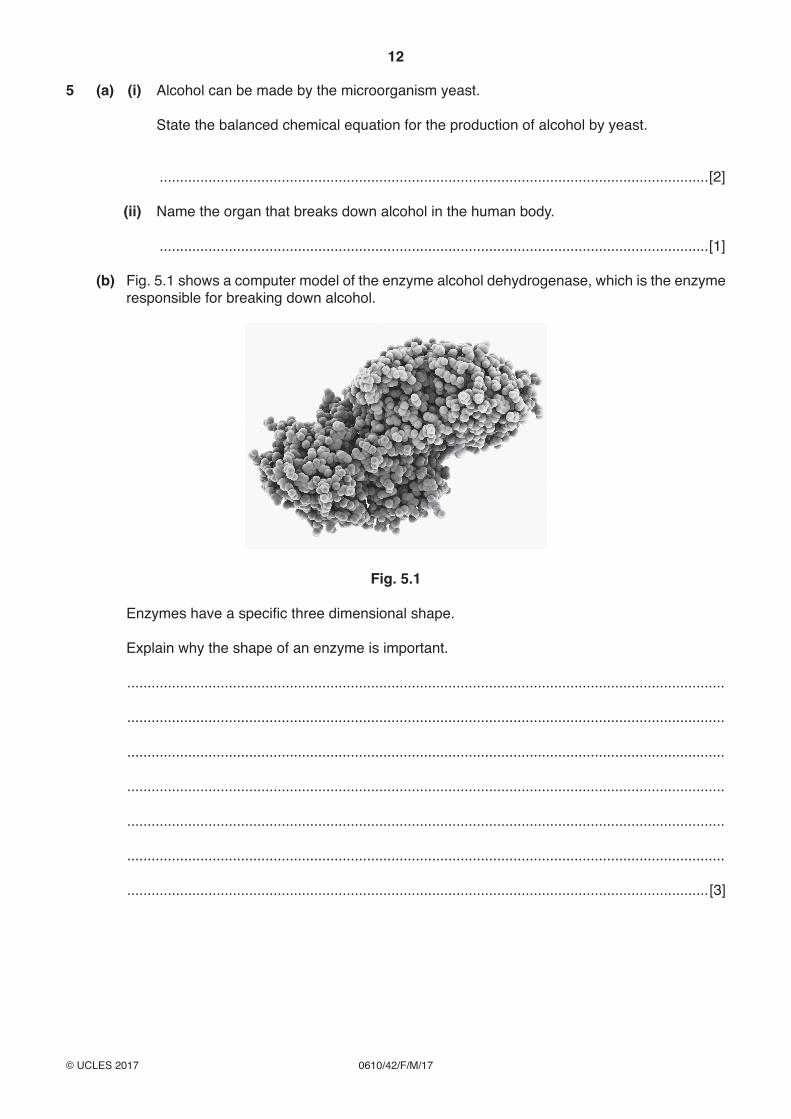
(b) Fig. 5.1 shows a computer model of the enzyme alcohol dehydrogenase, which is the enzyme responsible for breaking down alcohol.
Fig. 5.1
Enzymes have a specific three dimensional shape.
Explain why the shape of an enzyme is important.
...................................................................................................................................................
...................................................................................................................................................
...................................................................................................................................................
...................................................................................................................................................
...................................................................................................................................................
...................................................................................................................................................
...............................................................................................................................................[3]
13
0610/42/F/M/17© UCLES 2017 [Turn over
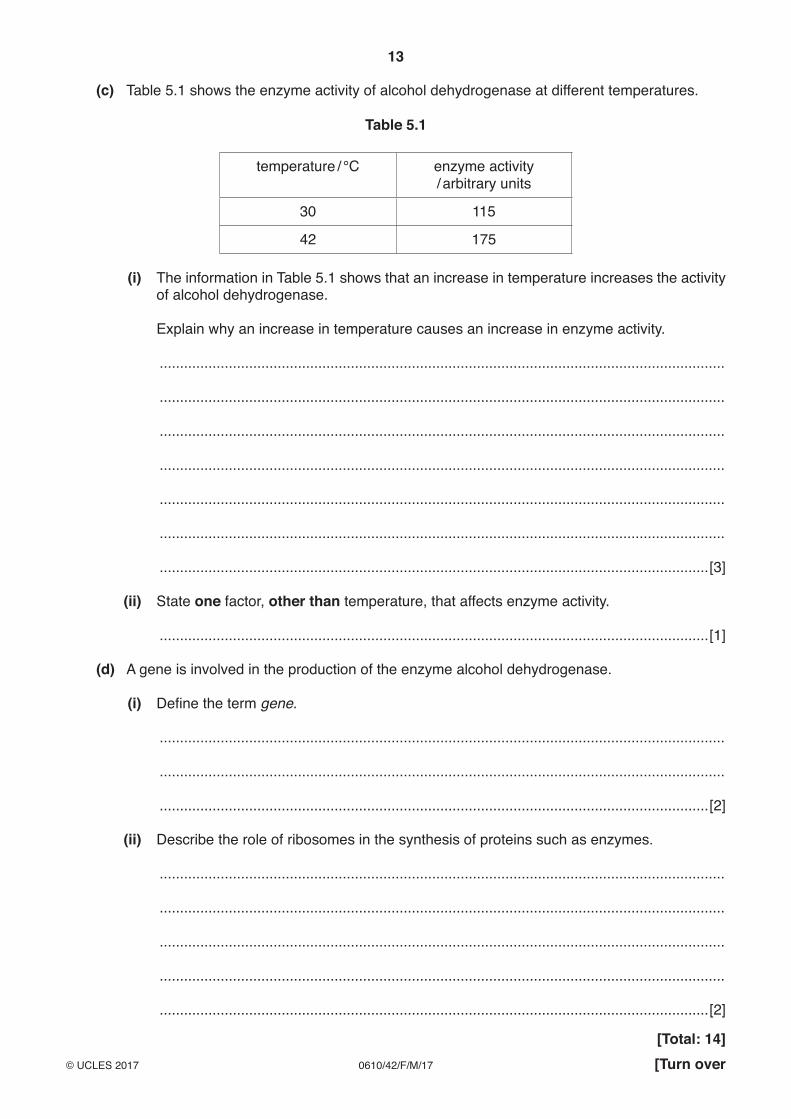
(c) Table 5.1 shows the enzyme activity of alcohol dehydrogenase at different temperatures.
Table 5.1
temperature / °C enzyme activity / arbitrary units
30 115
42 175
(i) The information in Table 5.1 shows that an increase in temperature increases the activity of alcohol dehydrogenase.
Explain why an increase in temperature causes an increase in enzyme activity.
...........................................................................................................................................
...........................................................................................................................................
...........................................................................................................................................
...........................................................................................................................................
...........................................................................................................................................
...........................................................................................................................................
.......................................................................................................................................[3]
(ii) State one factor, other than temperature, that affects enzyme activity.
.......................................................................................................................................[1]
(d) A gene is involved in the production of the enzyme alcohol dehydrogenase.
(i) Define the term gene.
...........................................................................................................................................
...........................................................................................................................................
.......................................................................................................................................[2]
(ii) Describe the role of ribosomes in the synthesis of proteins such as enzymes.
...........................................................................................................................................
...........................................................................................................................................
...........................................................................................................................................
...........................................................................................................................................
.......................................................................................................................................[2]
[Total: 14]
14
0610/42/F/M/17© UCLES 2017
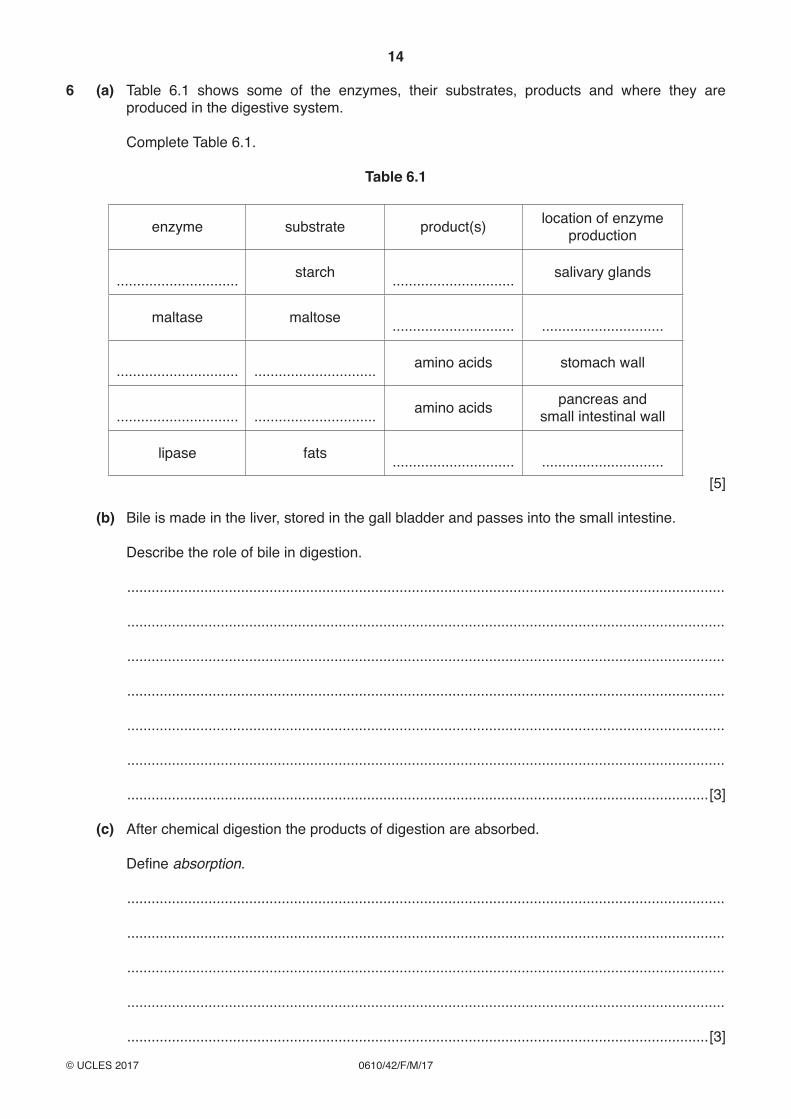
6 (a) Table 6.1 shows some of the enzymes, their substrates, products and where they are produced in the digestive system.
Complete Table 6.1.
Table 6.1
enzyme substrate product(s) location of enzyme production
.............................. starch .............................. salivary glands
maltase maltose .............................. ..............................
.............................. .............................. amino acids stomach wall
.............................. .............................. amino acids pancreas and small intestinal wall
lipase fats .............................. .............................. [5]
(b) Bile is made in the liver, stored in the gall bladder and passes into the small intestine.
Describe the role of bile in digestion.
...................................................................................................................................................
...................................................................................................................................................
...................................................................................................................................................
...................................................................................................................................................
...................................................................................................................................................
...................................................................................................................................................
...............................................................................................................................................[3]
(c) After chemical digestion the products of digestion are absorbed.
Define absorption.
...................................................................................................................................................
...................................................................................................................................................
...................................................................................................................................................
...................................................................................................................................................
...............................................................................................................................................[3]
15
0610/42/F/M/17© UCLES 2017
(d) Lack of protein in the diet can result in protein-energy malnutrition.
State the name of one disease caused by protein-energy malnutrition.
...............................................................................................................................................[1]
(e) People that eat a diet that is high in fats are often advised to reduce their intake of fats.
Suggest the health benefits of this change in diet.
...................................................................................................................................................
...................................................................................................................................................
...................................................................................................................................................
...................................................................................................................................................
...................................................................................................................................................
...................................................................................................................................................
...............................................................................................................................................[3]
[Total: 15]
16
0610/42/F/M/17© UCLES 2017
Permission to reproduce items where third-party owned material protected by copyright is included has been sought and cleared where possible. Every reasonable effort has been made by the publisher (UCLES) to trace copyright holders, but if any items requiring clearance have unwittingly been included, the publisher will be pleased to make amends at the earliest possible opportunity.
To avoid the issue of disclosure of answer-related information to candidates, all copyright acknowledgements are reproduced online in the Cambridge International Examinations Copyright Acknowledgements Booklet. This is produced for each series of examinations and is freely available to download at www.cie.org.uk after the live examination series.
Cambridge International Examinations is part of the Cambridge Assessment Group. Cambridge Assessment is the brand name of University of Cambridge Local Examinations Syndicate (UCLES), which is itself a department of the University of Cambridge.
BLANK PAGE