Cambodia Baseline Assessment Perspective - ICEM. baseline...CAMBODIA BASELINE ASSESSMENT PERSPECTIVE...
39
REGIONAL WORKSHOP ON SEA BASELINE ASSESSMENT PHNOM PENH HOTEL, 27-28 JANUARY 2010 CAMBODIA BASELINE ASSESSMENT PERSPECTIVE Mekong River Commission – SEA of hydropower on the mainstream Mekong River
-
Upload
hoangkhuong -
Category
Documents
-
view
223 -
download
3
Transcript of Cambodia Baseline Assessment Perspective - ICEM. baseline...CAMBODIA BASELINE ASSESSMENT PERSPECTIVE...
REGIONAL WORKSHOP ON SEA BASELINE
ASSESSMENT
PHNOM PENH HOTEL, 27-28 JANUARY 2010
CAMBODIA BASELINE
ASSESSMENT PERSPECTIVE
Mekong River Commission – SEA of hydropower on the mainstream Mekong River
Outlines
1. The country setting and its current CMDGs status
2. Present the process of baseline data collection
from the Stung Treng and Kratie
3. Summary key issues: current and future trends for
energy, fisheries, and livelihoods as selected
sample.
4. Conclusions: fisheries (ecosystem,
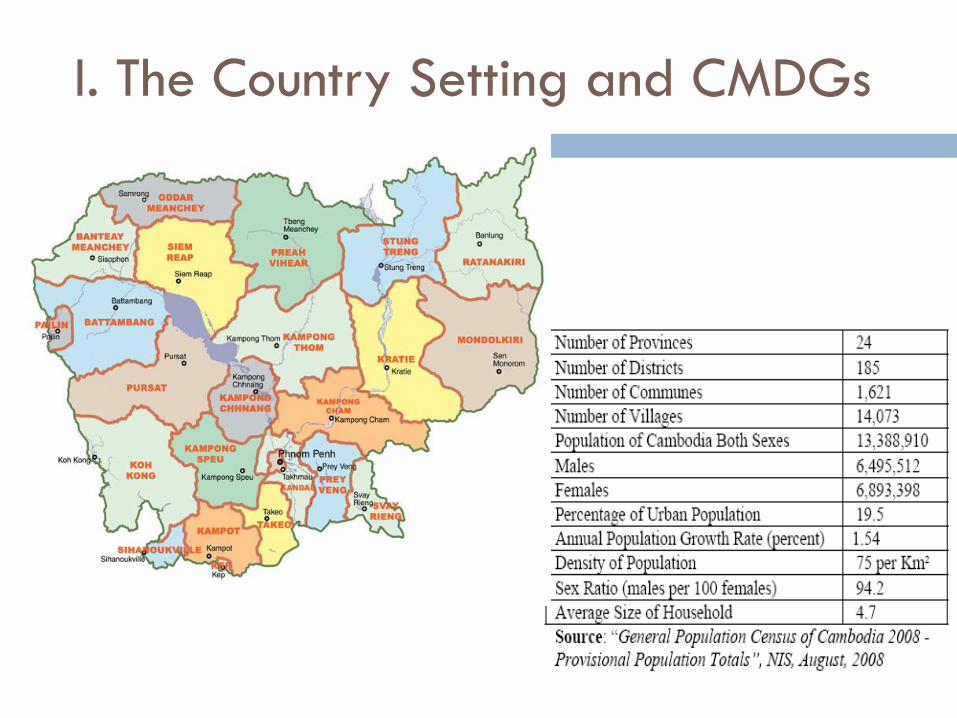
I. The Country Setting and CMDGs
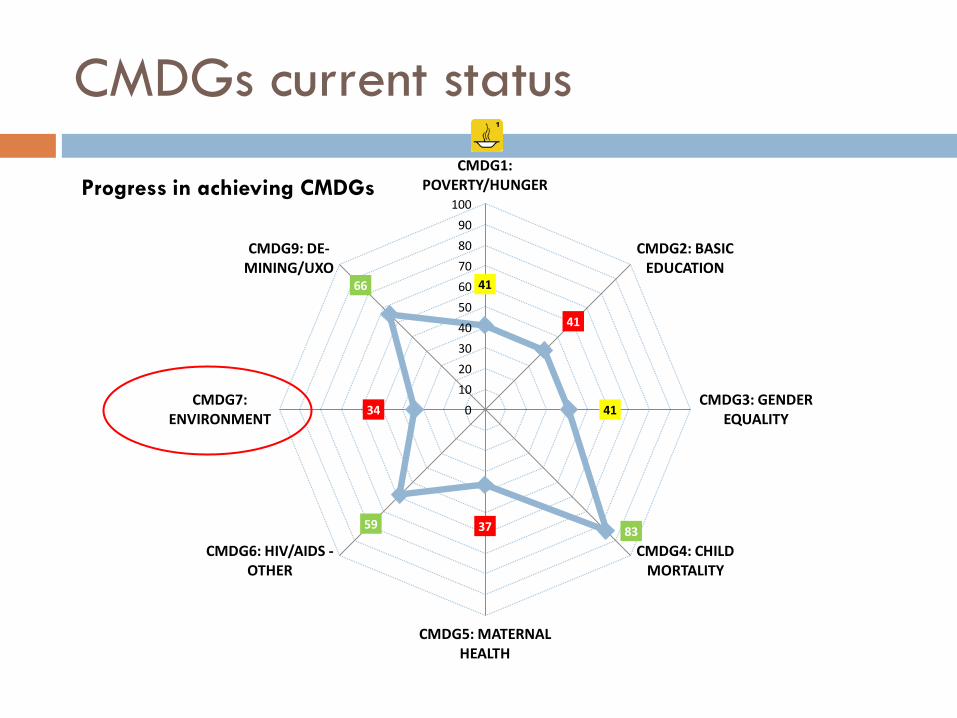
CMDGs current status
Progress in achieving CMDGs
41
41
41
833759
34
66
0
10
20
30
40
50
60
70
80
90
100
CMDG1: POVERTY/HUNGER
CMDG2: BASIC EDUCATION
CMDG3: GENDER EQUALITY
CMDG4: CHILD MORTALITY
CMDG5: MATERNAL HEALTH
CMDG6: HIV/AIDS -OTHER
CMDG7: ENVIRONMENT
CMDG9: DE-MINING/UXO
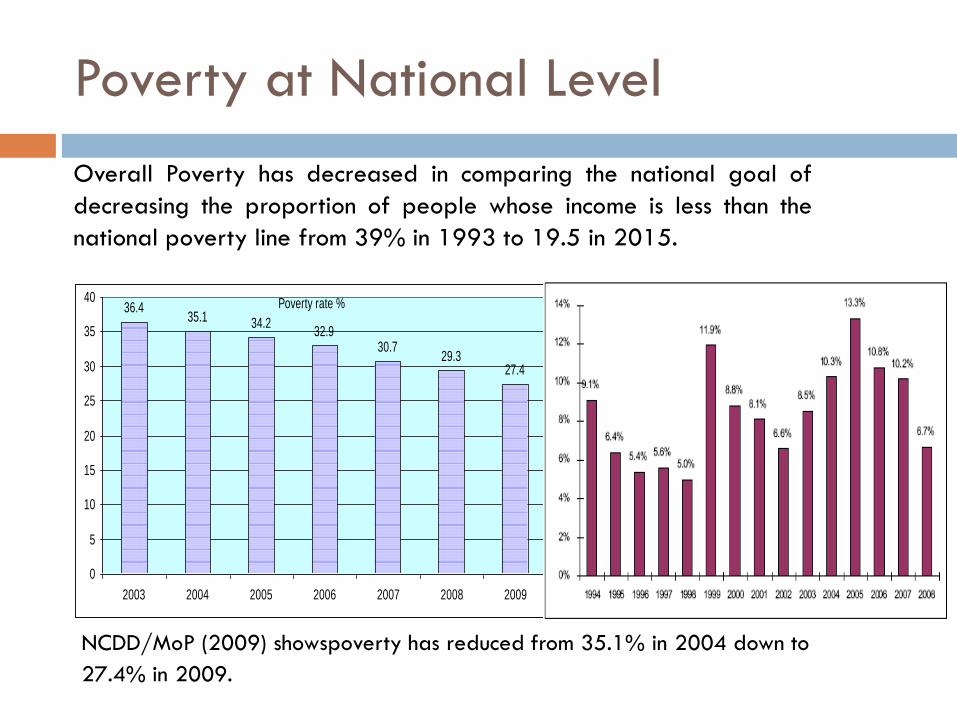
Poverty at National Level
Poverty rate %36.435.1 34.2
32.930.7
29.327.4
0
5
10
15
20
25
30
35
40
2003 2004 2005 2006 2007 2008 2009
Overall Poverty has decreased in comparing the national goal of
decreasing the proportion of people whose income is less than the
national poverty line from 39% in 1993 to 19.5 in 2015.
NCDD/MoP (2009) showspoverty has reduced from 35.1% in 2004 down to
27.4% in 2009.
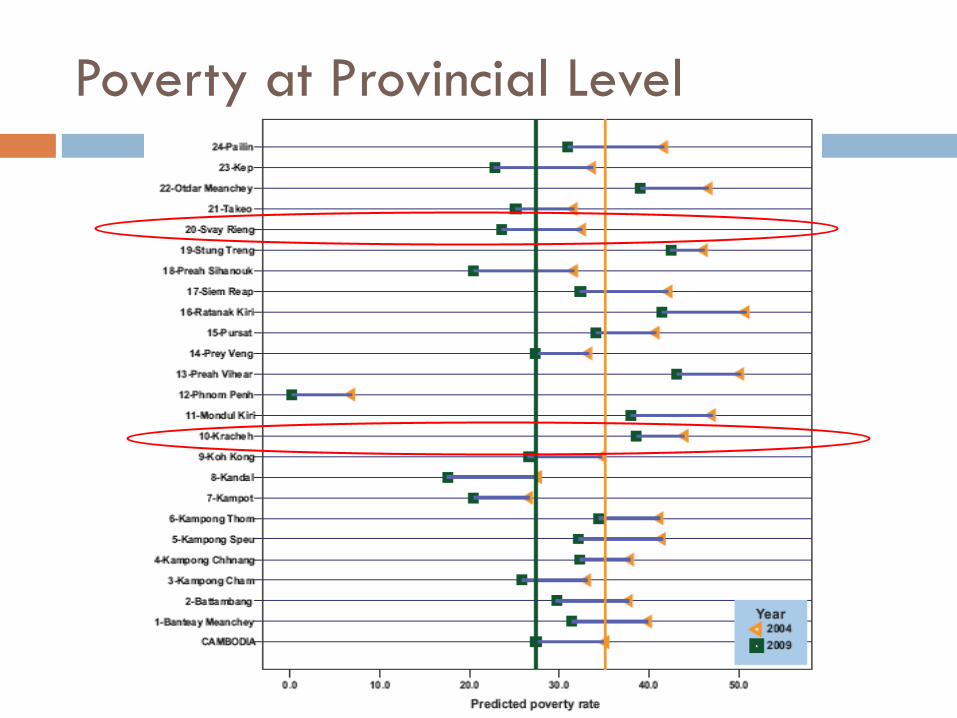
Poverty at Provincial Level
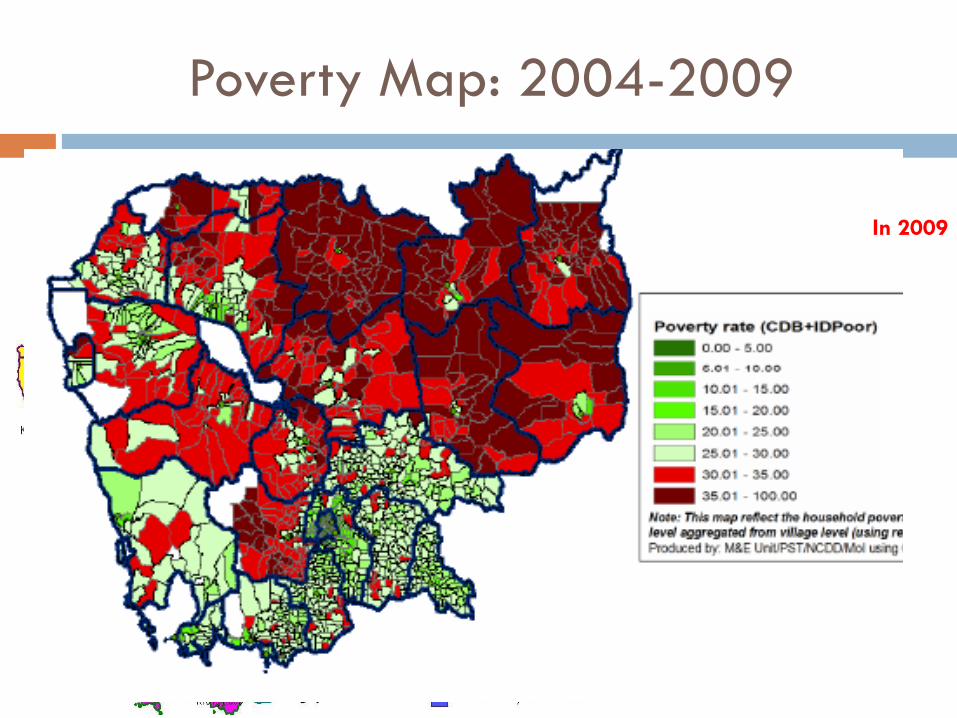
Poverty Map: 2004-2009
In 2004
In 2009
II. The Baseline of Provinces in
Proposed Mainstream Hydropower
Documents collected and consulted
- Stung Treng:
25 relevant reports: environment, ELC, mining,
agriculture, forestry, fisheries, health, proposed
development project in Triangle Development Plan,
provincial and district profile 2009, irrigation scheme,
draft three year investment planning 2010-2013.
-Kratie:
17 relevant documents: fisheries, agriculture, provincial
and district profiles, annual provincial report, strategic
development plan, irrigation, ELC, social land
concession.
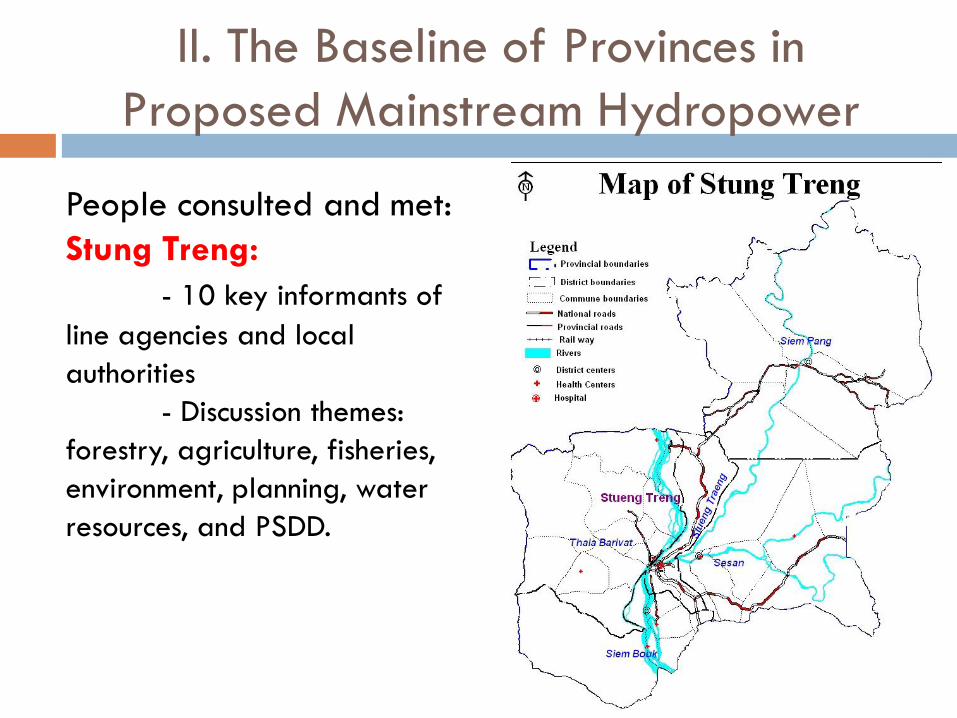
II. The Baseline of Provinces in
Proposed Mainstream Hydropower
People consulted and met:
Stung Treng:
- 10 key informants of
line agencies and local
authorities
- Discussion themes:
forestry, agriculture, fisheries,
environment, planning, water
resources, and PSDD.
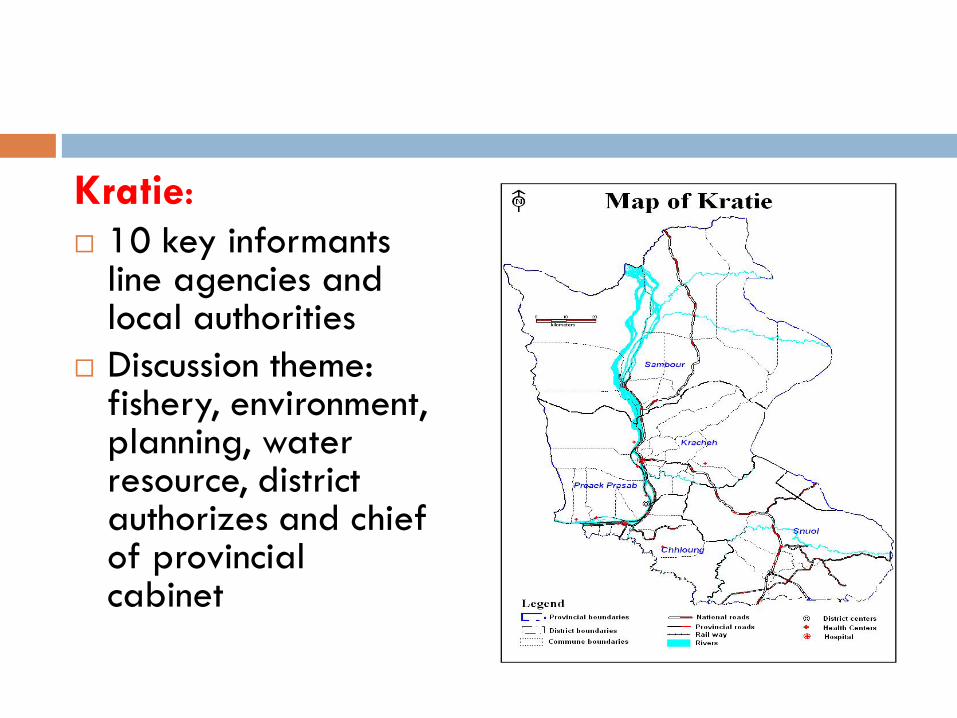
Kratie:
10 key informants line agencies and local authorities
Discussion theme: fishery, environment, planning, water resource, district authorizes and chief of provincial cabinet
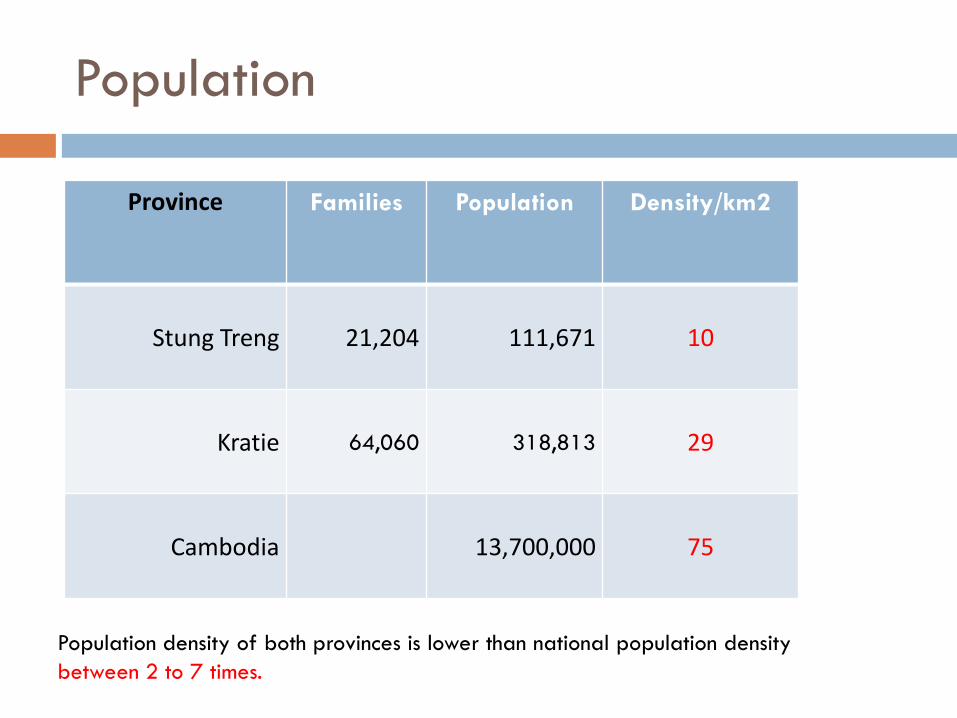
Population
Province Families Population Density/km2
Stung Treng 21,204 111,671 10
Kratie 64,060 318,813 29
Cambodia 13,700,000 75
Population density of both provinces is lower than national population density
between 2 to 7 times.
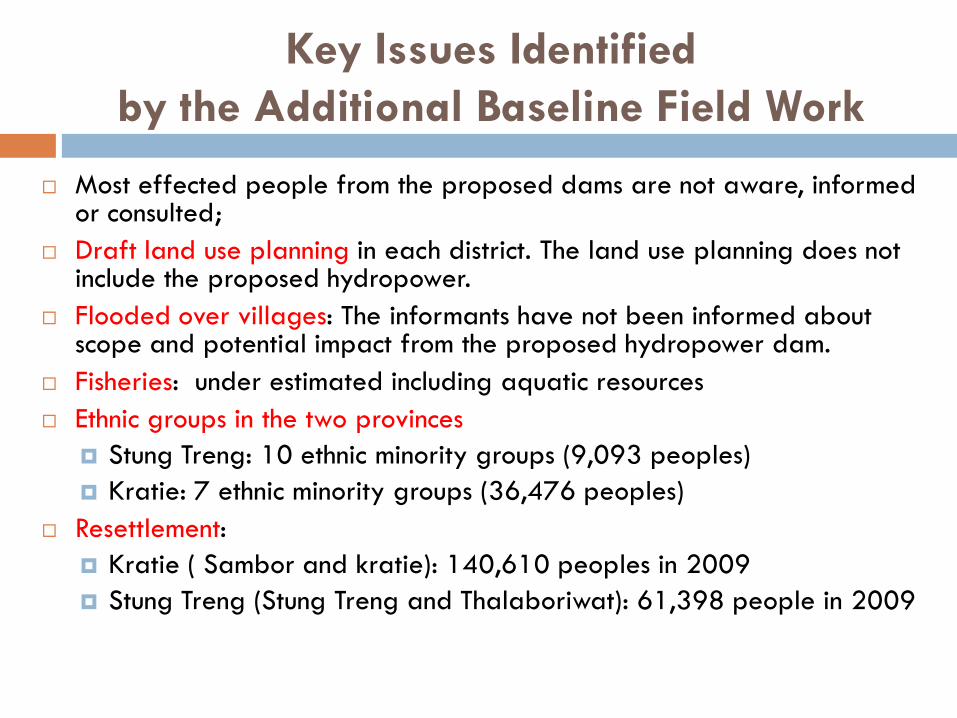
Key Issues Identified
by the Additional Baseline Field Work
Most effected people from the proposed dams are not aware, informed or consulted;
Draft land use planning in each district. The land use planning does not include the proposed hydropower.
Flooded over villages: The informants have not been informed about scope and potential impact from the proposed hydropower dam.
Fisheries: under estimated including aquatic resources
Ethnic groups in the two provinces
Stung Treng: 10 ethnic minority groups (9,093 peoples)
Kratie: 7 ethnic minority groups (36,476 peoples)
Resettlement:
Kratie ( Sambor and kratie): 140,610 peoples in 2009
Stung Treng (Stung Treng and Thalaboriwat): 61,398 people in 2009
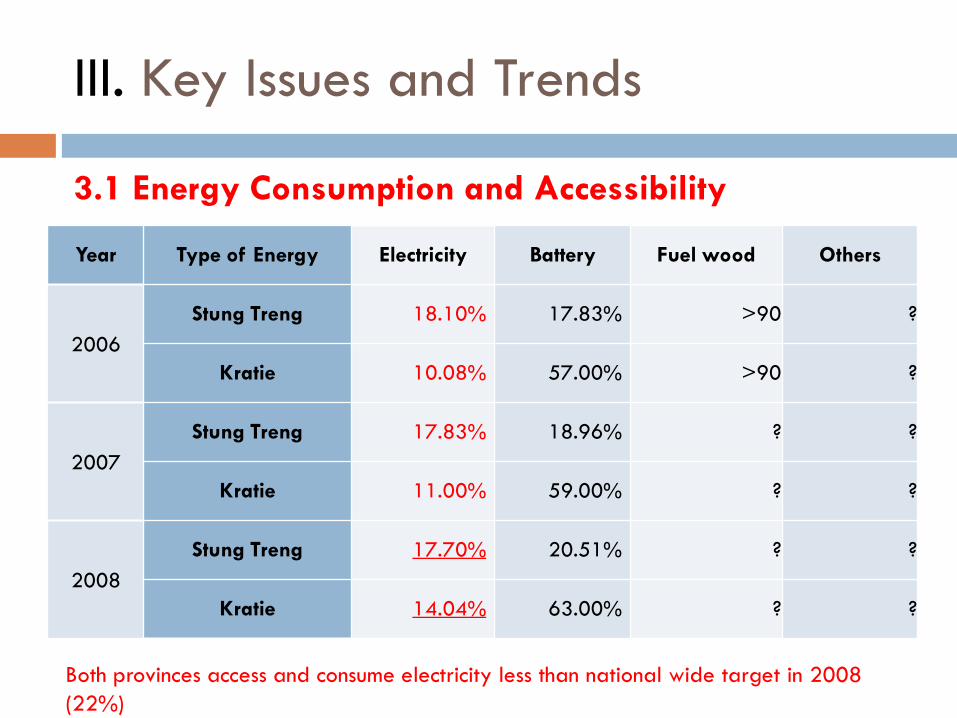
III. Key Issues and Trends
Year Type of Energy Electricity Battery Fuel wood Others
2006
Stung Treng 18.10% 17.83% >90 ?
Kratie 10.08% 57.00% >90 ?
2007
Stung Treng 17.83% 18.96% ? ?
Kratie 11.00% 59.00% ? ?
2008
Stung Treng 17.70% 20.51% ? ?
Kratie 14.04% 63.00% ? ?
3.1 Energy Consumption and Accessibility
Both provinces access and consume electricity less than national wide target in 2008
(22%)
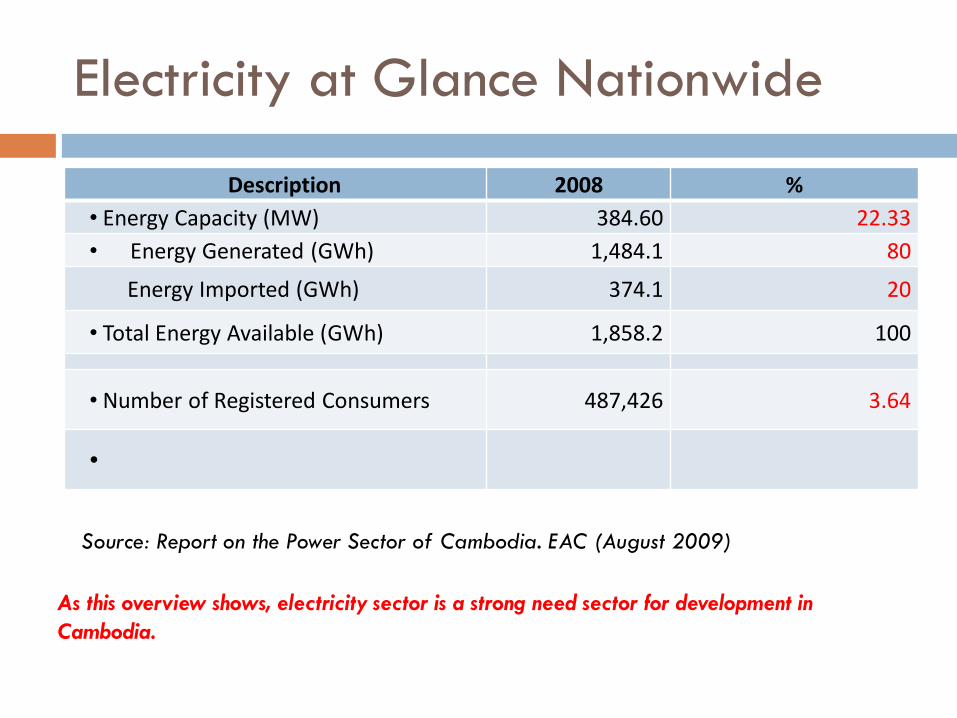
Electricity at Glance Nationwide
Description 2008 %
• Energy Capacity (MW) 384.60 22.33
• Energy Generated (GWh) 1,484.1 80
Energy Imported (GWh) 374.1 20
• Total Energy Available (GWh) 1,858.2 100
• Number of Registered Consumers 487,426 3.64
•
As this overview shows, electricity sector is a strong need sector for development in
Cambodia.
Source: Report on the Power Sector of Cambodia. EAC (August 2009)
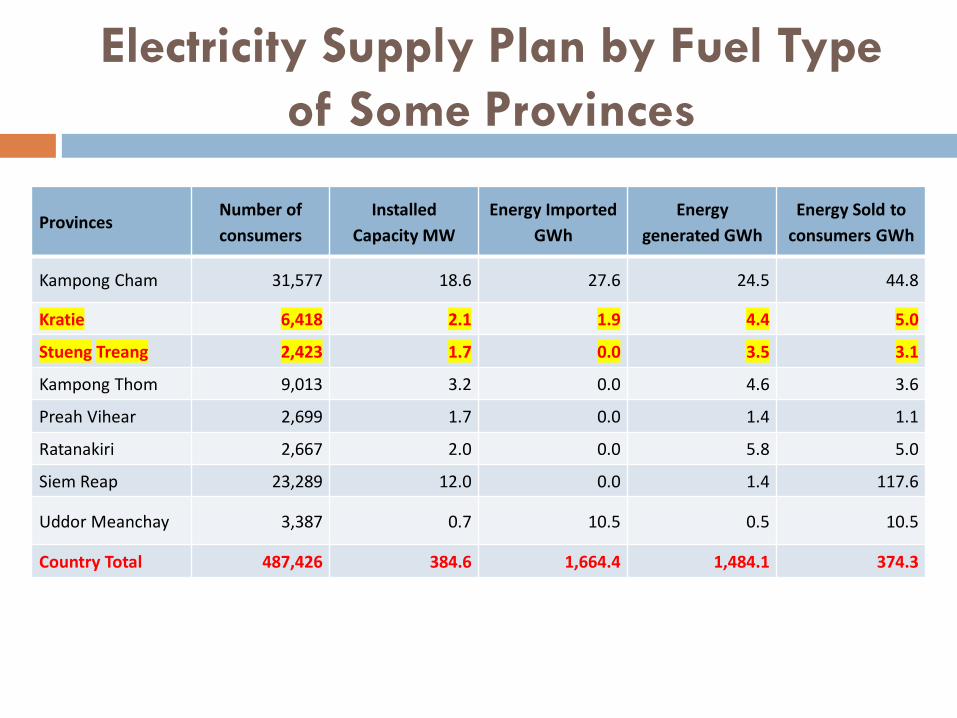
Electricity Supply Plan by Fuel Type
of Some Provinces
ProvincesNumber of
consumers
Installed
Capacity MW
Energy Imported
GWh
Energy
generated GWh
Energy Sold to
consumers GWh
Kampong Cham 31,577 18.6 27.6 24.5 44.8
Kratie 6,418 2.1 1.9 4.4 5.0
Stueng Treang 2,423 1.7 0.0 3.5 3.1
Kampong Thom 9,013 3.2 0.0 4.6 3.6
Preah Vihear 2,699 1.7 0.0 1.4 1.1
Ratanakiri 2,667 2.0 0.0 5.8 5.0
Siem Reap 23,289 12.0 0.0 1.4 117.6
Uddor Meanchay 3,387 0.7 10.5 0.5 10.5
Country Total 487,426 384.6 1,664.4 1,484.1 374.3
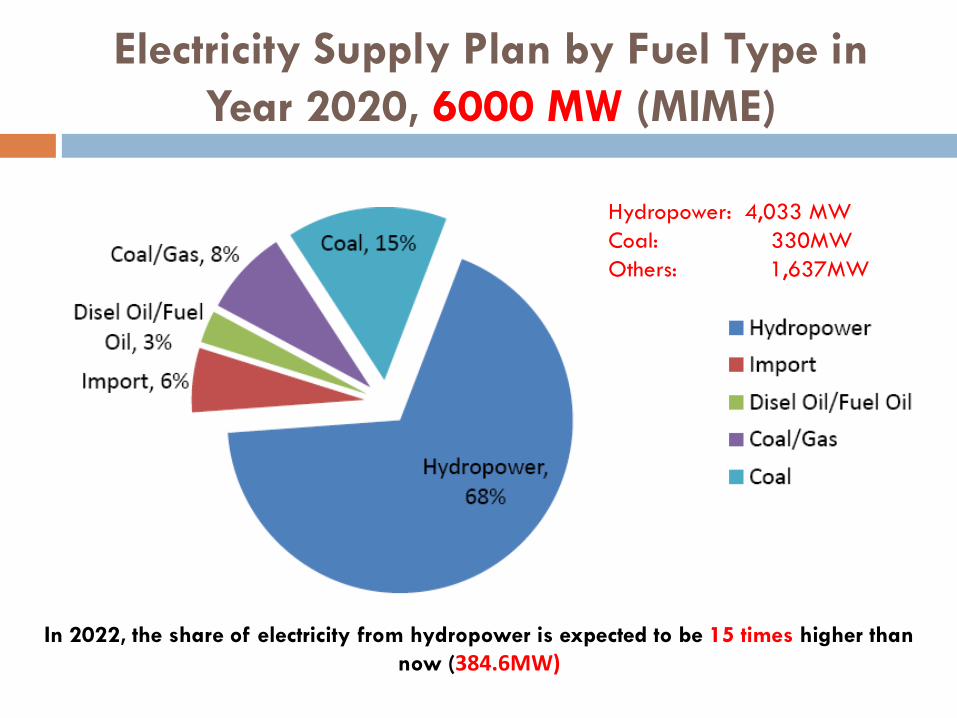
Electricity Supply Plan by Fuel Type in
Year 2020, 6000 MW (MIME)
Hydropower: 4,033 MW
Coal: 330MW
Others: 1,637MW
In 2022, the share of electricity from hydropower is expected to be 15 times higher than
now (384.6MW)
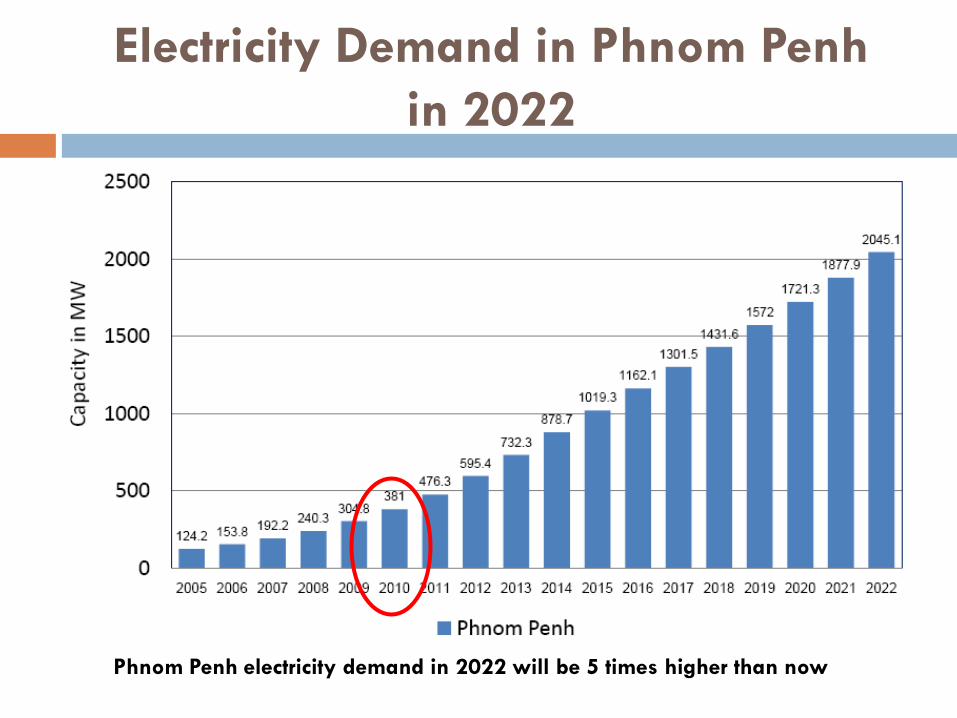
Electricity Demand in Phnom Penh
in 2022
Phnom Penh electricity demand in 2022 will be 5 times higher than now
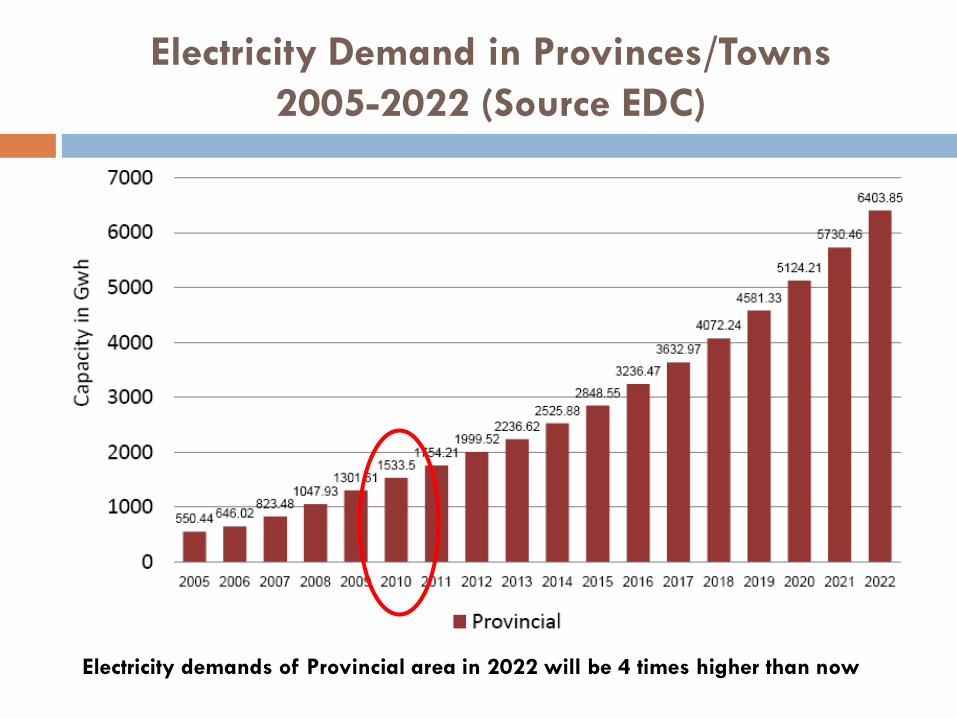
Electricity Demand in Provinces/Towns
2005-2022 (Source EDC)
Electricity demands of Provincial area in 2022 will be 4 times higher than now
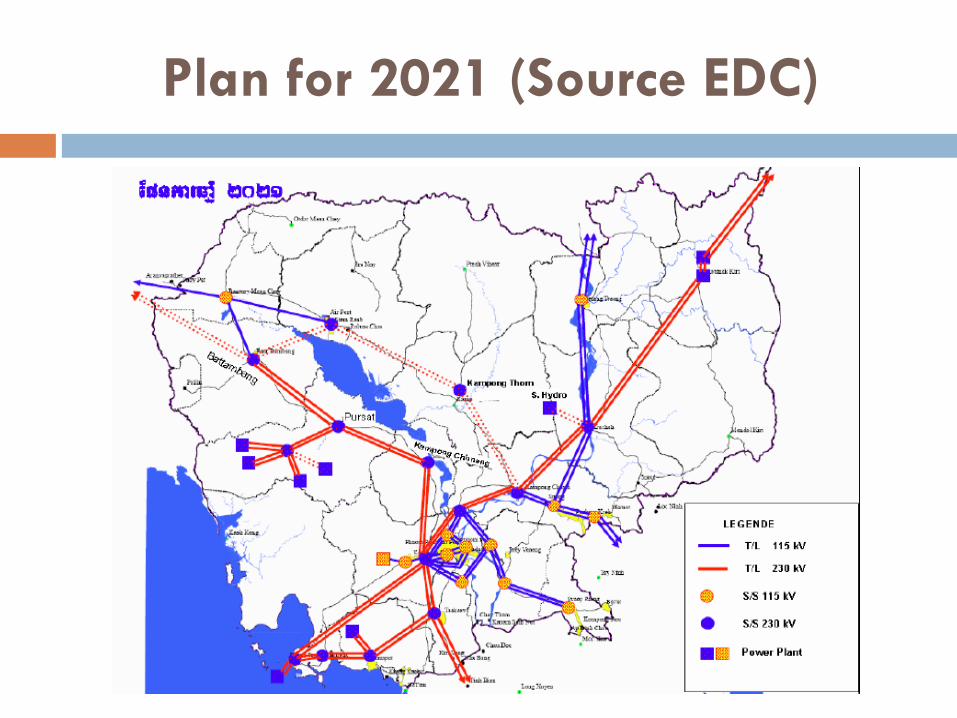
Plan for 2021 (Source EDC)
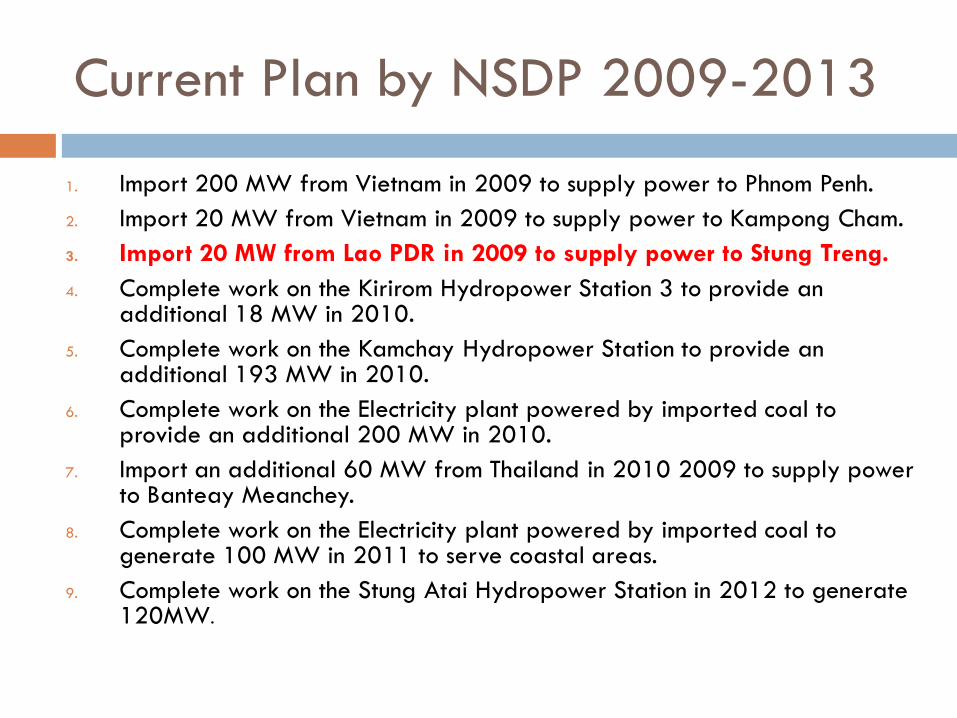
Current Plan by NSDP 2009-2013
1. Import 200 MW from Vietnam in 2009 to supply power to Phnom Penh.
2. Import 20 MW from Vietnam in 2009 to supply power to Kampong Cham.
3. Import 20 MW from Lao PDR in 2009 to supply power to Stung Treng.
4. Complete work on the Kirirom Hydropower Station 3 to provide an additional 18 MW in 2010.
5. Complete work on the Kamchay Hydropower Station to provide an additional 193 MW in 2010.
6. Complete work on the Electricity plant powered by imported coal to provide an additional 200 MW in 2010.
7. Import an additional 60 MW from Thailand in 2010 2009 to supply power to Banteay Meanchey.
8. Complete work on the Electricity plant powered by imported coal to generate 100 MW in 2011 to serve coastal areas.
9. Complete work on the Stung Atai Hydropower Station in 2012 to generate 120MW.
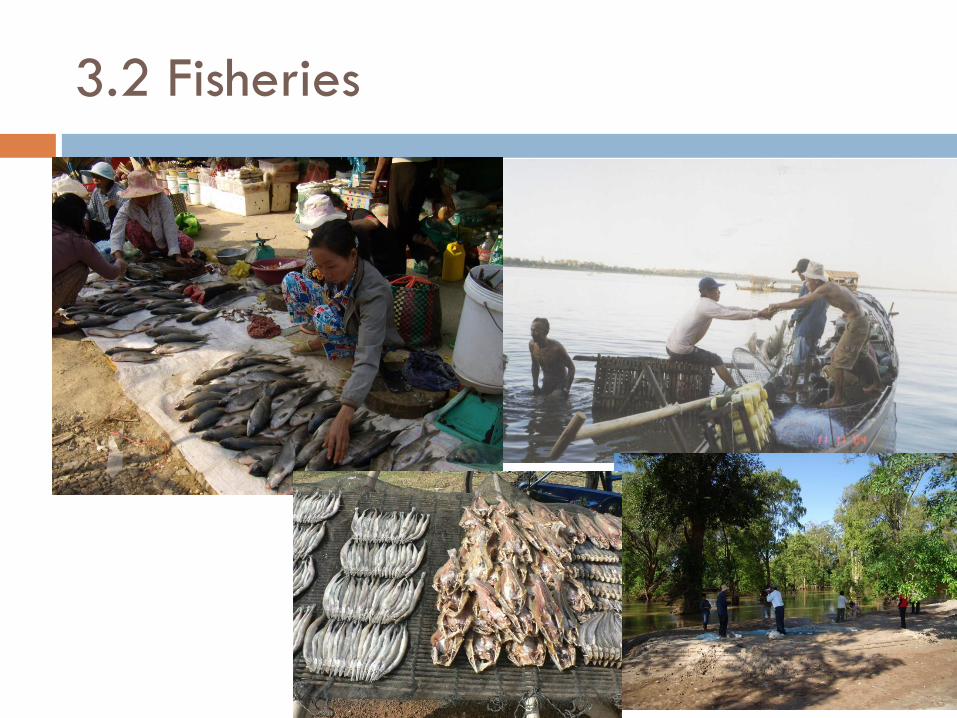
3.2 Fisheries
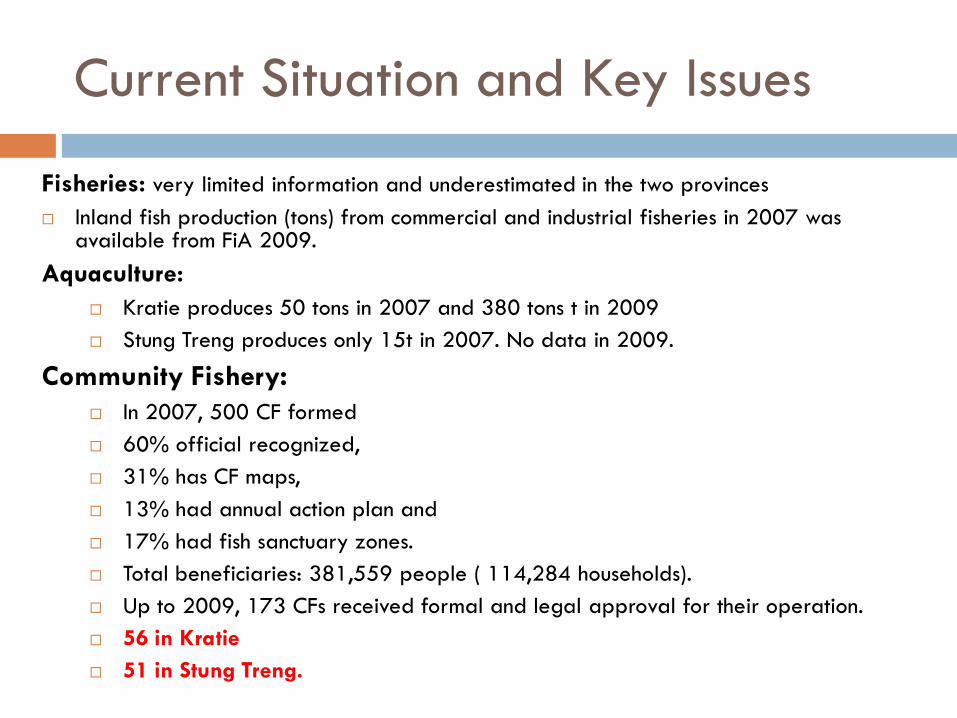
Current Situation and Key Issues
Fisheries: very limited information and underestimated in the two provinces
Inland fish production (tons) from commercial and industrial fisheries in 2007 was available from FiA 2009.
Aquaculture:
Kratie produces 50 tons in 2007 and 380 tons t in 2009
Stung Treng produces only 15t in 2007. No data in 2009.
Community Fishery: In 2007, 500 CF formed
60% official recognized,
31% has CF maps,
13% had annual action plan and
17% had fish sanctuary zones.
Total beneficiaries: 381,559 people ( 114,284 households).
Up to 2009, 173 CFs received formal and legal approval for their operation.
56 in Kratie
51 in Stung Treng.
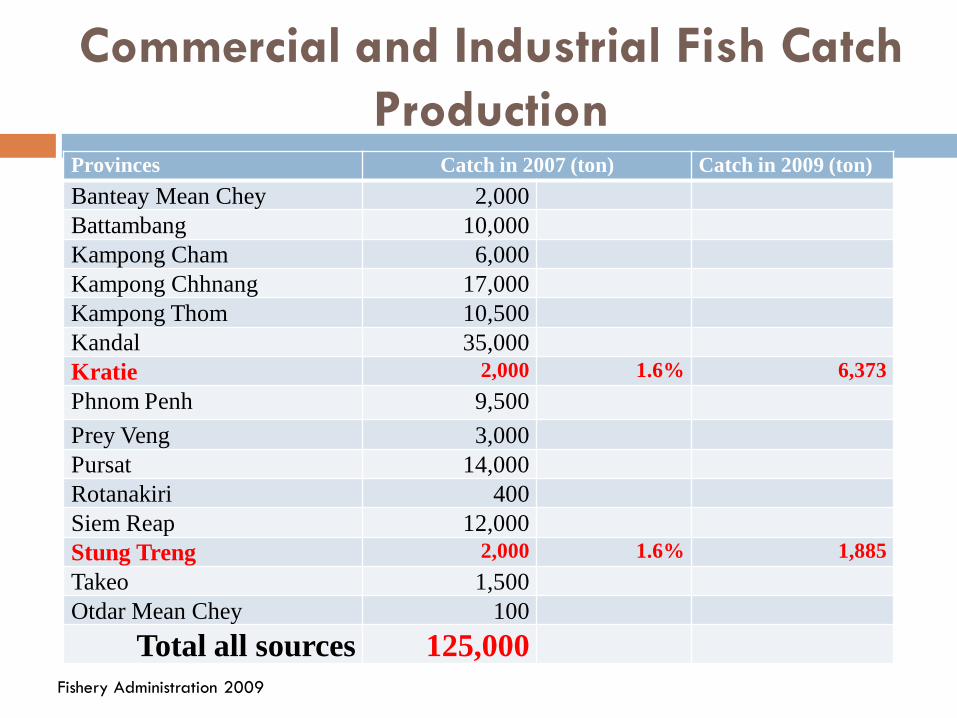
Commercial and Industrial Fish Catch
ProductionProvinces Catch in 2007 (ton) Catch in 2009 (ton)
Banteay Mean Chey 2,000
Battambang 10,000
Kampong Cham 6,000
Kampong Chhnang 17,000
Kampong Thom 10,500
Kandal 35,000
Kratie 2,000 1.6% 6,373
Phnom Penh 9,500
Prey Veng 3,000
Pursat 14,000
Rotanakiri 400
Siem Reap 12,000
Stung Treng 2,000 1.6% 1,885
Takeo 1,500
Otdar Mean Chey 100
Total all sources 125,000
Fishery Administration 2009
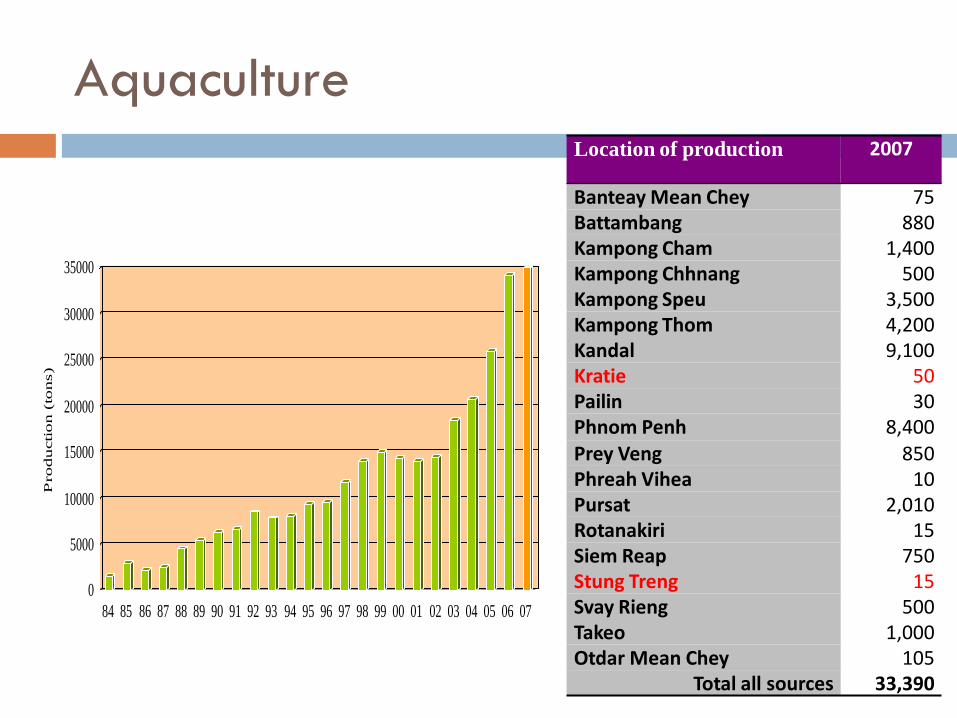
AquacultureLocation of production 2007
Banteay Mean Chey 75Battambang 880Kampong Cham 1,400Kampong Chhnang 500Kampong Speu 3,500Kampong Thom 4,200Kandal 9,100Kratie 50Pailin 30Phnom Penh 8,400Prey Veng 850Phreah Vihea 10Pursat 2,010Rotanakiri 15Siem Reap 750Stung Treng 15Svay Rieng 500Takeo 1,000Otdar Mean Chey 105
Total all sources 33,390
0
5000
10000
15000
20000
25000
30000
35000
Production (
tons)
84 85 86 87 88 89 90 91 92 93 94 95 96 97 98 99 00 01 02 03 04 05 06 07
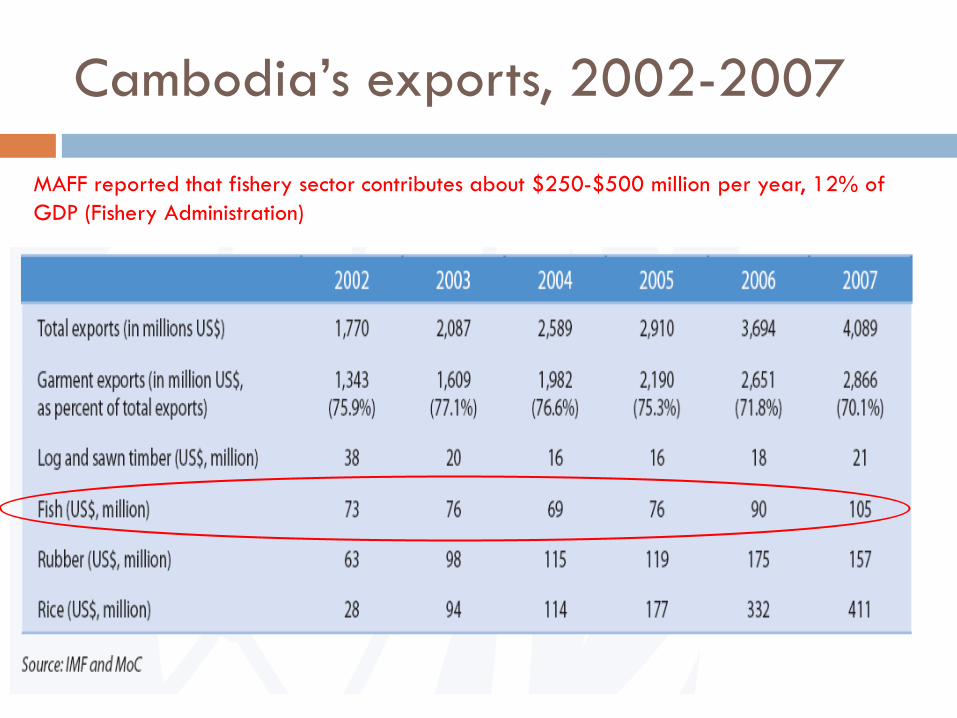
Cambodia’s exports, 2002-2007
MAFF reported that fishery sector contributes about $250-$500 million per year, 12% of
GDP (Fishery Administration)
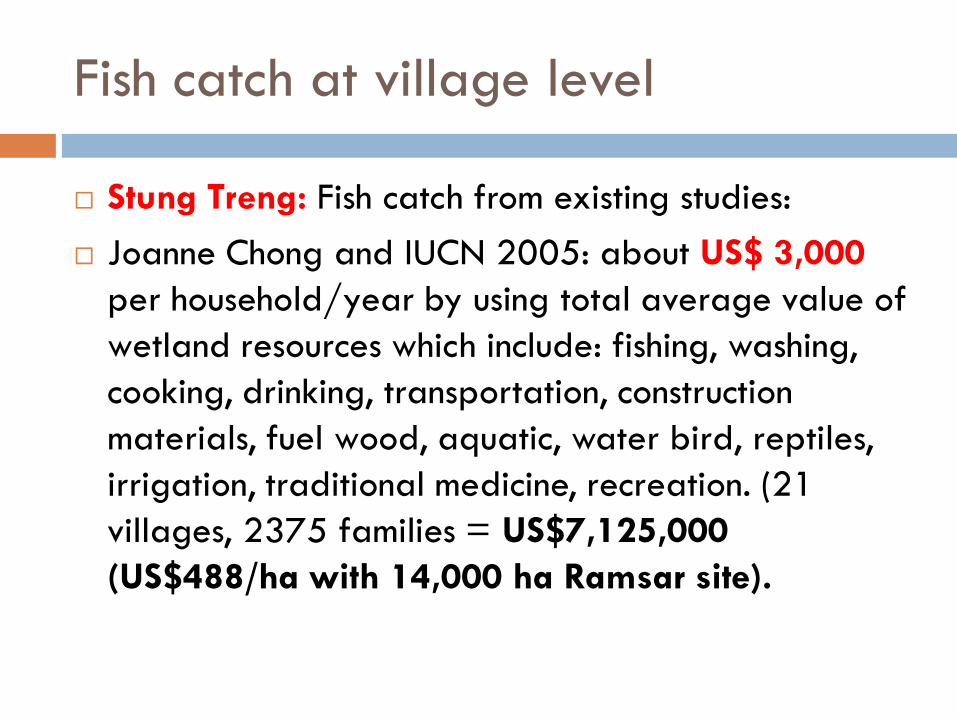
Fish catch at village level
Stung Treng: Fish catch from existing studies:
Joanne Chong and IUCN 2005: about US$ 3,000
per household/year by using total average value of
wetland resources which include: fishing, washing,
cooking, drinking, transportation, construction
materials, fuel wood, aquatic, water bird, reptiles,
irrigation, traditional medicine, recreation. (21
villages, 2375 families = US$7,125,000
(US$488/ha with 14,000 ha Ramsar site).
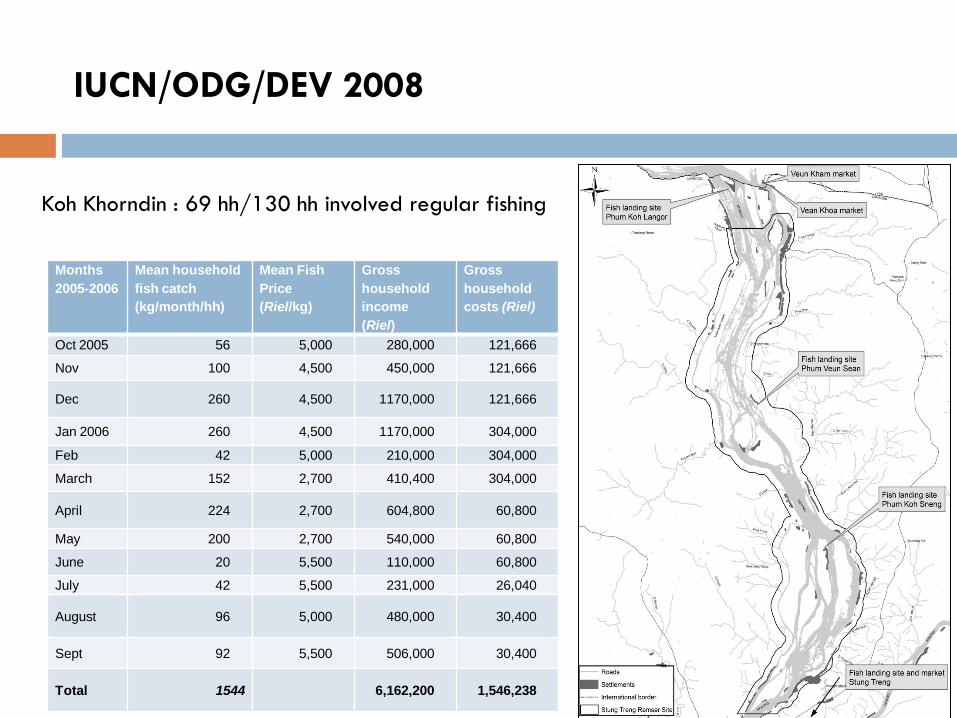
Months
2005-2006
Mean household
fish catch
(kg/month/hh)
Mean Fish
Price
(Riel/kg)
Gross
household
income
(Riel)
Gross
household
costs (Riel)
Oct 2005 56 5,000 280,000 121,666
Nov 100 4,500 450,000 121,666
Dec 260 4,500 1170,000 121,666
Jan 2006 260 4,500 1170,000 304,000
Feb 42 5,000 210,000 304,000
March 152 2,700 410,400 304,000
April 224 2,700 604,800 60,800
May 200 2,700 540,000 60,800
June 20 5,500 110,000 60,800
July 42 5,500 231,000 26,040
August 96 5,000 480,000 30,400
Sept 92 5,500 506,000 30,400
Total 1544 6,162,200 1,546,238
IUCN/ODG/DEV 2008
Koh Khorndin : 69 hh/130 hh involved regular fishing
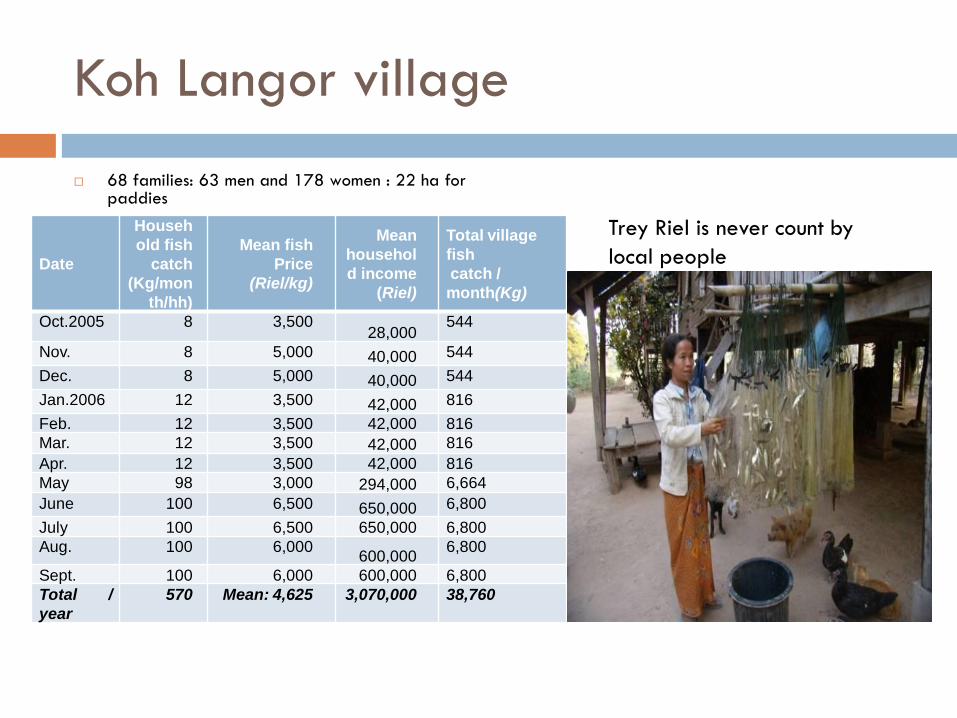
Koh Langor village
68 families: 63 men and 178 women : 22 ha for paddies
Date
Househ
old fish
catch
(Kg/mon
th/hh)
Mean fish
Price
(Riel/kg)
Mean
househol
d income
(Riel)
Total village
fish
catch /
month(Kg)
Oct.2005 8 3,50028,000
544
Nov. 8 5,000 40,000 544
Dec. 8 5,000 40,000 544
Jan.2006 12 3,500 42,000 816
Feb. 12 3,500 42,000 816
Mar. 12 3,500 42,000 816
Apr. 12 3,500 42,000 816
May 98 3,000 294,000 6,664
June 100 6,500 650,000 6,800
July 100 6,500 650,000 6,800
Aug. 100 6,000600,000
6,800
Sept. 100 6,000 600,000 6,800
Total /
year
570 Mean: 4,625 3,070,000 38,760
Trey Riel is never count by
local people
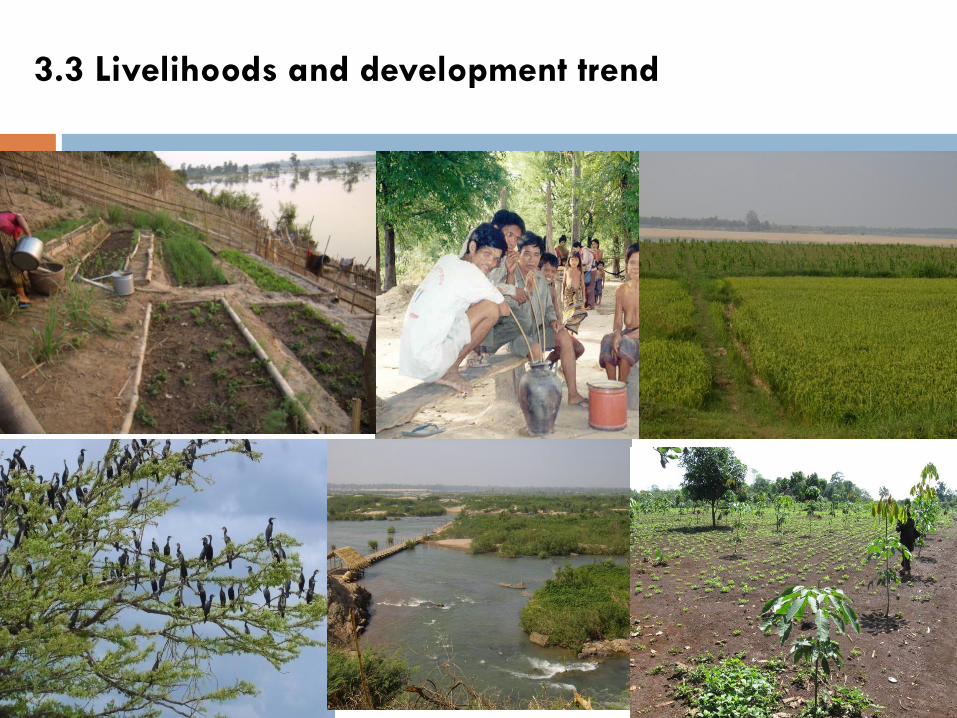
3.3 Livelihoods and development trend
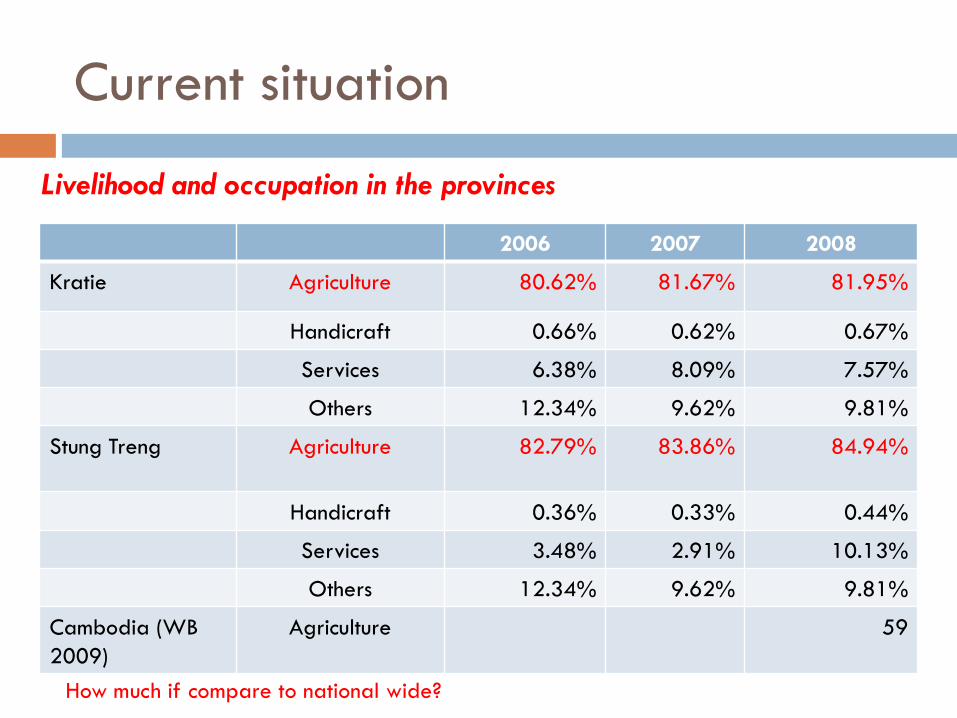
Current situation
2006 2007 2008
Kratie Agriculture 80.62% 81.67% 81.95%
Handicraft 0.66% 0.62% 0.67%
Services 6.38% 8.09% 7.57%
Others 12.34% 9.62% 9.81%
Stung Treng Agriculture 82.79% 83.86% 84.94%
Handicraft 0.36% 0.33% 0.44%
Services 3.48% 2.91% 10.13%
Others 12.34% 9.62% 9.81%
Cambodia (WB
2009)
Agriculture 59
Livelihood and occupation in the provinces
How much if compare to national wide?
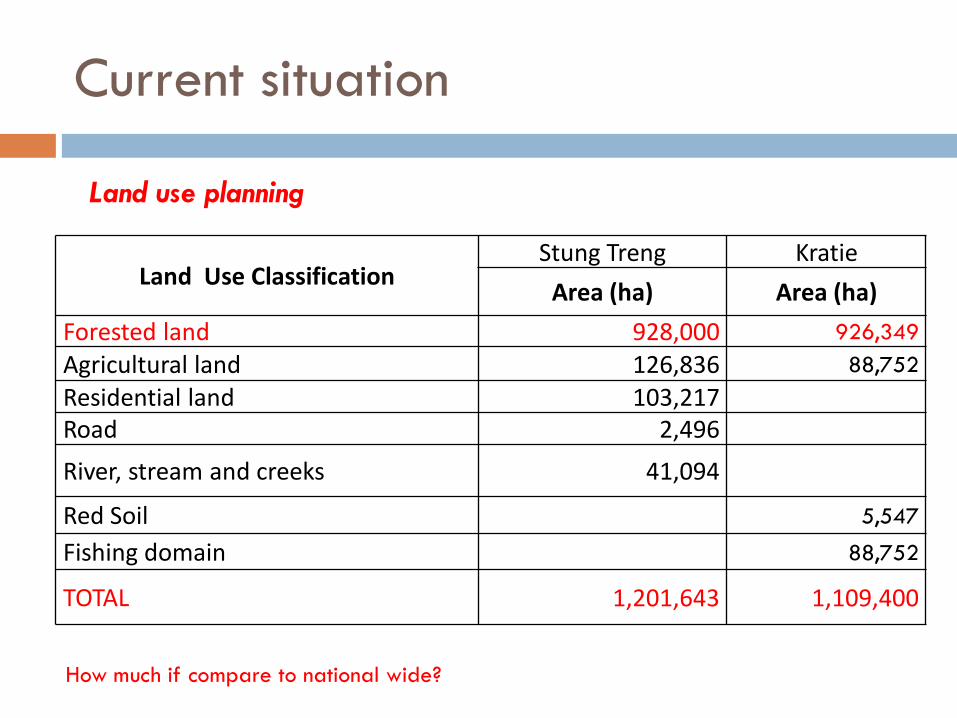
Current situation
Land Use Classification Stung Treng Kratie
Area (ha) Area (ha)
Forested land 928,000 926,349
Agricultural land 126,836 88,752
Residential land 103,217Road 2,496
River, stream and creeks 41,094
Red Soil 5,547
Fishing domain 88,752
TOTAL 1,201,643 1,109,400
Land use planning
How much if compare to national wide?
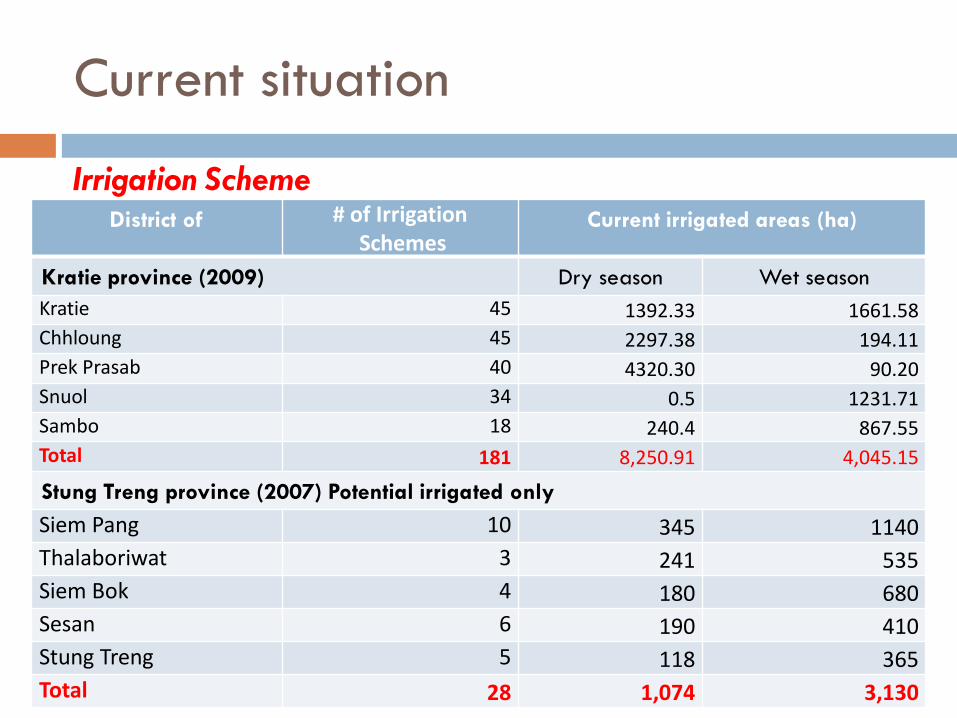
Current situation
Irrigation SchemeDistrict of # of Irrigation
Schemes Current irrigated areas (ha)
Kratie province (2009) Dry season Wet season
Kratie 45 1392.33 1661.58
Chhloung 45 2297.38 194.11
Prek Prasab 40 4320.30 90.20
Snuol 34 0.5 1231.71
Sambo 18 240.4 867.55
Total 181 8,250.91 4,045.15
Stung Treng province (2007) Potential irrigated only
Siem Pang 10 345 1140
Thalaboriwat 3 241 535
Siem Bok 4 180 680
Sesan 6 190 410
Stung Treng 5 118 365
Total 28 1,074 3,130
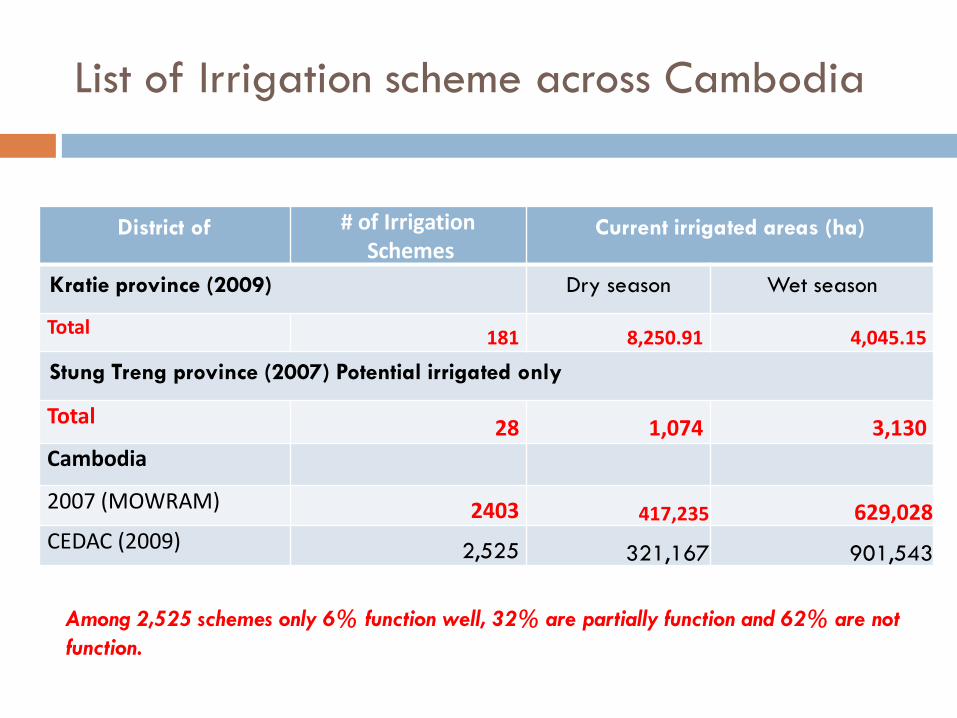
List of Irrigation scheme across Cambodia
District of # of IrrigationSchemes
Current irrigated areas (ha)
Kratie province (2009) Dry season Wet season
Total 181 8,250.91 4,045.15
Stung Treng province (2007) Potential irrigated only
Total 28 1,074 3,130
Cambodia
2007 (MOWRAM) 2403 417,235 629,028CEDAC (2009) 2,525 321,167 901,543
Among 2,525 schemes only 6% function well, 32% are partially function and 62% are not
function.
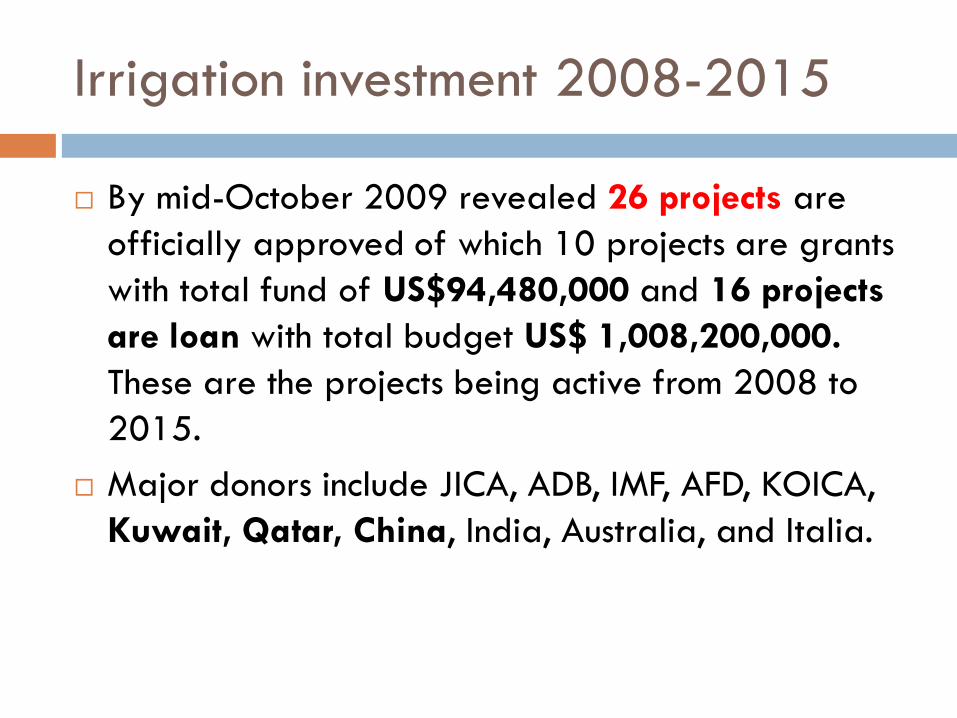
Irrigation investment 2008-2015
By mid-October 2009 revealed 26 projects are
officially approved of which 10 projects are grants
with total fund of US$94,480,000 and 16 projects
are loan with total budget US$ 1,008,200,000.
These are the projects being active from 2008 to
2015.
Major donors include JICA, ADB, IMF, AFD, KOICA,
Kuwait, Qatar, China, India, Australia, and Italia.
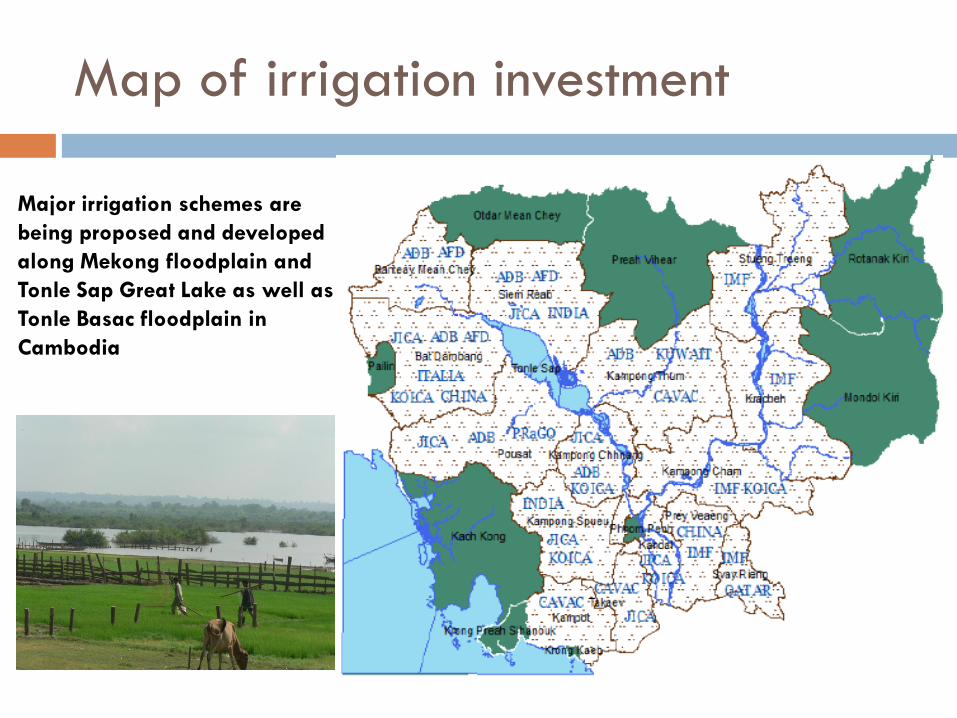
Map of irrigation investment
Major irrigation schemes are
being proposed and developed
along Mekong floodplain and
Tonle Sap Great Lake as well as
Tonle Basac floodplain in
Cambodia
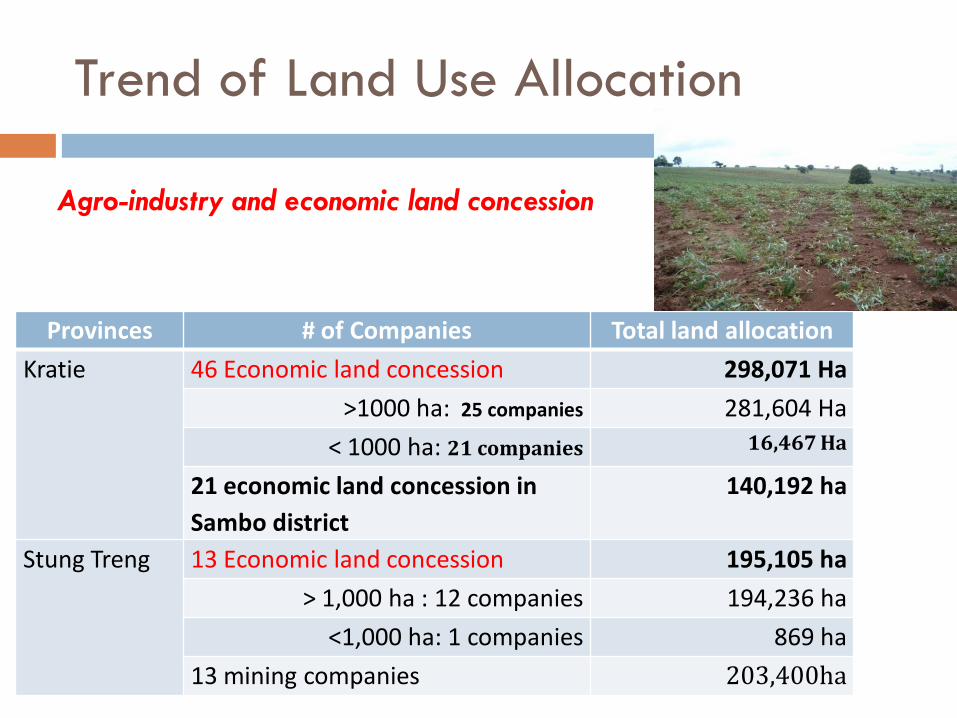
Provinces # of Companies Total land allocation
Kratie 46 Economic land concession 298,071 Ha
>1000 ha: 25 companies 281,604 Ha
< 1000 ha: 21 companies 16,467 Ha
21 economic land concession in
Sambo district
140,192 ha
Stung Treng 13 Economic land concession 195,105 ha
> 1,000 ha : 12 companies 194,236 ha
<1,000 ha: 1 companies 869 ha
13 mining companies 203,400ha
Agro-industry and economic land concession
Trend of Land Use Allocation
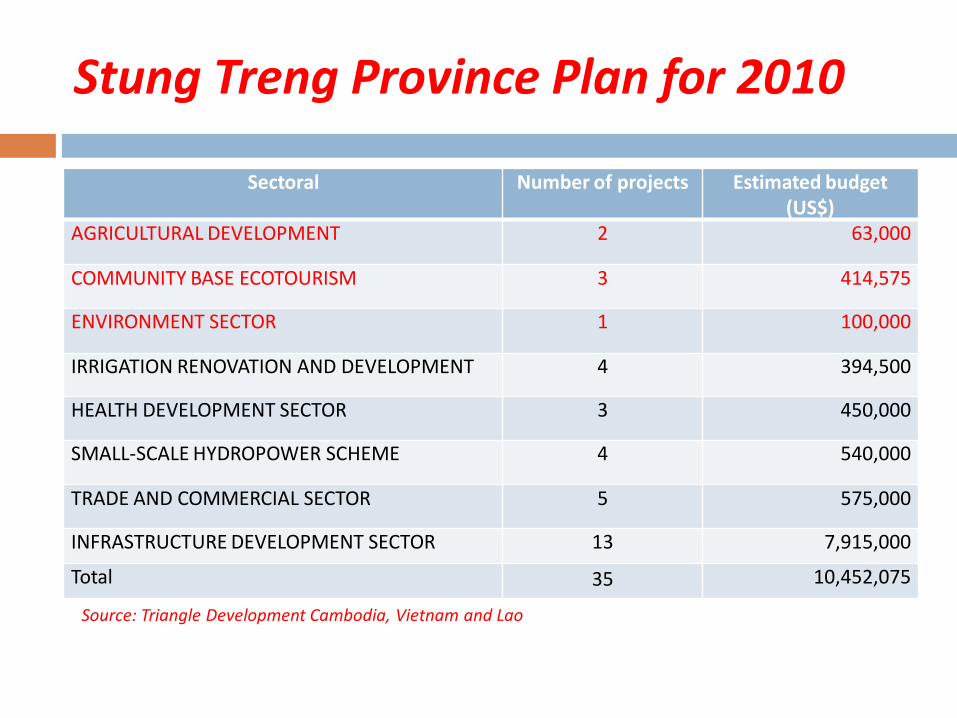
Sectoral Number of projects Estimated budget (US$)
AGRICULTURAL DEVELOPMENT 2 63,000
COMMUNITY BASE ECOTOURISM 3 414,575
ENVIRONMENT SECTOR 1 100,000
IRRIGATION RENOVATION AND DEVELOPMENT 4 394,500
HEALTH DEVELOPMENT SECTOR 3 450,000
SMALL-SCALE HYDROPOWER SCHEME 4 540,000
TRADE AND COMMERCIAL SECTOR 5 575,000
INFRASTRUCTURE DEVELOPMENT SECTOR 13 7,915,000
Total 35 10,452,075
Source: Triangle Development Cambodia, Vietnam and Lao
Stung Treng Province Plan for 2010
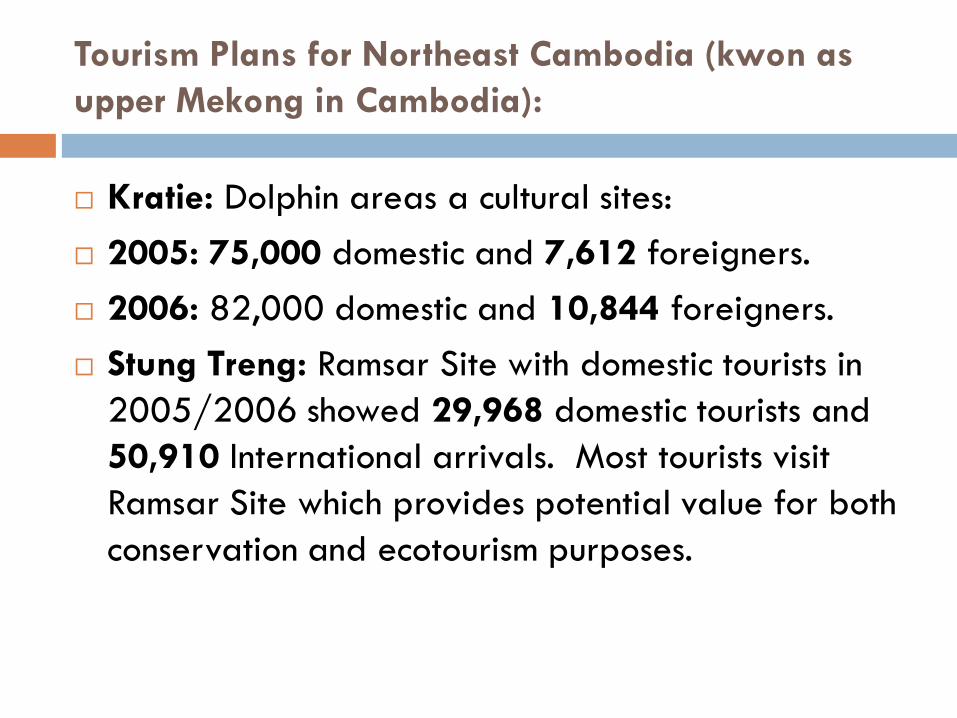
Tourism Plans for Northeast Cambodia (kwon as
upper Mekong in Cambodia):
Kratie: Dolphin areas a cultural sites:
2005: 75,000 domestic and 7,612 foreigners.
2006: 82,000 domestic and 10,844 foreigners.
Stung Treng: Ramsar Site with domestic tourists in
2005/2006 showed 29,968 domestic tourists and
50,910 International arrivals. Most tourists visit
Ramsar Site which provides potential value for both
conservation and ecotourism purposes.
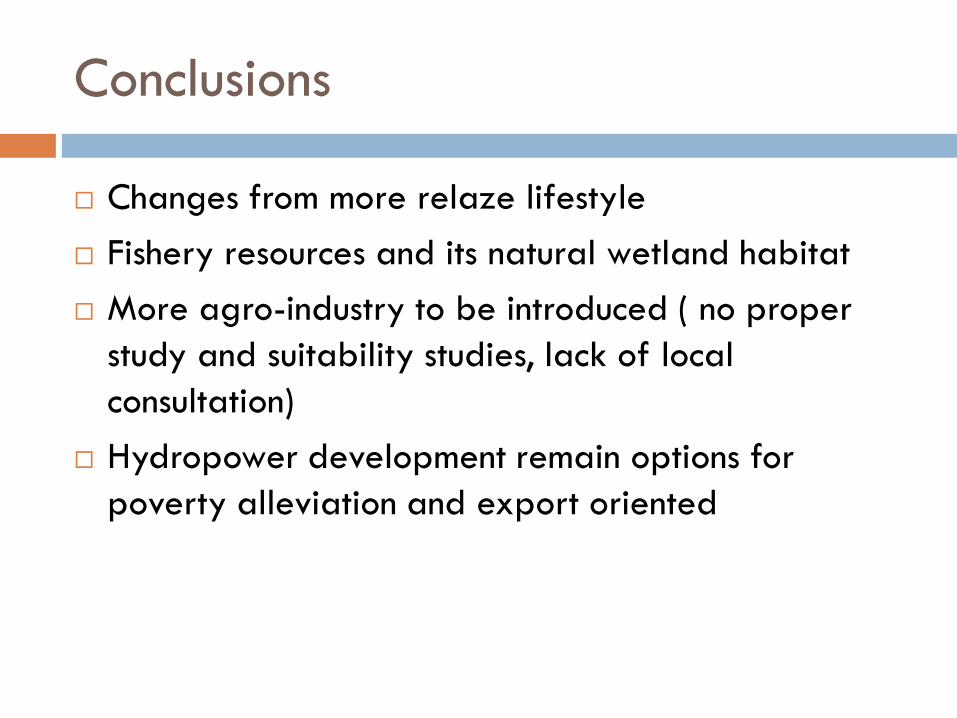
Conclusions
Changes from more relaze lifestyle
Fishery resources and its natural wetland habitat
More agro-industry to be introduced ( no proper
study and suitability studies, lack of local
consultation)
Hydropower development remain options for
poverty alleviation and export oriented