Cambiamento attuale: Ghiaccio e mare CLIMATOLOGIA Prof. Carlo Bisci.
53
Cambiamento attuale: Ghiaccio e mare CLIMATOLOGIA Prof. Carlo Bisci
-
Upload
elaine-wright -
Category
Documents
-
view
214 -
download
0
Transcript of Cambiamento attuale: Ghiaccio e mare CLIMATOLOGIA Prof. Carlo Bisci.
Cambiamento attuale:
Ghiaccio e mare
CLIMATOLOGIA
Prof. Carlo Bisci


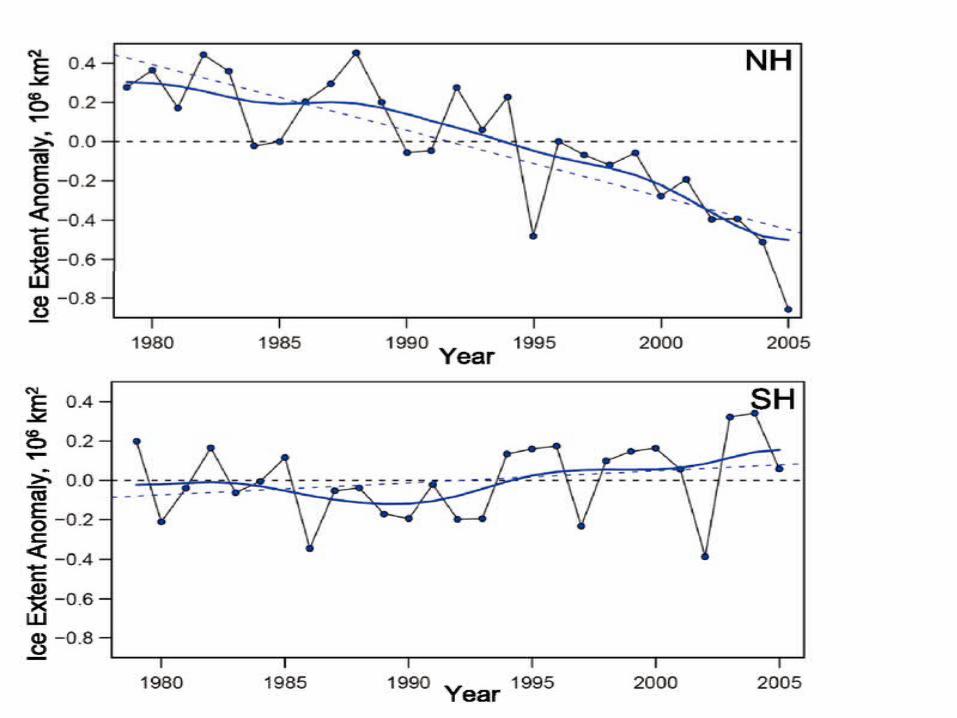

Summer minimum arctic sea ice extent from 1979 to 2005
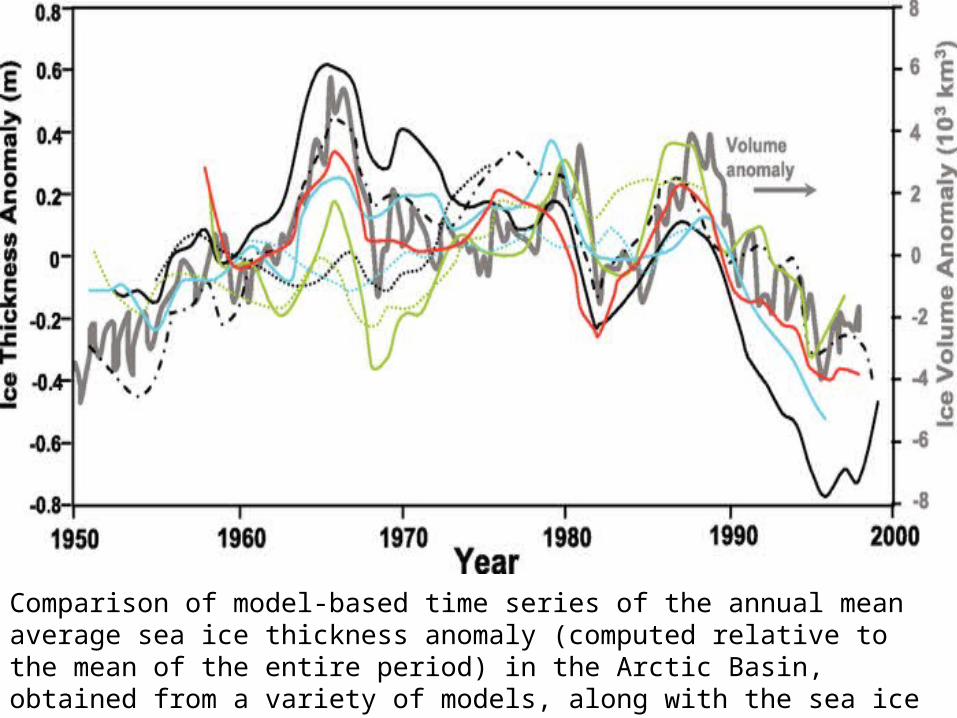
Comparison of model-based time series of the annual mean average sea ice thickness anomaly (computed relative to the mean of the entire period) in the Arctic Basin, obtained from a variety of models, along with the sea ice volume anomalies in the Arctic Basin (grey curve and right-hand scale).
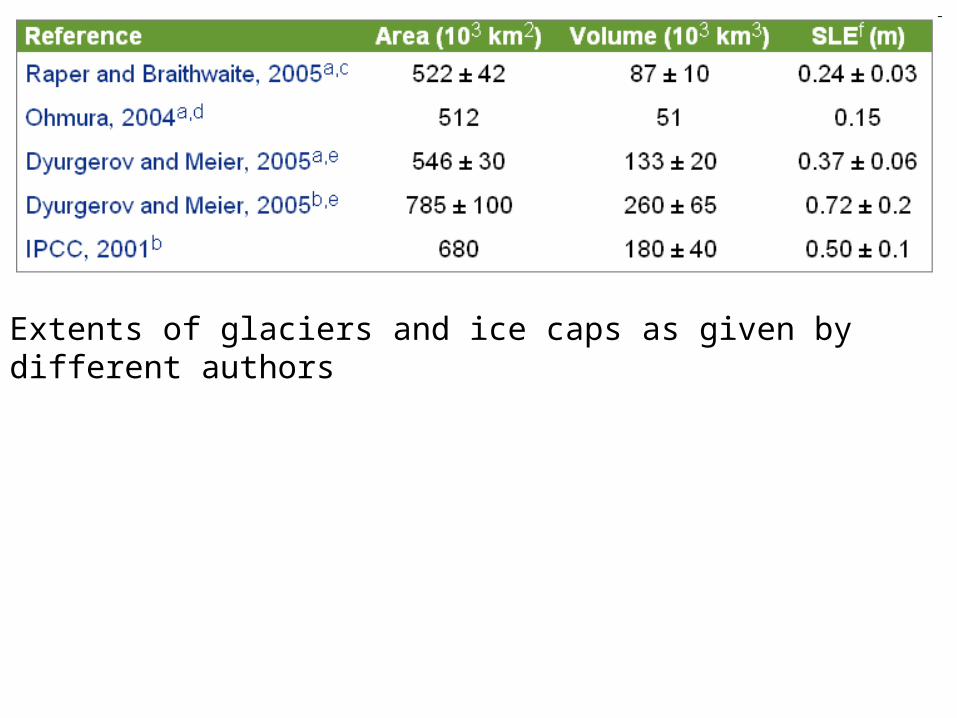
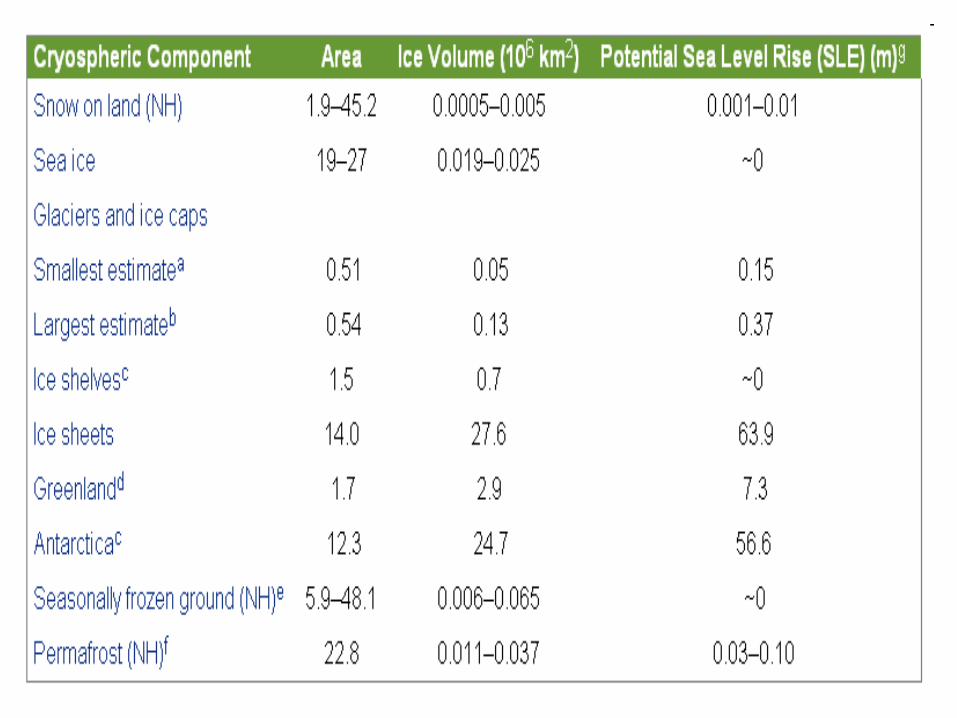
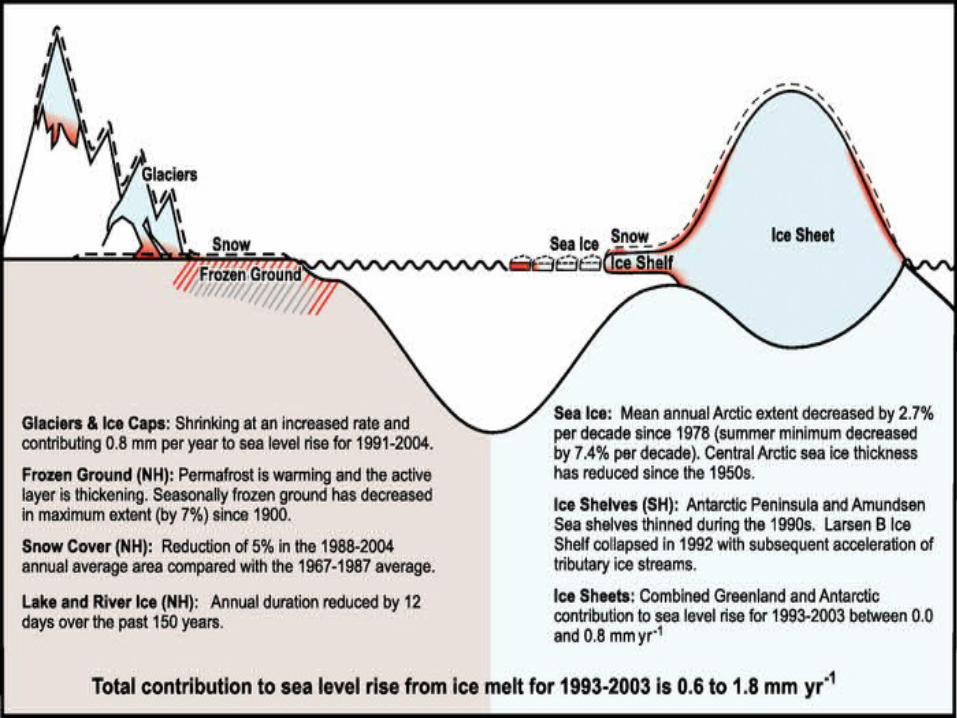
Extents of glaciers and ice caps as given by different authors
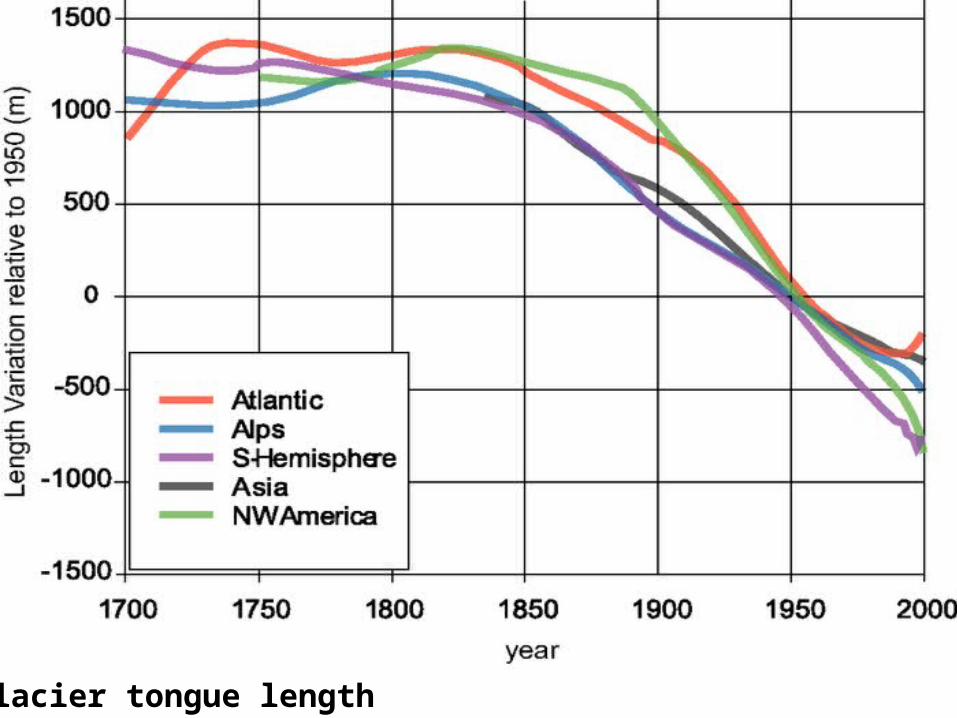
Glacier tongue length
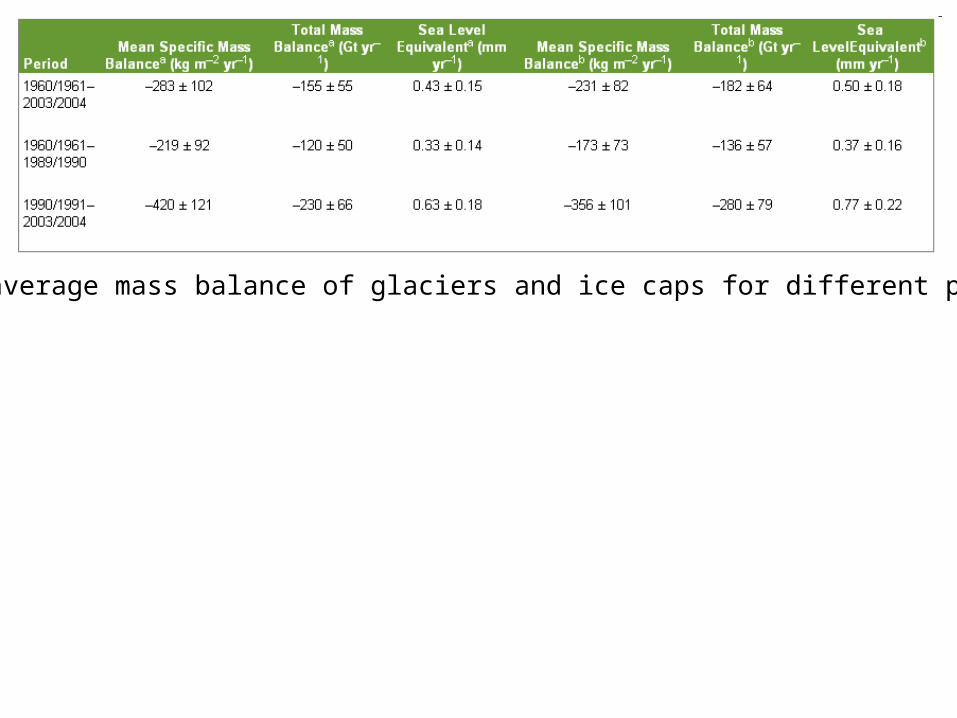
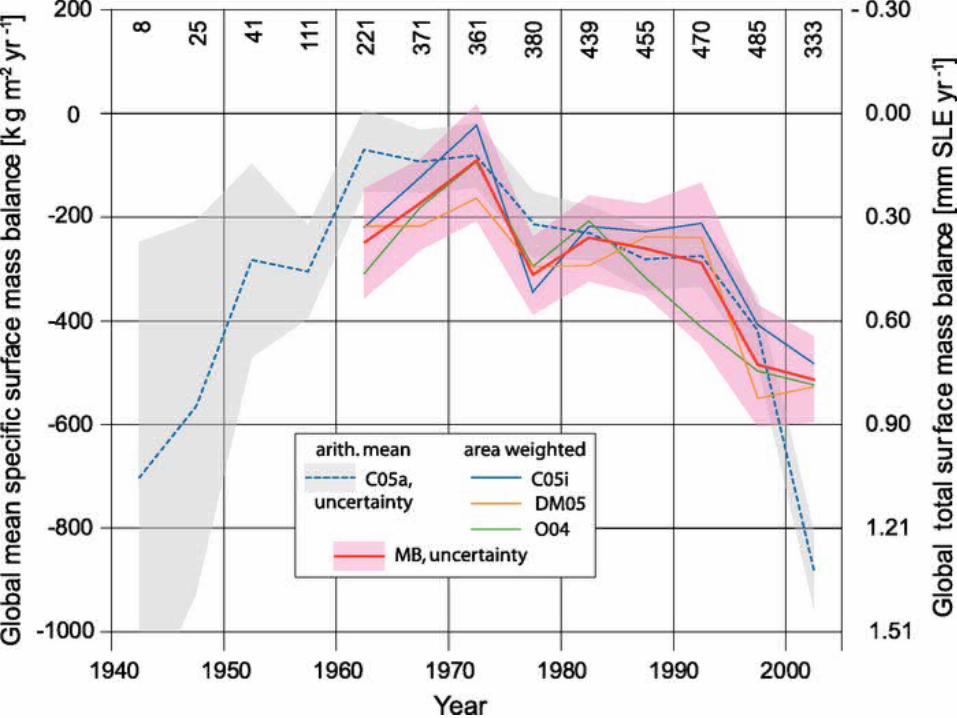
Global average mass balance of glaciers and ice caps for different periods


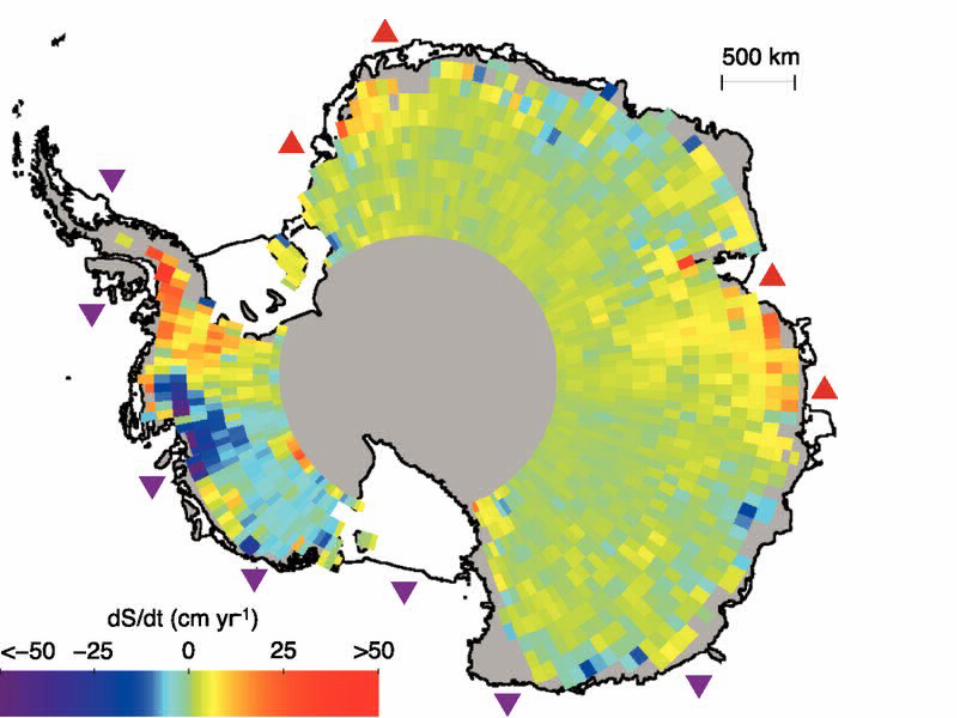
Rates of surface elevation change (dS/dt) on the Greenland Ice Sheet
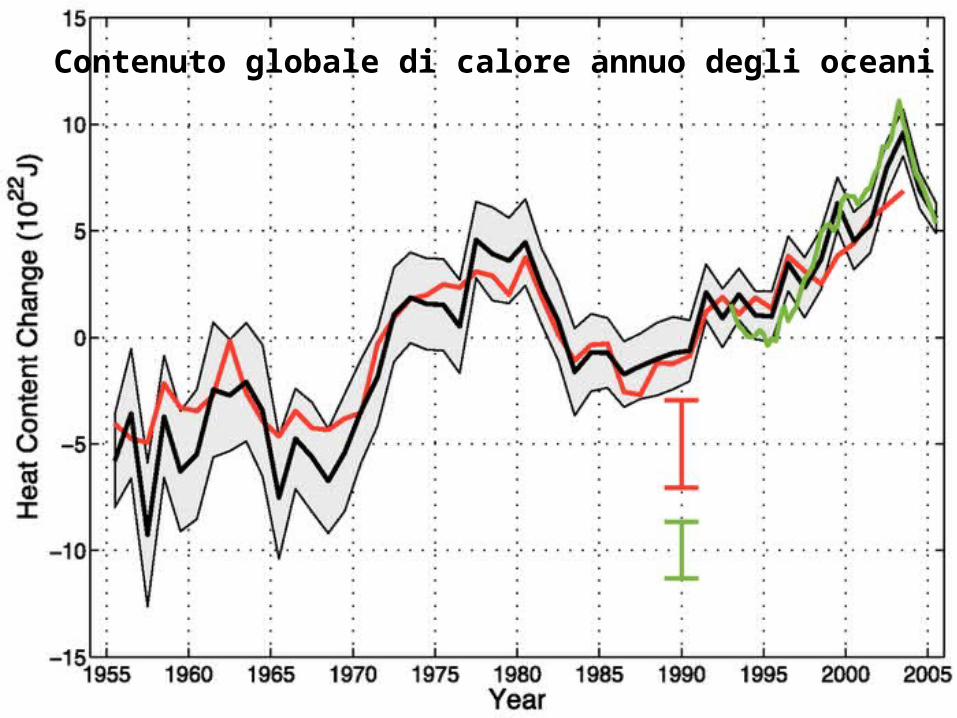
Contenuto globale di calore annuo degli oceani

Linear trends (1955–2003) of change in ocean heat content per unit surface area (W m–2) for the 0 to 700 m layer. The linear trend is computed at each grid point using a least squares fit to the time series at each grid point. The contour interval is 0.25 W m–2. Red shading indicates values equal to or greater than 0.25 W m–2 and blue shading indicates values equal to or less than –0.25 W m–2.

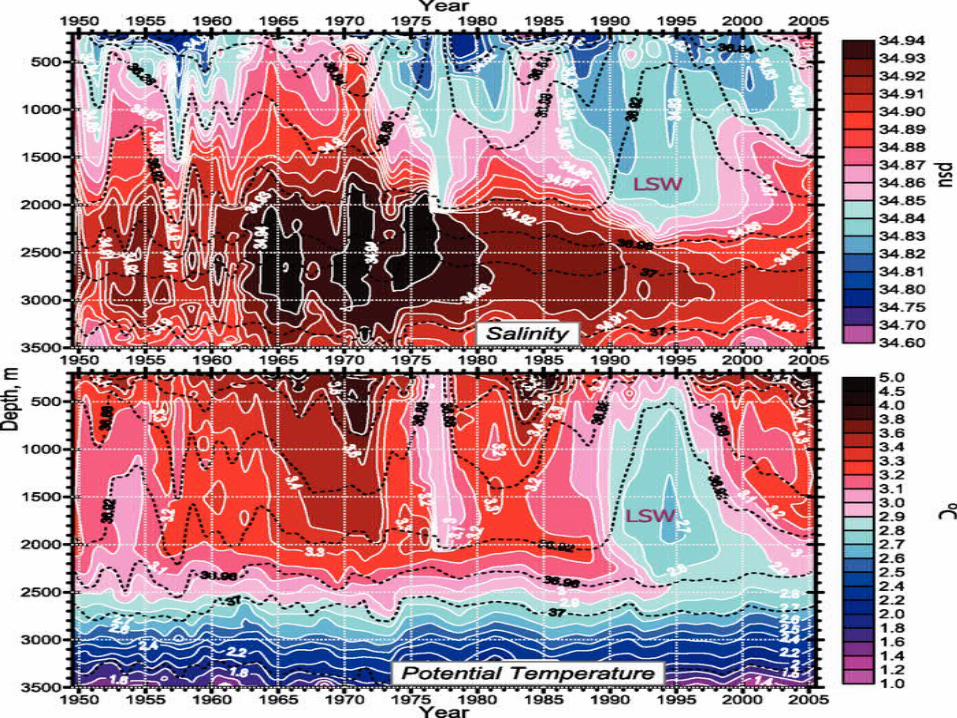
Linear trend (1955–2003) of zonally averaged temperature in the upper 1,500 m of the water column of the Atlantic, Pacific, Indian and World Oceans

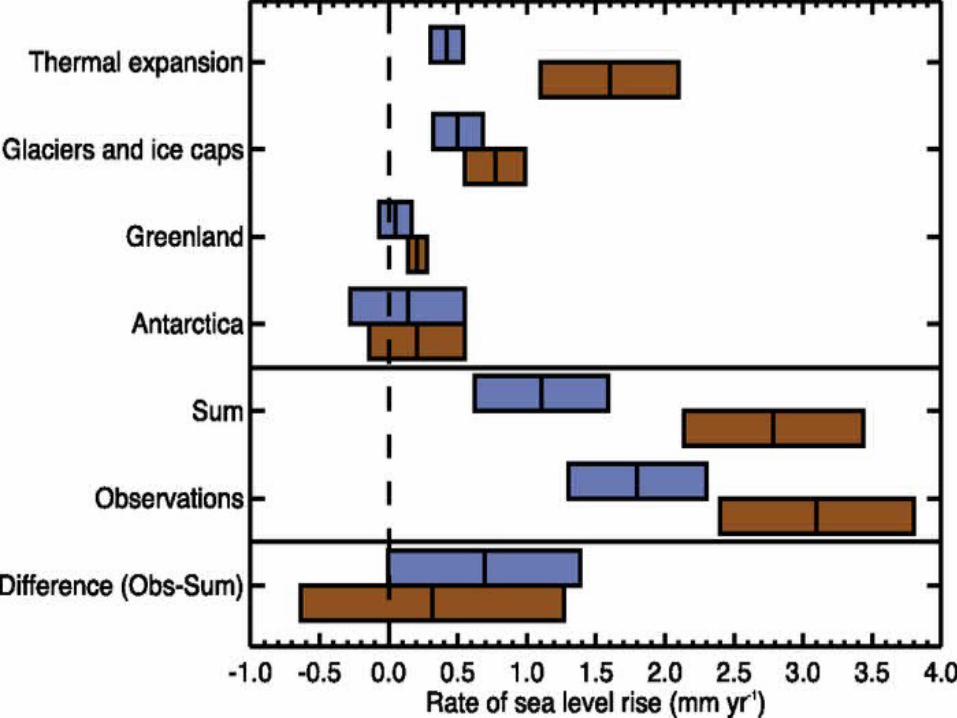
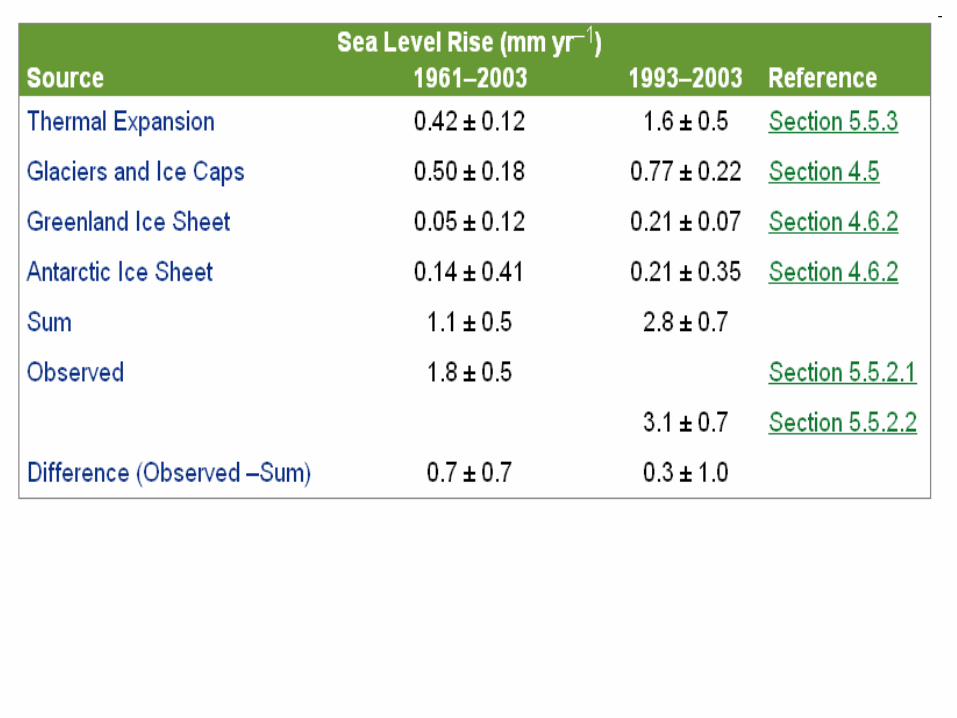
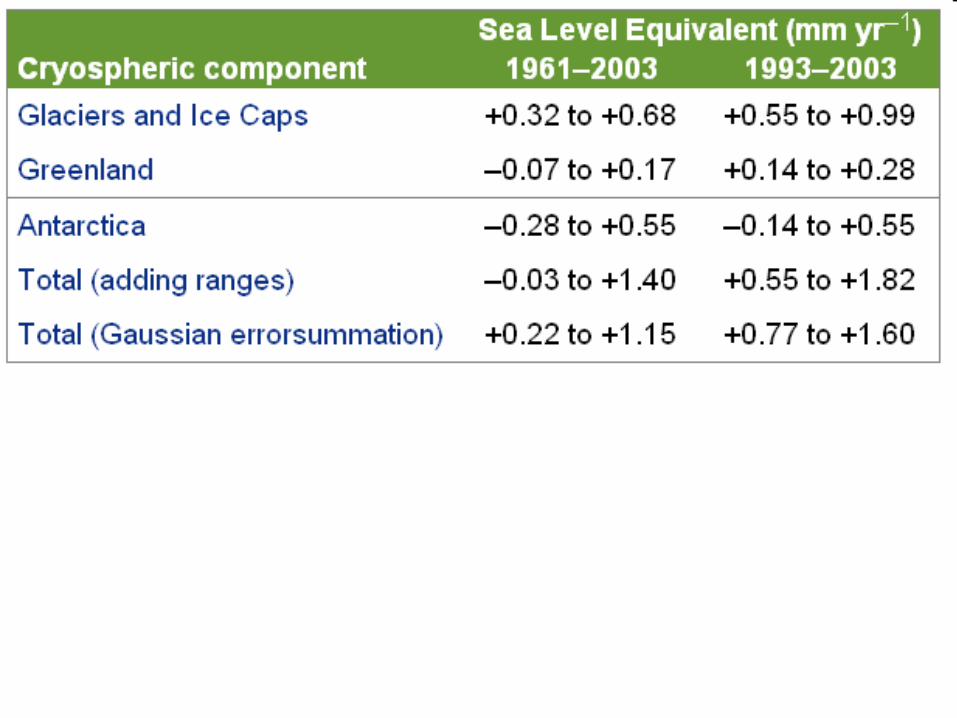
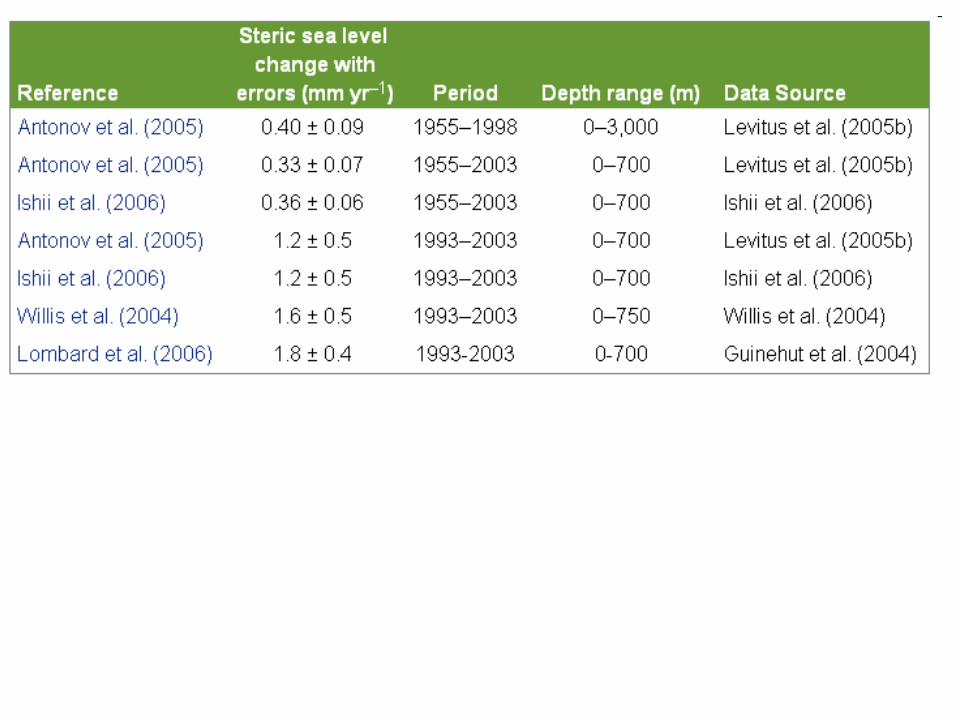
Blue bars are for 1961 to 2003, burgundy bars for 1993 to 2003

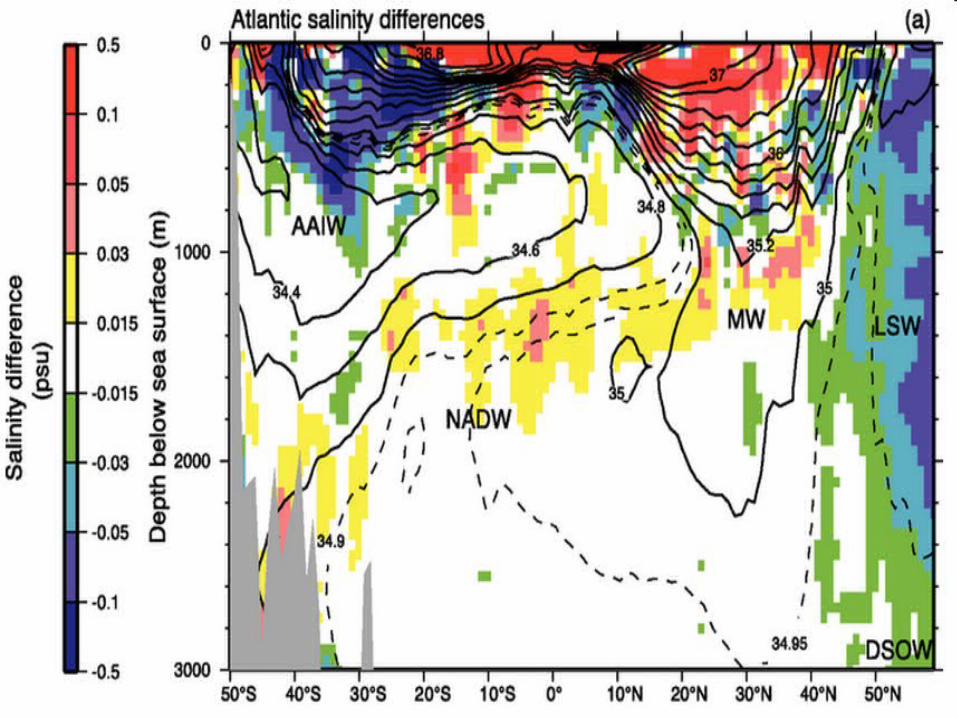
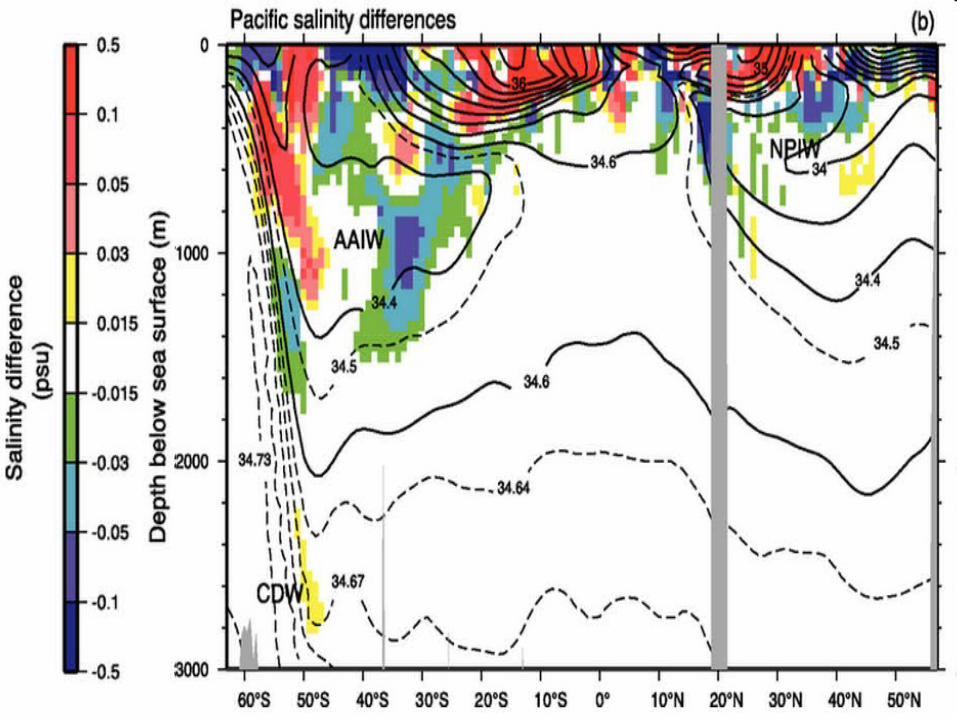
Linear trends (1955–1998) of zonally averaged salinity (psu) in the upper 500 m of the Atlantic, Pacific, Indian and World Oceans

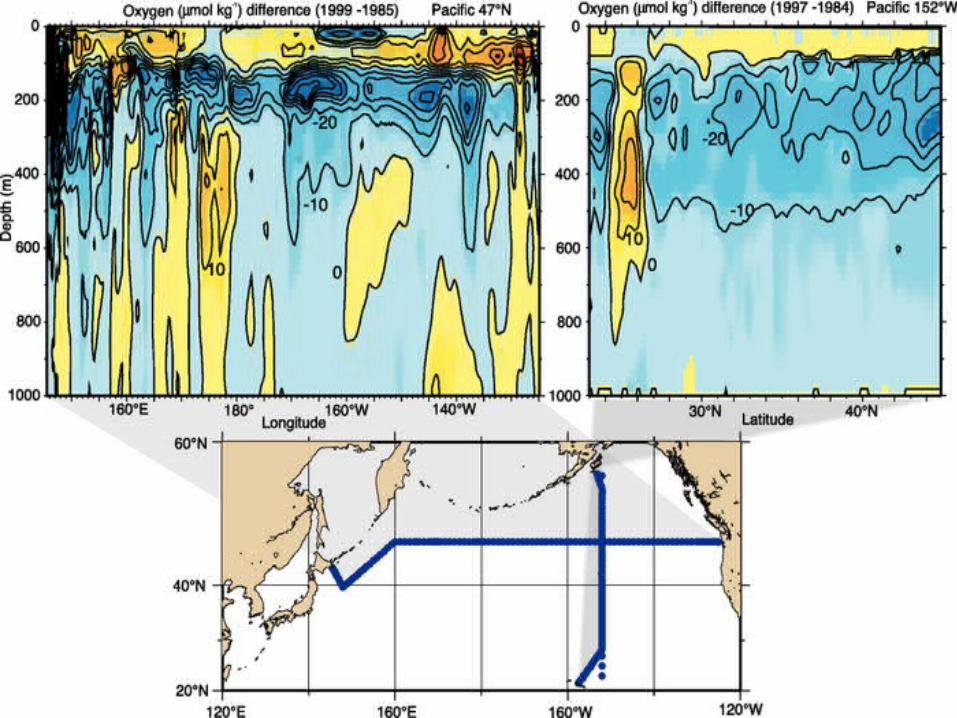
Temperature trends (°C yr–1) at 900 m depth
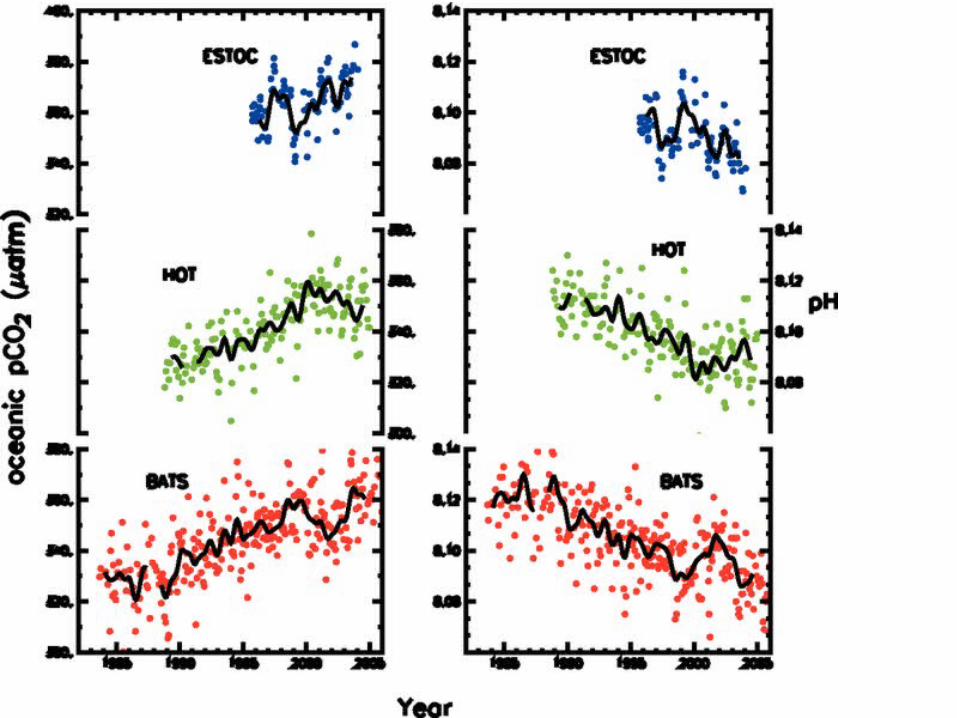

Column inventory of anthropogenic carbon (mol m–2) as of 1994. Anthropogenic carbon is estimated indirectly by correcting the measured DIC for the contributions of organic matter decomposition and dissolution of carbonate minerals, and taking into account the DIC concentration the water had in the pre-industrial ocean when it was last in contact with the atmosphere. The global inventory of anthropogenic carbon taken up by the ocean between 1750 and 1994 is estimated to be 118 ± 19 GtC.

Pacific-Indian Ocean
Atlantic Ocean
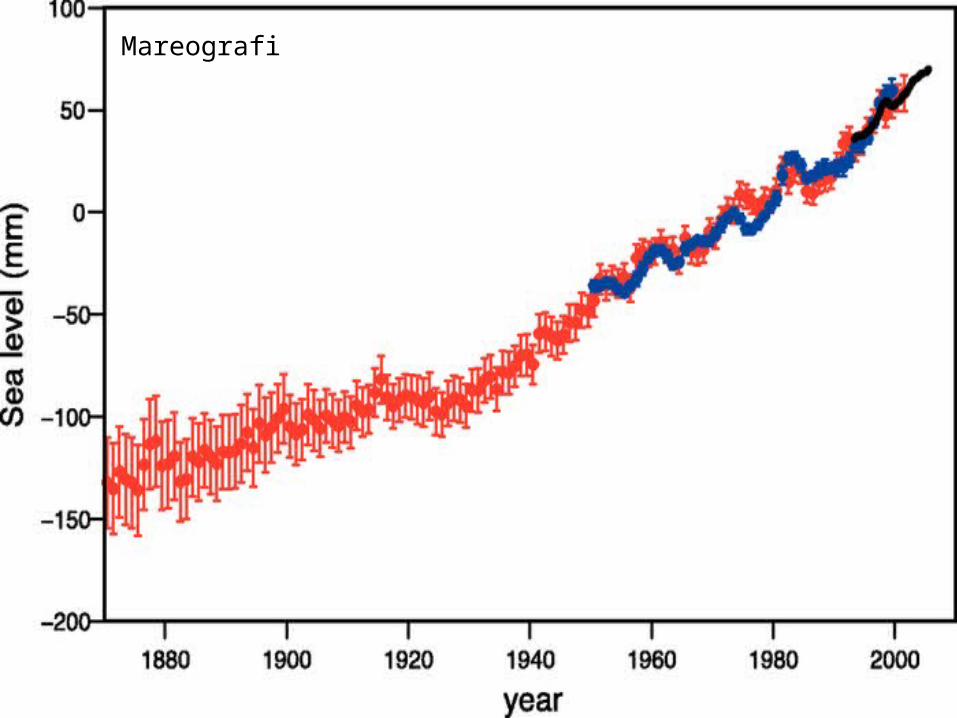
Mareografi
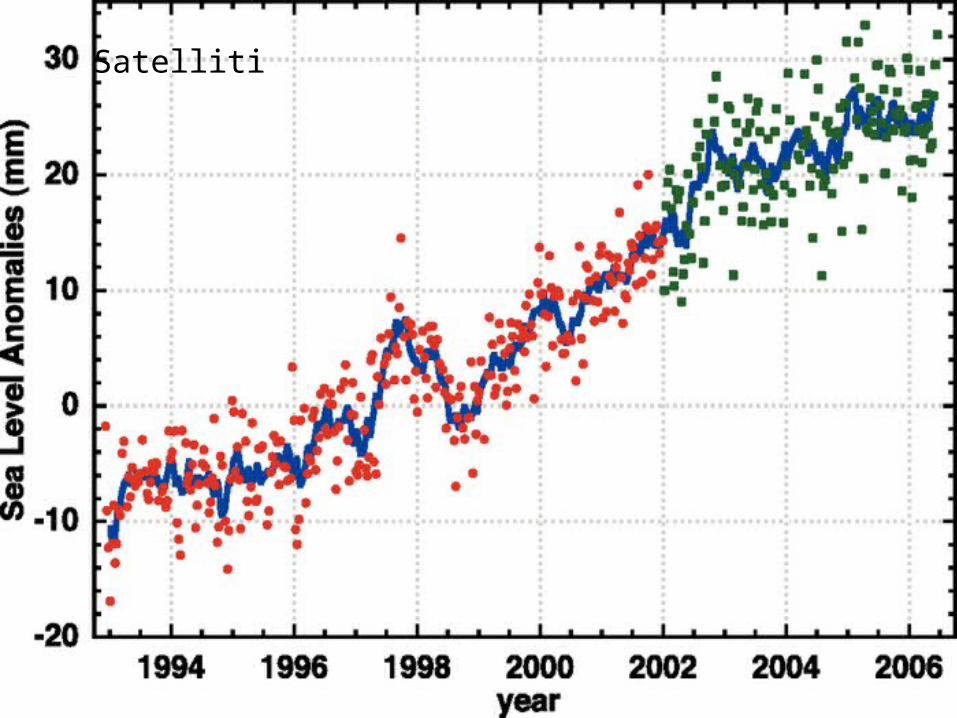
Satelliti
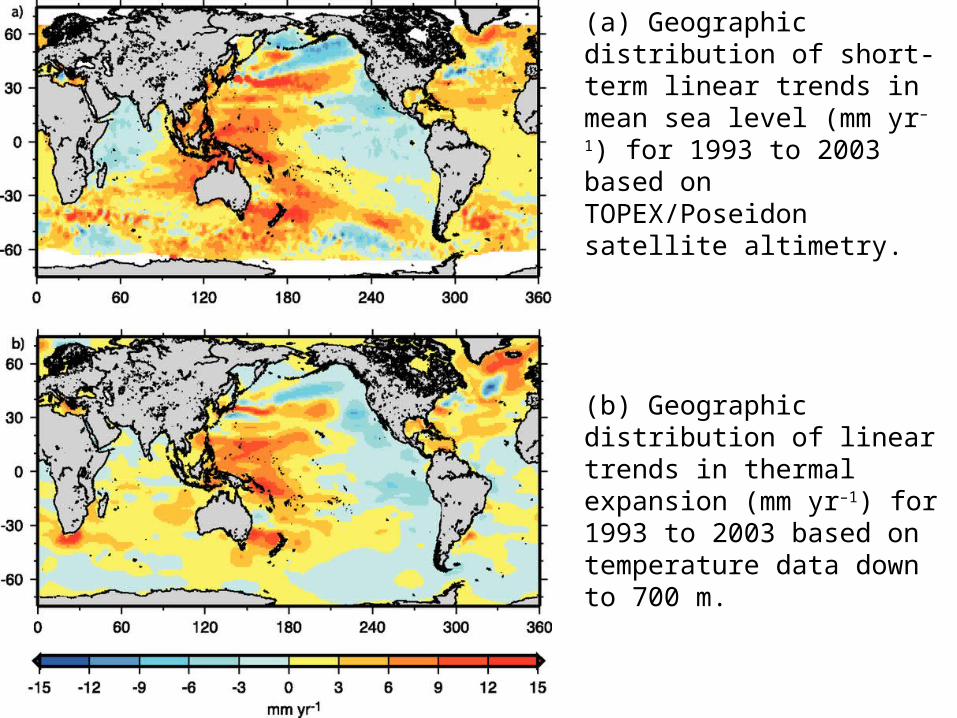
(a) Geographic distribution of short-term linear trends in mean sea level (mm yr–1) for 1993 to 2003 based on TOPEX/Poseidon satellite altimetry.
(b) Geographic distribution of linear trends in thermal expansion (mm yr–1) for 1993 to 2003 based on temperature data down to 700 m.
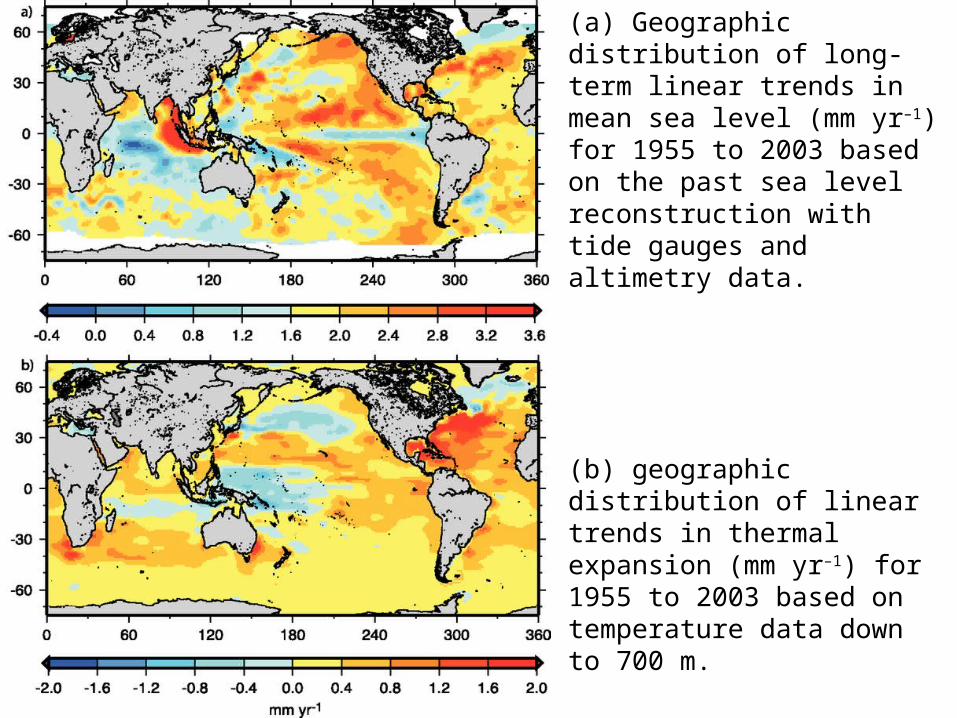
(a) Geographic distribution of long-term linear trends in mean sea level (mm yr–1) for 1955 to 2003 based on the past sea level reconstruction with tide gauges and altimetry data.
(b) geographic distribution of linear trends in thermal expansion (mm yr–1) for 1955 to 2003 based on temperature data down to 700 m.

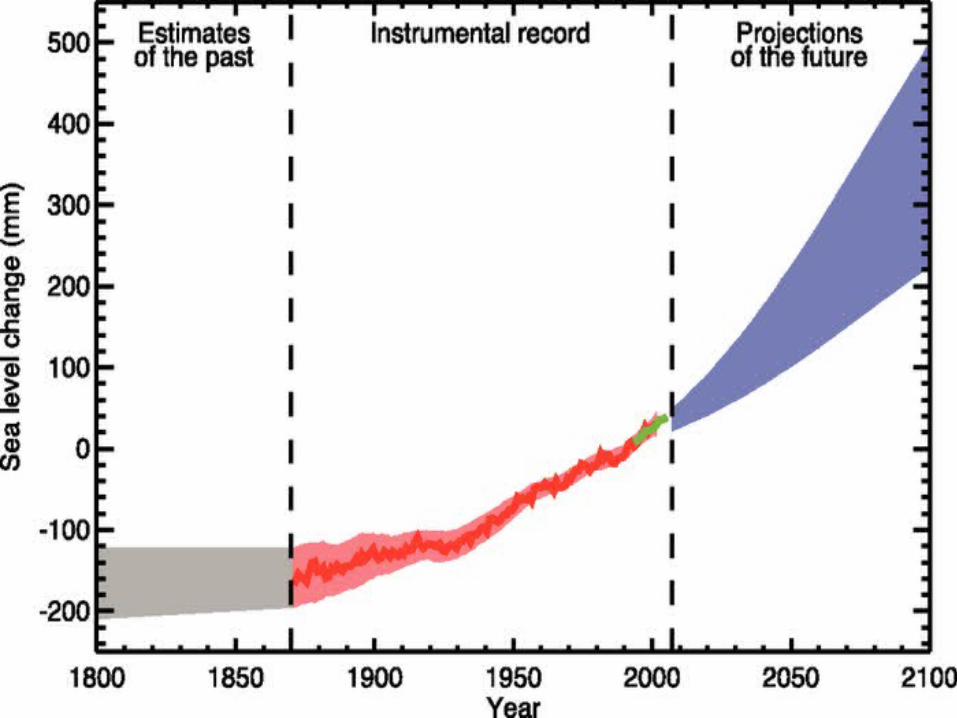
Overlapping 10-year rates of global sea level change from tide gauge data sets, in black) and satellite altimetry (in green), and contributions to global sea level change from thermal expansion (in red) and climate-driven land water storage
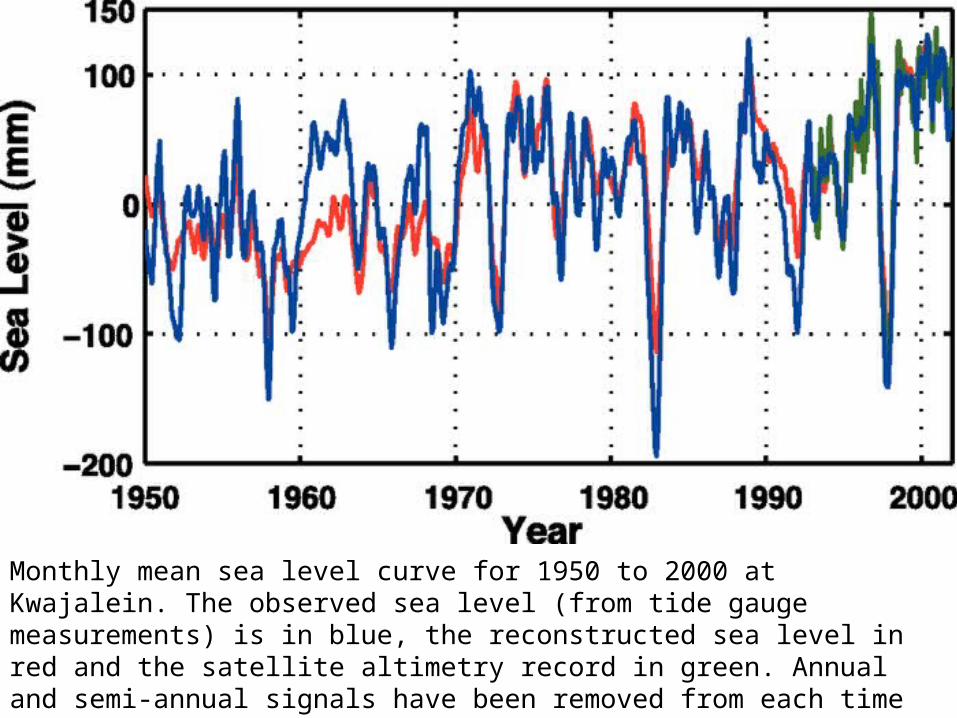
Monthly mean sea level curve for 1950 to 2000 at Kwajalein. The observed sea level (from tide gauge measurements) is in blue, the reconstructed sea level in red and the satellite altimetry record in green. Annual and semi-annual signals have been removed from each time series and the tide gauge data have been smoothed
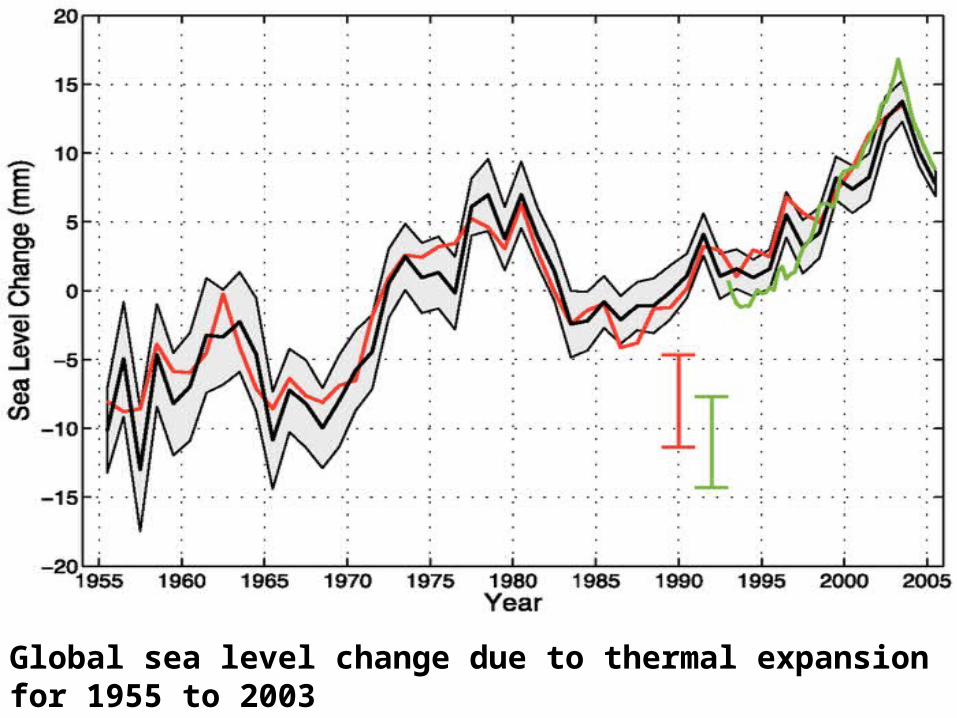
Global sea level change due to thermal expansion for 1955 to 2003
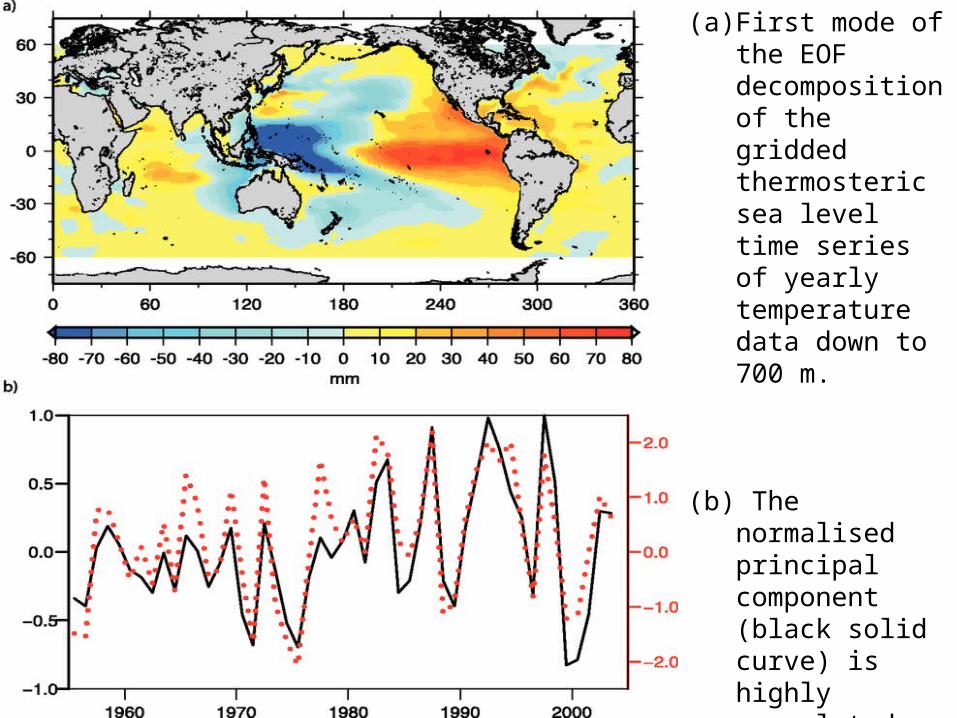
(a) First mode of the EOF decomposition of the gridded thermosteric sea level time series of yearly temperature data down to 700 m.
(b) The normalised principal component (black solid curve) is highly correlated with the negative Southern Oscillation Index (dotted red curve).