Cambarus veteranus Range Wide Conservation Status … · Cambarus veteranus. Range Wide ....
38
Cambarus veteranus Range Wide Conservation Status Survey Report prepared for the United States Fish and Wildlife Service, West Virginia Field Office Fall 2015 Report prepared by: Zachary J. Loughman, Ph.D. Associate Professor of Zoology/Ecology Department of Natural Sciences and Mathematics West Liberty University, West Liberty WV, 26074
Transcript of Cambarus veteranus Range Wide Conservation Status … · Cambarus veteranus. Range Wide ....

1
Cambarus veteranus Range Wide Conservation Status Survey
Report prepared for the United States Fish and Wildlife Service, West Virginia Field Office
Fall 2015
Report prepared by: Zachary J. Loughman, Ph.D.
Associate Professor of Zoology/Ecology Department of Natural Sciences and Mathematics
West Liberty University, West Liberty WV, 26074
1
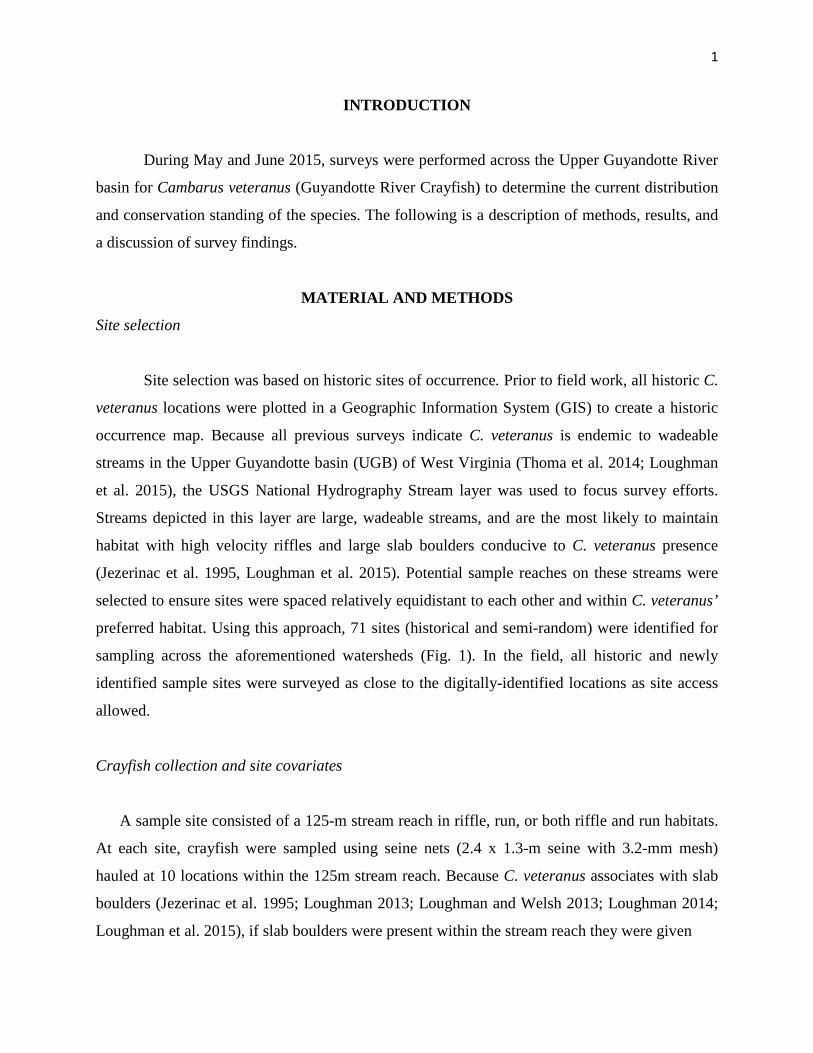
INTRODUCTION
During May and June 2015, surveys were performed across the Upper Guyandotte River
basin for Cambarus veteranus (Guyandotte River Crayfish) to determine the current distribution
and conservation standing of the species. The following is a description of methods, results, and
a discussion of survey findings.
MATERIAL AND METHODS
Site selection
Site selection was based on historic sites of occurrence. Prior to field work, all historic C.
veteranus locations were plotted in a Geographic Information System (GIS) to create a historic
occurrence map. Because all previous surveys indicate C. veteranus is endemic to wadeable
streams in the Upper Guyandotte basin (UGB) of West Virginia (Thoma et al. 2014; Loughman
et al. 2015), the USGS National Hydrography Stream layer was used to focus survey efforts.
Streams depicted in this layer are large, wadeable streams, and are the most likely to maintain
habitat with high velocity riffles and large slab boulders conducive to C. veteranus presence
(Jezerinac et al. 1995, Loughman et al. 2015). Potential sample reaches on these streams were
selected to ensure sites were spaced relatively equidistant to each other and within C. veteranus’
preferred habitat. Using this approach, 71 sites (historical and semi-random) were identified for
sampling across the aforementioned watersheds (Fig. 1). In the field, all historic and newly
identified sample sites were surveyed as close to the digitally-identified locations as site access
allowed.
Crayfish collection and site covariates
A sample site consisted of a 125-m stream reach in riffle, run, or both riffle and run habitats.
At each site, crayfish were sampled using seine nets (2.4 x 1.3-m seine with 3.2-mm mesh)
hauled at 10 locations within the 125m stream reach. Because C. veteranus associates with slab
boulders (Jezerinac et al. 1995; Loughman 2013; Loughman and Welsh 2013; Loughman 2014;
Loughman et al. 2015), if slab boulders were present within the stream reach they were given
2
Figu
re 1
: 201
5 C
amba
rus v
eter
anus
surv
ey si
te lo
catio
ns. S
ite n
umbe
rs c
orre
spon
d to
site
num
bers
in T
able
1

3
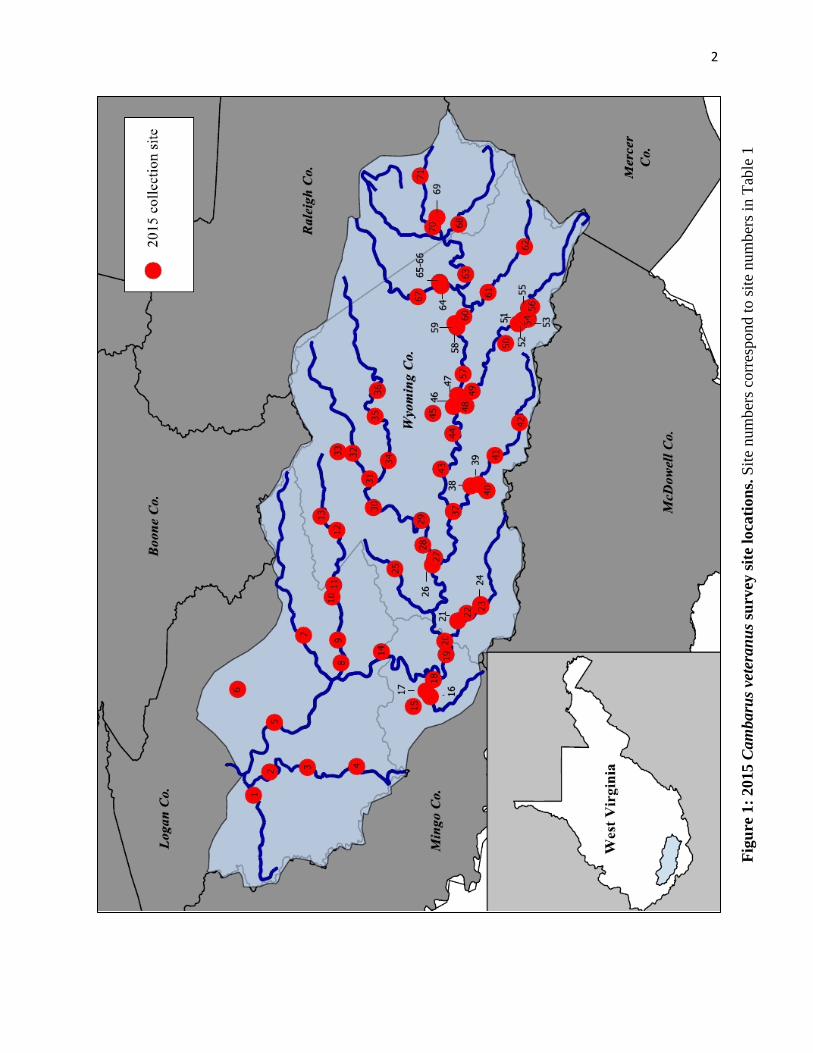
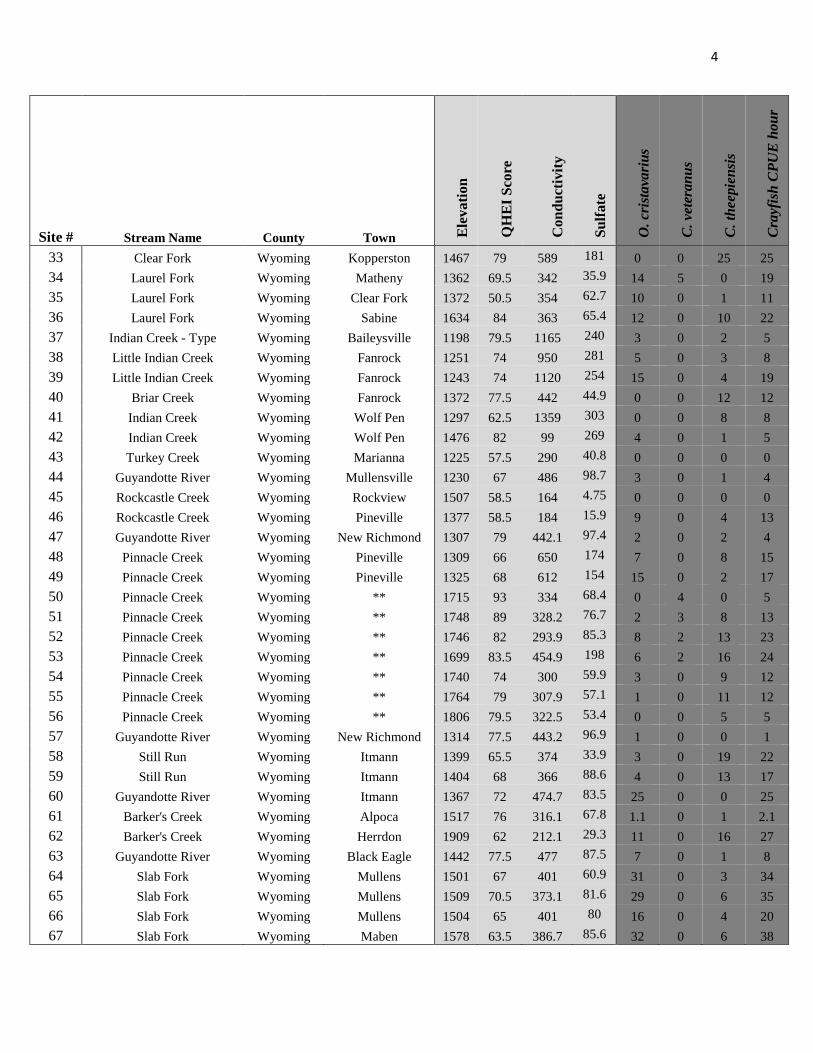
Table 1: Site information for 2015 Cambarus veteranus collection locales. Site #’s correspond to sites depicted on Figure 1.
Site # Stream Name County Town Ele
vatio
n
QH
EI S
core
Con
duct
ivity
Sulfa
te
O. c
rist
avar
ius
C. v
eter
anus
C. t
heep
iens
is
Cra
yfis
h C
PUE
hou
r
1 Copperas Mine Fork Logan Cora 641 54 730 263 0 0 5 5 2 Island Creek Logan Wilkinson 704 52.5 762 181 0 0 2 2 3 Island Creek Logan Chauncey 831 69 740 205 3 0 0 3 4 Island Creek Logan Sarah Anne 979 59.5 730 246 2 0 29 31 5 Rum Creek Logan Dabney 697 58 1178 452 3 0 3 6 6 Dingess Creek Logan Yolyn 932 65 650 261 0 0 12 12 7 Buffalo Creek Logan Braeholm 560 55 666 253 5 0 0 5 8 Huff Creek Logan Mallory 762 82.5 434 121 24 0 0 24 9 Huff Creek Logan Davin 817 76.5 446 140 10 0 2 12
10 Buffalo Creek Logan Labtrob 969 80 591 237 10 0 3 13 11 Huff Creek Logan Gillman Bottom 969 84 512 242 0 0 13 13 12 Huff Creek Wyoming Cyclone 1154 61 569 206 0 0 6 6 13 Huff Creek Wyoming Lacoma 1243 73.5 427 192 24 0 0 24 14 Elk Creek Logan Wylo 723 60 357 96.9 9 0 12 21 15 Horsepen Creek Mingo Hampden 959 46.5 1112 447 59 0 0 59 16 Gilbert Creek Mingo Gilbert 887 57.5 1528 694 0 0 1 1 17 Gilbert Creek Mingo Gilbert 902 55.5 1498 761 0 0 0 0 18 Horsepen Creek MIngo Gilbert 852 76 1230 568 3 0 0 3 19 Guyandotte River Mingo Gilbert 849 78 429 91.8 0 0 0 0 20 Little Huff Creek Mingo Hanover 910 67.5 449 119 3 0 0 3 21 Little Huff Creek Wyoming Hanover 1058 74.5 528 136 18 0 0 18 22 Little Huff Creek Wyoming Hanover 1112 67 552 153 17 0 4 21 23 Little Huff Creek Wyoming Steeles 1090 81.5 462 114 10 0 8 18 24 Little Huff Creek Wyoming Steeles 1062 86.5 462 110 8 0 1 9 25 Big Cub Creek Wyoming Simon 1239 54 813 289 22 0 4 26 26 Guyandotte River Wyoming Sun Hill 1097 75.5 492 91.9 0 0 1 1 27 Clear Fork Wyoming Simon 1288 81.5 444 110 2 3 5 10 28 Clear Fork Wyoming Clear Fork 1165 90.5 454 90.2 1 4 0 5 29 Clear Fork Wyoming Clear Fork 1184 92 446 140 0 15 0 5 30 Clear Fork Wyoming Lillydale 1228 70.5 487 131 19 6 4 27 31 Clear Fork/ Laurel Fork Wyoming Oceana 1238 83.5 206 81.8 0 6 0 3 32 Clear Fork Wyoming Oceana 1372 71 530 195 7 0 9 16
4
Site # Stream Name County Town Ele
vatio
n
QH
EI S
core
Con
duct
ivity
Sulfa
te
O. c
rist
avar
ius
C. v
eter
anus
C. t
heep
iens
is
Cra
yfis
h C
PUE
hou
r
33 Clear Fork Wyoming Kopperston 1467 79 589 181 0 0 25 25 34 Laurel Fork Wyoming Matheny 1362 69.5 342 35.9 14 5 0 19 35 Laurel Fork Wyoming Clear Fork 1372 50.5 354 62.7 10 0 1 11 36 Laurel Fork Wyoming Sabine 1634 84 363 65.4 12 0 10 22 37 Indian Creek - Type Wyoming Baileysville 1198 79.5 1165 240 3 0 2 5 38 Little Indian Creek Wyoming Fanrock 1251 74 950 281 5 0 3 8 39 Little Indian Creek Wyoming Fanrock 1243 74 1120 254 15 0 4 19 40 Briar Creek Wyoming Fanrock 1372 77.5 442 44.9 0 0 12 12 41 Indian Creek Wyoming Wolf Pen 1297 62.5 1359 303 0 0 8 8 42 Indian Creek Wyoming Wolf Pen 1476 82 99 269 4 0 1 5 43 Turkey Creek Wyoming Marianna 1225 57.5 290 40.8 0 0 0 0 44 Guyandotte River Wyoming Mullensville 1230 67 486 98.7 3 0 1 4 45 Rockcastle Creek Wyoming Rockview 1507 58.5 164 4.75 0 0 0 0 46 Rockcastle Creek Wyoming Pineville 1377 58.5 184 15.9 9 0 4 13 47 Guyandotte River Wyoming New Richmond 1307 79 442.1 97.4 2 0 2 4 48 Pinnacle Creek Wyoming Pineville 1309 66 650 174 7 0 8 15 49 Pinnacle Creek Wyoming Pineville 1325 68 612 154 15 0 2 17 50 Pinnacle Creek Wyoming ** 1715 93 334 68.4 0 4 0 5 51 Pinnacle Creek Wyoming ** 1748 89 328.2 76.7 2 3 8 13 52 Pinnacle Creek Wyoming ** 1746 82 293.9 85.3 8 2 13 23 53 Pinnacle Creek Wyoming ** 1699 83.5 454.9 198 6 2 16 24 54 Pinnacle Creek Wyoming ** 1740 74 300 59.9 3 0 9 12 55 Pinnacle Creek Wyoming ** 1764 79 307.9 57.1 1 0 11 12 56 Pinnacle Creek Wyoming ** 1806 79.5 322.5 53.4 0 0 5 5 57 Guyandotte River Wyoming New Richmond 1314 77.5 443.2 96.9 1 0 0 1 58 Still Run Wyoming Itmann 1399 65.5 374 33.9 3 0 19 22 59 Still Run Wyoming Itmann 1404 68 366 88.6 4 0 13 17 60 Guyandotte River Wyoming Itmann 1367 72 474.7 83.5 25 0 0 25 61 Barker's Creek Wyoming Alpoca 1517 76 316.1 67.8 1.1 0 1 2.1 62 Barker's Creek Wyoming Herrdon 1909 62 212.1 29.3 11 0 16 27 63 Guyandotte River Wyoming Black Eagle 1442 77.5 477 87.5 7 0 1 8 64 Slab Fork Wyoming Mullens 1501 67 401 60.9 31 0 3 34 65 Slab Fork Wyoming Mullens 1509 70.5 373.1 81.6 29 0 6 35 66 Slab Fork Wyoming Mullens 1504 65 401 80 16 0 4 20 67 Slab Fork Wyoming Maben 1578 63.5 386.7 85.6 32 0 6 38

5
Site # Stream Name County Town Ele
vatio
n
QH
EI S
core
Con
duct
ivity
Sulfa
te
O. c
rist
avar
ius
C. v
eter
anus
C. t
heep
iens
is
Cra
yfis
h C
PUE
hou
r
68 Devil's Fork Raleigh Amigo 1631 74 232 53.5 34 0 9 43 69 Tommy Creek Raleigh Rhodell 1678 76 323 57.8 4 0 6 10 70 Stonecoal Creek Raleigh Rhodell 1603 59.5 560 91.9 2 0 7 9 71 Stonecoal Creek Raleigh Besoco 1830 48 369 59.4 0 0 2 2
sampling priority. That is, if 10 slab boulders were present in a 125 m reach, all 10 slab boulders
would be sampled. If the stream reach did not contain sufficient slab boulders, the following
bottom features were given sampling priority: boulders, large cobble, course woody debris and
artificial cover respectively.
When collected, each individual C. veteranus specimen was measured (total carapace length,
TCL mm) and sexed. Third walking legs on the right side of adults were preserved for future
genetic analyses. Each animal’s life stage was recorded (young of the year; juvenile; form I
male; form II male; non-reproductive female; glared female; ovigerous female). If collected in
sufficient numbers, one or two adult males were vouchered, and all other individuals released at
their point of capture. All crayfish of other species collected were combined into a single sample
and preserved in 80% ethanol in the field (if any C. veteranus voucher specimens were collected,
they were also included). Specimens were subsequently identified to species in the laboratory,
and assessed into the West Liberty University Crayfish Collection.
Water quality and physical habitat quality data were also collected at each site for use in
ecological modeling. At each sampling site a Yellow Springs Instrument (YSI) 6920V2 data
sonde was used to measure pH, temperature, percent dissolved oxygen, turbidity, and
conductivity. Water samples (250 ml) were also collected for sulfate (SO4) determination in the
laboratory. These samples were collected from 10 cm under the stream surface, mid-channel, at
each sampling site. Sulfate concentrations were determined using a turbidity method on a Hach
DR 2800 (wavelength 450 nm) spectrophotometer. The maximum detection limit was 70 ppm
(mg/L). Sample concentrations that exceeded the maximum detection limit were diluted to the
6
appropriate concentration that was within the method detection limits. Each sample was
subjected to four replicate trials to determine an average and standard deviation. All sulfate
concentrations are reported at the 95% confidence limit.
In addition to water quality, physical habitat quality was evaluated through use of the
Qualitative Habitat Evaluation Index (QHEI; OEPA 2006). The QHEI is a commonly accepted
method of stream physical habitat assessment (Rankin, 1995; Burskey & Simon, 2010;
Gazendam et al., 2011), and provided inference—specifically for crayfish in central Appalachia
in previous investigations (Thoma 2009; Thoma 2010; Welsh and Loughman 2014; Loughman
unpublished data). QHEI overall score and sub-scores, specifically substrate type and quality, in-
stream cover type and amount, channel morphology (sinuosity, development, channelization, and
stability), riparian zone (width, quality, and bank erosion), pool quality (maximum depth,
current, and morphology), riffle quality (depth, substrate stability, and substrate embeddedness),
and stream gradient were used as physical habitat covariates for modeling.
Overall physical habitat quality was assessed by summing sub-scores obtained from
seven categories, thus resulting in a QHEI score, where the maximum possible QHEI score was
100. The QHEI scores were categorized separately for headwater and larger streams following
OEPA (2006). Categories for streams sampled based on total QHEI score were: excellent (≥75),
good (60-74), fair (45-59), poor (30–44), and very poor (<30). Site elevation (m) was also
recorded to help determine if elevation plays a role in C. veteranus presence (or absence).
Logistic Regression Modeling
Before analysis, we used product-moment correlation coefficients to examine for near
collinearity using pairs of water quality and physical habitat covariates. Logistic regression
models (SAS 9.2, PROC GENMOD, SAS 2008) were used to analyze presence/absence data of
C. veteranus by fitting 28 candidate models with single covariate or additive-effects of stream
habitat, water quality, or presence/absence of other crayfish species. The candidate model set
included an intercept model, a set of seven models with single covariates of conductivity,
elevation, QHEI, SO4, water temperature, and presence/absence of C. theepiensis and O.
cristavarius. Also, the following seven QHEI metric scores were fit as single covariate models:
in-stream cover type and amount, riffle quality, channel morphology, pool quality, substrate type
7
and quality, riparian zone, and stream gradient. Additionally, we fit a set of 12 additive-effects
models with two covariates (C. theepiensis presence/absence + conductivity, C. theepiensis
presence/absence + elevation, C. theepiensis presence/absence + QHEI, C. theepiensis
presence/absence + SO4, conductivity + QHEI, elevation + QHEI, O. cristavarius
presence/absence + conductivity, O. cristavarius presence/absence + elevation, O. cristavarius
presence/absence + QHEI, O. cristavarius presence/absence + SO4, SO4 + QHEI, and QHEI +
water temperature). Finally, a global model (additive effects) included C. theepiensis
presence/absence, conductivity, elevation, O. cristavarius presence/absence, QHEI, SO4, and
water temperature.
Model selection and inference followed an information-theoretic approach, where each
model represented alternative hypotheses and the best approximating model (or set of competing
models) was selected with the small sample size correction of the Akaike Information Criterion
(AICc; Burnham & Anderson, 2002). Using this approach, we reported AICc, the AICc distance
between each model and the best approximating model (∆AICc), and AICc model weights (wt).
Models with ∆AICc values of less than 2.0 were considered as competing models (Burnham &
Anderson, 2002). We used the Hosmer-Lemeshow Goodness-of-Fit statistic to examine the fit of
the global model.
RESULTS
Seventy one sites (historic and semi-random) were sampled across the Upper Guyandotte
River basin in May and June 2015. All historic streams were sampled, with at least one—and as
many as nine—stream reaches sampled per historic wadeable stream (Fig. 1). Survey results
determined that the Pinnacle Creek population exists along a minimum of 4.8 stream kilometers,
and is absent at both the confluence with the Guyandotte, and headwaters of Pinnacle Creek (Fig.
2; Table 1). Animals also were procured for the first time from the Clear Fork/Laurel Fork
watershed (Fig. 2; Table 1). Clear Fork populations appear to occur along a minimum of 21.7
stream kilometers (Fig. 1). At present, C. veteranus is known to occur within a minimum of 26.5
stream kilometers in two subwatersheds in the UGB.
Cambarus veteranus were not encountered in any other historic locations including Huff
Creek (5 sites), Barker Creek (2 sites), Briar Creek (2 sites), Indian Creek (3 sites), Little Indian
Creek (3 sites), Still Run (2 sites), or Turkey Creek (2 sites) with this effort. Thirty four sites

8
Figu
re 2
: 201
5 C
amba
rus v
eter
anus
surv
ey r
esul
ts. S
ite n
umbe
rs c
orre
spon
d to
site
num
bers
in T
able
1
9
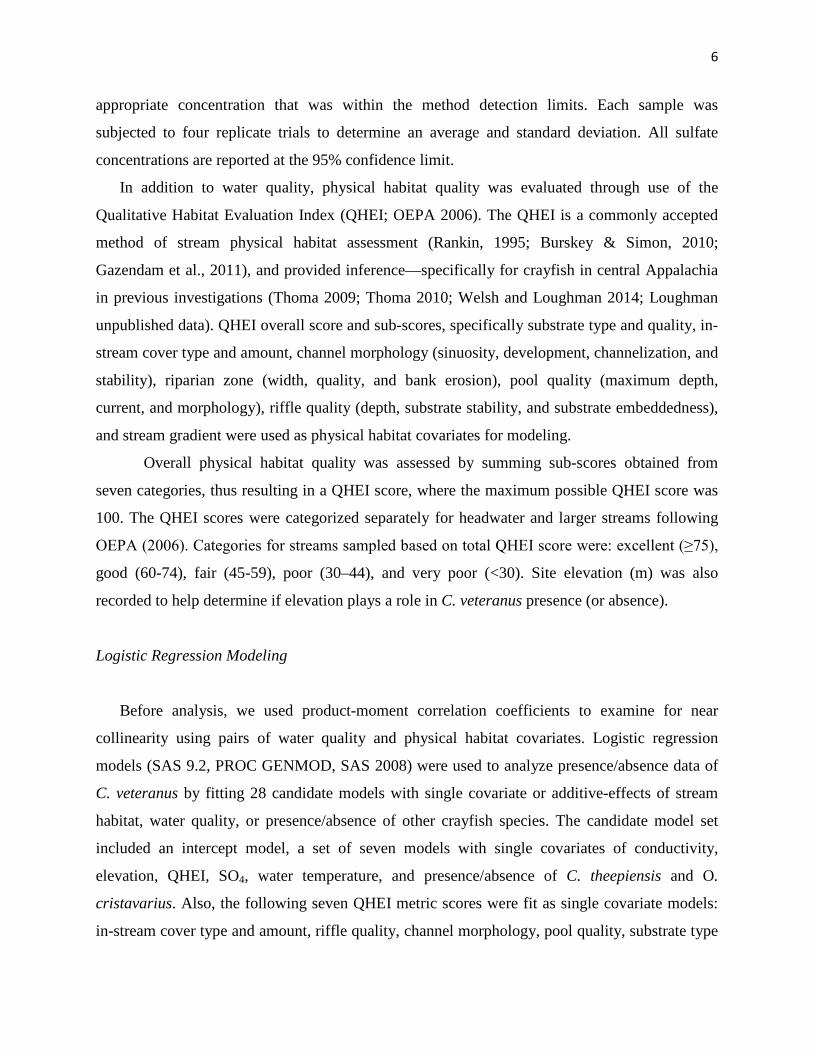
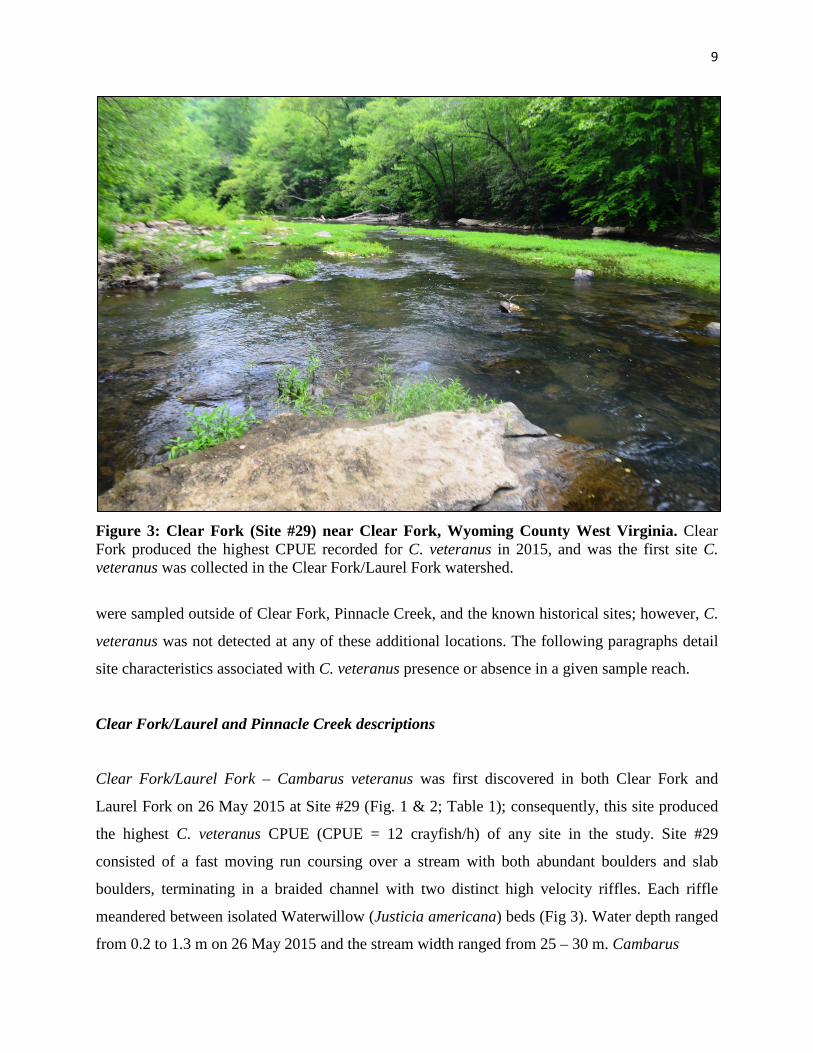
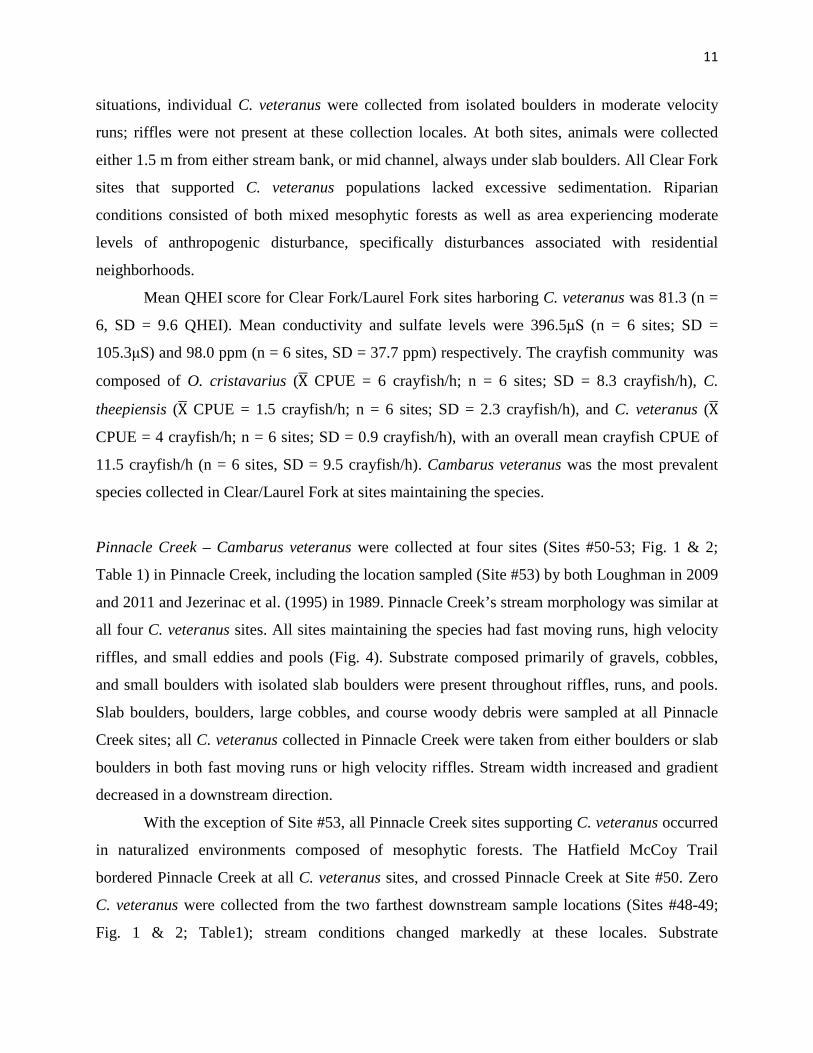
Figure 3: Clear Fork (Site #29) near Clear Fork, Wyoming County West Virginia. Clear Fork produced the highest CPUE recorded for C. veteranus in 2015, and was the first site C. veteranus was collected in the Clear Fork/Laurel Fork watershed.
were sampled outside of Clear Fork, Pinnacle Creek, and the known historical sites; however, C.
veteranus was not detected at any of these additional locations. The following paragraphs detail
site characteristics associated with C. veteranus presence or absence in a given sample reach.
Clear Fork/Laurel and Pinnacle Creek descriptions
Clear Fork/Laurel Fork – Cambarus veteranus was first discovered in both Clear Fork and
Laurel Fork on 26 May 2015 at Site #29 (Fig. 1 & 2; Table 1); consequently, this site produced
the highest C. veteranus CPUE (CPUE = 12 crayfish/h) of any site in the study. Site #29
consisted of a fast moving run coursing over a stream with both abundant boulders and slab
boulders, terminating in a braided channel with two distinct high velocity riffles. Each riffle
meandered between isolated Waterwillow (Justicia americana) beds (Fig 3). Water depth ranged
from 0.2 to 1.3 m on 26 May 2015 and the stream width ranged from 25 – 30 m. Cambarus
10
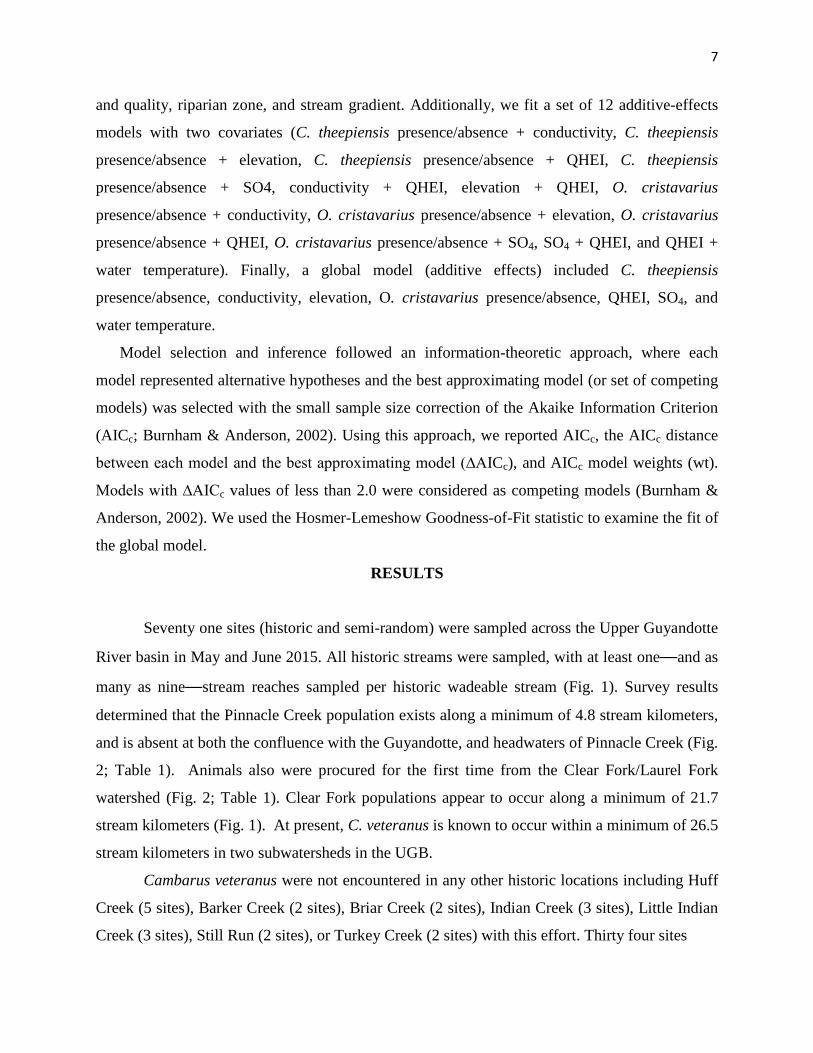
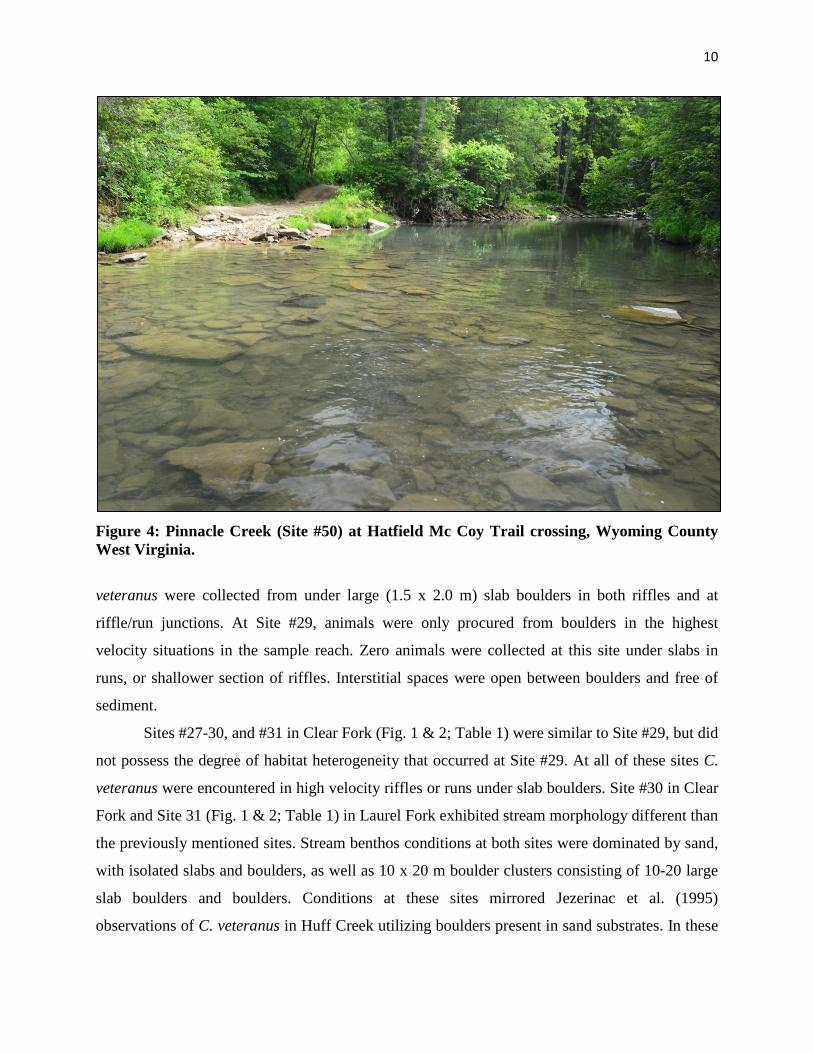
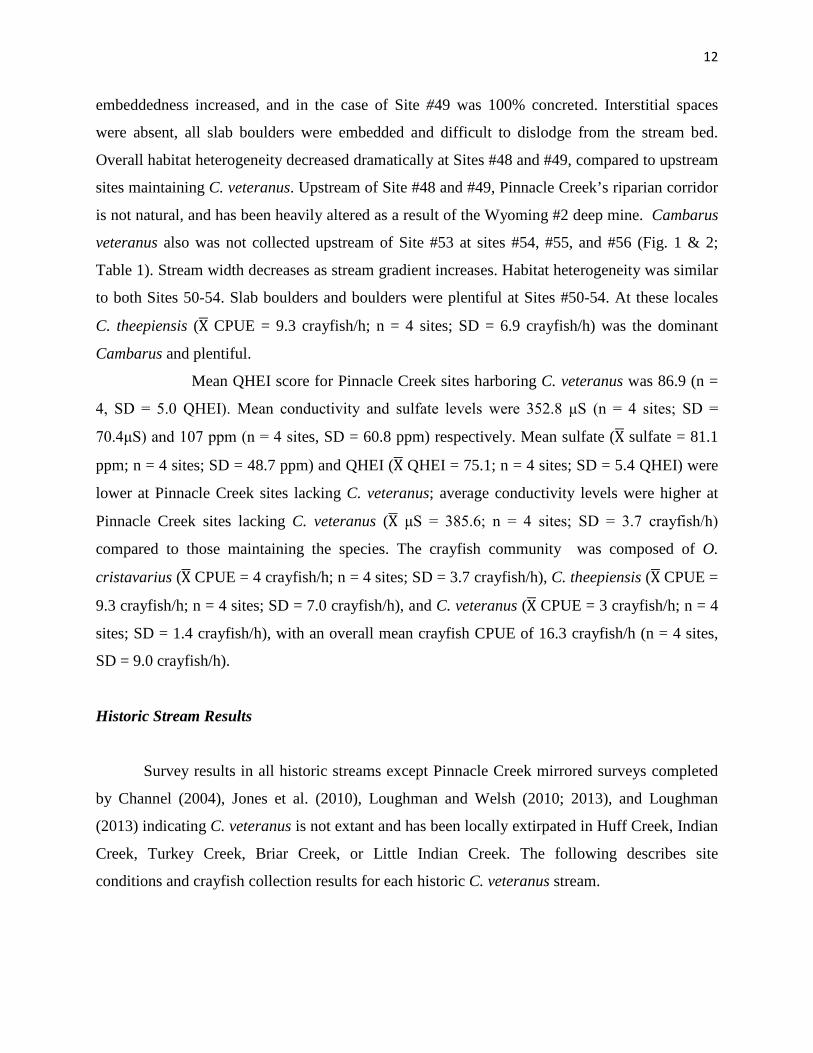
Figure 4: Pinnacle Creek (Site #50) at Hatfield Mc Coy Trail crossing, Wyoming County West Virginia.
veteranus were collected from under large (1.5 x 2.0 m) slab boulders in both riffles and at
riffle/run junctions. At Site #29, animals were only procured from boulders in the highest
velocity situations in the sample reach. Zero animals were collected at this site under slabs in
runs, or shallower section of riffles. Interstitial spaces were open between boulders and free of
sediment.
Sites #27-30, and #31 in Clear Fork (Fig. 1 & 2; Table 1) were similar to Site #29, but did
not possess the degree of habitat heterogeneity that occurred at Site #29. At all of these sites C.
veteranus were encountered in high velocity riffles or runs under slab boulders. Site #30 in Clear
Fork and Site 31 (Fig. 1 & 2; Table 1) in Laurel Fork exhibited stream morphology different than
the previously mentioned sites. Stream benthos conditions at both sites were dominated by sand,
with isolated slabs and boulders, as well as 10 x 20 m boulder clusters consisting of 10-20 large
slab boulders and boulders. Conditions at these sites mirrored Jezerinac et al. (1995)
observations of C. veteranus in Huff Creek utilizing boulders present in sand substrates. In these
11
situations, individual C. veteranus were collected from isolated boulders in moderate velocity
runs; riffles were not present at these collection locales. At both sites, animals were collected
either 1.5 m from either stream bank, or mid channel, always under slab boulders. All Clear Fork
sites that supported C. veteranus populations lacked excessive sedimentation. Riparian
conditions consisted of both mixed mesophytic forests as well as area experiencing moderate
levels of anthropogenic disturbance, specifically disturbances associated with residential
neighborhoods.
Mean QHEI score for Clear Fork/Laurel Fork sites harboring C. veteranus was 81.3 (n =
6, SD = 9.6 QHEI). Mean conductivity and sulfate levels were 396.5μS (n = 6 sites; SD =
105.3μS) and 98.0 ppm (n = 6 sites, SD = 37.7 ppm) respectively. The crayfish community was
composed of O. cristavarius (X� CPUE = 6 crayfish/h; n = 6 sites; SD = 8.3 crayfish/h), C.
theepiensis (X� CPUE = 1.5 crayfish/h; n = 6 sites; SD = 2.3 crayfish/h), and C. veteranus (X�
CPUE = 4 crayfish/h; n = 6 sites; SD = 0.9 crayfish/h), with an overall mean crayfish CPUE of
11.5 crayfish/h (n = 6 sites, SD = 9.5 crayfish/h). Cambarus veteranus was the most prevalent
species collected in Clear/Laurel Fork at sites maintaining the species.
Pinnacle Creek – Cambarus veteranus were collected at four sites (Sites #50-53; Fig. 1 & 2;
Table 1) in Pinnacle Creek, including the location sampled (Site #53) by both Loughman in 2009
and 2011 and Jezerinac et al. (1995) in 1989. Pinnacle Creek’s stream morphology was similar at
all four C. veteranus sites. All sites maintaining the species had fast moving runs, high velocity
riffles, and small eddies and pools (Fig. 4). Substrate composed primarily of gravels, cobbles,
and small boulders with isolated slab boulders were present throughout riffles, runs, and pools.
Slab boulders, boulders, large cobbles, and course woody debris were sampled at all Pinnacle
Creek sites; all C. veteranus collected in Pinnacle Creek were taken from either boulders or slab
boulders in both fast moving runs or high velocity riffles. Stream width increased and gradient
decreased in a downstream direction.
With the exception of Site #53, all Pinnacle Creek sites supporting C. veteranus occurred
in naturalized environments composed of mesophytic forests. The Hatfield McCoy Trail
bordered Pinnacle Creek at all C. veteranus sites, and crossed Pinnacle Creek at Site #50. Zero
C. veteranus were collected from the two farthest downstream sample locations (Sites #48-49;
Fig. 1 & 2; Table1); stream conditions changed markedly at these locales. Substrate
12
embeddedness increased, and in the case of Site #49 was 100% concreted. Interstitial spaces
were absent, all slab boulders were embedded and difficult to dislodge from the stream bed.
Overall habitat heterogeneity decreased dramatically at Sites #48 and #49, compared to upstream
sites maintaining C. veteranus. Upstream of Site #48 and #49, Pinnacle Creek’s riparian corridor
is not natural, and has been heavily altered as a result of the Wyoming #2 deep mine. Cambarus
veteranus also was not collected upstream of Site #53 at sites #54, #55, and #56 (Fig. 1 & 2;
Table 1). Stream width decreases as stream gradient increases. Habitat heterogeneity was similar
to both Sites 50-54. Slab boulders and boulders were plentiful at Sites #50-54. At these locales
C. theepiensis (X� CPUE = 9.3 crayfish/h; n = 4 sites; SD = 6.9 crayfish/h) was the dominant
Cambarus and plentiful.
Mean QHEI score for Pinnacle Creek sites harboring C. veteranus was 86.9 (n =
4, SD = 5.0 QHEI). Mean conductivity and sulfate levels were 352.8 μS (n = 4 sites; SD =
70.4μS) and 107 ppm (n = 4 sites, SD = 60.8 ppm) respectively. Mean sulfate (X� sulfate = 81.1
ppm; n = 4 sites; SD = 48.7 ppm) and QHEI (X� QHEI = 75.1; n = 4 sites; SD = 5.4 QHEI) were
lower at Pinnacle Creek sites lacking C. veteranus; average conductivity levels were higher at
Pinnacle Creek sites lacking C. veteranus (X� μS = 385.6; n = 4 sites; SD = 3.7 crayfish/h)
compared to those maintaining the species. The crayfish community was composed of O.
cristavarius (X� CPUE = 4 crayfish/h; n = 4 sites; SD = 3.7 crayfish/h), C. theepiensis (X� CPUE =
9.3 crayfish/h; n = 4 sites; SD = 7.0 crayfish/h), and C. veteranus (X� CPUE = 3 crayfish/h; n = 4
sites; SD = 1.4 crayfish/h), with an overall mean crayfish CPUE of 16.3 crayfish/h (n = 4 sites,
SD = 9.0 crayfish/h).
Historic Stream Results
Survey results in all historic streams except Pinnacle Creek mirrored surveys completed
by Channel (2004), Jones et al. (2010), Loughman and Welsh (2010; 2013), and Loughman
(2013) indicating C. veteranus is not extant and has been locally extirpated in Huff Creek, Indian
Creek, Turkey Creek, Briar Creek, or Little Indian Creek. The following describes site
conditions and crayfish collection results for each historic C. veteranus stream.
13
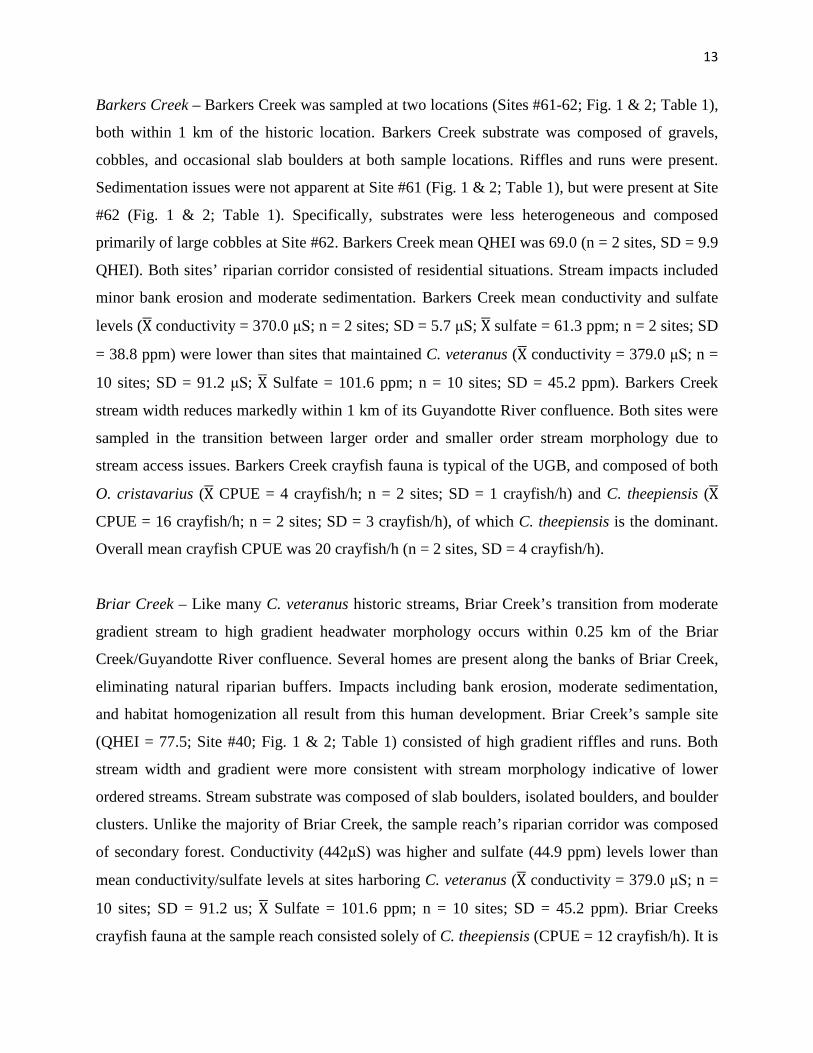
Barkers Creek – Barkers Creek was sampled at two locations (Sites #61-62; Fig. 1 & 2; Table 1),
both within 1 km of the historic location. Barkers Creek substrate was composed of gravels,
cobbles, and occasional slab boulders at both sample locations. Riffles and runs were present.
Sedimentation issues were not apparent at Site #61 (Fig. 1 & 2; Table 1), but were present at Site
#62 (Fig. 1 & 2; Table 1). Specifically, substrates were less heterogeneous and composed
primarily of large cobbles at Site #62. Barkers Creek mean QHEI was 69.0 (n = 2 sites, SD = 9.9
QHEI). Both sites’ riparian corridor consisted of residential situations. Stream impacts included
minor bank erosion and moderate sedimentation. Barkers Creek mean conductivity and sulfate
levels (X� conductivity = 370.0 μS; n = 2 sites; SD = 5.7 μS; X� sulfate = 61.3 ppm; n = 2 sites; SD
= 38.8 ppm) were lower than sites that maintained C. veteranus (X� conductivity = 379.0 μS; n =
10 sites; SD = 91.2 μS; X� Sulfate = 101.6 ppm; n = 10 sites; SD = 45.2 ppm). Barkers Creek
stream width reduces markedly within 1 km of its Guyandotte River confluence. Both sites were
sampled in the transition between larger order and smaller order stream morphology due to
stream access issues. Barkers Creek crayfish fauna is typical of the UGB, and composed of both
O. cristavarius (X� CPUE = 4 crayfish/h; n = 2 sites; SD = 1 crayfish/h) and C. theepiensis (X�
CPUE = 16 crayfish/h; n = 2 sites; SD = 3 crayfish/h), of which C. theepiensis is the dominant.
Overall mean crayfish CPUE was 20 crayfish/h (n = 2 sites, SD = 4 crayfish/h).
Briar Creek – Like many C. veteranus historic streams, Briar Creek’s transition from moderate
gradient stream to high gradient headwater morphology occurs within 0.25 km of the Briar
Creek/Guyandotte River confluence. Several homes are present along the banks of Briar Creek,
eliminating natural riparian buffers. Impacts including bank erosion, moderate sedimentation,
and habitat homogenization all result from this human development. Briar Creek’s sample site
(QHEI = 77.5; Site #40; Fig. 1 & 2; Table 1) consisted of high gradient riffles and runs. Both
stream width and gradient were more consistent with stream morphology indicative of lower
ordered streams. Stream substrate was composed of slab boulders, isolated boulders, and boulder
clusters. Unlike the majority of Briar Creek, the sample reach’s riparian corridor was composed
of secondary forest. Conductivity (442μS) was higher and sulfate (44.9 ppm) levels lower than
mean conductivity/sulfate levels at sites harboring C. veteranus (X� conductivity = 379.0 μS; n =
10 sites; SD = 91.2 us; X� Sulfate = 101.6 ppm; n = 10 sites; SD = 45.2 ppm). Briar Creeks
crayfish fauna at the sample reach consisted solely of C. theepiensis (CPUE = 12 crayfish/h). It is
14
important to note that habitat downstream of the sample reach was monotypic, covered in
sediment, and embedded.
Indian Creek – Indian Creek was sampled at C. veteranus type location (Site #37; Fig. 1 & 2;
Table 1) which is 0.8 km from the Indian Creek/Guyandotte Confluence, as well as two
additional sites (Sites #41-42; Fig. 1 & 2; Table 1). Cambarus veteranus type location QHEI
score was 82, which is above average for UGB; mean Indian Creek QHEI was 74.7 (n = 3 sites;
SD = 10.6 QHEI). Both riffles and fast moving runs were present along with slab boulders,
boulders, and course woody debris (CWD) snags. Iron deposition also occurred at the type
location in slack water situations. Sedimentation issues including concretion were present in
moderate to low velocity habitats at all Indian Creek sites sampled. All sites sampled coursed
through naturalized habitat consisting of mixed mesophytic forest. Mean conductivity (X�
conductivity = 1,262 μS; n = 3 sites; SD = 132 μS) and sulfate (X� sulfate = 270.7 ppm; n = 3
sites; SD = 31.5 ppm) were higher than mean conductivity (X� conductivity = 379.0 μS; n = 10
sites; SD = 91.2 μS) and sulfate; (X� Sulfate = 101.6 ppm; n = 10 sites; SD = 45.2 ppm) levels at
sites maintaining C. veteranus. Indian Creek’s crayfish fauna consists of both O. cristavarius
and C. theepiensis; C. theepiensis maintained a higher average CPUE (X� CPUE = 4 crayfish/h; n
= 3 sites; SD = 4 crayfish/h) than O. cristavarius (X� CPUE = 2 crayfish/h; n = 3 sites; SD = 2
crayfish/h). Overall crayfish CPUE (X� CPUE = 6 crayfish/h; n = 3 sites; SD = 2 crayfish/h) was
lower than averaged pooled UGB crayfish CPUE (X� CPUE = 11 crayfish/h; n = 71 sites; SD = 12
crayfish/h).
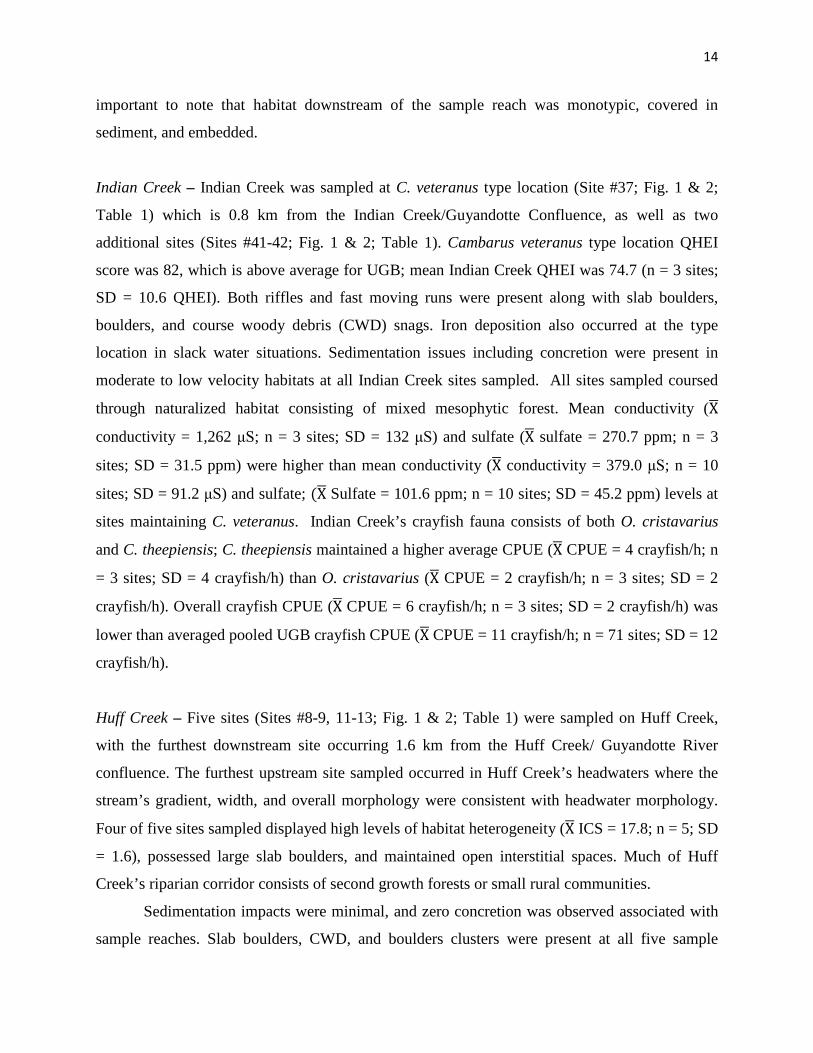
Huff Creek – Five sites (Sites #8-9, 11-13; Fig. 1 & 2; Table 1) were sampled on Huff Creek,
with the furthest downstream site occurring 1.6 km from the Huff Creek/ Guyandotte River
confluence. The furthest upstream site sampled occurred in Huff Creek’s headwaters where the
stream’s gradient, width, and overall morphology were consistent with headwater morphology.
Four of five sites sampled displayed high levels of habitat heterogeneity (X� ICS = 17.8; n = 5; SD
= 1.6), possessed large slab boulders, and maintained open interstitial spaces. Much of Huff
Creek’s riparian corridor consists of second growth forests or small rural communities.
Sedimentation impacts were minimal, and zero concretion was observed associated with
sample reaches. Slab boulders, CWD, and boulders clusters were present at all five sample
15
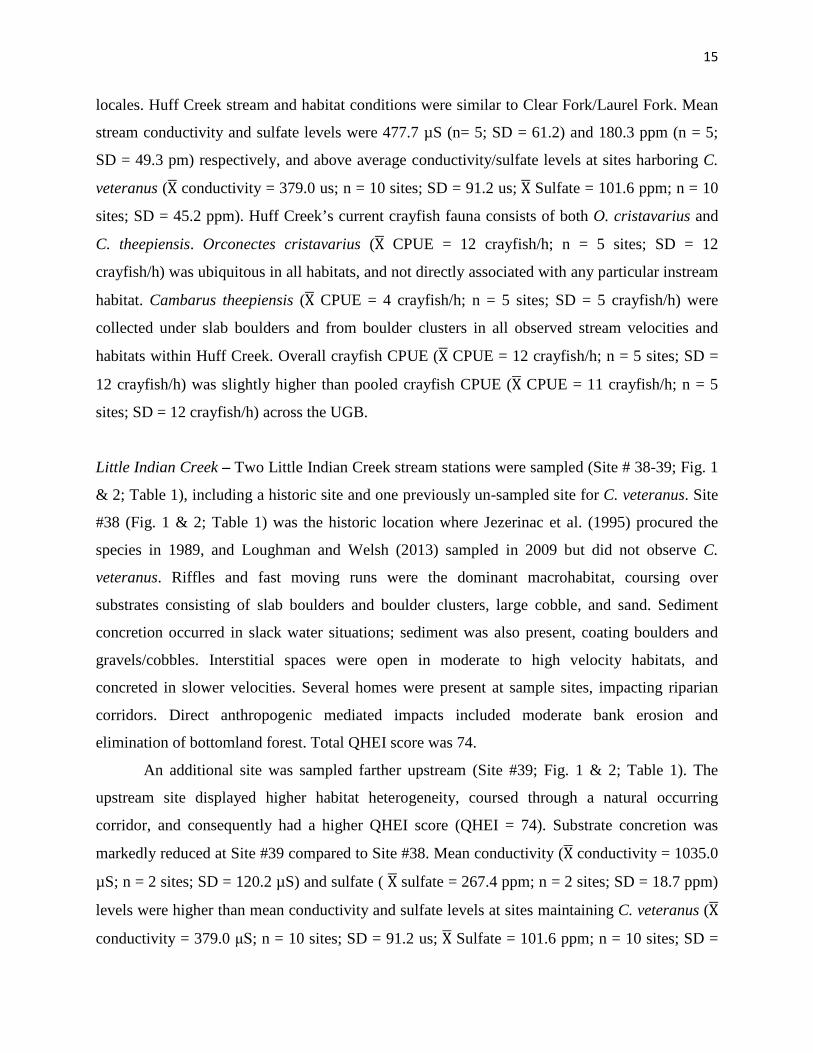
locales. Huff Creek stream and habitat conditions were similar to Clear Fork/Laurel Fork. Mean
stream conductivity and sulfate levels were 477.7 µS (n= 5; SD = 61.2) and 180.3 ppm (n = 5;
SD = 49.3 pm) respectively, and above average conductivity/sulfate levels at sites harboring C.
veteranus (X� conductivity = 379.0 us; n = 10 sites; SD = 91.2 us; X� Sulfate = 101.6 ppm; n = 10
sites; SD = 45.2 ppm). Huff Creek’s current crayfish fauna consists of both O. cristavarius and
C. theepiensis. Orconectes cristavarius (X� CPUE = 12 crayfish/h; n = 5 sites; SD = 12
crayfish/h) was ubiquitous in all habitats, and not directly associated with any particular instream
habitat. Cambarus theepiensis (X� CPUE = 4 crayfish/h; n = 5 sites; SD = 5 crayfish/h) were
collected under slab boulders and from boulder clusters in all observed stream velocities and
habitats within Huff Creek. Overall crayfish CPUE (X� CPUE = 12 crayfish/h; n = 5 sites; SD =
12 crayfish/h) was slightly higher than pooled crayfish CPUE (X� CPUE = 11 crayfish/h; n = 5
sites; SD = 12 crayfish/h) across the UGB.
Little Indian Creek – Two Little Indian Creek stream stations were sampled (Site # 38-39; Fig. 1
& 2; Table 1), including a historic site and one previously un-sampled site for C. veteranus. Site
#38 (Fig. 1 & 2; Table 1) was the historic location where Jezerinac et al. (1995) procured the
species in 1989, and Loughman and Welsh (2013) sampled in 2009 but did not observe C.
veteranus. Riffles and fast moving runs were the dominant macrohabitat, coursing over
substrates consisting of slab boulders and boulder clusters, large cobble, and sand. Sediment
concretion occurred in slack water situations; sediment was also present, coating boulders and
gravels/cobbles. Interstitial spaces were open in moderate to high velocity habitats, and
concreted in slower velocities. Several homes were present at sample sites, impacting riparian
corridors. Direct anthropogenic mediated impacts included moderate bank erosion and
elimination of bottomland forest. Total QHEI score was 74.
An additional site was sampled farther upstream (Site #39; Fig. 1 & 2; Table 1). The
upstream site displayed higher habitat heterogeneity, coursed through a natural occurring
corridor, and consequently had a higher QHEI score (QHEI = 74). Substrate concretion was
markedly reduced at Site #39 compared to Site #38. Mean conductivity (X� conductivity = 1035.0
µS; n = 2 sites; SD = 120.2 µS) and sulfate ( X� sulfate = 267.4 ppm; n = 2 sites; SD = 18.7 ppm)
levels were higher than mean conductivity and sulfate levels at sites maintaining C. veteranus (X�
conductivity = 379.0 μS; n = 10 sites; SD = 91.2 us; X� Sulfate = 101.6 ppm; n = 10 sites; SD =
16
45.2 ppm). Conductivity and sulfate levels in Little Indian Creek were among the highest
recorded during this study. Orconectes cristavarius had higher mean CPUE (X� CPUE = 10
crayfish/h; n = 2 sites; SD = 7 crayfish/h) than C. theepiensis (X� CPUE = 4 crayfish/h; n = 2
sites; SD = 1 crayfish/h). Overall mean crayfish CPUE was 14 crayfish/h (n = 2 sites; SD = 8
crayfish/h).
Still Run – Still Run’s historic site (Site #58; Fig. 1 & 2; Table 1)) and a previously unsampled
reach (Site #59; Fig. 1 & 2; Table 1) were sampled with both sites sharing similar habitat
characteristics. Runs and riffles were both present, with velocities ranging from moderate to
high. Dominant instream habitat included isolated slab boulders and boulder clusters, though
both were relatively rare in both sample reaches. The majority of substrate at both sites was
monotypic gravel and small to medium sized cobbles. Impacts included moderate sedimentation
and embedded slabs. Riparian corridors for both sites consisted of secondary bottomland forest;
residences were within 0.5 km of both sample reaches. Bank erosion was present upstream of
both sample sites. Still Run’s mean QHEI score was 66.8 (n = 2 sites; SD = 1.8 QHEI) which
reflects Still Run’s monotypic substrates, bank erosion, and sedimentation issues. Like Turkey
Creek, Briar Creek, and Barker Creek, stream width decreased markedly immediately upstream
of the Still Run/Guyandotte River confluence. Mean conductivity (X� conductivity = 370.0 μS; n
= 2 sites; SD = 5.7 μS) and sulfate (X� sulfate = 61.3 ppm; n = 2 sites; SD = 38.8 ppm) levels
were lower than mean conductivity and sulfate levels at sites maintaining C. veteranus (X�
conductivity = 379.0 µS; n = 10 sites; SD = 91.2 µS; X� Sulfate = 101.6 ppm; n = 10 sites; SD =
45.2 ppm). Still Run’s crayfish fauna was composed of both O. cristavarius (X� CPUE = 4
crayfish/h; n = 2 sites; SD = 1 crayfish/h) and C. theepiensis (X� CPUE = 16 crayfish/h; n = 2
sites; SD = 4 crayfish/h), of which C. theepiensis was collected more frequently. Mean crayfish
CPUE was 20 crayfish/h; (n = 2 sites; SD = 4 crayfish/h)
Turkey Creek – The majority of Turkey Creek, including the historic location, was encompassed
within the property of the Wyoming #2 Deep Mine, and unable to be sampled. Only the first 0.5
km from the Turkey Creek/Guyandotte River confluence had an access point, resulting in a
single site being sampled (Site #43; Fig. 1 & 2; Table 1). The sample sites possessed moderate to
slow, moderate, and moving runs, riffles, and eddies. Substrates were composed primarily of
17
gravel and cobbles, with isolated slab boulders in riffles and fast moving runs. Sediment was
deposited on all substrates in moderate to slow stream velocities. The majority (>90%) of slab
boulders were concreted, and impossible to dislodge from the substrate. Slab boulder surfaces in
riffles were free of sediment accumulation. Interstitial spaces were present in riffles and saturated
with sediment in moderate to slow moving runs. Riparian buffer habitat in the sample reach
consisted of residences and secondary forests. Bank erosion was present in moderate amounts.
Overall QHEI score was 57.5. Both conductivity (290 µS) and sulfate levels (40.8 ppm) were
lower than mean conductivity and sulfate levels at sites possessing C. veteranus (X� conductivity
= 379.0 µS; n = 10 sites; SD = 91.2 µS; X� Sulfate = 101.6 ppm; n = 10 sites; SD = 45.2 ppm).
Zero crayfish were collected at Turkey Creek.
Survey Results – Semi-random sites excluding Guyandotte River
Copperas Mine Fork and Island Creek – Copperas Mine Fork is Island Creek’s major tributary,
hence they are presented together. Copperas Mine Fork (Site #1; Fig. 1 & 2; Table 1) was
sampled within 1.0 km of its confluence with Island Creek. Given its moderate to low gradient
relative to the rest of the UGB, long expansive riffles are not present in Copperas Mine Fork.
The sample reach consisted of a fast moving run, both the dominant and best available habitat for
C. veteranus. Copperas Mine Fork’s benthos consisted primarily of small cobble and boulders in
runs, and silt and sand in the stream’s lower velocity waters. Impacts included bank erosion, lack
of natural riparian buffers, and excess sedimentation. Sediment covered all large substrates in
moderate to lower velocity situations in runs. Substrate embeddedness and concretion also was
present to the extent that many boulders were not capable of being dislodged from the substrate.
Total QHEI score for the Copperas Mine Fork sites was 54. Conductivity (730 µS) and sulfates
(263 ppm) were both higher than mean conductivity and sulfate levels at sites currently
maintaining C. veteranus (X� conductivity = 379.0 µS; n = 10 sites; SD = 91.2 µS; X� Sulfate =
101.6 ppm; n = 10 sites; SD = 45.2 ppm). Only C. theepiensis (CPUE = 5 crayfish/h) were
collected at Copperas Mine Fork.
Three sites were sampled in Island Creek (Site #2-4; Fig. 1 & 2; Table 1), with sites in
the stream’s headwaters (Site #4), mid-stream (Site #3), and downstream (Site #2) reaches.
Common to all sites was either the elimination or degradation of stream riparian corridors, and

18
affiliated bank erosion. Riffles and runs were present at all sites, with occasional slab boulders,
boulder clusters and CWD snags. Gravel, sand, and silt composed the majority of Island Creek’s
benthos. Moderate to extreme sedimentation occurred in Island Creek; at Site #2 (Fig. 1) all
larger slab boulders were concreted into the streambed. Sedimentation at all sites eliminated
interstitial spaces between large boulders and other substrate debris. Island Creek mean QHEI
score was 60.3 (n = 3; SD = 8.3). Both mean conductivity (X� conductivity = 744 µS; n = 3; SD =
16.4 µS) and sulfate (X� sulfate = 205 ppm; n = 3 sites; SD = 32.6 ppm) levels were higher than
average levels at sites harboring C. veteranus (X� conductivity = 379.0 µS; n = 10 sites; SD = 91.2
µS; X� Sulfate = 101.6 ppm; n = 10 sites; SD = 45.2 ppm). Both C. theepiensis (X� CPUE = 10
crayfish/h; n = 3 sites; SD = 16 crayfish/h) and O. cristavarius (X� CPUE = 2 crayfish/h; n = 3
sites; SD = 2 crayfish/h) occur in Island Creek, with C. theepiensis the more prevalent species.
Island Creek’s mean crayfish CPUE was 12 crayfish/h (n = 3 sites; SD = 16 crayfish/h). Zero C.
veteranus were collected in either stream.
Little Huff Creek – Five sites were sampled in Little Huff Creek (Site #20-24; Fig. 1 & 2; Table
1) from the stream’s headwaters (Site #24) to within 0.5 km of Little Huff Creek’s confluence
with the Guyandotte River (Site #20). A single site (Site #22) exhibited heavy anthropogenic
impacts, all associated with human habitation. Impacts included riparian corridor elimination,
bank erosion, and dredging of the stream. With the exception of Site #22, Little Huff Creek
possessed ample habitat associated with tertiary burrowing Cambarus taxa. Substrates consisting
of all rock size classes were present at all other Little Huff Creek sites. Riparian corridors were
intact and composed of secondary bottomland forest. All sites maintained moderate to high
velocity runs and riffles with both slabs and boulder clusters. Instream habitat was abundant,
composed of slab boulders, isolated boulders, boulders clusters and CWD. Sedimentation issues
were marginal; concretion was present in low velocity environs and lacking in riffles and fast
moving runs. Justicia americana beds also were present at most sites. Including Site #22, mean
QHEI was 75.4 (n = 5 sites; SD = 8.6). Both mean conductivity (X� conductivity = 490.6 µS; n =
5 sites; SD = 46.2 µS) and sulfate levels (X� sulfate = 126.4 ppm; n = 5 sites; SD = 18.0 ppm)
were higher than mean values observed at sites with C. veteranus populations (X� conductivity =
379.0 µS; n = 10 sites; SD = 91.2 µS; X� Sulfate = 101.6 ppm; n = 10 sites; SD = 45.2 ppm).
Crayfish were present in Little Huff Creek (X� CPUE = 14 crayfish/h; n = 5 sites; SD = 9

19
crayfish/h), with more O. cristavarius (X� CPUE = 11 crayfish/h; n = 5 sites; SD = 6 crayfish/h)
collected than C. theepiensis (X� CPUE = 3 crayfish/h; n = 5 sites; SD = 3 crayfish/h).
Slab Fork – Four sites (Site #64-67; Fig. 1 & 2; Table 1) were sampled in Slab Fork: three near
the Slab Fork/Guyandotte River confluence and a fourth site mid-stream where the transition
between headwater and larger ordered tributary occurs. All sites possessed both riffles and runs
with primarily gravel, cobble, and boulder substrates. Though rare throughout much of the Slab
Fork watershed, slab boulders and boulders were present at all sample locales. Slab Fork also
possesses a substantial number of bedrock glides devoid of suitable crayfish cover. Coal fines
were present at all survey locations. All Slab Fork sample reaches maintained subclimax forested
riparian zones on at least one stream bank. Moderate to marginal sedimentation was present.
Interstitial spaces were open in all riffles. All survey sites experienced some degree of substrate
concretion. Mean QHEI score for Slab Fork streams was 66.5 (n = 4 sites; SD = 4.61). Both
mean conductivity (X� conductivity = 490.6 µS; n = 5 sites; SD = 13.4 µS) and sulfate levels (X�
sulfate = 77.0 ppm; n = 5 sites; SD = 11.0 ppm) were above levels maintaining C. veteranus (X�
conductivity = 379.0 µS; n = 10 sites; SD = 91.2 µS; X� Sulfate = 101.6 ppm; n = 10 sites; SD =
45.2 ppm). Slab Fork’s crayfish community was typical of the UGB, with O. cristavarius (X�
CPUE = 27 crayfish/h; n = 5 sites; SD = 7 crayfish/h) dominant over C. theepiensis (X� CPUE = 5
crayfish/h; n = 5 sites; SD = 2 crayfish/h). Overall crayfish CPUE was 32 crayfish/h (n = 4 sites;
SD = 8 crayfish/h).
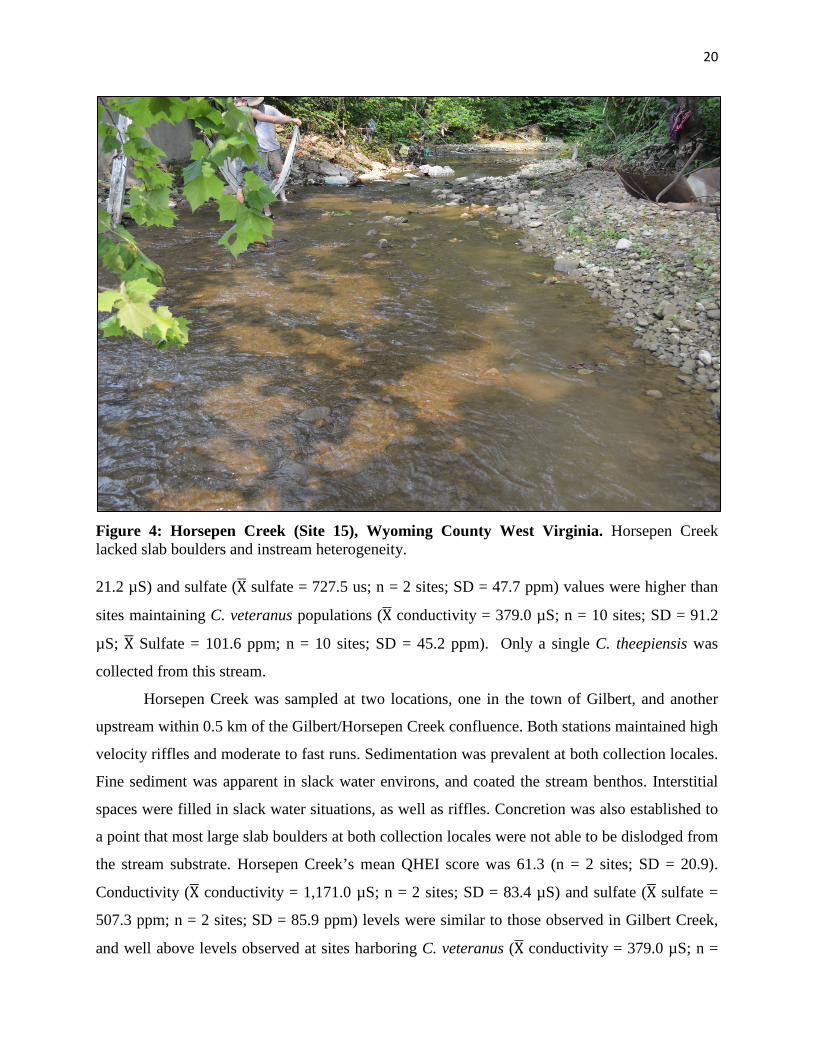
Gilbert and Horsepen Creek – Both Horsepen Creek (Site #15, 18; Fig. 1, 2 & 5; Table 1) and
its major tributary, Gilbert Creek (Site #16-17; Fig. 1 & 2; Table 1), were sampled at two
stations, with both streams sampling locations maintaining riffles and runs. Substrate items were
limited to large cobbles, CWD, and isolated boulders. Coal fines and excessive sediment were
present at both sampling locations. Boulders at both locales were firmly concreted into the
streambed and not capable of dislodgement. Gilbert Creek’s riparian corridor consisted primarily
of isolated residences. Active deep mine operations were present at both Gilbert Creek‘s
headwaters and confluence with Horsepen Creek. Gilbert Creek’s mean QHEI was 56.5 (n = 2
sites; SD = 1.4 QHEI). Average conductivity (X� conductivity = 1,513.0 µS; n = 2 sites; SD =
20
Figure 4: Horsepen Creek (Site 15), Wyoming County West Virginia. Horsepen Creek lacked slab boulders and instream heterogeneity. 21.2 µS) and sulfate (X� sulfate = 727.5 us; n = 2 sites; SD = 47.7 ppm) values were higher than
sites maintaining C. veteranus populations (X� conductivity = 379.0 µS; n = 10 sites; SD = 91.2
µS; X� Sulfate = 101.6 ppm; n = 10 sites; SD = 45.2 ppm). Only a single C. theepiensis was
collected from this stream.
Horsepen Creek was sampled at two locations, one in the town of Gilbert, and another
upstream within 0.5 km of the Gilbert/Horsepen Creek confluence. Both stations maintained high
velocity riffles and moderate to fast runs. Sedimentation was prevalent at both collection locales.
Fine sediment was apparent in slack water environs, and coated the stream benthos. Interstitial
spaces were filled in slack water situations, as well as riffles. Concretion was also established to
a point that most large slab boulders at both collection locales were not able to be dislodged from
the stream substrate. Horsepen Creek’s mean QHEI score was 61.3 (n = 2 sites; SD = 20.9).
Conductivity (X� conductivity = 1,171.0 µS; n = 2 sites; SD = 83.4 µS) and sulfate (X� sulfate =
507.3 ppm; n = 2 sites; SD = 85.9 ppm) levels were similar to those observed in Gilbert Creek,
and well above levels observed at sites harboring C. veteranus (X� conductivity = 379.0 µS; n =
21
10 sites; SD = 91.2 µS; X� Sulfate = 101.6 ppm; n = 10 sites; SD = 45.2 ppm). Horsepen Creek’s
crayfish fauna composition differed from Gilbert Creek. Cambarus theepiensis was not
encountered at either site, though Orconectes cristavarius was collected at both locations (X�
CPUE = 31 crayfish/h; n = 2 sites; SD = 40 crayfish/h), with an unusually high number of O.
cristavarius observed at Site #15 (CPUE = 59 crayfish/h).
Rockcastle Creek – Rockcastle Creek (Site #45-46; Fig. 1 & 2; Table 1) maintained limited
tertiary burrowing Cambarus habitat upstream from the Rockcastle Creek/Guyandotte River
confluence. Here, Rockcastle Creek’s course is moderate to high gradient through the northeast
portion of Pineville, Wyoming County. All of Rockcastle Creek in this region is encompassed
within Pineville city limits and experiences impacts associated with urban settings. Both sample
reaches possessed riffles and runs, were immediately in the vicinity of human habitation, and
lacked any riparian vegetation. Site #45 maintained a high gradient riffle, with abundant gravel,
large cobbles, and boulders comprising the stream substrate. All slab rock was anthropogenic in
origin, and consisted of concrete and blacktop slabs. Site #46 was a bedrock glide with isolated
small boulders. Sedimentation was present in slack water environments; concretion did not occur
at these sites and interstitial spaces were open. Mean QHEI score for Rockcastle Creek was 58.5
(n = 2 sites; SD = 0). Mean conductivity and sulfate levels were 174 µS (n = 2 sites; SD =
14.1μS) and 10.3 ppm (n = 2 sites; 7.9 ppm) respectively, and the lowest observed in the study.
Rockcastle Creek’s crayfish fauna consisted of both O. cristavarius (CPUE = 9 crayfish/h) and
C. theepiensis (CPUE = 4 crayfish/h), with O. cristavarius more prevalent than C. theepiensis.
All crayfish collected in Rockcastle Creek were taken in the downstream site (Site #45); zero
animals were taken in the heavily urbanized sample reach.
Buffalo Creek – Buffalo Creek was sampled both upstream and near its confluence with the
Guyandotte River (Site #7-10; Fig. 1 & 2; Table 1). Both sample reaches occurred in riffles and
runs, with substrates composed of gravel, coal fines, silt, and small to moderate cobbles. Slab
boulders, isolated boulders, and boulder clusters were present at both sampling locations.
Riparian corridors consisted of either second growth bottomland forest or residential situations.
Substrates were covered in sediment in lower velocity habitats, and silt free in runs and riffles.
Both sites possessed streambed concretion, with both slab boulders and boulders that were
22
concreted into the benthos. Pools, CWD, and concrete slabs provided additional habitat, as well
as habitat created for the stream’s Rainbow Trout fishery. Mean QHEI scores for both sample
locations was 67.5 (n = 2 sites; SD = 17.7 QHEI). Mean conductivity (X� conductivity = 629 µS;
n = 2 sites; SD = 53.0 µS) and sulfate levels (X� sulfate = 244.5 ppm; n = 2 sites; SD = 11.3 ppm)
were higher than sites maintaining C. veteranus (X� conductivity = 379.0 µS; n = 10 sites; SD =
91.2 µS; X� Sulfate = 101.6 ppm; n = 10 sites; SD = 45.2 ppm). Buffalo Creek’s crayfish fauna
consisted of O. cristavarius (X� CPUE = 31 crayfish/h; n = 2 sites; SD = 40 crayfish/h) and C.
theepiensis (X� CPUE = 31 crayfish/h; n = 2 sites; SD = 40 crayfish/h), of which O. cristavarius
was the dominant.
Stonecoal Creek – Stonecoal Creek (Site #70 - 71; Fig. 1 & 2; Table 1) is one of two tributaries
that form the extreme headwaters of the UGB. Two sites were sampled, the majority of each site
composed of moderate velocity runs terminating in short riffles. Both sample sites exhibited
sedimentation impacts, specifically concretion. Slabs and boulders were rare at both sample sites,
with the majority of the streambed consisting of coal fines and sediment. Interstitial spaces were
lacking at both sample reaches, and eliminated by excess sediment loading. Additional
anthropogenic impacts included elimination of riparian corridor vegetation, sewage discharges
from residences, and extensive bank erosion. Chladophora spp. (filamentous algae) was present
in both reaches, runs and riffles. Stonecoal Creek’s Mean QHEI score was 53.8 (n = 2 sites; SD
= 8.1 QHEI). Mean conductivity (X� conductivity = 465 µS; n = 2 sites; SD = 135.0 µS) and
sulfate (X� sulfate = 244.5 ppm; n = 2 sites; SD = 11.3 ppm) levels were above mean levels
associated with sites maintaining C. veteranus (X� conductivity = 379.0 µS; n = 10 sites; SD =
91.2 µS; X� Sulfate = 101.6 ppm; n = 10 sites; SD = 45.2 ppm). Stonecoal Creek’s crayfish
community consisted of both O. cristavarius (X� CPUE = 1 crayfish/h; n = 2 sites; SD = 1
crayfish/h) and C. theepiensis (X� CPUE = 5 crayfish/h; n = 2 sites; SD = 4 crayfish/h). Of the
two species, C. theepiensis was more prevalent.
Semi random Guyandotte River sites survey results
The Guyandotte River was sampled at seven locations. All sites contained optimal C.
veteranus habitat, and possessed either fast moving runs or moderate to high velocity riffles. Slab
23
boulders, isolated boulders, boulder clusters, and CWD were present at all sample locations.
Waterwillow beds were present at most sample locations. Sites were chosen between Gilbert
(furthest downstream), Mingo County, and Black Eagle, Wyoming County (furthest upstream),
which encompasses all historic stream confluences with the Guyandotte mainstem, Sites
occurred between elevations from 259 m (849 ft.) in Gilbert to 428 m (1,405 ft.) in Black Eagle,
and were categorized as headwaters (Site #60,63; Fig. 1 & 2; Table 1), midriver-upstream (Site
#44, 47, 57; Fig. 1 & 2; Table 1), and midriver-downstream (Site #19, 26; Fig. 1 & 2; Table 1)
sites.
Upstream sites were morphologically similar to both historic and current C. veteranus
sites, specifically Huff Creek, downstream portions of Indian Creek, and Clear Fork sites. Stream
width ranged from 15-25 m, with substrates composed of slab boulders, boulders, isolated
boulder clusters and large cobbles. Coal fines and sediment were present at both sample reaches.
In slack water habitats, slab boulders, isolated boulders, and boulder clusters experienced
varying levels of sedimentation, ranging from complete concretion to only surfaces covered in
sediment. Interstitial spaces ranged from open, in high velocity habitats, to filled in slack water
habitats.
Riparian corridors were composed of secondary bottomland forests at both upstream
sample sites. Mean QHEI was 74.8 (n = 2 sites; SD = 3.9 QHEI). Both mean conductivity (X�
conductivity = 475.9 µS; n = 2 sites) and sulfate (X� Sulfate = 85.5 ppm; n = 2 sites; SD = 2.8
ppm) levels were higher than sites maintaining C. veteranus (X� conductivity = 379.0 µS; n = 10
sites; SD = 91.2 µS; X� Sulfate = 101.6 ppm; n = 10 sites; SD = 45.2 ppm). Orconectes
cristavarius (X� CPUE = 0.5 crayfish/h; n = 2 sites; SD = 0.7 crayfish/h) was the most prevalent
crayfish in the Guyandotte River’s headwaters; only a single C. theepiensis (X� CPUE = 5
crayfish/h; n = 2 sites; SD = 4 crayfish/h) was collected between both sites sampled. Zero C.
veteranus were collected in the headwaters of the Guyandotte River. Mean crayfish CPUE for
the headwaters of the Guyandotte River was 16.5 crayfish/h (n = 2 sites; SD = 12.0 crayfish/h).
The three Mid-River Guyandotte River locations sampled were within one kilometer
upstream and downstream of the confluence with Pinnacle Creek, and upstream of the Indian
Creek confluence. Elevation ranged from 374 m (1,230 ft.) to 400 m (1,314 ft.). Sites #47 and
#57 were both expansive riffle/run complexes with abundant slab boulders, boulder clusters,
CWD snags, and water willow beds. Stream width ranged from 20-35 m, with depth ranging
24
from 0.25 to 1.3 m. Sedimentation issues were limited to slow moving runs, where boulders were
embedded in the streambed. All rock habitats in riffles maintained open interstitial spaces and
were easily dislodged. Site #44 was a moderate to slow moving run with isolated boulders and
slab boulders. Dominant substrate types for all slack water habitats were gravel, coal fines, and
silt. Riffle and run substrates were composed of gravels, coal fines, cobbles, and boulders.
Riparian corridors for all mid-river upstream sites consisted of the right descending bank
exhibiting secondary growth forest, while the left descending bank consisted of the berm of US
Route 52.
Mean QHEI was 74.5 (n = 3 sites; SD = 6.5 QHEI). Both mean conductivity (X�
conductivity = 457.1 µS; n = 3 sites; SD = 25.0 µS) and sulfate (X� Sulfate = 97.7 ppm; n = 3
sites; SD = 0.9 ppm) levels were higher than sites maintaining C. veteranus (X� conductivity =
379.0 µS; n = 10 sites; SD = 91.2 µS; X� Sulfate = 101.6 ppm; n = 10 sites; SD = 45.2 ppm). Both
O. cristavarius (X� = 2 crayfish/h; n = 3 sites; SD = 1.0 crayfish/h) and C. theepiensis (X� = 1
crayfish/h; n = 3 sites; SD = 1.0 crayfish/h) were collected in near equal numbers. Crayfish
capture rates were lower (X� = 3 crayfish/h; n = 3 sites; SD = 1.7 crayfish/h) in mid-river
upstream sites compared to Guyandotte River upstream sites (16.5 crayfish/h; n = 2 sites; SD =
12.0 crayfish/h).
Both mid-river downstream Guyandotte River sites occurred downstream of the Clear
Fork/Guyandotte River confluence. Specifically, Site #26 was 0.5 km from the aforementioned
confluence, was 30-45 m wide, and ranged in depth from 0.2 to 1.3 m at the time of sampling. A
large high velocity riffle/run complex composed the majority of the reach. Dominant substrates
were sand, gravel, and coal fines, with slab boulders, boulder clusters and isolated boulders in
riffles and runs. Site #19 occurred downstream of R. D. Bailey Reservoir and exhibited similar
habitat characteristics as Site #26, with slab boulders and boulders occurring in fast moving
riffle/runs. Waterwillow beds were present at Site #26 and absent at Site #19. Both sites had coal
fines as significant components of the stream benthos. Riparian corridors for both sites consisted
of either secondary forests or isolated residences.
Mean QHEI was 76.8 (n = 3 sites; SD = 6.5 QHEI). Both mean conductivity (X�
conductivity = 457.1 µS; n = 3 sites; SD = 25.0 µS) and sulfate (X� Sulfate = 97.7 ppm; n = 3
sites; SD = 0.9 ppm) levels were higher than sites maintaining C. veteranus (X� conductivity =
379.0 µS; n = 10 sites; SD = 91.2 µS; X� Sulfate = 101.6 ppm; n = 10 sites; SD = 45.2 ppm).
25
Orconectes cristavarius (X� = 2 crayfish/h; n = 3 sites; SD = 1.0 crayfish/h) and C. theepiensis (X�
= 1 crayfish/h; n = 3 sites; SD = 1.0 crayfish/h) were collected in near equal numbers. Crayfish
capture rates were lower (X� = 3 crayfish/h; n = 3 sites; SD = 1.7 crayfish/h) in mid-river
upstream sites compared to Guyandotte River upstream sites (16.5 crayfish/h; n = 2 sites; SD =
12.0 crayfish/h).
Average Guyandotte River QHEI was 75.2 (n = 7 sites; SD = 4.3 QHEI). Both mean
conductivity (X� conductivity = 463.4 µS; n = 7 sites; SD = 24.8 µS) and sulfate (X� Sulfate = 92.5
ppm; n = 7 sites; SD = 5.6 ppm) levels were higher than sites maintaining C. veteranus (X�
conductivity = 379.0 µS; n = 10 sites; SD = 91.2 μS; X� Sulfate = 101.6 ppm; n = 10 sites; SD =
45.2 ppm). Orconectes cristavarius (X� = 5.4 crayfish/h; n = 7 sites; SD = 8.9 crayfish/h) was the
most prevalent crayfish in the Guyandotte River mainstem at sites sampled. Cambarus
theepiensis were collected at 57.1% of sites sampled, and always in low numbers (X� = 1
crayfish/h; n = 3 sites; SD = 1.0 crayfish/h). Statistically, crayfish capture rates were not quite
significantly lower (ɑ = 0.05; t(70) = 1.8; p = 0.06) in the Guyandotte River mainstem (X� = 6.14
crayfish/h; n = 3 sites; SD = 8.7 crayfish/h) compared to CPUE values associated with
Guyandotte tributaries (X� = 15 crayfish/h; n = 64 sites; SD = 12 crayfish/h).
Small ordered semi-randomized stream results
Several smaller ordered streams (n = 9 sites; Rum Creek – Site #5; Horsepen Creek – Site #15 &
18; Gilbert Creek – Sites #16-17; Rockcastle Creek – Sites #45-46; Devils Fork – Site #68;
Tommy Creek – Site #69; Fig. 1 & 2; Table 1) were sampled to determine if C. veteranus
occupies smaller headwater streams. Zero C. veteranus were procured from these streams, and in
all situations C. theepiensis was dominant if crayfish were present. Site information for these
streams in provided in Table 1.
Model results
The Goodness of Fit (GOF) statistic supported a good fit of the global model to the data (Χ2
= 11.2, DF = 8, p = 0.19), and ROC curves (AUC > 0.87) supported high predictive accuracy for
all competing models. Conductivity and sulfate were correlated (r = 0.88), so these variables
26
were modeled separately, with exception of the global model. We did not model %DO as a
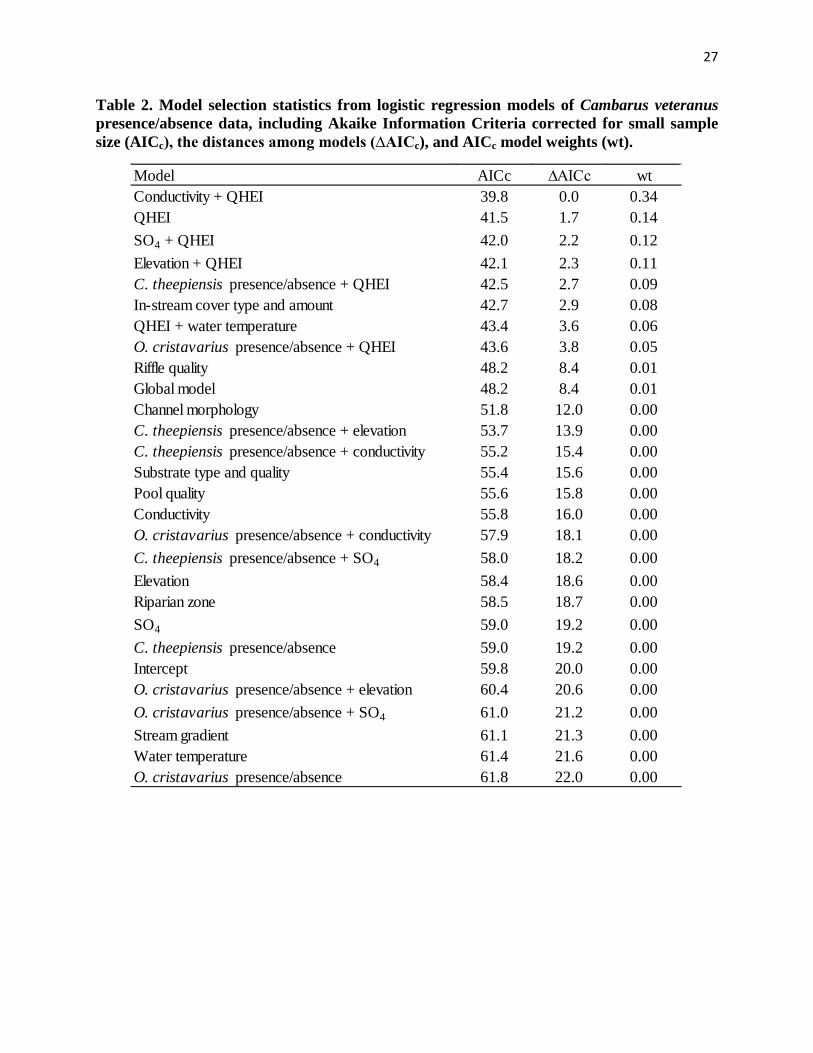
covariate because it had little among-site variation (range 90–100%). For C. veteranus, data
strongly supported two models with ∆AICc ≤ 2.0: Conductivity + QHEI (∆AICc = 0.0, wt = 0.34)
and QHEI (∆AICc = 1.7, wt = 0.14). However, six additional models were weighted: SO4 +
QHEI (∆AICc = 2.2, wt = 0.12), Elevation + QHEI (∆AICc = 2.3, wt = 0.11), C. theepiensis
presence/absence + QHEI (∆AICc = 2.7, wt = 0.09), In-stream cover type and amount (∆AICc =
2.9, wt = 0.08), QHEI + water temperature (∆AICc = 3.6, wt = 0.06), and O. cristavarius
presence/absence + QHEI (∆AICc = 3.8, wt = 0.05; Table 2).
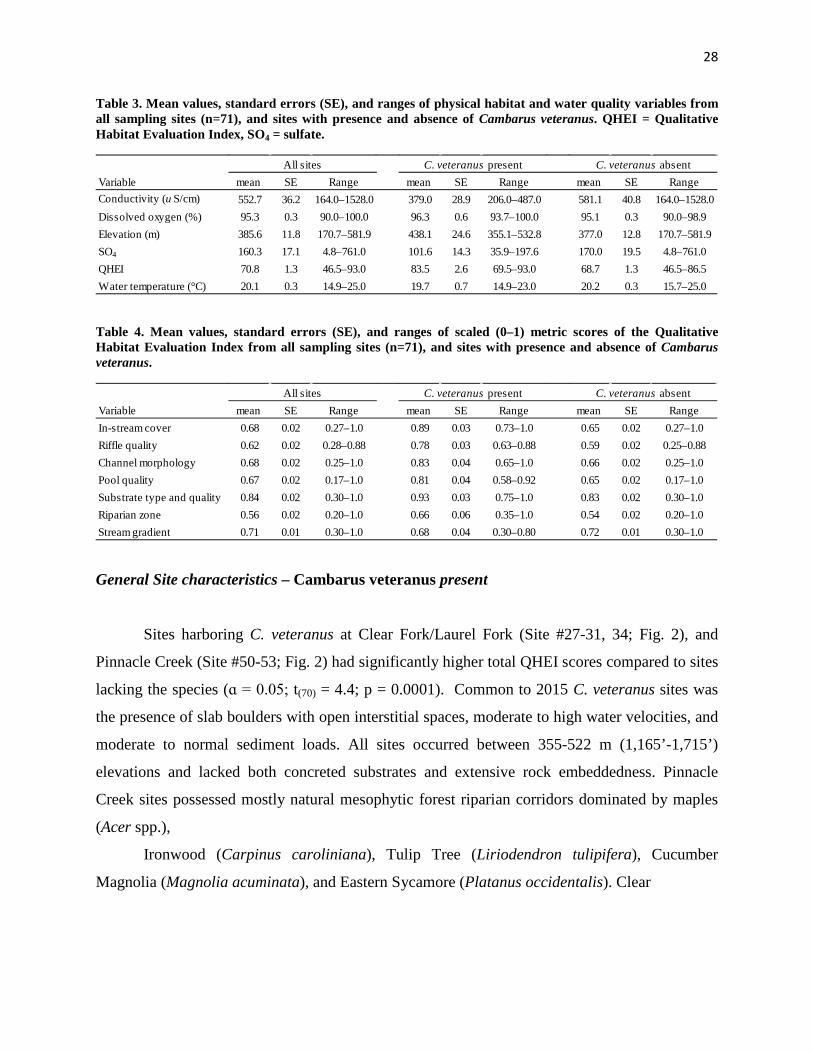
Mean values of covariates for sites with presence and absence of C. veteranus aided
interpretation of model results. Sites where C. veteranus was present had lower mean ± SE
values of conductivity (379.0 ± 28.9) and SO4 (101.6 ± 14.3) than sites where the species was
absent (581.1 ± 40.8 and 170.0 ± 19.5, respectively, Table 3). Based on logistic regression
models, negative beta values for covariates of conductivity and SO4 were consistent with lower
mean values of conductivity and SO4 at sites with species presence. Contrastingly, positive beta
estimates were associated with elevation and QHEI covariates (Table 4). Correspondingly, mean
values of elevation (438.1 ± 24.6) and QHEI (83.5 ± 2.6) were higher at sites with species
presence than those with species absence (377.0 ± 12.8 and 68.7 ± 1.3, respectively). Beta
estimates for the C. theepiensis presence/absence covariate were negative; the presence of C.
theepiensis was often associated with an absence of C. veteranus.
QHEI total score covariate was present in both AICc-selected models, suggesting an
association of relatively high physical habitat quality with the presence of C. veteranus.
Furthermore, overall high habitat quality was associated with C. veteranus site presence given
cumulative QHEI scores were selected over any one individual QHEI subscore. A descriptive
analysis of scaled QHEI metric scores indicated that six (Instream cover, Riffle quality, Channel
morphology, Pool quality, Substrate type and quality, and Riparian Zone) of seven QHEI metric
scores were higher at sites with the presence of C. veteranus than at sites with species absence
(Table 3). Further, in-stream cover and riffle quality were weighted (∆AICc = 2.9, wt = 0.08 and
∆AICc = 8.4, wt = 0.01, respectively; Table 1) suggesting that these two QHEI metric scores
were important contributors to the overall QHEI score.
27
Table 2. Model selection statistics from logistic regression models of Cambarus veteranus presence/absence data, including Akaike Information Criteria corrected for small sample size (AICc), the distances among models (∆AICc), and AICc model weights (wt).
Model AICc ∆AICc wtConductivity + QHEI 39.8 0.0 0.34QHEI 41.5 1.7 0.14SO4 + QHEI 42.0 2.2 0.12Elevation + QHEI 42.1 2.3 0.11C. theepiensis presence/absence + QHEI 42.5 2.7 0.09In-stream cover type and amount 42.7 2.9 0.08QHEI + water temperature 43.4 3.6 0.06O. cristavarius presence/absence + QHEI 43.6 3.8 0.05Riffle quality 48.2 8.4 0.01Global model 48.2 8.4 0.01Channel morphology 51.8 12.0 0.00C. theepiensis presence/absence + elevation 53.7 13.9 0.00C. theepiensis presence/absence + conductivity 55.2 15.4 0.00Substrate type and quality 55.4 15.6 0.00Pool quality 55.6 15.8 0.00Conductivity 55.8 16.0 0.00O. cristavarius presence/absence + conductivity 57.9 18.1 0.00C. theepiensis presence/absence + SO4 58.0 18.2 0.00Elevation 58.4 18.6 0.00Riparian zone 58.5 18.7 0.00SO4 59.0 19.2 0.00C. theepiensis presence/absence 59.0 19.2 0.00Intercept 59.8 20.0 0.00O. cristavarius presence/absence + elevation 60.4 20.6 0.00O. cristavarius presence/absence + SO4 61.0 21.2 0.00Stream gradient 61.1 21.3 0.00Water temperature 61.4 21.6 0.00O. cristavarius presence/absence 61.8 22.0 0.00
28
Table 3. Mean values, standard errors (SE), and ranges of physical habitat and water quality variables from all sampling sites (n=71), and sites with presence and absence of Cambarus veteranus. QHEI = Qualitative Habitat Evaluation Index, SO4 = sulfate.
Table 4. Mean values, standard errors (SE), and ranges of scaled (0–1) metric scores of the Qualitative Habitat Evaluation Index from all sampling sites (n=71), and sites with presence and absence of Cambarus veteranus.
General Site characteristics – Cambarus veteranus present
Sites harboring C. veteranus at Clear Fork/Laurel Fork (Site #27-31, 34; Fig. 2), and
Pinnacle Creek (Site #50-53; Fig. 2) had significantly higher total QHEI scores compared to sites
lacking the species (ɑ = 0.05; t(70) = 4.4; p = 0.0001). Common to 2015 C. veteranus sites was
the presence of slab boulders with open interstitial spaces, moderate to high water velocities, and
moderate to normal sediment loads. All sites occurred between 355-522 m (1,165’-1,715’)
elevations and lacked both concreted substrates and extensive rock embeddedness. Pinnacle
Creek sites possessed mostly natural mesophytic forest riparian corridors dominated by maples
(Acer spp.),
Ironwood (Carpinus caroliniana), Tulip Tree (Liriodendron tulipifera), Cucumber
Magnolia (Magnolia acuminata), and Eastern Sycamore (Platanus occidentalis). Clear
Variable mean SE Range mean SE Range mean SE RangeConductivity (u S/cm) 552.7 36.2 164.0–1528.0 379.0 28.9 206.0–487.0 581.1 40.8 164.0–1528.0Dissolved oxygen (%) 95.3 0.3 90.0–100.0 96.3 0.6 93.7–100.0 95.1 0.3 90.0–98.9Elevation (m) 385.6 11.8 170.7–581.9 438.1 24.6 355.1–532.8 377.0 12.8 170.7–581.9SO4 160.3 17.1 4.8–761.0 101.6 14.3 35.9–197.6 170.0 19.5 4.8–761.0QHEI 70.8 1.3 46.5–93.0 83.5 2.6 69.5–93.0 68.7 1.3 46.5–86.5Water temperature (°C) 20.1 0.3 14.9–25.0 19.7 0.7 14.9–23.0 20.2 0.3 15.7–25.0
All sites C. veteranus present C. veteranus absent
Variable mean SE Range mean SE Range mean SE RangeIn-stream cover 0.68 0.02 0.27–1.0 0.89 0.03 0.73–1.0 0.65 0.02 0.27–1.0Riffle quality 0.62 0.02 0.28–0.88 0.78 0.03 0.63–0.88 0.59 0.02 0.25–0.88Channel morphology 0.68 0.02 0.25–1.0 0.83 0.04 0.65–1.0 0.66 0.02 0.25–1.0Pool quality 0.67 0.02 0.17–1.0 0.81 0.04 0.58–0.92 0.65 0.02 0.17–1.0Substrate type and quality 0.84 0.02 0.30–1.0 0.93 0.03 0.75–1.0 0.83 0.02 0.30–1.0Riparian zone 0.56 0.02 0.20–1.0 0.66 0.06 0.35–1.0 0.54 0.02 0.20–1.0Stream gradient 0.71 0.01 0.30–1.0 0.68 0.04 0.30–0.80 0.72 0.01 0.30–1.0
All sites C. veteranus present C. veteranus absent
29
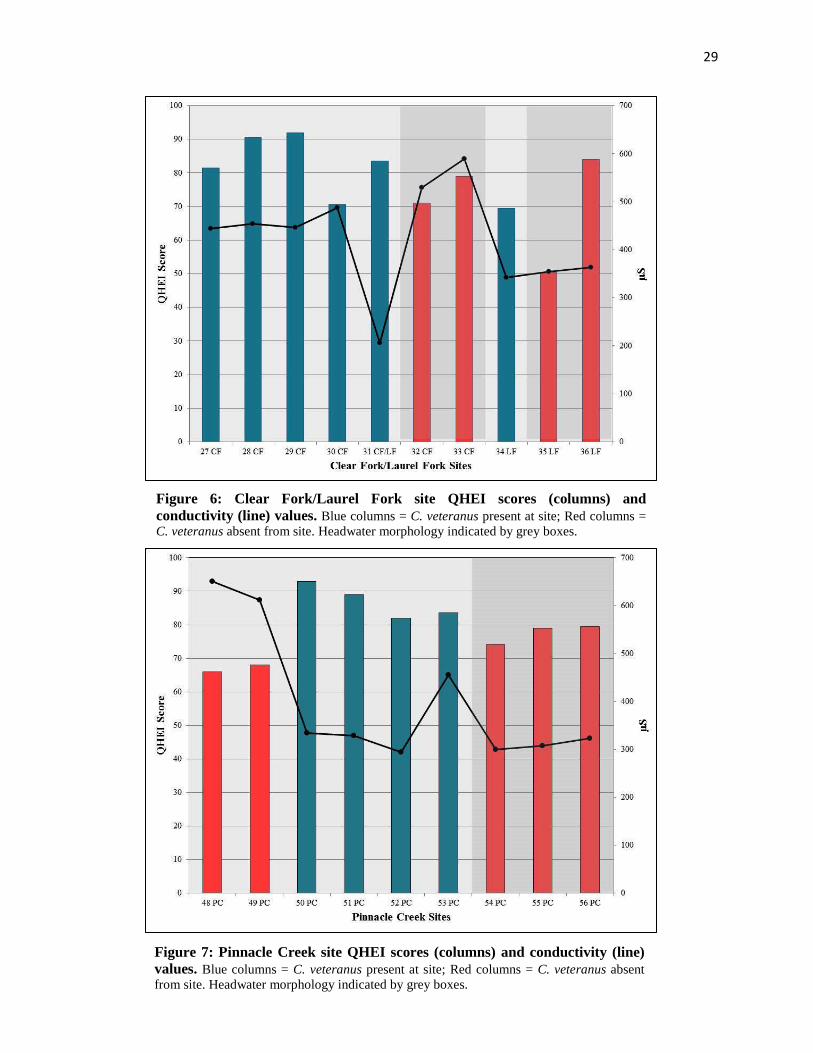
Figure 6: Clear Fork/Laurel Fork site QHEI scores (columns) and conductivity (line) values. Blue columns = C. veteranus present at site; Red columns = C. veteranus absent from site. Headwater morphology indicated by grey boxes.
Figure 7: Pinnacle Creek site QHEI scores (columns) and conductivity (line) values. Blue columns = C. veteranus present at site; Red columns = C. veteranus absent from site. Headwater morphology indicated by grey boxes.
30
Fork/Laurel Fork coursed through a valley with varying levels of riparian corridor development,
ranging from secondary growth bottomland forests comprising the previously mentioned tree
species to urban situations like downtown Oceana and the community of Clear Fork. Cambarus
veteranus were collected primarily under slab boulders in either moderate to high velocity riffles,
under slab boulders in fast moving runs, or under isolated slab boulders in moderate velocity
sand bottomed runs. At sites harboring C. veteranus, zero animals were collected within the
sample reach in pools.
Physiochemical attributes differed between sites maintaining and lacking C. veteranus.
Mean conductivity was lower (X� conductivity = 379.0 µS; n = 10 sites; SE = 91.2 μS) at sites
harboring C. veteranus compared to those that lacked the species (X� conductivity = 570.3 µS; n =
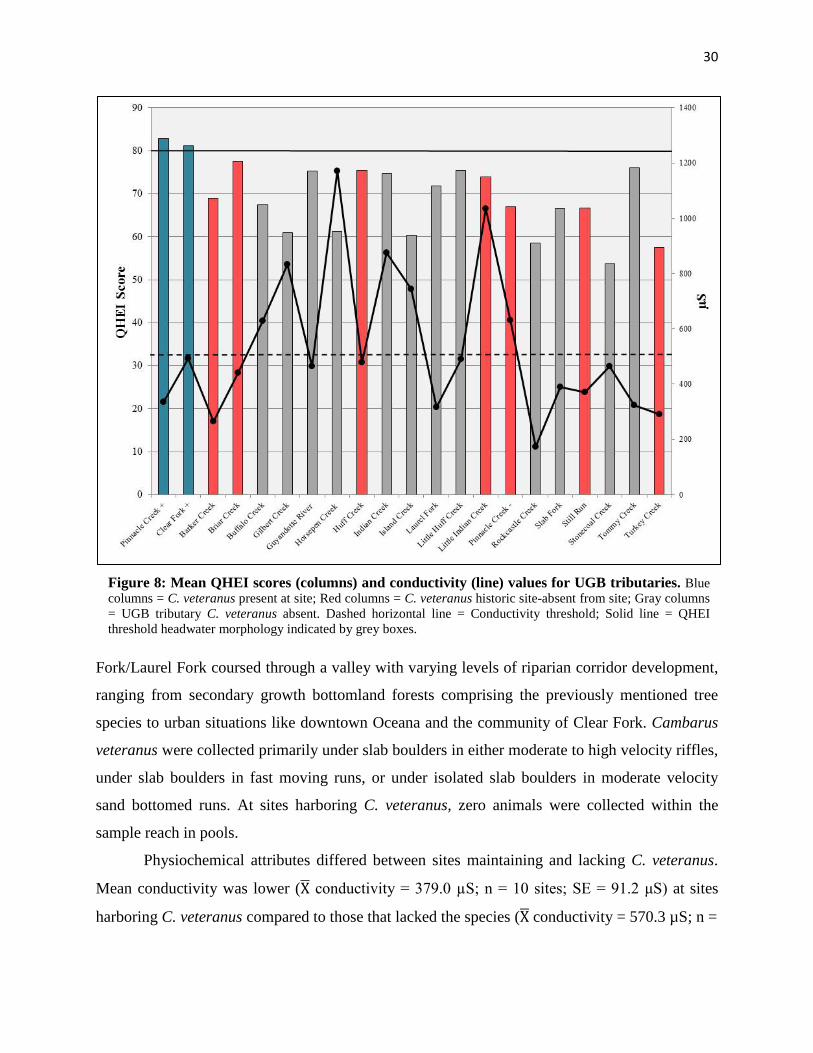
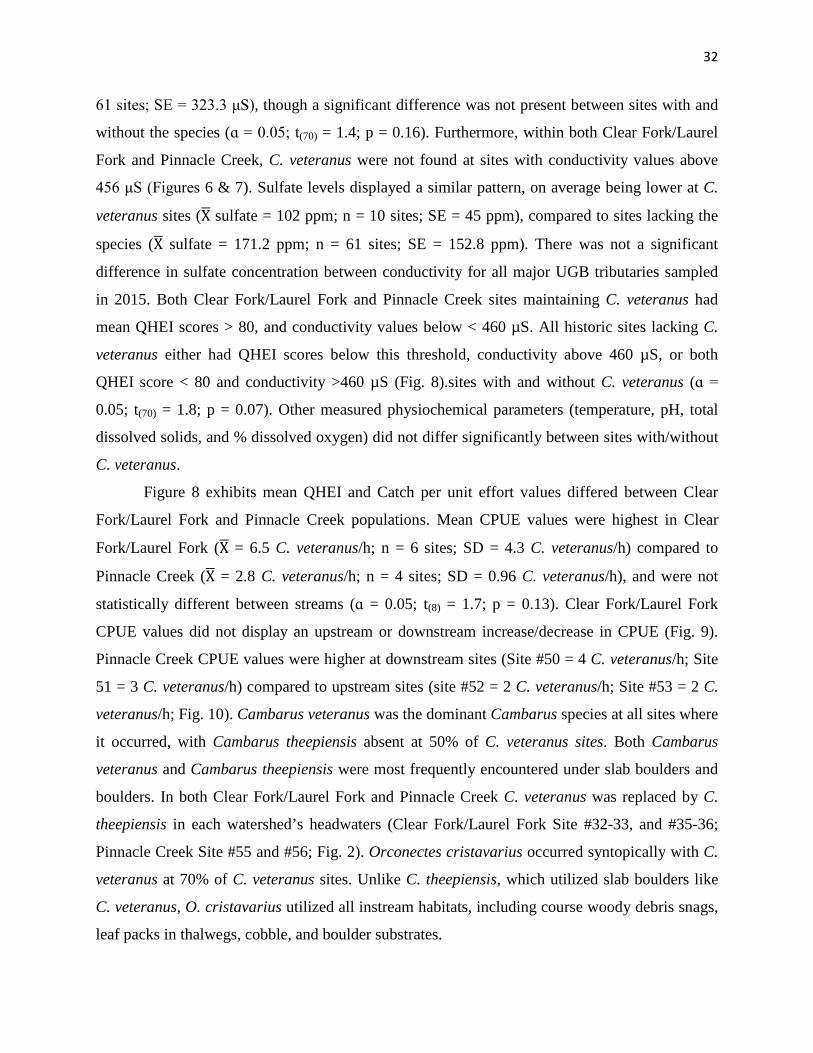
Figure 8: Mean QHEI scores (columns) and conductivity (line) values for UGB tributaries. Blue columns = C. veteranus present at site; Red columns = C. veteranus historic site-absent from site; Gray columns = UGB tributary C. veteranus absent. Dashed horizontal line = Conductivity threshold; Solid line = QHEI threshold headwater morphology indicated by grey boxes.
31
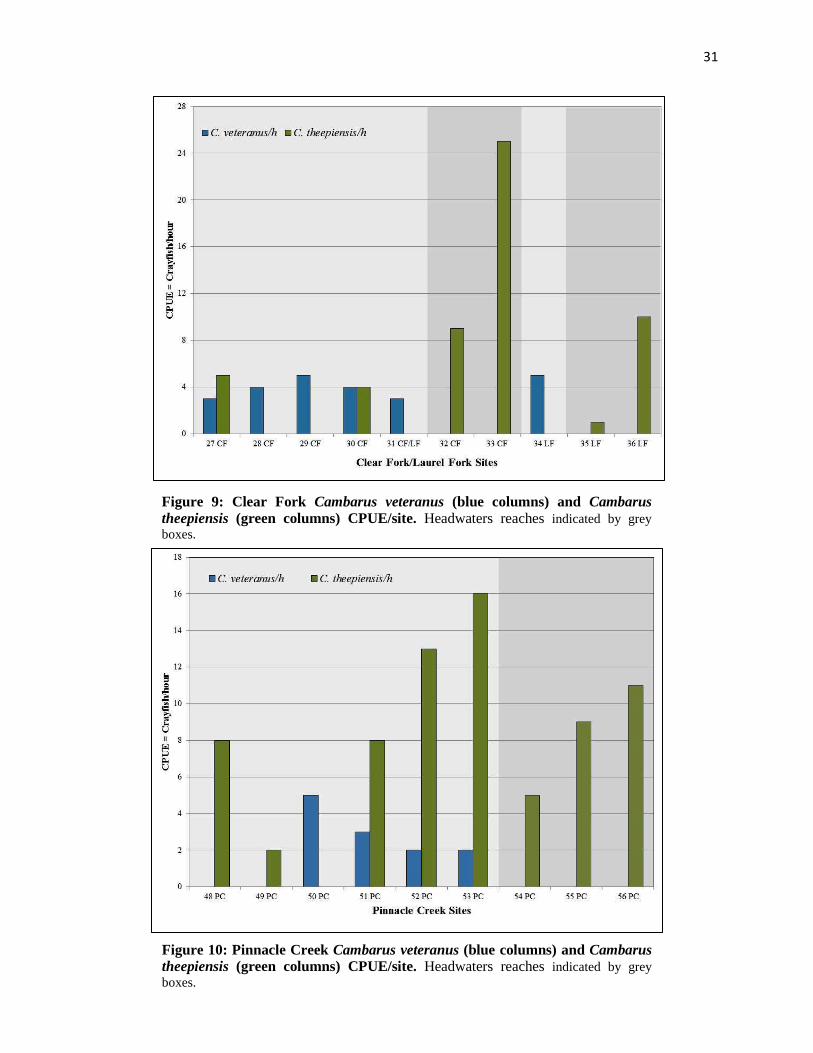
Figure 9: Clear Fork Cambarus veteranus (blue columns) and Cambarus theepiensis (green columns) CPUE/site. Headwaters reaches indicated by grey boxes.
Figure 10: Pinnacle Creek Cambarus veteranus (blue columns) and Cambarus theepiensis (green columns) CPUE/site. Headwaters reaches indicated by grey boxes.
32
61 sites; SE = 323.3 μS), though a significant difference was not present between sites with and
without the species (ɑ = 0.05; t(70) = 1.4; p = 0.16). Furthermore, within both Clear Fork/Laurel
Fork and Pinnacle Creek, C. veteranus were not found at sites with conductivity values above
456 μS (Figures 6 & 7). Sulfate levels displayed a similar pattern, on average being lower at C.
veteranus sites (X� sulfate = 102 ppm; n = 10 sites; SE = 45 ppm), compared to sites lacking the
species (X� sulfate = 171.2 ppm; n = 61 sites; SE = 152.8 ppm). There was not a significant
difference in sulfate concentration between conductivity for all major UGB tributaries sampled
in 2015. Both Clear Fork/Laurel Fork and Pinnacle Creek sites maintaining C. veteranus had
mean QHEI scores > 80, and conductivity values below < 460 µS. All historic sites lacking C.
veteranus either had QHEI scores below this threshold, conductivity above 460 µS, or both
QHEI score < 80 and conductivity >460 µS (Fig. 8).sites with and without C. veteranus (ɑ =
0.05; t(70) = 1.8; p = 0.07). Other measured physiochemical parameters (temperature, pH, total
dissolved solids, and % dissolved oxygen) did not differ significantly between sites with/without
C. veteranus.
Figure 8 exhibits mean QHEI and Catch per unit effort values differed between Clear
Fork/Laurel Fork and Pinnacle Creek populations. Mean CPUE values were highest in Clear
Fork/Laurel Fork (X� = 6.5 C. veteranus/h; n = 6 sites; SD = 4.3 C. veteranus/h) compared to
Pinnacle Creek (X� = 2.8 C. veteranus/h; n = 4 sites; SD = 0.96 C. veteranus/h), and were not
statistically different between streams (ɑ = 0.05; t(8) = 1.7; p = 0.13). Clear Fork/Laurel Fork
CPUE values did not display an upstream or downstream increase/decrease in CPUE (Fig. 9).
Pinnacle Creek CPUE values were higher at downstream sites (Site #50 = 4 C. veteranus/h; Site
51 = 3 C. veteranus/h) compared to upstream sites (site #52 = 2 C. veteranus/h; Site #53 = 2 C.
veteranus/h; Fig. 10). Cambarus veteranus was the dominant Cambarus species at all sites where
it occurred, with Cambarus theepiensis absent at 50% of C. veteranus sites. Both Cambarus
veteranus and Cambarus theepiensis were most frequently encountered under slab boulders and
boulders. In both Clear Fork/Laurel Fork and Pinnacle Creek C. veteranus was replaced by C.
theepiensis in each watershed’s headwaters (Clear Fork/Laurel Fork Site #32-33, and #35-36;
Pinnacle Creek Site #55 and #56; Fig. 2). Orconectes cristavarius occurred syntopically with C.
veteranus at 70% of C. veteranus sites. Unlike C. theepiensis, which utilized slab boulders like
C. veteranus, O. cristavarius utilized all instream habitats, including course woody debris snags,
leaf packs in thalwegs, cobble, and boulder substrates.

33
Cambarus veteranus life history observation – 2015
Fifty four C. veteranus (5 I♂; 24 II♂; 25 ♀) were captured in Clear Fork and Pinnacle
Creek, with 43 and 11 collected respectively from each creek. It is important to note that
additional collecting was performed following each site’s 10 seine hauls to collect additional
animals and subsequent life history information; these values do not match values depicted in
Table 1 which are reflective of the number of C. veteranus captured during each site’s
respective 10 seine hauls. Adult animals captured in May had undergone a population wide molt
in either April or early May. The vast majority of adult animals (TCL > 30.0 mm) exoskeletons
lacked heavy metal encrustation, and exhibited vivid coloration indicative of a recent molt. The
vivid nature of both populations carapaces was absent in June, by which time most animals
exoskeletons had experienced some degree of heavy metal or biological fouling. Loughman et al.
(2015) measured all preserved C. veteranus in the USNM, OSU, and WLU astacological
collections and identified five (1 = 13-17 mm; #2 = 22-23 mm; #3 28-32 mm; #4 = 34-38 mm;
#5 = 42-49 mm) size cohorts for C. veteranus. 2015 collections determined seven size cohorts (n
Figure 11: Cambarus veteranus size histogram. Shaded boxes indicate possible size cohort.
34
= 53 animals; Fig. 11) were present within both populations when data was pooled for both Clear
Fork/Laurel Fork and Pinnacle Creek (Fig. 11). Average TCL was 33.7 mm (n = 52; SD ± 7.4
mm). Form I males were the largest sex, with an average TCL of 38.4 mm (n = 5; SD ± 5.8 mm).
Female (X� = 33.8; n = 25; SD ± 7.4 mm) and form II males (X� = 33.5; n = 24; SD ± 7.4 mm)
average TCL was similar, and close to that of the overall population. Male to female sex ratio for
all animals collected was 1.2 males/1.0 females and skewed towards males.
Form I males represented 23.8% of males collected in May and June. Given the majority
of adults displayed evidence of a recent molt, C. veteranus likely do not reproduce until the
autumn or late summer following either a late summer or autumnal molt. At this point this is
speculation, and a critical void in the understanding of C. veteranus biology. Results from this
study support this hypothesis, but certainly do not prove it. The majority (63%) of adult females
collected in May possessed mature, active glare glands. Zero ovigerous females were collected.
The vast majority of animals collected were either juveniles or adults (Fig. 11); young of the year
(YOY) were noticeably absent from Clear Fork/Laurel Fork and Pinnacle Creek collections in
May and June. Whether this lack of YOY was an artifact of sampling bias or a product of
seasonality is unknown, given the species annual life history has not be determined. Given the
condition of female glare glands and the lack of YOY in collections, it is hypothesized that C.
veteranus extrude eggs in early to mid-summer, like many tertiary burrowing Cambarus species
in central Appalachia (Jezerinac et al. 1995; Taylor and Schuster 2004).
DISCUSSION
Cambarus veteranus current resident status supports the Jezerinac et al. (1995) prediction
that the species would experience range wide decline. Jezerinac et al. (1995) were the first to
systematically survey the UGB for C. veteranus in the summers of 1988/89. Extant populations
were discovered occurring in Little Indian Creek, Pinnacle Creek, and Huff Creek. Channel
(2003) was the next to survey all historic locations in 2000 and 2001. Channel failed to locate C.
veteranus in the UGB, resulting in Jones et al. (2010) hypothesizing that C. veteranus had been
extirpated from West Virginia. Loughman and Welsh (2013) surveyed the historic locations as
well as 52 other potential sites and discovered that C. veteranus was not extirpated from the
state, and that the species persisted in Pinnacle Creek. Results of the 2015 survey determined
35
that populations first documented by Jezerinac et al. (1995) in the late 1980’s are still extant in
Pinnacle Creek, and that the species is present in Clear Fork/Laurel Fork, being documented in
that watershed for the first time with this effort. Results of the 2015 survey, coupled with
Channel (2003), Jones et al. (2010), Loughman (2013), Loughman and Welsh (2013) results
indicate that historic populations in Indian Creek, Little Indian Creek, Briar Creek, Barkers
Creek, Huff Creek, and Turkey Creek are extirpated, and C. veteranus has experienced an overall
decline in population since its discovery in 1900.
Surveys associated with this effort represent the most intensive survey for C. veteranus in
the species’ history. Furthermore, with the inclusion of site level QHEI metrics and
physiochemical data, the ability to elucidate the ecological theater affiliated with C. veteranus
presence or absence in a given stream is attainable through logistic regression modelling for the
first time. Survey results determined that C. veteranus is still extant in at least 4.8 km of Pinnacle
Creek, and for the first time documented the species in at least 21.7 km of the Clear Fork/Laurel
Fork watershed. Though C. veteranus was discovered in both these watersheds, extensive survey
results did not find the species in seven of eight historic streams, the Guyandotte River
mainstem, or other streams surveyed for the species. Logistic regression modelling results
indicated that instream habitat heterogeneity and quality as well as conductivity levels may
determine if C. veteranus can persist in a given stream reach. Specifically, zero C. veteranus
were collected in streams with conductivities higher than 460 µS, and were absent from both
Pinnacle Creek and Clear Fork when conductivities exceeded these levels.
High quality instream habitat is critical to the continued persistence of C. veteranus in
Clear Fork/Laurel Fork and Pinnacle Creek. Specifically, C. veteranus site presence was
associated with stream bed substrates embedded in marginal to little sediment with open
interstitial spaces, with zero substrate concretion. Instream habitat heterogeneity score coupled
with substrate represent a disproportionate percent of overall QHEI score. QHEI scores averaged
higher at sites maintaining C. veteranus populations, and were the most predictive metric for C.
veteranus presence in the UGB. Welsh and Loughman (2014) reported high QHEI (>75 QHEI)
score as the most important, predictive value as either a single or additive model for all six
species composing West Virginia’s Coal River crayfish community. Conductivity was not
selected in Welsh and Loughman (2014) as an overly important predictive covariate for any of
the Coal River’s crayfish community. Cambarus veteranus model selection results determined in
36
this study indicated for the first time that a species of crayfish site presence was allied with
stream conductivity. The specific biological impact of stream conductivity on C. veteranus is
unknown. What was determined with this work is elevated stream conductivity (>460 µS) was
associated with C. veteranus absence at sites, indicating that maintenance of low stream
conductivity may be necessary for C. veteranus populations to persist.
Survey results also indicated that a competitive interaction between C. theepiensis and C.
veteranus likely occurred historically, and may be a contributing factor to the decline of C.
veteranus over the past century in the UTB following anthropogenic degradation of the
watershed. Specifically, in both the Clear Fork/Laurel Fork and Pinnacle Creek systems, C.
veteranus was dominant in lower and mid-stream reaches, and replaced by C. theepiensis as
gradients increased and stream morphology switched from wadeable to upstream morphologies.
In headwater situations, C. veteranus was absent and C. theepiensis dominant. It is possible that
following systemic degradation of the watershed through elimination of quality habitat, and
increasing physiochemical inputs leading to physiologic stress, that C. theepiensis became more
competitive and consequently moved down watershed into lower stream reaches historically
occupied by C. veteranus. Evidence for this occurring is the presence of C. theepiensis in all C.
veteranus historical streams. The role O. cristavarius plays in this interaction is nebulous, and in
need of future research. Orconectes cristavarius was the most prevalent crayfish species in the
UGB, but did not display the dependency on slab boulders that both Cambarus species exhibited.
37
Work Cited Burskey, J. L. & T. P. Simon, 2010. Reach- and watershed-scale associations of crayfish within
an area of varying agricultural impact in west-central Indiana. Southeastern Naturalist 9 (Special Issue 3): 199–216.
Gazendam, E., B. Gharabaghi, F. C. Jones & H. Whiteley, 2011. Evaluation of the Qualitative
Habitat Evaluation Index as a planning and design tool for restoration of rural Ontario waterways. Canadian Water Resources Journal 36: 149–158.
Jezerinac, R.F., G.W. Stocker, and D.C. Tarter. 1995. The Crayfishes (Decapoda: Cambaridae)
of West Virginia. Bulletin of the Ohio Biological Survey, New Series 10:1–193.
Loughman, Z. J. 2014. Biological Status Review of Cambarus veteranus for U. S. Fish and Wildlife Service. Review prepared for United States Fish and Wildlife Service. 49 pp.
Loughman, Z. J., S. A. Welsh, J. W. Fetzner, and R. F. Thoma. 2015. Conservation of Imperiled
Crayfish, Cambarus veteranus (Decapoda: Reptantia: Cambaridae). Journal of Crustacean Biology. DOI: 10.1163/1937240X-00002383. 1-11.
Ohio Environmental Protection Agency, 2006, Methods for assessing habitat in flowing
waters—using the Qualitative Habitat Evaluation Index (QHEI), Division of Surface Water, Ecological Assessment Section, Groveport, OH. http://www.epa.state.oh.us /portals/ 35/ documents/ qheimanualjune2006. pdf
Rankin, E. T., 1995. Habitat indices in water resource quality assessments. Pp. 181–208. In
Davis, W. S. & T. P. Simon (eds), Biological Assessment and Criteria. Lewis Publishers, Boca Raton, FL: 415.
Taylor, C. A. and G. A. Schuster. 2004. Crayfishes of Kentucky. Illinois Natural History Survey
Bulletin 28; 219 pp. Thoma, R. F. 2009. The conservation status of Cambarus (Puncticambarus) veteranus, Big
Sandy Crayfish; Cambarus (Jugicambarus) jezerinaci; Spiny Scale Crayfish; and Cambarus (Cambarus) sp. A; BlueRidge Crayfish. Final project report submitted to the Virginia Department of Game and Inland Fisheries. Pp. iv + 20.
Thoma, R. F. 2010. The conservation status of Cambarus (Puncticambarus) veteranus; Big
Sandy Crayfish and Cambarus (Jugicambarus) parvoculus; Mountain Midget Crayfish in Kentucky. Final project report submitted to the Kentucky Department of Fish and Wildlife Resources. Pp. iii + 9.
Welsh, S. A. and Z. J Loughman. 2014. Physical habitat and water quality correlates of crayfish
distributions in a mined watershed. Hydrobiologia 745: 85-96. DOI: 10.1007/s10750-014-2095-y