Calysto: Risk Management for Commercial Manned SpaceflightThe Calysto: Risk Management for...
105
Calysto: Risk Management for Commercial Manned Spaceflight by Gary Dillaman This thesis is submitted to the Gannon University graduate faculty in partial fulfillment for the degree Master of Science in Computer and Information Science. Option: Information Systems Approved: Theresa M. Vitolo, Ph.D. Advising Professor in Charge of Research Chair, Computer and Information Science Department Barry J. Brinkman, Ph.D. Committee Member Stephen T. Frezza, Ph.D. Committee Member Gannon University Erie, Pennsylvania 16541 May 2012 https://ntrs.nasa.gov/search.jsp?R=20120012512 2020-03-13T18:50:26+00:00Z
Transcript of Calysto: Risk Management for Commercial Manned SpaceflightThe Calysto: Risk Management for...

Calysto: Risk Management for
Commercial Manned
Spaceflight by
Gary Dillaman
This thesis is submitted to the Gannon University graduate faculty in
partial fulfillment for the degree Master of Science in Computer and Information Science.
Option: Information Systems
Approved:
Theresa M. Vitolo, Ph.D. Advising Professor in Charge of Research Chair, Computer and Information Science Department
Barry J. Brinkman, Ph.D. Committee Member
Stephen T. Frezza, Ph.D. Committee Member
Gannon University
Erie, Pennsylvania 16541
May 2012
https://ntrs.nasa.gov/search.jsp?R=20120012512 2020-03-13T18:50:26+00:00Z

Page ii
Acknowledgements
I would like to thank Mariane Colon Zambrana and Matthew Zbin for aide in requirements
gathering and development of the first rendition of the Risk Management Tool used in this study. The
previous work they have done contributed to the groundwork of follow up edition of the Risk Management
Tool, Calysto. Thanks for Anthony Smith for being the project champion of the Calysto, as identifying a
champion directed the Calysto project towards the end product. I would also like to thank my committee
members, Dr. Theresa M. Vitolo, Dr. Barry J. Brinkman, and Dr. Stephen T. Frezza for the aide in the
development of the study.
Gary Dillaman

Page iii
Table of Contents
Acknowledgements .............................................................................................................................. ii
Abstract ................................................................................................................................................ v
1. Introduction .................................................................................................................................. 1
1.1. Overview............................................................................................................................... 1
1.2. Curriculum Scope ................................................................................................................. 3
1.3. Project Management Plan .................................................................................................... 4
2. Survey of the Literature ................................................................................................................ 7
2.1. Literature Perspective .......................................................................................................... 7
2.2. Fundamental Literature ..................................................................................................... 12
2.2.1. Risk Review Board ...................................................................................................... 12
2.2.2. Identify Potential Risks ............................................................................................... 13
2.2.3. Measure Frequency and Severity ............................................................................... 15
2.2.4. Examine Alternative Solutions ................................................................................... 15
2.2.5. Decide Which Solution to Use and Implement .......................................................... 16
2.2.6. Monitor Results .......................................................................................................... 17
2.3. Literature Summary ........................................................................................................... 18
3. NASA Risk Management Methodology ....................................................................................... 19
3.0. Risk Management Perspective ........................................................................................... 19
3.1. Fundamental Risk Management ........................................................................................ 23
3.1.1. Data to Capture for a Risk .......................................................................................... 23
3.1.2. Method of Collecting Risk Data .................................................................................. 26
3.1.3. Reporting Risk Data .................................................................................................... 26
3.1.4. Communicating Risk Data Across Organizations ........................................................ 28
3.2. Summary ............................................................................................................................ 29
4. Methodology of Analysis ............................................................................................................ 31
4.0. Introduction ........................................................................................................................ 31
4.1. Objectives of the Analysis .................................................................................................. 31
4.2. Methodology Application ................................................................................................... 32
Page iv
4.2.1. Manual ........................................................................................................................ 33
4.2.2. Automatic ................................................................................................................... 33
4.2.3. Hybrid ......................................................................................................................... 33
4.3. Statement of Analysis Scope .............................................................................................. 34
4.4. Methodology Challenges .................................................................................................... 35
5. Results of Analysis ....................................................................................................................... 36
5.0. Findings - Manual Approach .............................................................................................. 36
5.1. Findings - Automatic Approach .......................................................................................... 37
Experiment 1 ............................................................................................................................... 41
Experiment 2 ............................................................................................................................... 42
5.2. Findings - Hybrid Approach ................................................................................................ 43
6. Discussion .................................................................................................................................... 45
6.1. Discussion - Manual Approach ........................................................................................... 45
6.2. Discussion - Automatic Approach ...................................................................................... 46
6.3. Discussion - Hybrid Approach ............................................................................................ 48
6.4. Discussion - Benefits of SharePoint .................................................................................... 49
7. Conclusion ................................................................................................................................... 51
Works Cited ........................................................................................................................................ 53
Appendix A: Glossary .......................................................................................................................... 54
Appendix B: Project File Repository Definitions ................................................................................ 55
Appendix C: Calysto System Requirements Specification .................................................................. 56
Appendix D: Calysto System Design Document ................................................................................. 63

Page v
Abstract
The Calysto: Risk Management for Commercial Manned Spaceflight study analyzes risk
management in large enterprises and how to effectively communicate risks across organizations. The
Calysto Risk Management tool developed by NASA's Kennedy Space Center's SharePoint team is used and
referenced throughout the study. Calysto is a web-base tool built on Microsoft's SharePoint platform. The
risk management process at NASA is examined and incorporated in the study. Using risk management
standards from industry and specific organizations at the Kennedy Space Center, three methods of
communicating and elevating risk are examined. Each method describes details of the effectiveness and
plausibility of using the method in the Calysto Risk Management Tool. At the end of the study suggestions
are made for future renditions of Calysto.

Page vi
List of Figures
FIGURE 1: Risk Management Process ........................................................................................................ 8
FIGURE 2: 5x5 Risk Matrix ......................................................................................................................... 9
FIGURE 3: Ames Research Center Consequence Chart (Risk Scorecard) [7] ........................................... 14
FIGURE 4: Calysto SharePoint Site Hierarchy .......................................................................................... 21
FIGURE 5: GSFC Risk Management Consequence Chart and Legend ...................................................... 24
FIGURE 6: ARC Risk Management Consequence Chart ........................................................................... 25
FIGURE 7: 3x3 Risk Matrix ....................................................................................................................... 26
FIGURE 8: Components of a Risk Statement ........................................................................................... 28
FIGURE 9: Organizational Hierarchy ........................................................................................................ 39
FIGURE 10: Experiment 1 Risk Matrix ....................................................................................................... 41
FIGURE 11: Experiment 2 Risk Matrix ....................................................................................................... 42
FIGURE 12: Risk Rollup .............................................................................................................................. 46
FIGURE 13: Automatic Approach Configuration ....................................................................................... 47
FIGURE 14: Relation Edit Form .................................................................................................................. 48
FIGURE 15: Hybrid Risk Rollup ................................................................................................................... 49

Page vii
List of Tables
TABLE 1: Risk Fields .................................................................................................................................... 11
TABLE 2: Example Consequence Mapping................................................................................................. 38
TABLE 3: C&I (Communications and Imagery) Project Mapping ............................................................... 39
TABLE 4: IT-F Branch (Project Management Office) Mapping ................................................................... 40
TABLE 5: IT (Information Technology) Directorate Mapping..................................................................... 40
TABLE 6: Experiment 1 Table ..................................................................................................................... 41
TABLE 7: Experiment 2 Table ..................................................................................................................... 42

1. Introduction
1.1. Overview
Risk management is a key to success and needs to be acknowledged in any size of project. In
industries where large amounts of funding and lives are at risk, there is a need to pay close attention to
all known risks and identify unknown risks. If a risk surfaces during a project, the phase and method
identified needs to be acknowledged for reference in future endeavors. The more data collected about
a risk, the easier it is to properly mitigate and prevent from reoccurring in similar projects.
The National Aeronautics and Space Administration’s (NASA) Kennedy Space Center (KSC)
engages risk management at multiple organizational levels. Risk review boards are set up at each level in
the organizational hierarchy and each may have different methodologies of identifying, analyzing and
mitigating risks. When a risk is perceived to have a high consequence and likelihood of occurring, the
risk is presented to the group’s leadership. Each level of leadership determines a risk’s consequence
and likelihood based off a predetermined standard created by the risk review board. An approach of
automation and consistency is needed to accurately track and determine the mitigation of a known risk.
Multiple risk management systems are currently used at NASA and KSC deployed by commercial
providers or developed internally to the organizations. In an effort to standardize risk management
systems at NASA and KSC, a risk management tool dubbed Calysto was developed on top of the
Microsoft SharePoint platform written in C# with Visual Studio 2008. The Calysto name was chosen as a
misspelling of the Callisto moon of the planet Jupiter to tie in the application to NASA's mission of space
exploration. The Calysto Risk Management Tool was developed to answer the question of how to
effectively manage risks at the enterprise level with early identification for high visibility to the
organizations leadership.

Each organization at NASA and KSC scores risks differently using a “Risk Scorecard”. At a lower
level organization or a project, a method should exist to accurately roll the risk data up the
organizational hierarchy. Converting a project risk to a NASA center risk automatically can be
accomplished through an algorithm; however, the final decision to rollup a risk should be done by a risk
review board. The visibility produced by Calysto Risk Management Tool allows for the number of
uncertainties, potential hazards, and pitfalls to be brought to attention quicker to reduce budget, time
spent and potentially save lives.
The goal of the proceeding study is to develop a standard methodology of risk management
utilizing a web-based approach. Current standards exist in risk management commercially and the
methodologies have been adopted partially at NASA and KSC. NASA provides an agency directive for the
requirements of risk management in the NASA Procedural Requirements document numbered 8000.4A
[1]. The requirements outlined in 8000.4A are for all levels of the agency, including programs and
projects, but does not specify the tool to manage risks. Building on the agency directive and applicable
center directives, standard risk management software is to be built with an easy to use graphical user
interface allowing derived from NASA leadership policies and industry standards. Utilizing the Calysto
software, the organizations at NASA can share similar risk data amongst each other, allowing for
visibility for similar circumstances and the lessons learned during the mitigation process. Using the agile
approach of software project management, portions of the Calysto software are to be released to the
production environment allowing feedback from users to be incorporated in the next iteration of the
software. The Calysto project will be in a continuous phase of development and release at NASA and
KSC to allow the users to be provided the tools they need to successfully manage risks as the needs for
features are produced.

1.2. Curriculum Scope
Developing a standard methodology for risk management encompasses proficiency in risk
management procedures and the development of automation tools written for a web-based medium.
The Calysto software will be the custom automation tool produced in this study and allow for a central
location for multiple organizations to manage risks across an agency or business. The tools used
consisted of the Microsoft SharePoint platform and custom developed code written in the C# language
via Microsoft Visual Studio.
Throughout my academic studies, I have focused primarily on computer science and
management. The two academic tracts allow for a correlation in this study allowing for use of
management methodologies to produce a detailed application consisting of industry standards in both
software development and risk management. Developing the Calysto Risk Management Tool has
brought attention to the need for effective project management. Software engineering needs project
management to deliver a successful project. There are a variety of project management methods to be
chosen when developing software and one is needed to be selected and maintained to produce a
product at an efficient and effective pace.
The Calysto project aligns with Gannon University's Computer and Information Science graduate
program at the documentation, project management and software development levels. An important
part of the Calysto project is to accurately capture requirements and make the transformation to a
software product. The Calysto tool is designed to add a valued contribution to the aerospace industry
by effectively managing risks through the careful design of the product.
The role taken in developing the Calysto software was not only as the software developer, but
also a project manager and business analyst. As a student in the Computer and Information Science

department at Gannon University, each role was covered in the classroom and labs. I focused primarily
on the software development aspect while at Gannon, but both the project management and business
analyst studies have proven to be a vital asset in this study and my career.
The roles of software developer, project manager and business analyst are usually broken up in
an organization with three different individuals. The KSC SharePoint team is a small group, and the
resources did not exist for the Calysto project. While in the business analyst role, I was required to
obtain requirements from the customer and prospective end users. Transferring the requirements
primarily from discussions to a formalized baseline document was the pivotal step in the project's
lifecycle. As discussions with the customer progressed, the document was modified multiple times to
encompass the new changes. To facilitate the expanding scope creep, the Scrum software development
methodology was introduced into the project. Utilizing Scrum, iterative versions of the product was
introduced into the production environment, giving the user the tools they needed at quick pace while
developing the nice to have features as time progressed.
1.3. Project Management Plan
The primary approach of development of this project was with the use of Microsoft SharePoint.
Used both as a development platform for the product produced and as the project management tool to
track progress throughout the project. SharePoint offers the flexibility needed for rapidly developing a
custom tool to be used for a large user base as well as document management and collaboration
amongst a group of individuals.
From the start of the Calysto Risk Management Tool project, there was no project champion
identified for the software. There was a need for the product but no individual was immediately
identified as a leader of the project. As the development schedule allowed, pieces of the product were

put together at a slow pace. As time progressed, a strong alpha version of the project was developed
and a demonstration was given to IT leadership at NASA's Kennedy Space Center (KSC). Immediately
leadership realized the value of the project and assigned a champion in the form of the leader of the IT
Risk Management Team, Anthony Smith. With Smith's knowledge of the current manual risk
management process for the IT organization, he provides valuable insight on how the tool should work
from an end user's perspective.
Smith was selected by the KSC Chief Information Officer, Michael Bolger, to represent the IT
organization for the Center Risk Management Working Group (CRMWG) at KSC. He is the leader of the
IT risk review board, managing risks throughout the organization. Smith holds a Bachelor's degree in
Electrical Engineering and a Master's degree in Engineering Management. Working in the front office of
the IT department at KSC, smith is involved in a variety of IT projects and their lifecycle.
Working with Smith, his experience with how risks are analyzed, mitigated, and presented
throughout the organization offer valuable insight. Smith's insight allows an end user to be more
involved in the development of the product to be delivered. Now with a champion for the product and
a high demand, the project jumped to the top of the priority list and was subsequently delivered using
the scrum approach of application development.
When a champion was identified, the project gained a driving factor to deliver a fully functional
solution in a timely manner. During the development, ideas for the tool have been proposed from the
KSC IT Risk Management Team to add functionality and make modifications to features of the system.
At the KSC IT organizational level the customer’s satisfaction was won and given the approval to reach
out to other organizations in the enterprise to assist with their risk management needs. The IT
champion is to remain in close contact to help facilitate discussions and modifications with new
customers of the Calysto Risk Management Tool.

Using SharePoint as the project management tool allowed for collaboration with internal KSC
SharePoint team members to review the progress, execute store testing procedures and schedule
meetings and demonstrations. The customer was giving access to sections of the project management
SharePoint site to review the schedule of completed release and to access demonstration materials in
the form of Microsoft PowerPoint slides as well as release notes. A challenge of sharing information and
knowledge was overcome by use of the project collaboration portal allowing a central location to store
shared documents and lists of applicable data.

2. Survey of the Literature
2.1. Literature Perspective
Risk management plays a part in near all industries and fields. Most tasks involve some level of risk. If
there is no risk, the reward for completing the task may be minimally beneficial. With the advancement
of science and technology, new theories are produced with actions involving substantial risk. The field
of risk management involves a methodology to assess, mitigate, and evaluate known risks.
Implementing risk management for a project incorporates risk reducing measures to balance the
operational and economic costs of protective measures [2]. The five main components of risk
management identified in the ClearRisk whitepaper [3] and used in this study are:
Identify Potential Risks
Measure Frequency and Severity
Examine Alternative Solutions
Decide Which Solution to Use and Implement It
Monitor Results.
Each component is further examined later in this chapter (See Figure 1: Risk Management Process)

FIGURE 1: Risk Management Process
Risk Management is the "coordinated activities to direct and control an organization with regard
to risk" [4]. A risk is composed of the uncertainty on objectives where the objectives can have different
aspects and can apply at different levels of an organization [4]. The risk is expressed with a combination
of consequences and the likelihood of the risk to occur. Consequences of the risk to occur are
determined to be applicable by the organization performing risk management.
Depending on the level of detail, or granularity an organization would like to track about a risk, a
variety of risk matrices are available for use. A risk matrix is the tool used to rank and display risks by
defining ranges for consequence and likelihood [4]. The standard risk matrix is a 5x5 table ranging from
low to high risk with green cells depicting a low risk, yellow a medium risk and red a high risk. (See
FIGURE 2: 5x5 Risk Matrix) Some may choose a less granular approach by using a 3x3 risk matrix. The
same color representations exist, but the number of possible combinations is substantially reduced from
25 in the 5x5 matrix to 9 in the 3x3 matrix.

FIGURE 2: 5x5 Risk Matrix
Information tracked for a risk can vary within different organizations. Table 1: Risk Fields is an
example of the data collected for an individual risk. The data is reviewed frequently and updated to
present in risk review board meetings. The data is typically tracked to note modifications of previous
versions.

Field Description
Project Project abbreviation
Risk Title Enter a short descriptive title about the risk
Originator
Originator Dept Code The initiator's department code
Origination Date The date the risk was initiated
Risk Statement Enter Risk Statement which provides a description of the condition and consequence: Given the condition (state condition) there is a possibility that (state Consequence)
Risk Context Enter Risk Context Statement - A detailed description of the risk
Likelihood Assessment of the likelihood of occurrence - 1 - Very Low (Occurrence is very unlikely: ≤ 5%) 2 - Low (Occurrence is unlikely: > 5% - ≤ 25%) 3 - Moderate (Occurrence is likely: >25% - ≤ 50%) 4 - High (Occurrence is very likely: > 50% - ≤ 75%) 5 - Very High (Occurrence is almost certain: > 75%)
Consequence - Technical Impact (0 - None, 1 - Very Low, 5 - Very High)
Consequence - Schedule Impact (0 - None, 1 - Very Low, 5 - Very High)
Consequence - Cost Impact (0 - None, 1 - Very Low, 5 - Very High)
Consequence - Management Impact (0 - None, 1 - Very Low, 5 - Very High)
Consequence – Safety Impact (0 - None, 1 - Very Low, 5 - Very High)
Timeframe The timeframe indicates the level of urgency for action to be taken on the risk. It is up to the subsystem to determine the timeframe.
Cost of Consequence Enter the estimated cost ($) of the consequence if the risk is not addressed (if applicable)
Mitigation/Approach Overview Enter a brief description of how the risk will be handled, resolved or minimized
Fallback Contingency Plan
Enter the details (if applicable) of how the risk will be resolved or minimized should the initial plans fail or prove insufficient.
Mitigation Tasks This field provides the task(s) that are / or will be implemented for the mitigation plan. Enter a date (mm/dd/yy) for each mitigation task.

Risk Owner
Risk Owner Org Organization that owns the Risk
Status Risk Planning Approach
Enter the current status of the risk if known
Status Report Text summary of current status
Estimated Completion Date (ECD)
The Estimated Completion Date (ECD) is the date that the risk is expected to be closed.
Rationale The closure rationale is provided when the status of the risk is changed to closed, rejected, or accepted.
Actual Completion Date (ACD) The Actual Completion Date is the date when the risk is closed or accepted.
TABLE 1: Risk Fields
Risk management can be incorporated into each phase of a project's cycle [2]. Assessing and
mitigating risks in a project will allow for a greater chance of success. The activity of the project is the
main focus of risk management. However, the stakeholders and future projects are also affected both in
the short term and long term. Risk management is primarily management's responsibility [5].
Management will delegate to their subordinates the findings from a risk management review board.

2.2. Fundamental Literature
2.2.1. Risk Review Board
The risk management review board can be set up at each organizational level to determine the
suitability, adequacy and effectiveness of the subject matter to achieve established objectives. Through
review boards, the determined risk is communicated to internal and external stakeholders by providing
information regarding the current state of risk [4]. The risk review board has the responsibility of
determining the strategic direction for the organization [5]. The board should be privy to all
organizational standards and procedures for the risk management process. By determining high level
strategies, the risk review board may relay information to individuals responsible for implementation
the necessary tasks to mitigate the risk.
Each business unit involved in the risk should be represented during the risk review board
meetings to appropriately filter information down to subordinates. Meetings should occur regularly
amongst representatives to accurately track progress. Risk management should not occur only at board
meetings, but through the individual project's lifecycle on a daily basis [5].
During a risk review board meeting all members of the meeting will be properly identified with
their association to corresponding risks. The meetings are typically run by a risk manager designated for
the organization. New and updated risks are brought to the group and discussed in detail. Any items
changed since the last meeting will be denoted for clarification.

2.2.2. Identify Potential Risks
Identifying a potential risk is the first step to effective risk management [3]. Each organization
may have distinct categories of risks and will typically produce a tailored risk scorecard. A risk scorecard,
or consequence chart, is a "relationship between risk levels and their corresponding attribute ranges"
[7]. The scorecard can be used to gauge new projects against a predetermined set of consequences.
Using numerical values and ranges, the level of likelihood and consequence can be standardized across
all risks [7]. FIGURE 3: Ames Research Center Consequence Chart shows an example of the likelihood
and consequences ranges used at the center. Established organizations have a history of past projects
and it will be easier to identify common risks compared to a new organization or new type of project.
Risks evolve over the course a project's lifecycle, and this is why it is imperative to engage in the
risk management process throughout the project's lifetime. New, previously unknown, risks may
surface causing unforeseen circumstances. With proper identification, the risk the can be carefully
tracked and mitigated accordingly.

FIGURE 3: Ames Research Center Consequence Chart (Risk Scorecard) [7]

2.2.3. Measure Frequency and Severity
The second step of the risk management process, Measure Frequency and Severity, involves
categorizing and prioritizing risks [3]. Using the organization's scorecard, or consequence chart, the
likelihood (frequency) and consequence (severity) attributes will be assigned. Determining the
attributes will prioritize the risk amongst the existing risks for the organization. Once the likelihood and
consequence attributes have been properly mapped for a risk, the individual risk is rank by the product.
The product for a risk is used to determine the rank of the risk. To calculate the product, the
likelihood is multiplied by the highest consequence. In a 5x5 risk matrix, the highest product can be 25.
Using a 3x3 risk matrix, the highest product can be 9. Each organization may have multiple
consequences and there is no minimum or maximum. The product calculation handles for the
differences in the number of consequences for an organization.
Once a risk has been properly identified and measured, it can be placed on an overview report
for the organization. The overview report displays the risk in relation to other organizational risks. There
are different routes to portray this information to stakeholders and one common way is to sum the
number of risks for a given cell in the risk matrix. The resulting report is displayed in Appendix D,
FIGURE 15: Risk Overview Web Part.
2.2.4. Examine Alternative Solutions
The next step of the risk management process is to examine alternative solutions [3]. An
organization can incorporate a risk list to help determine priority in examination. The risk list will give a
high level view on the organizations risks with the items with the greatest risk appearing at the top of
the list. The risk review board will analyze each risk and prepare for a solution. During the review stage,
the review board takes into account solutions similar to the following:

Reject - the risk should not be categorized as a risk at the current organizational level.
Watch - keep track of and monitor the risk.
Accept - no further action is taking. The risk is accepted and work is to continue.
Mitigate - take actions to reduce risk.
Research - determine solutions to reduce risk.
Transfer - reassign ownership of the risk to a different organization.
Close - the risk was successfully mitigated and/or did not occur. The risk poses no further
consequence.
When determining options for solutions of a risk, the goals and mission of the organization should be
carefully considered [2].
2.2.5. Decide Which Solution to Use and Implement
After the alternative solutions to a risk have been examined, the solution is chosen and
implemented in the next step of the risk management process. Multiple challenges may be present
during implementation phase due to:
Funding - most initiatives require funding to support the solution.
Management support - senior management and stakeholders will need to approve the solution.
Training - support personnel need to be properly trained to execute the selected solution.
[3]
Once the decision is made, taking into account the above challenges, the team responsible for the
project is approved to implement the solution. Depending on the solution, no additional action may be
needed and the project team is to continue work as originally planned. Each risk has its unique

characteristics. However, previous mitigation strategies are taken into account in this phase to utilize
previously successful implementations.
2.2.6. Monitor Results
As a project continues throughout its lifecycle, the project should be continuously monitored for
risk. The risk management process does not have a definitive end time during a project other than the
end of the actual project. The fifth step of the risk management process is not the end of the process,
but a step to allow the repetitive risk management process to begin from the start.
During new project development, past projects data is collected and analyzed to determine
similarities in risk characteristics. Setting up a continuous risk monitoring process for data sets to be
collected and used in the future. By incorporating regular audits and reviews for policy and standards
compliance, opportunities for improvement will become present [5].
During the monitoring phase, the more data collected for a risk, the better the organization will
be prepared for future occurrences [3]. Similar to the dynamic nature of an organization and its
environment, risks can be constantly changing and the appropriate attention should be required. All
personnel involved in a risk need to carefully understand and follow procedures of the organization to
provide the proper assurance all aspects are accounted for in the process [5].

2.3. Literature Summary
Risk management can have many different meanings across organizations. However, as long as
the organization complies with the agreed upon risk management process, effective risk management
can occur. ISO GUIDE describes the risk management process as the “systematic application of
management policies, procedures and practices to the activities of communicating, consulting,
establishing the context, and identifying, analyzing, evaluating, treating, monitoring and review risk” [5].
The five phase process of risk management described in this chapter reflects one example of an
approach to risk management and complies with the ISO standards.
Effective risk management allows an organization to save money, people, income, property,
assets and time [3]. All organizations, large and small, should engage in risk management to circumvent
any potential threat. Much like an organization, risk management is dynamic in nature and should be
adjusted with the organization. Organizational policies should be examined regularly to reflect the
updates to the risk management process.

3. NASA Risk Management Methodology
3.0. Risk Management Perspective
The risk management process is performed by all NASA centers across the United States.
Agency guidelines dictate the proper procedures to effectively manage risks. Each center derives each of
their methodologies based off the Agency guidelines. There is general conformity to procedures;
however some alterations in the methods of managing risks are seen across centers. Different centers
and their organizations use different tools to capture and report upon risk data. The tools used to
capture data consist of; a manual process use Microsoft Office products, commercial applications and
custom in house developed applications. With the different routes taken to collect and manage risks, a
risk collected at one center may be perceived differently at another center.
NASA’s Kennedy Space Center Information Technology directorate developed a simple, but
effective risk management tool using Microsoft SharePoint lists, built-in and custom reporting tools.
SharePoint lists can be considered a table in a database or spreadsheet. The lists are stored in web-
based system allowing a central location for multiple users to access and update data without copies of
the data transferring ownership via email with no known authoritative source. Using lists in SharePoint
allows quick customization of form fields without the need to write code to handle the read and write
methods for a data source. Built in reporting tools for SharePoint lists come in the form of “views”; the
views are displayed in a tabular format with the column headings on the first row and a row with
corresponding values for the headings for each record. In a view, columns can be sorted, filtered,
ordered and toggle visibility.
A conceptual application can be built with relative ease given proper requirements and a
knowledgeable SharePoint designer resource. On top of the built-in features, two custom reports were
developed using XML and an XSL style sheet for the first iteration of KSC's risk management tool. The
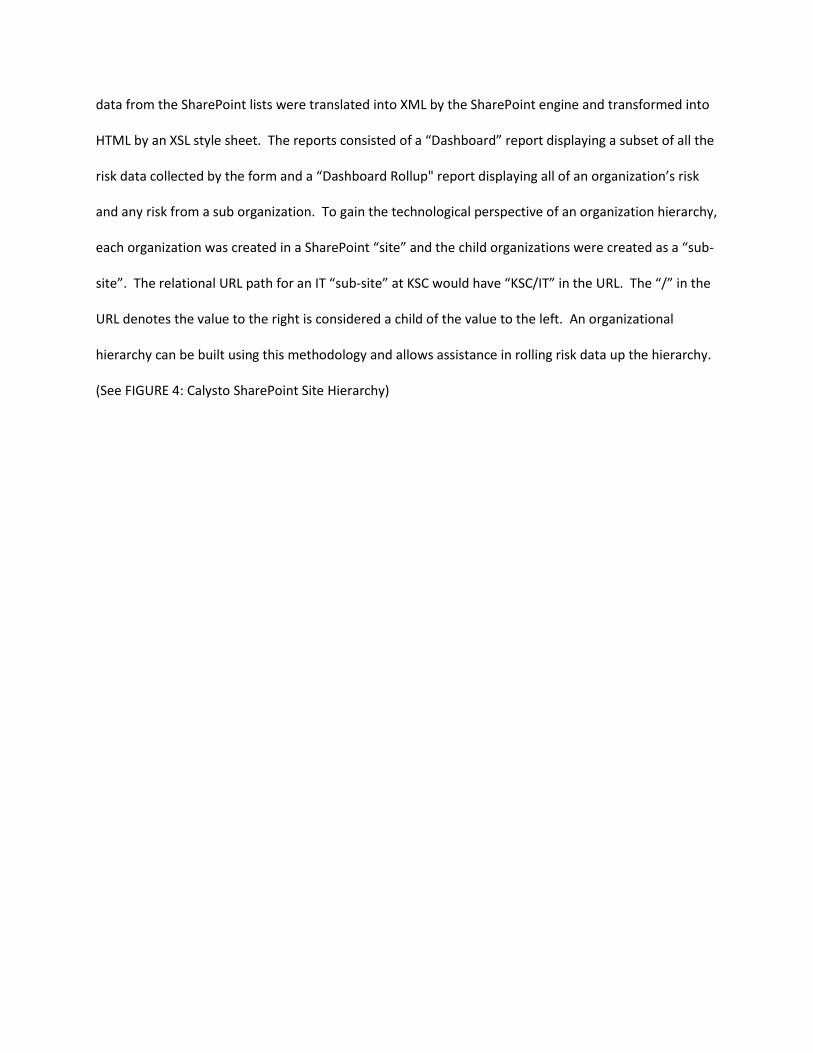
data from the SharePoint lists were translated into XML by the SharePoint engine and transformed into
HTML by an XSL style sheet. The reports consisted of a “Dashboard” report displaying a subset of all the
risk data collected by the form and a “Dashboard Rollup" report displaying all of an organization’s risk
and any risk from a sub organization. To gain the technological perspective of an organization hierarchy,
each organization was created in a SharePoint “site” and the child organizations were created as a “sub-
site”. The relational URL path for an IT “sub-site” at KSC would have “KSC/IT” in the URL. The “/” in the
URL denotes the value to the right is considered a child of the value to the left. An organizational
hierarchy can be built using this methodology and allows assistance in rolling risk data up the hierarchy.
(See FIGURE 4: Calysto SharePoint Site Hierarchy)

FIGURE 4: Calysto SharePoint Site Hierarchy
The concept for KSC’s risk management tool was originally built in less than a month, giving the
IT directorate a method to store their information effectively and to allow a level of sharing data
previously unknown. Immediately upon using the tool for live risk data, shortcomings of the tool were
identified. SharePoint's built-in reporting tools created a technical limitation of setting a limit of 15
organization units to a single report. The report would render properly at a lower organization level
when a small amount of projects would be included in the rollup view. However, at the higher levels of
an organization, the reports recursively rolled up risk data and obtained the maximum SharePoint data

sources on the page. With the rapid acceptance of the tool across the directorate and the increasing
number of organizations utilizing the tool, the need existed for a scalable solution.
Aside from the technical limitations identified, the business logic in the risk management tool
did not effectively capture the needs of organizations managing risks. At the center organization level at
NASA, the perception of a risk in one organization can be different if viewed by an individual or group at
a higher level of the organization or across organizations. The main issue in this study of risk
management is how to effectively gain visibility of a risk across all organizational levels with a continuity
of the relationship against the level and probability of risk. With manual processes, the owner of a risk
(a person or an organization) must present or send out risk reports to gain the visibility of parent
organizations or other organizations at the center. As part of the Calysto project, an electronic process
was conceived to assist in the “rollup” (i.e. making the risk visible to parent organizations) process.
The issue identified is part of the risk review process allowing for assistance in high profile
decision making by upper management and individuals with experience in properly mitigating risks. The
manual process can be considered a “pull” method of transferring information. The risk owner must
initiate the process using multiple mediums to address the risk to the proper audience. Once the risk
has been documented or noted, the risk owner needs to either be physically involved in a risk review
board meeting or be sure to send a presentation to the appropriate individual. Incorporating an
automated method, or “push” method, once a risk has been documented or noted, will automatically
broadcast the risk to the proper audience.
An automated conversion was originally proposed by the SharePoint development team during
the design phase to be built into the Calysto Risk Management Tool. The conversion was designed to
track the magnitude of the differences in numerical fields when escalating a risk up the organizational
hierarchy. Without a complex conversion algorithm written in the Calysto tool, the risk posed to gain no

visibility at a center if it was generated at a lower project level. The loss of translation would ultimately
occur upon factoring the loss of severity during escalation. As a risk traverses up throughout the
organizational hierarchy, likelihood and consequence mappings would automatically reduced the
attribute's level at each organization. If a risk was five levels deep in the hierarchy and at each
organizational level the attribute (likelihood and consequence fields) mapping is set to reduce the value
by one, the likelihood and/or consequence fields could automatically be set to zero or possibly negative
values. A risk with a likelihood value of five and highest consequence value of five, distinguishing a high
risk, could ultimately reduce the risk to zero. See section 5.2 Findings - Automatic Approach for a
detailed analysis of the automatic approach.
3.1. Fundamental Risk Management
3.1.1. Data to Capture for a Risk
Standard sets of data are to be collected for a risk at each organizational level. The required
fields will vary at each NASA center; however the fields should be shared across all organizations at the
local center. The Likelihood and Consequence of a risk are standard attributes to a risk. Depending on
the Risk Matrix (3x3 or 5x5) for a center, the Likelihood will be a value of 1-3 (or 1-5) and the
Consequence will be a value of 0-3 (or 0-5). The criticality of a risk is determined by the location of the
Likelihood and the highest Consequence on a 3x3 or 5x5 risk matrix. (See FIGURE 5: GSFC Risk
Management Consequence Chart and Legend) Goddard Space Flight Center [6], similar to most NASA
centers, utilizes the 5x5 risk matrix with four consequence categories (consequence categories and their
definitions vary across centers). The Consequence Chart and Legend is used as a reference for the
values the risk owner is to assign to the Likelihood and Consequence.

FIGURE 5: GSFC Risk Management Consequence Chart and Legend
NASA's Ames Research Center (ARC) utilizes the 5x5 risk matrix as stated in NASA Procedural
Requirements 8000.4 and 8621.1 [7]. The consequence categories vary from GSFC, however the
assigned attribute range for Likelihood and Consequence remain the same since both are using the 5x5
risk matrix. (See FIGURE 6: ARC Risk Management Consequence Chart) Throughout the agency, the 5x5
risk matrix is a standard, with limited deviations. The Commercial Crew Program deviates from the
NASA standard and uses a 3x3 risk matrix (See FIGURE 7: ARC Risk Management Consequence Chart)
to assign the level of risk in the range of none (0), low (1), medium (2), and high (3).

FIGURE 6: ARC Risk Management Consequence Chart

FIGURE 7: 3x3 Risk Matrix
3.1.2. Method of Collecting Risk Data
The methods used to collect risk data is standard across the NASA enterprise; however the tools
used to the collect the data are at the discretion of the center, program or project. NASA Program and
Project Management Processes and Requirements 7120.5 states "The program or project manager shall
apply risk management principles as a decision-making tool which enables programmatic and technical
success" [8]. The majority of tools used across centers are manual methods of data input consisting of
Microsoft Office products Word, Excel and PowerPoint. The margin of error and lack of version control
are both major issues with using only Microsoft Office products for risk management. Different
programs and projects have developed their own custom applications, primarily written in Microsoft
Access; however, some have purchased third-party tools. Ames Research Center has employed a Risk
Management tool built on Microsoft SharePoint and Microsoft Project Server similar to the first iteration
of KSC’s tool. The Calysto Risk Management Tool is the first deployable SharePoint implementation
written primarily in C# for the agency.
3.1.3. Reporting Risk Data

Risk Management reporting standards are shared across the agency and each
center/program/project reports on similar fields. As stated in the Goddard Technical Standard for Risk
Management Reporting [6], the key data fields to be reported for risks are:
Rank based on criticality to the project
ID number
Criticality
Trend
Risk Statement
Approach and Plan
Current Status
Estimated closure
The terms used for the reported fields may vary; however the definitions are consistent. The list does
not encompass all fields collected for a risk; however it gives management a snapshot of a list of risks
displayed in the report. The ranking system, based on criticality, displays the records with the highest
level of risk at the top of the report. Each program or project may choose to add additional fields and
displays when reporting risks. All implementations will use a risk statement. To clarify why a risk exists,
a risk statement is used with a construct to allow the reader of the risk to understand the situation [6].
(See FIGURE 8: Components of a Risk Statement)

FIGURE 8: Components of a Risk Statement
The goal of the Calysto risk management tool is to standardize reports across all organizations.
With the “rollup” functionality in Calysto, reporting against the same fields and format offers continuity
when working with another organization. The scalability offered in Calysto allows for reports to be
created and stored in one location; when an update is needed for the report, a change is made once and
replicated to all organizational sites. The previous iteration of the Risk Management Too (RMT) required
reports to be updated in each organizational site. The reports are relatively static in the Calysto RMT
and will only require updates when standards are changed for risk reporting.
3.1.4. Communicating Risk Data Across Organizations
The Risk Management Board (RMB) for an organization is responsible for properly
communicating risks to other organizational elements. A RMB is typically set up at each organizational
level reviewing projects below the organization. Board reviews take place approximately every quarter

to review new and existing risks. If a risk is posed to impact additional organizations, the decision will be
made to communicate and escalate the risk to the organization(s) independent RMB [7]. During the
board reviews, each risk is analyzed and the scope is examined. All organizations involved in the risk are
properly notified and the corresponding information about the risk is shared in detail. If the risk affects
sibling organizations (organizations at the same level in hierarchy with the same parent organization),
the risk will be escalated to the parent organizations risk review board. If the risk affects the parent
organization's siblings, the risk will again be escalated to the next level's risk review board.
The decision to escalate a risk is a manual process based upon discussions referencing the
associated data for a risk. The method for transferring the knowledge of the risk to another RMB is also
a manual method using today’s technological standard for reporting (Microsoft PowerPoint
presentations). The Calysto RMT is designed to automatically assign a risk to RMB allowing for ease of
escalation. The "rollup" feature aids and speeds up the escalation process allowing for high visibility in a
near instantaneous procedure previously taking hours and possibly multiple days' worth of work.
3.2. Summary
Risk management is performed differently at each organizational at NASA with some common
characteristics. The method for entering data widely consists of a manual process with most
organizations understanding the need for aide in automation. There will always be a need for human
interaction when assessing risks. By adding standardization and automation, the identification and
mitigation of risks can occur at a faster pace with consistency. Using a tool similar to Calysto can help
the data input and reporting aspect of the risk management process.
Communication is the key to successful risk management. The risk owners must properly
communicate the risk to their pertinent risk review boards and the boards must determine to escalate
the risk and associate external entities to assess and mitigate the risk. Assistance with automating the

communication by means of a central location (Calysto) will speed up the risk management lifecycle and
allow for quick assessment and mitigation of a risk.

4. Methodology of Analysis
4.0. Introduction
To examine communicating risk data up an organizational hierarchy, three methods to
"rollup"/escalate data both programmatically and manually were analyzed. The effectiveness of each
method was assessed to determine the method to be incorporated into the Calysto Risk Management
Tool. The three approaches are categorized as: manual, automatic and hybrid. Within each method
used, human factors played a decisive role in regards to configuration or the ultimate decision to
escalate a risk. Each risk is unique; however there can be similarities in methods of mitigation and
determination of the level of both likelihood and consequence while a risk moves recursively up an
organization to the enterprise level.
Different routes to achieve escalation could be used, and the three examined were picked based
on the goals of simplicity and effectiveness. The end user should take minimal steps to perform the
escalation process. The escalation should be real time without the need for batch processing or any
waiting period. The automation of escalating risk data comes with shortcomings and poses to be a
unique process. To make a risk visible to the largest audience, when needed, is a reoccurring scenario.
Using current business processes and available technology, an automated process is to be examined.
4.1. Objectives of the Analysis
The objective of the research was to determine the most effective route for escalating an
individual risk up the organizational hierarchy. Each method poses advantages and disadvantages. The
research was to determine the shortcomings and the strengths for the methods. With the qualitative
data, the best route was determined and incorporated into the Calysto tool. Real world user scenarios
were used to determine how and when a risk should be escalated up the hierarchy.
In addition to the user scenarios, a survey was answered by users of Calysto to determine the
effectiveness of communicating risks. The survey was be a final measure of determining the proper
methodology, but gave insight on the how the user base portrays the rollup process as both an
electronic form (Calysto) and as a business process. The data collected added value to each of the three
methods, allowing for the end user audience to be incorporated into the study. Additional questions
were fielded to ask the users how they portray the escalation process if it were to be automated.
The research question involves streamlining a manual business process with the use of the
Calysto tool and the objective of the process to efficiently mitigate risks cannot be diminished. There
was the possibility of disconnection to the end result of the proper mitigation of a risk with an
automated process versus a manual process. This study is to determine what the best combination of
the methods is and how to determine the visibility level of a known risk to the parent level of an
organization recursively.
4.2. Methodology Application
The three methods of rolling a risk of the organizational hierarchy consist of: using a flag to mark
the risk to be rolled up to the top level of the organization (manual), using a mapping to determine the
relationship of likelihood and level of consequence across organizations (automatic) and selecting the
organizational level to rollup the risk (hybrid). The three methods vary with level of user input and will
effectively produce similar output. The output is the determining factor on the proper method to
escalate a risk. If there is a substantial loss of the level of severity, the method may not be the best
choice to properly elevate a risk. Each method used the same risk attributes as inputs and throughout
the escalation process, the attributes were analyzed to ensure accurate representations of the risk.
Ten users of the Calysto Risk Management Tool from the KSC IT working group and the IT Project
Management Office attributed to the study. The users ranked from Senior Technical Management to

Engineers. With detailed knowledge on how the risk is related to their pertinent organization, the user
group gave valuable insight to the three methods describe in the following sections.
4.2.1. Manual
The manual approach to escalating a risk up the organization is in the form of a flag on an
individual risk. When the flag is marked for the risk by a risk review board at any organizational level,
the item is automatically rolled up to the top level of the enterprise. At each level of the organization,
the risk becomes visible with the same likelihood and consequence attributes as it contains at the
originating level. The manual approach allows the risk to be visible at all levels of an organization or only
at the originating level.
4.2.2. Automatic
An attribute mapping key for each level of an organization assists with rolling up a risk while
using the automated approach. At each level, a risks consequence or likelihood is diminished to degrees
in the mapping key. If the risk is six (6) levels deep with a likelihood to occur of four (4), the mapping
key for the parent level denotes a minus one (-1) likelihood converting the risk three (3) at the parent
level. The mapping in turn changes the position of the risk on the 5x5 risk matrix automatically
according to the mapping and recursively transitions up to the top level of the enterprise. The
automatic approach also makes the risk visible at all levels of an organization or only at the originating
level. However, the likelihood and consequence attributes changes at each organizational level
depending on the current level's attribute mapping.
4.2.3. Hybrid
The hybrid approach incorporates the manual method and similarities to the mapping aspect of
the automated method. The risk is still flagged to be rolled up the organization; however, an additional
attribute allows the risk to stop at a specified level. With the influence of individual risk review boards,

at each level of an organization the risk can be reviewed and determined if it should be elevated to the
next level. The parent level of the organization automatically receives the risk based off the sub levels
determination to rollup the risk. The hybrid approach allows a risk to be made visible to all
organizations in the hierarchy, up to a specific level of the hierarchy or only at the originating level.
4.3. Statement of Analysis Scope
Limits in the study presented are both technological and relate to human factors. The limits are
due to the dynamic attributes of likelihood of the risk to occur and the consequence of a risk. The
attributes pose a different meaning at each organizational level and depends on a human factor to
appropriately label overall risk by selecting the corresponding value for the likelihood or consequence
attributes. In the study, predetermined attribute mappings for a risk will be used for each level of the
hypothetical organization. The depths of an organization may vary within an enterprise and multiple
depths are represented within the study. The Calysto application is designed to house approximately
1,000 organization levels, albeit unlikely in an enterprise. However, the study depicts a typical Kennedy
Space Center organizational hierarchy of approximately six (6) levels, including projects and sub-
projects.
A key factor in the research is to automate as many details as possible without limiting the
accuracy of a given risk. It is apparent a fully automated process is not feasible and there is a need for
human intervention at each level of an organization. The manual method of determining the level of
risk is not portrayed on an individual risk level using actual risks and the business process methodology.
However, the human factor of determination is simulated with varying degrees of the level of risk. Risks
used in the study are not actual risks identified at KSC but model what attributes a risk can contain in
terms of likelihood and consequence.

4.4. Methodology Challenges
The three distinct methods of rolling risk data up an organization pose questions and answers to
problems facing enterprise risk management. The majority of technology is designed to limit human
interaction; however, when dealing with dynamic occurrences and assumptions regarding high levels of
risk, a group of experienced individuals can also influence the decision making process. The correct
combination of automation and manual inputs are needed to properly escalate a risk.
A challenging point to test the three methods is the intervention of a group of individuals. A
specific risk can be perceived differently to different audiences. Gaining a generic level of understanding
for a risk is an issue and the understanding can be altered with a specific group’s background on the risk.
The goal of the risk management tool is to make a risk both unique without going into detail of the
specifics of the risk.

5. Results of Analysis
The findings from the analysis of procedures to elevate a risk up an organizational hierarchy
where captured from feedback of experienced users from the Calysto Risk Management. The users
operated under the risk manager role for their associated organization and have been experienced in
the risk management field prior to the user of Calysto. During initial deployment for an organization,
training sessions were held to educate users on data input, navigation and reporting within the system.
Each session lasted approximately one hour with follow up questions answered via email. With the
user's knowledge and perceptions on how risk management should work in large organizations, the
following findings were identified.
5.0. Findings - Manual Approach
Through user feedback from the Calysto Risk Management Tool, it was found the manual
approach, consisting of flagging an individual risk for rollup, did not work as anticipated in all
implementations of the tool. Depending on the organizational hierarchy, and the level of projects within
an organization, risk review boards are set up at multiple levels. A risk may only need to be elevated to
the parent level of the organization instead of rolling up the entire organizational hierarchy. With the
manual approach, the risk is either within its project or if it is flagged for rollup, it will traverse up the
organizational hierarchy and be visible at all levels.
Using the manual approach, the flexibility of the system is hindered. The desired approach of
using the organizational hierarchy and subsequent projects makes risks visible in the entire
organizational hierarchy and causes confusion for top level organizations. Risks created at a deep level
in Calysto and marked to rollup, display at the top level site. The risk may only need to be elevated to
the parent level of the source project. Risk managers for parent level projects have been recursively
clearing sub-organization and project risks to “rollup”. The approach may work for the second level

organizations. However, the source project for the risk distinctively marked the risk to rollup so it may
be viewed in the risk’s containing parent project.
5.1. Findings - Automatic Approach
With assistance of a consequence and likelihood mapping list at each organizational level, the
automatic approach to roll risks up the organizational hierarchy was designed to give automatic visibility
of an individual risk to the parent organization depending on the original selected likelihood and
consequence attributes. The approach was proposed to suggest a risk to be elevated and if deemed
appropriate, the risk would be brought to the parent organization's risk review board for analysis. The
consequence and likelihood mapping list would be maintained at each organizational/project level in
Calysto and by default, the mapping attributes would be inherited from the parent level.
The main issue with the automatic approach lies within the limited number of consequence
levels. In a 3x3 risk matrix only 4 possible choices (0-3) exist and in a 5x5 risk matrix there are only 6
possible choices (0-5). If a risk were to exist multiple levels deep in the Calysto hierarchy, a risk has the
potential to be automatically converted into a risk with a zero (0) consequence. If a limit of the number
of levels inside Calysto existed, it would be feasible to use the automatic approach. However, with the
dynamic nature of the Calysto software and following a typical enterprise organizational hierarchy, the
software must be able to handle potentially an unlimited number of levels of organizations and projects.
A consequence and likelihood mapping consists of a SharePoint lists, essentially a database
table, with two columns. The first column, called [Field] distinguishes either "Likelihood" or the
consequence name. The second column, called [Relation], consists of negative numerical value or zero
(0). A project in the 5x5 risk matrix version of Calysto will have a SharePoint list similar to the data in
TABLE 2: Example Consequence Mapping.

Field Relation
Likelihood 0
Consequence - Safety -2
Consequence - Technical -1
Consequence - Cost 0
Consequence - Schedule -1
Consequence - Center Capabilities -1
TABLE 2: Example Consequence Mapping
To validate the predictions from the automatic approach of risk rollup, two experiments were
performed. Each experiment uses the same consequence and likelihood mapping table. The
organizational hierarchy used for the experiments models the NASA Kennedy Space Center's IT-F. (See
FIGURE 9: Organizational Hierarchy) IT-F is KSC's Project Management Office. KSC's organization
abbreviations are not acronyms and are based on the number of organizations, written out
alphabetically. Two distinct risks are generated with different consequences and likelihoods. The risk is
originally created in the example Communications and Imagery project, converted into an IT-F risk (See
TABLE 3: C&I (Communications and Imagery) Project Mapping) , converted into an IT risk (See TABLE 4:
IT-F Branch (Project Management Office) Mapping) and then converted into a Kennedy Space Center risk
(See TABLE 5: IT (Information Technology) Directorate Mapping).

FIGURE 9: Organizational Hierarchy
Field Relation
Likelihood 0
Consequence - Safety -1
Consequence - Technical -1
Consequence - Cost -1
Consequence - Schedule -1
Consequence - Center Capabilities -1
TABLE 3: C&I (Communications and Imagery) Project Mapping

Field Relation
Likelihood -1
Consequence - Safety -1
Consequence - Technical -1
Consequence - Cost 0
Consequence - Schedule -1
Consequence - Center Capabilities -1
TABLE 4: IT-F Branch (Project Management Office) Mapping
Field Relation
Likelihood -1
Consequence - Safety 0
Consequence - Technical -1
Consequence - Cost -1
Consequence - Schedule -1
Consequence - Center Capabilities -1
TABLE 5: IT (Information Technology) Directorate Mapping
NOTE: The experiments depicted below on the 5x5 risk matrix chart shows the risk converting from its
original value (O) to the top level KSC (K) value. While the risk traverses up the organizational hierarchy,
the representation on the risk matrix changes for each conversion and organizational level. The location
of the risk on the risk matrix shown in FIGURE 10 and FIGURE 11 is taken by mapping the likelihood and
the highest consequence value.

Experiment 1
Field Value IT-F IT KSC
Likelihood 4 4 3 2
Consequence - Safety 2 1 0 0
Consequence - Technical 5 4 3 2
Consequence - Cost 4 3 3 2
Consequence - Schedule 5 4 3 2
Consequence - Center Capabilities 4 3 2 1
TABLE 6: Experiment 1 Table
FIGURE 10: Experiment 1 Risk Matrix
The first experiment performed starts as 4x5 (likelihood by highest consequence) on the risk
matrix with a product of 20. The risk is originally denoted as a high risk. Traversing up through the
organizational hierarchy, the conversions made change the risk to a 2x2 risk with a product of 4. The
automatic conversions change the risk from a high risk to a low risk. The drastic change in product
(likelihood multiplied by the highest consequence) is an indication automatic conversions are not
feasible.

Experiment 2
Field Value IT-F IT KSC
Likelihood 3 3 2 1
Consequence - Safety 2 1 0 0
Consequence - Technical 4 3 2 1
Consequence - Cost 2 1 1 0
Consequence - Schedule 3 2 1 0
Consequence - Center Capabilities 3 2 1 0
TABLE 7: Experiment 2 Table
FIGURE 11: Experiment 2 Risk Matrix
The second experiment is considered to be more successful than the first due to the single
category change from medium to low risk. However, the risk still experience a high percentage of
change in product as it change from a 3x3 risk with a product of 9 to a 1x1 risk with a product of 1. The
automatic conversion effectively changes the medium risk to close to no risk. The drastic change in
product solidifies the theory automatic conversion will not work for deep project levels.

5.2. Findings - Hybrid Approach
Using the hybrid approach of assigning a risk to rollup to specified project level gives the user
the most flexibility for using the Calysto system out of the three methods proposed. During feedback
discussions with end users of the Calysto Risk Management, all three methods were discussed and the
most receptive response was the hybrid approach. Using this method allows users to manually assign
the level of rollup for an individual risk. Some risks may not need to be rolled up to the top level of the
Calysto hierarchy but do need to be elevated past the current project level. Allowing the user to select
the specific organizational unit or project gives the flexibility to promote a risk through multiple risk
review boards.
Throughout the Calysto application, “rollup views” are displayed as reports consisting of all risks
marked for rollup at or below the current project level. Incorporating the hybrid approach into the
rollup view is with minimal effort. The field type for the rollup field is changed to a drop down list and
populated with all parent organizations. Minimal additional code is used to populate the organizations
dynamically. The risk marked to rollup to a specified level will store the target level’s URL in the risk
data. The rollup view for a specified project filters out all risks not including the current project’s URL
from displaying in the report. The URL is to be selected by the user in a friendly form. The target
project’s name will be displayed in a drop down list with the project’s URL stored as the value. The
theory behind setting the cutoff point for a rollup lies within individual risk review boards set up at
corresponding levels of the organizational hierarchy. By denoting a cutoff point, top level organizations
will not have the need to filter out risks deemed unnecessary for review.
Comparing the hybrid approach with both the manual and automatic approach clarifies the
benefits of selecting the hybrid approach for implementation into the Calysto system. The configuration
of the approach allows for an individual risk setting for rollup. Risks are unique in nature and will not

benefit in "one size fits all" approach for rollup similar to the automatic method. The Calysto system has
proven the manual approach has benefits but does not fit within a large hierarchal organization. The
hybrid method allows to rollup risks in both small and large organizations.

6. Discussion
As shown in the previous chapter, the three methods analyzed to rollup or escalate a risk (manual,
automatic, and hybrid) have both benefits and limitations and will be discussed later in this chapter.
Using the risk management life cycle discussed in Chapter 2, the rollup procedure is incorporated in
each phase of the process through the risk management review board. Since organizations should have
their own review board established, decisions to promote the risk lie within the board to allow
additional visibility and resources to the risk. With additional resources added to the risk at both
management and technical roles, the likelihood for a risk to occur can be reduced through proper
mitigation techniques.
The main goal of risk management is to assess, mitigate and evaluate risks before they occur
[Chapter 2]. Documenting and tracking risks are only beneficial if the proper audience has visibility to
the risk. Various methods could be used to communicate risks. Utilizing an electronic tool, similar to
Calysto, allows near instantaneous communication of a risk once it has been established. The different
routes discussed are not the only ways to effectively communicate risks throughout the organization.
However, the methods allow the most effective use of the Calysto infrastructure.
6.1. Discussion - Manual Approach
At the time of this writing, the manual approach of for risk rollup is currently implemented. The
method was initially incorporated into the Calysto tool as a "one size fits all" approach. It was quickly
realized the method was not in the greater benefit to the end user and the organization. The
functionality was too simple and did not offer flexibility to a large dynamic organization.
The route taken by an end user to rollup a risk to the top level of the organization is to create a new
risk, or edit an existing risk, and select the check box next to the "Roll Up Risk" field. (See FIGURE 12:

Risk Rollup) Once the user clicks on the edit button, the risk would effectively become a risk visible
throughout the organizational hierarchy. It has been found risks may not need to traverse up the entire
organization. While a user manages a risk, an option to select the level to stop the risk is need. The
functionality is further explained in the hybrid approach.
FIGURE 12: Risk Rollup
6.2. Discussion - Automatic Approach
As shown in Chapter 5, the automatic approach for risk rollup can ultimately cause a risk with a level
of consequence and likelihood to become a zero risk. In the real world, automatic method is not
practical. A risk with high risks attributes (ex. likelihood = 5 and consequence =5) should be
distinguished as a high risk regardless where the risk originated in the organizational hierarchy. The
method is site specific and does not offer granularity to select individual risks to select for the rollup
process. The loss of translation during the traverse is unacceptable by organizations. A potentially
costly consequence of risk may be missed or not handled with priority if the automatic approach would
be incorporated into Calysto.
Technically speaking, the automatic approach is the most programmatically involved out of the
three methods considered. At each organization level, an additional configuration list would need to
exist. Changes to the automatic site provisioning process would need to be incorporated as well as
retroactively adding the list to all existing sites. By default, all lists would be pre-populated as having a
zero for the relation factor. Once the lists are properly provisioned, outreach would need to be
performed to train all users how to navigate and select the appropriate relation.

Additional configuration options add to the complexity of the Calysto application with room for
human error. Although only administrators of the Calysto organizational site would have access to their
rollup configuration list, the options selected could be mistakenly entered or potentially tampered. The
route to edit the configuration was proposed to be simple. (See FIGURE 13: Automatic Approach
Configuration) Once a use navigated to the configuration list, all fields and relations would be
populated. To edit and individual field, the user would click on the edit icon [ ] and would then be
displayed the options for the field's relation (-5, -4, -3, -2, -, 1, 0 , 1, 2, 3, 4, 5). (See FIGURE 13: Relation
Edit Form)
FIGURE 13: Automatic Approach Configuration

FIGURE 14: Relation Edit Form
As seen in the results for experiments 1 and 2 in Chapter 5 for the automatic approach, risks could
potentially be converted into a low risk when originally created as a high risk. The method is an
automatic route to convert risks and rollup the data with minimal human intervention. However, the
end result is deemed inefficient and it is suggested to not be considered for implementation in the
Calysto Risk Management Tool.
6.3. Discussion - Hybrid Approach
The results in Chapter 5 show the hybrid approach is the clear choice for the Calysto risk
management tool. The simplistic method allows a user to select the specific organizational level to stop
the rollup process. (See FIGURE 15: Hybrid Risk Rollup and Chapter 3 FIGURE 4: Calysto Hierarchy)
When a user adds a new risk or edits an existing risk, the check box field in Figure 12 is replaced with a
drop down list displaying all parent organizational levels for the current organizational site as options.

FIGURE 15: Hybrid Risk Rollup
The level of effort required to implement the hybrid approach is minimal and will require zero
maintenance by the end user. Compared to the automatic approach, the human error factor is
substantially reduced in the hybrid approach. With the granular method, the chance of error is reduced
for an individual risk. All risks in an organizational site would not be affected similar to the automatic
approach. If an error is made in classifying the level of rollup, a correction can be made by editing the
risk and selecting the correct rollup level.
6.4. Discussion - Benefits of SharePoint
The Calysto Risk Management Tool and the included rollup functionality are built in Microsoft Office
SharePoint Server (MOSS) 2007. The platform was chosen for the overall extendibility of a proven
solution. SharePoint sets the stage for development work by already completing a data access layer of
tiered development. SharePoint lists replace standard database tables and have built in storage
commands allowing for quick development.
When developing for Microsoft’s SharePoint technologies, scalability is always in the developers
mind. A solution deployed to a SharePoint server farm is usually in at least one of the following feature
“scopes”
Farm – consists of all SharePoint web applications, site collections and webs
Web Application – consists of SharePoint site collections, and webs

Site Collection – consists of a collection of SharePoint webs
Web – a SharePoint site consisting of lists, libraries and pages
[9]
Features are activated at each scope to deploy a set of reusable instructions. With scalability in
mind, features can be used to create templates and standardization across a set of SharePoint sites. In
the architecture used for the Calysto Risk Management tool, features are used at the Site Collection and
Web levels. The RMT is a separate site collection in a part of the enterprise's SharePoint farm. A Site
Collection feature activates the Calysto Infrastructure in preparation for activating the Calysto Web
features. The Web features used in Calysto create the required lists, libraries and pages. Reports used
in Calysto are shared across the Webs in the Site Collection and exist at the root web (Reference IT54-
SDD-Calysto). The central location for reports allows a cascading update when modifications are made
to the reports: a change is made in one place and replicated n times across the site collection, where n
equals the amount of webs in the site collection.
SharePoint custom web parts displaying the reports and custom features added to the solution
allow for the scalable architecture of Calysto. Allowing growth to the application overcomes the
restrictions of the first iteration of the RMT. Using Microsoft’s best practices for SharePoint
development compared to the limited SharePoint design restrictions allows for the tool to be a practical
solution for the foreseeable future.
7. Conclusion
The study of Calysto: Risk Management for Manned Spaceflight was successful in determining
the proper method to elevate, or "rollup" individual risks identified by an organization or project
throughout an organizational hierarchy. The method found to give the best value in risk rollup was
determined to be the hybrid method. Compared to the manual method, the hybrid approach allows a
user to specify the cutoff point while traversing up the hierarchy, whereas the manual method sets the
individual risk to rollup to all parent organization. The automatic approach was determined to be flawed
as the premise of automatically converting risks based off mapping values at each organizational level
leads to converting an item with high risk to zero risk.
The end result of the study has paved the way for a future rendition of the Calysto Risk
Management took and has added value behind the upgrades. The original intent of the study was to
investigate how to manage and communicate risks in a large organization. The study has shown with the
proper techniques in place, risk management can become an added value to any size of organization,
large or small. The risk management process is adaptable to specific organizations and while
organizations change directions, the risk management process needs to adapt. The method of managing
and communicating risks will need to change with organization change as well as new technological
resources.
Using NASA's Kennedy Space Center's Calysto Risk Management Tool user base as the prime
research consultants posed concerns to both contract and governmental data restrictions. To address
these concerns, no actual data was used in the study. Example data was used in replacement. NASA
policy is to restrict data access between competing contractors and by displaying the data in the study

would violate the policy. To overcome the issue of NASA internal only document references, all
documentation used in the study is made publicly available and accessible via the internet.
Using the Calysto Risk Management Tool at NASA's Kennedy Space Center, and any organization
large or small, adds value to the organization's risk management process and procedures. By offering
standardization for risk capture and analysis, data can be transferred between organizations with
minimal loss of translation. Data will become available to necessary parties involved at quicker pace to
allow for a quicker response. Time is of the essence for risk management and by utilizing Calysto,
organizations can react in a timely manner to reduce the consequences of risk.

Works Cited
[1] O’Conner, Bryan. (2008 December). Agency Risk Management Procedural Requirements . [Online]. Available: http://nodis3.gsfc.nasa.gov/npg_img/N_PR_8000_004A_/N_PR_8000_004A_.pdf
[2] G. Stoneburner, A. Goguen, and A. Feringa. (2002 July). Risk Management Guide for Information Technology Systems. [Online]. Available: http://csrc.nist.gov/publications/nistpubs/800-30/sp800-30.pdf
[3] ClearRisk, Inc. (2010 May). The Risk Management Process. [Online]. Available: http://www.clearrisk.com/Manager/Whitepapers/ClearRisk-RiskManagementProcess.pdf
[4] ISO. (2009). Risk Management – Vocabulary (First Edition). [Online]. Available: http://www.pqm-online.com/assets/files/standards/iso_iec_guide_73-2009.pdf
[5] AIRMIC, ALARM, and IRM. (2002). A Risk Management Standard. [Online]. Available: http://www.theirm.org/publications/documents/Risk_Management_Standard_030820.pdf
[6] Alcorn, George. (2009) Goddard Space Flight Center: Goddard Technical Standard – Risk Management Reporting. [Online]. Available: http://standards.gsfc.nasa.gov/gsfc-std/gsfc-std-0002.pdf
[7] Worden, S. Pete. (2011). NASA Ames Research Center Procedural Requirements: Risk Management Process Requirements. [Online]. Available: http://server-mpo.arc.nasa.gov/Services/CDMSDocs/Centers/ARC/Dirs/APR/APR8000.4.html
[8] Greenfield, Michael A. (2000). Langley Research Center: Risk Management Tools. [Online]. Available: http://www.hq.nasa.gov/office/codeq/risk/docs/rmt.pdf
[9] Rice, Frank. (2008). Microsoft: Creating a Custom Feature in SharePoint Server 2007. [Online]. Available: http://msdn.microsoft.com/en-us/library/cc263911(v=office.12).aspx

Appendix A: Glossary
RMT : Risk Management Tool - A tool used for the practice of risk management. i.e.
Calysto
Calysto : Risk management tool used at Kennedy Space Center developed by the KSC
Institutional SharePoint team.
Consequence : Outcome of an event affecting objectives [5].
CRMWG : Center Risk Management Working Group - Group creating at the top level of
KSC's organizational hierarchy encompassing all sub organization representatives.
Frequency : Number of events or outcomes per defined unit of time [5].
KSC : Kennedy Space Center - NASA facility located in Merritt Island Florida.
Likelihood : Chance of something happening [5].
NASA : National Aeronautics and Space Administration - United States government
organization for aeronautics and aerospace.
Risk Identification : Process of finding, recognizing and describing risks [5].
Risk Management
Process
: Systematic application of management policies, procedures and practices to the
activities of communicating, consulting, establishing the context, and Identifying,
analyzing, evaluating, treating, monitoring and reviewing risk [5].
Risk Management : Coordinated activities to direct and control an organization with regard to risk
[5].
Risk Matrix : Tool for ranking and displaying risks by defining ranges for consequence and
likelihood [5].
Risk Scorecard : Detailed table showing mappings of level of consequence and likelihood for risk
management.
RMB : Risk Management Board - An organizational group setup to analyze and track
risks.
XML : Extensible Markup Language
XSL : Extensible Stylesheet Language

Appendix B: Project File Repository Definitions
SharePoint repository provided by Gary Dillaman: http://my.dillaman.net/thesis Subversion repository provided by Gannon University: http://cissvn.gannon.edu:8080/SVN/CISCourse/CIS698AY11-12

Appendix C: Calysto System Requirements Specification
TABLE OF CONTENTS
1. INTRODUCTION ..................................................................................................................... 57
1.1. Purpose ......................................................................................................................... 57
1.2. Intended Audience ........................................................................................................ 57
1.3. Scope ............................................................................................................................. 57
1.4. Glossary ......................................................................................................................... 57
1.4.1. Acronyms .............................................................................................................. 57
1.4.2. Definitions ............................................................................................................. 57
1.5. References .................................................................................................................... 58
1.5.1. NPR 8000.4 ............................................................................................................ 58
1.5.2. KNPD 8000.4 ......................................................................................................... 58
1.5.3. Section 508 ............................................................................................................ 59
2. DESCRIPTION ......................................................................................................................... 60
2.1. System Identification and Overview ............................................................................. 60
2.2. Operating Environment ................................................................................................ 60
2.3. User Documentation ..................................................................................................... 60
3. REQUIREMENTS ..................................................................................................................... 61
3.1. Functional Requirements .............................................................................................. 61
3.1.1. Data Input ............................................................................................................. 61
3.1.2. Data Processing ..................................................................................................... 61
3.1.3. Required States and Modes .................................................................................. 62
3.2. Non-functional requirements ....................................................................................... 62
3.2.1. Accessibility ........................................................................................................... 62
3.2.2. Configuration Management.................................................................................. 62
3.2.3. Disaster Recovery.................................................................................................. 62
3.2.4. Security ................................................................................................................. 62

1. INTRODUCTION
1.1. Purpose
This Software Requirements Specification provides a complete description of all the functions
and specifications of the Calysto Risk Management Tool (RMT).
1.2. Intended Audience
The expected audience of this document is any organization at NASA expected to use this system,
the KSC Institutional SharePoint Team and the developer.
1.3. Scope
Calysto is to be installed on a web based server to allow members of an organization to enter
information about a risk, assign mitigation tasks, and assist in risk review boards and rollup a risk to
parent level of their organization. The data will be held in a Microsoft SQL server database and
accessible via a web interface.
1.4. Glossary
1.4.1. Acronyms
KNPD – Kennedy NASA Policy Directive
NPR – NASA Procedural Requirements
RMT – Risk Management Tool
1.4.2. Definitions
Risk Consequence - A representation of the qualitative or quantitative severity of the performance
degradation that would result if the risk statement became true
Risk Likelihood - As defined in NPR 8000.4, “A measure of the possibility that a scenario will occur that
also accounts for the timeframe in which the events represented in the scenario can occur.”

Risk Owner - As defined in NPR 8000.4, “The ‘risk owner’ is the entity, usually a named individual,
designated as the lead for overseeing the implementation of the agreed disposition of that risk.”
Risk Product - The highest consequences multiplied by the highest likelihood.
Risk Trend - Status of the risk since last review: New, Unchanged, Increasing, or Decreasing. Value is
defined by evaluating whether the Risk Product has remained the same, increased, or
decreased.
Risk Matrix - A 3 by 3 or 5 by 5 grid with the level of consequences on the Y axis and the likelihood on
the X axis
Risk Scorecard - A table of consequences with a numerical value associated with description of a
consequence.
Scorecard Mapping - A mapping a parent to child project site risk scorecards to allow for different levels
of consequences
Project Site - A container for an organization comprising of: risk data, mitigation tasks, risk scorecard,
risk scorecard mapping, and options for configuration.
Rollup - Includes the current project's risks and all child projects’ risks.
1.5. References
1.5.1. NPR 8000.4
Agency Risk Management Procedural Requirements
1.5.2. KNPD 8000.4
KSC Center Risk Management

1.5.3. Section 508
http://www.section508.gov/

2. DESCRIPTION
2.0. System Identification and Overview
The Calysto Risk Management Tool (RMT) will be a central location to identify, track, analyze
and mitigate risks for an organization. Using an organizations hierarchy, individual project sites will be
created at the corresponding level. At each project, risks will be individually scored based off a series of
questions and automated calculation. The RMT will allow the user to manually "rollup" a risk to the
parent level and will display suggested risks to rollup based off a mapping of the risk score card
(Appendix B).
2.1. Operating Environment
The RMT will be deployment in a Microsoft Office SharePoint Server 2007 farm. The farm will
consist of two web front end servers, an application server used for search and indexing, a Microsoft
SQL Server 2008 database server. All servers in the farm will run the Windows Server 2008 R2 operating
system.
2.2. User Documentation
The RMT will provide an online user guide for each user role depicting all features provided by
the application. The online guide will be accessible on any page of the application. Additionally, support
contacts will provide throughout the system and the online user guide will be available for download in
PDF format.

3. REQUIREMENTS
3.0. Functional Requirements
3.0.1. Data Input
3.0.1.1. The RMT software shall import project sites via user inputs.
3.0.1.2. The RMT software shall import risk data for a project via user input. (Appendix A)
3.0.1.3. The RMT software shall import mitigation task data for a risk via user inputs. (Appendix B)
3.0.1.4. The RMT software shall import a risk project scorecard data via user inputs. (Appendix C)
The RMT software shall import risk scorecard mappings via user inputs.
3.0.1.5. The RMT software shall provide configuration settings for the project owners via user input.
The RMT project configuration settings shall provide, the ability to: enable/disable approvals, select risk schema, select automatic or manual trending, turn on email alerts, modify the project editor, select the risk matrix, and modify the "Risk ID" naming convention
3.0.2. Data Processing
3.0.2.1. The RMT software shall calculate a "Product" based off the highest consequence multiplied by the likelihood of the risk.
3.0.2.2. The RMT software shall send an email to the "Risk Owner" upon assignment of a risk.
3.0.2.3. The RMT software shall report risks in a single display view. The view shall display all fields for a specific risk.
3.0.2.4. The RMT software shall report risks in presentation view. The view shall display a web based version of a PowerPoint presentation with a subset of fields for a specific risk, a collection of risks for a project, or a rollup collection of risks.
3.0.2.5. The RMT software shall report risks in a dashboard view. The view shall display a horizontal subset of fields for a specific risk, a collection of risks for a project, or a rollup collection of risks.
3.0.2.6. The RMT software shall report risks via an interactive risk matrix. When a cell in the risk matrix is clicked the RMT shall filter a horizontal display of fields for a specific risk, a collection of risks for a project, or a rollup collection of risks.
3.0.2.7. The RMT software shall report risks via a suggested rollup view. The view shall display risks suggested to be elevated to the parent project based off the risk's scorecard mapping.
3.0.2.8. The RMT software shall generate a unique Risk ID based off the project site structure, the year, and a unique identifier.
3.0.2.9. The RMT software shall mark items as delete but keep the data intact for ease in restoration of a risk.
3.0.2.10. The RMT software shall automatically trend a risk if trending is enabled in the configuration for the project site.

3.0.2.11. The previously approved version (if approvals are enabled) shall be the baseline for the trend representation.
3.0.2.12. The trend representation shall depict the color of the risk matrix for the consequence and likelihood.
3.0.2.13. The RMT shall export risk data into Microsoft PowerPoint for a selected risk or a group of risks.
3.0.2.14. The RMT shall export risk data into Microsoft Excel for a selected risk or a group of risks.
3.0.3. Required States and Modes
3.0.3.1. The RMT software shall present data to users via a graphical user interface.
3.1. Non-functional requirements
3.1.1. Accessibility
3.1.1.1. The RMT software must be accessible via all internet browser software.
3.1.1.2. The RMT software shall be Section 508 compliant.
3.1.2. Configuration Management
3.1.2.1. The RMT software shall utilize a Microsoft SQL Server to host and store data
3.1.3. Disaster Recovery
3.1.3.1. The RMT software shall be backed up with full backups occurring weekly and incremental backs occurring nightly.
3.1.4. Security
3.1.4.1. The RMT software shall contain a security principle for owners of a project site with administrative functions and the ability to approve risks.
3.1.4.2. The RMT software shall contain a security principle for members of a project site with read and edit abilities for all data in the site.
3.1.4.3. The RMT software shall contain a security principle for visitors of a project site with a read only
ability for all data in the site.

Appendix D: Calysto System Design Document
TABLE OF CONTENTS
1. INTRODUCTION ..................................................................................................................... 66
2. SYSTEM OVERVIEW................................................................................................................ 67
3. DESIGN CONSIDERATIONS ..................................................................................................... 68
3.1. ASSUMPTIONS AND DEPENDENCIES ............................................................................ 68
3.1.1. PREREQUISITES ..................................................................................................... 68
3.2. GENERAL CONSTRAINTS ............................................................................................... 68
3.3. DEVELOPMENT METHODS ............................................................................................ 69
4. ARCHITECTURAL STRATEGY ................................................................................................... 70
4.1. INTEGRATION WITH SHAREPOINT ................................................................................ 70
4.2. DATA AVAILABILITY ....................................................................................................... 70
4.3. FUTURE PLANNING ....................................................................................................... 70
5. SYSTEM ARCHITECTURE ......................................................................................................... 71
5.1. BACK END ...................................................................................................................... 71
5.2. FRONT END ................................................................................................................... 71
6. POLICIES AND TACTICS .......................................................................................................... 72
6.1. SITE COLLECTION SCOPED FEATURE ............................................................................. 72
6.2. WEB SCOPED FEATURE ................................................................................................. 72
7. DETAILED SYSTEM DESIGN .................................................................................................... 74
7.1. OBJECT MODEL ............................................................................................................. 74
7.2. NAVIGATION ................................................................................................................. 74
7.2.1. TOP LINK BAR ........................................................................................................ 74
7.2.2. PROJECT MENU ..................................................................................................... 74
7.2.3. SITE ACTIONS ........................................................................................................ 75
7.3. PAGES ............................................................................................................................ 77
7.3.1. ADMINISTRATION ................................................................................................. 77
7.3.2. DASHBOARD .......................................................................................................... 77
7.3.3. DASHBOARD ROLLUP ............................................................................................ 77
7.3.4. PRESENTATION...................................................................................................... 77
7.3.5. PRESENTATION ROLLUP ........................................................................................ 77
7.3.6. RISK OVERVIEW ..................................................................................................... 77
7.4. WEB PARTS .................................................................................................................... 78
7.4.1. CONFIGURATION WEB PART ................................................................................. 78
7.4.2. XSL WEB PART ....................................................................................................... 82
7.4.3. OVERVIEW WEB PART ........................................................................................... 87
7.5. INPUT FORMS................................................................................................................ 89
7.5.1. RISK ....................................................................................................................... 89
7.5.2. MITIGATION TASKS ............................................................................................... 91
7.6. CALCULATIONS .............................................................................................................. 93
7.6.1. RISK ID ................................................................................................................... 93
7.6.2. TREND REPRESENTATION ..................................................................................... 93
7.7. PERMISSIONS ................................................................................................................ 95
7.7.1. CALYSTO SYSTEM OWNERS................................................................................... 95
7.7.2. CALYSTO OWNERS ................................................................................................ 96
7.7.3. CALYSTO MEMBERS .............................................................................................. 97
7.7.4. CALYSTO VISITORS ................................................................................................ 98

TABLE OF FIGURES
FIGURE 1: Site Collection Scoped Feature ......................................................................................... 72
FIGURE 2: Web Scoped Feature ......................................................................................................... 73
FIGURE 3: Top Link Bar ...................................................................................................................... 74
FIGURE 4: Project Menu .................................................................................................................... 75
FIGURE 5: Site Actions Menu ............................................................................................................. 76
FIGURE 7: Configuration Web Part using the Project Query String ................................................... 81
FIGURE 8: Create New Project Notification ....................................................................................... 81
FIGURE 9: XSL Web Part using the Dashboard/Dashboard Rollup report configuration .................. 83
FIGURE 10: XSL Web Part using the Presentation/Presentation Rollup report configuration ............ 84
FIGURE 11: XSL Web Part Properties ................................................................................................... 85
FIGURE 12: Export to PowerPoint ........................................................................................................ 86
FIGURE 13: Export to PowerPoint Message ........................................................................................ 86
FIGURE 14: Excel Export ....................................................................................................................... 86
FIGURE 15: Risk Overview Web Part.................................................................................................... 88
FIGURE 16: Risk Input Form ................................................................................................................. 90
FIGURE 17: Mitigation Task Form ........................................................................................................ 92
FIGURE 18: Trend Representations ..................................................................................................... 94
FIGURE 19: Calysto System Owners Permission Level ......................................................................... 95
FIGURE 20: Calysto Owners Permission Level ..................................................................................... 96
FIGURE 21: Calysto Members Permission Level .................................................................................. 97
FIGURE 22: Calysto Visitors Permission Level ...................................................................................... 98

1. INTRODUCTION
The purpose of this document is to give a detailed description of the Calysto Risk Management Tool
(RMT) and its components. This document will give the developers and project managers a detailed
view of the design requirements for the system. The purpose of creating Calysto is to provide a scalable
solution to an evolving practice of Risk Management.
Reference: IT54-SRS-Calysto

2. SYSTEM OVERVIEW
Calysto will reside in a Microsoft SharePoint site collection consisting on multiple sub sites for each
project/organizational level. The data inserted and retrieved will be stored in SharePoint lists ultimately
residing in a Microsoft SQL Server instance. SharePoint forms will handle inserts and updates to the
data with custom event handlers triggering automated calculations upon save. Reports will be displayed
to the users via a custom web part rendering list data XML into HTML with an XSL style sheet. The
reports will be filtered based off predetermined and user customizable SharePoint views.
The Calysto System Owner role in the SharePoint permission schema will provision new Calysto
sites. The system will be installed on the site by activating a SharePoint web scoped feature upon
creation. Calysto Owners will have the ability to modify configuration settings for the project for setting:
the Project Name, Rollup of Risks, Approvals, Trending, Email Alerts, Schema, Naming Convention and
editor. The Calysto Contributors role in the SharePoint permission schema will have the ability to add
and update new risks for the projects and Calysto Visitors will have read-only access to the Calysto
project.

3. DESIGN CONSIDERATIONS
3.0. ASSUMPTIONS AND DEPENDENCIES
3.0.1. PREREQUISITES The following SharePoint Site Collection features must be activated in order to install Calysto:
SharePoint Publishing Infrastructure
o Allows for publishing to be enabled at the site level, allows multiple levels of fly-outs for
the top navigation menu
NASA Menu
o Allows the SharePoint Quick Launch to be turned into a multiple level horizontal fly-out
menu
KSC SharePoint Branding Infrastructure
o Brands the SharePoint site with custom graphics and CSS
Calysto Infrastructure
o Creates dependent files for a Calysto site
The following SharePoint Site features must be activated in order to install Calysto on a Site:
SharePoint Publishing
o Creates a Pages document library used to store publishing pages. This will allow for auto
generation of .ASPX files used to house the custom Calysto web parts.
Calysto
o Creates .ASPX pages with custom Calysto web Parts and provisions dependent Calysto
SharePoint lists for data storage and configuration.
3.1. GENERAL CONSTRAINTS

The roles for Calysto will be customized to disallow editing of pages and web part zones to restrict the
user from modifying custom Calysto web part properties.
3.2. DEVELOPMENT METHODS
Calysto will be developed using Microsoft Visual Studio 2008 with the WSPBuilder Extensions
installed. Any graphics created will be designed using Adobe Photoshop.

4. ARCHITECTURAL STRATEGY
4.0. INTEGRATION WITH SHAREPOINT
Calysto will have a seamless integration with SharePoint. Each of the pages for data entry and
reporting will mirror the OTB SharePoint design. The concepts of views and default views will be
incorporated into Calysto. Views will allow each customer the flexibility of adding and removing certain
fields from the report. Calysto views will differ from SharePoint views as there will be mandatory fields
and the user will not be able to remove them from the view.
4.1. DATA AVAILABILITY
The data for Calysto will have the same up time and availability of SharePoint. However, in the rare
instance of the SharePoint infrastructure becoming unavailable due to unforeseen circumstances, users
will not be able to access Calysto.
4.2. FUTURE PLANNING
Calysto will be developed with the mindset to easily maintain future upgrades. The Calysto
application can be installed in multiple locations on the SharePoint farm, however and upgrade to the
product will only need to be performed in one location and cascaded throughout the sites.

5. SYSTEM ARCHITECTURE
5.0. BACK END
SharePoint lists will store the Calysto data used throughout the sites collection. The insert, update,
delete commands will be interpreted in the SharePoint object model. Versioning will be turned on in all
lists to allow historical data representation by time and user performing the update.
5.1. FRONT END
The front end of Calysto will consist of SharePoint master pages, themes, page layouts and web
parts. Each implementation of Calysto can consist of a different master page and theme chosen by the
site owner. The page layouts and web parts will be standard across all implementations of Calysto.

6. POLICIES AND TACTICS
6.0. SITE COLLECTION SCOPED FEATURE
The site collection scoped feature will create the page layouts and their associated content types.
They will be reused throughout the sub sites of the site collection. The feature will also add the Calysto
custom web parts to the site collection web part gallery. In order for the feature to be activated, it has a
prerequisite of having the “Office SharePoint Server Publishing Infrastructure” feature activated. The
feature will automatically activate the web scoped feature at the root of the site collection. The feature
will create the following SharePoint content types: Error Log, Configuration, Risk, Mitigation Task and
Scorecard Mapping. The Error Log list will be created at the root of the site collection to store errors
from any sub site.
FIGURE 16: Site Collection Scoped Feature
6.1. WEB SCOPED FEATURE
The web scoped feature will create the pages and navigation for the data manipulation and
reporting tools of Calysto. When creating the pages, it will programmatically add the proper web parts
to the page and configure them accordingly. In order for the feature to be activated, it has the
prerequisites of having the Calysto site collection scoped feature activated and the “Office SharePoint
Server Publishing” web scoped feature activated. Upon activation, the default page for the sub site will
be set as the Dashboard Rollup. The configuration properties for the parent site will be inherited to the
new Calysto sub site.

The web scoped feature will create the following lists on the current site: Configuration, Risk, Risk
Rollup, Mitigation Tasks and Scorecard Mapping.
The following pages will be created with the proper web part added and configured:
Administration, Dashboard, Dashboard Rollup, Presentation, Presentation Rollup and Risk Overview
FIGURE 17: Web Scoped Feature
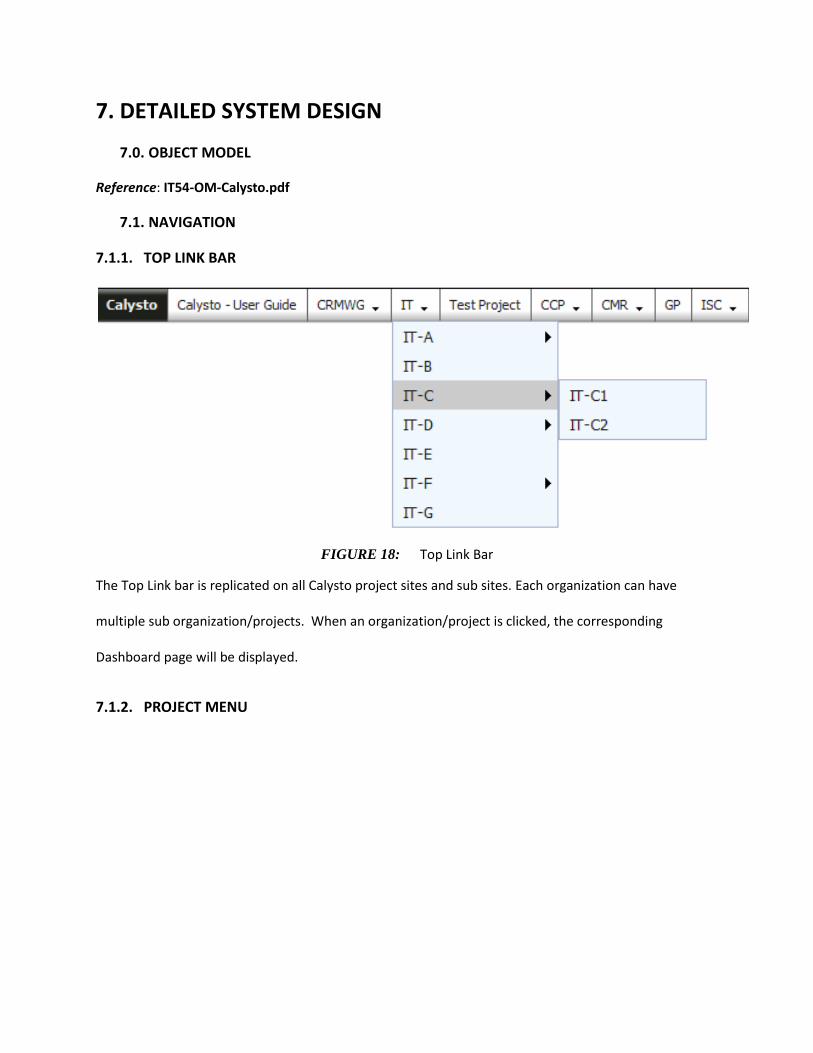
7. DETAILED SYSTEM DESIGN
7.0. OBJECT MODEL
Reference: IT54-OM-Calysto.pdf
7.1. NAVIGATION
7.1.1. TOP LINK BAR
FIGURE 18: Top Link Bar
The Top Link bar is replicated on all Calysto project sites and sub sites. Each organization can have
multiple sub organization/projects. When an organization/project is clicked, the corresponding
Dashboard page will be displayed.
7.1.2. PROJECT MENU

FIGURE 19: Project Menu
The Project Menu is displayed on every page within a project. The links are relative to the current site.
The Reports Menu includes links to:
Overview
Dashboard
Dashboard Rollup
Presentation
Presentation Rollup
Risk Data
The References Menu includes links to:
Consequence Chart
Legends
User Guide
7.1.3. SITE ACTIONS

The Site Actions menu is located in the top right hand corner of every page in a Calysto Project site.
Only Calysto System Owners or Calysto Owners for the current project will see the menu. Three menu
options will be visible to the owner:
Create Project – Directs the user to the Administration page displaying a new project form.
Manage Configuration – Directs the user to the Administration page displaying the configuration
options for the current project.
People and Groups – Directs the user SharePoint’s built in tool for managing group permissions.
FIGURE 20: Site Actions Menu

7.2. PAGES
7.2.1. ADMINISTRATION
Filename: Administration.aspx
Web Part(s): Configuration Web Part
Access: Calysto System Owners, Calysto Owners
Linked from: Site Actions Menu
7.2.2. DASHBOARD
Filename: Dashboard.aspx
Web Part(s): XSL Web Part
Access: Calysto System Owners, Calysto Owners, Calysto Visitors
Linked from: Project Menu, Top Link Bar
7.2.3. DASHBOARD ROLLUP
Filename: DashboardRollup.aspx
Web Part(s): XSL Web Part
Access: Calysto System Owners, Calysto Owners, Calysto Visitors
Linked from: Project Menu
7.2.4. PRESENTATION
Filename: Presentation.aspx
Web Part(s): XSL Web Part
Access: Calysto System Owners, Calysto Owners, Calysto Visitors
Linked from: Project Menu
7.2.5. PRESENTATION ROLLUP
Filename: Overview.aspx
Web Part(s): XSL Web Part
Access: Calysto System Owners, Calysto Owners, Calysto Visitors
Linked from: Project Menu
7.2.6. RISK OVERVIEW
Filename: Overview.aspx
Web Part(s): Calysto Overview Web Part
Access: Calysto System Owners, Calysto Owners, Calysto Visitors
Linked from: Project Menu

7.3. WEB PARTS
7.3.1. CONFIGURATION WEB PART
The Configuration web part is placed on the “Adminsration.aspx” page on each project site and
only accessible to Calysto System Owners and Calysto Owners. The web part has no custom properties
to configure.
If the Administration page is supplied the query string pair of “type=Configuration”, the
Configuration version of the web part will be display. When added to a page in a Calysto site, the web
part will read from the current site’s configuration list. Upon save, event handlers on the configuration
list will modify the properties for the sites lists and features. The following events will be triggered upon
save:
Project Title – No events triggered; updates the SharePoint site title.
Rollup Risks - The default value for the Risk Rollup checkbox will be set as checked for new Risk items in
the Risk list.
Approvals – When set to “On”, approvals will be required to make the risk visible by all users of the
Calysto site; only Calysto Owners and the person adding/editing the record will see the updates. When
set to “Off”, all users of the Calysto site will immediately see the changes to the Risk.
Trending – When set to “On”, trending will be calculated automatically based of the previous version of
the risk (previous approved version if Approvals are turned on. When set to off, a new field called
Trending will be visible in the Risk item. The user will have the following options for setting the trending:
New, Increasing, Decreasing or Unchanged.
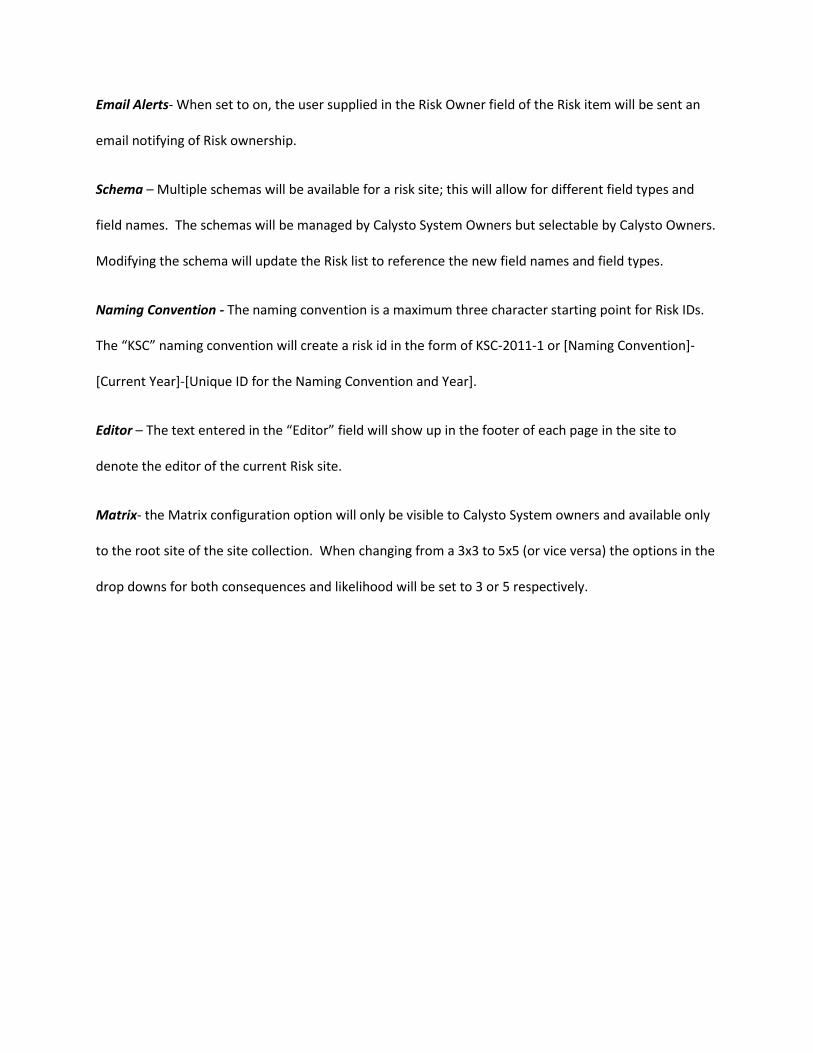
Email Alerts- When set to on, the user supplied in the Risk Owner field of the Risk item will be sent an
email notifying of Risk ownership.
Schema – Multiple schemas will be available for a risk site; this will allow for different field types and
field names. The schemas will be managed by Calysto System Owners but selectable by Calysto Owners.
Modifying the schema will update the Risk list to reference the new field names and field types.
Naming Convention - The naming convention is a maximum three character starting point for Risk IDs.
The “KSC” naming convention will create a risk id in the form of KSC-2011-1 or [Naming Convention]-
[Current Year]-[Unique ID for the Naming Convention and Year].
Editor – The text entered in the “Editor” field will show up in the footer of each page in the site to
denote the editor of the current Risk site.
Matrix- the Matrix configuration option will only be visible to Calysto System owners and available only
to the root site of the site collection. When changing from a 3x3 to 5x5 (or vice versa) the options in the
drop downs for both consequences and likelihood will be set to 3 or 5 respectively.

FIGURE 21: Configuration Web Part using the Configuration Query String
If the Administration page is supplied the query string pair of “type=Project”, the create project
version of the web part will be display. The web part will display two fields required to create a new
project:
Project Title – Any length of characters allowed; displayed throughout the application as references to
the project.
Project URL – A maximum of five characters allowed; used for the URL of the project and building the
Risk ID.

FIGURE 22: Configuration Web Part using the Project Query String
Once saving the data for the new project, an alert will be displayed notifying the user to wait for the
creation of the project. Once the project has been created, the user will be redirected to the new blank
project site.
FIGURE 23: Create New Project Notification

7.3.2. XSL WEB PART
The XSL Web Part has web part properties made accessible via a custom tool part allowing page
post backs when changing certain fields. The web part is made accessible on the following pages:
Dashboard, Dashboard Rollup, Presentation and Presentation Rollup. The proper report is displayed on
the page by selecting the “List” property (Risk or Risk Rollup), the Display Type (Dashboard or
Presentation) and the report XSL file. The reports are stored in the “XSL” document library at the root
web of the site collection.
Selecting any check box and clicking the Export link button will export the risk data to either
Microsoft PowerPoint or Microsoft Excel depending on the button clicked. Clicking the Printable link will
open a new browser window with minimal chrome and display only the current report.

FIGURE 24: XSL Web Part using the Dashboard/Dashboard Rollup report configuration

FIGURE 25: XSL Web Part using the Presentation/Presentation Rollup report configuration
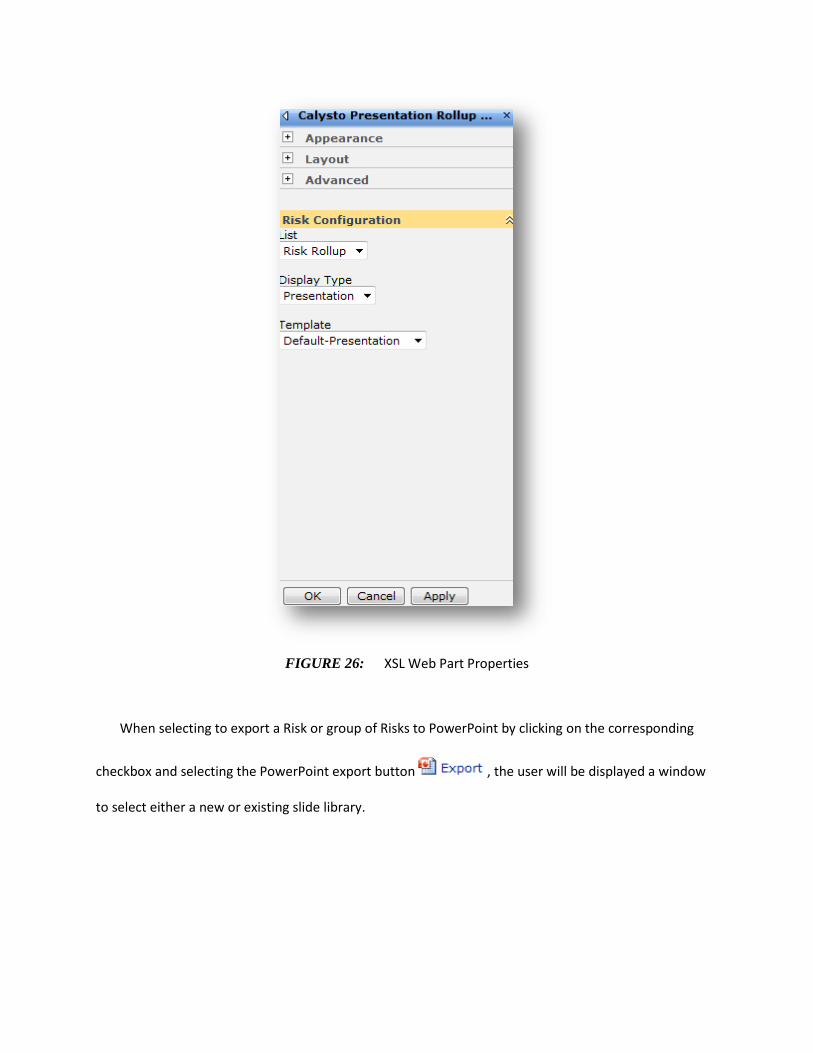
FIGURE 26: XSL Web Part Properties
When selecting to export a Risk or group of Risks to PowerPoint by clicking on the corresponding
checkbox and selecting the PowerPoint export button , the user will be displayed a window
to select either a new or existing slide library.

FIGURE 27: Export to PowerPoint
Once the Export button is clicked, the user will be notified the PowerPoint slides are
being exported. Upon successful export, the user will be directed to the selected slide library showing a
view of the new slides for the Risk(s).
FIGURE 28: Export to PowerPoint Message
When selecting to export a Risk or group of Risks to Excel by clicking on the corresponding checkbox
and selecting the Excel export button , the user will be directed to the newly export Excel
export in the project sites “Excel Exports” document library.
FIGURE 29: Excel Export

7.3.3. OVERVIEW WEB PART
The Overview web part is displayed on the Overview page accessible from the “Reports” section of
the Project menu. There are no configurable web part properties; the web part will determine the
current project site and display either the current project or the rollup for the current project. The web
part displays the risk matrix (5x5 or 3x3) with a risk list filtered based off the selection of a cell in the risk
matrix.
Selecting any check box and clicking the Export link button will export the risk data to either
Microsoft PowerPoint or Microsoft Excel depending on the button clicked. Clicking the Printable link will
open a new browser window with minimal chrome and display only the current report.
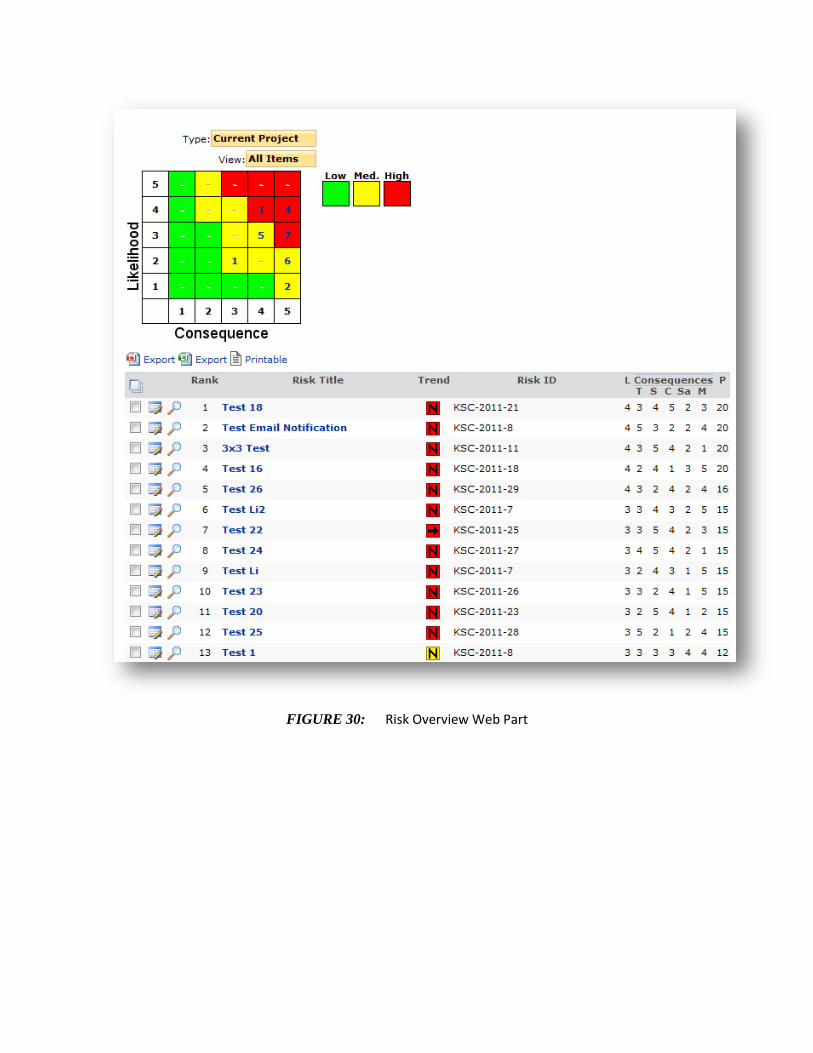
FIGURE 30: Risk Overview Web Part

7.4. INPUT FORMS
7.4.1. RISK
The Risk new form is located in each project site at <site>/Lists/Risks/NewForm.aspx. The Risk edit
form is located in each project site at <site>/Lists/Risks/EditForm.aspx?ID={CurrentID}. The CurrentID
reference will be the SharePoint ID for the risk currently being edited. A subset of fields are required
forcing the user to enter data before saving the record. Once the record has been saved, the user will
be directed to the All Items view of the Risk list.

FIGURE 31: Risk Input Form

7.4.2. MITIGATION TASKS
The Mitigation Tasks new form is located in each project site at <site>/Lists/Mitigation
Tasks/NewForm.aspx. The Mitigation Task edit form is located in each project site at
<site>/Lists/Mitigation Tasks/EditForm.aspx?ID={CurrentID}. The CurrentID reference will be the
SharePoint ID for the Mitigation Task currently being edited. Two fields are required, forcing the user to
enter data before saving the record. The Risk field is a SharePoint lookup field display a list of all Risk IDs
from the current project’s Risk list.

FIGURE 32: Mitigation Task Form

7.5. CALCULATIONS
7.5.1. RISK ID
The Risk ID for a risk is calculated based off the current project, the year, and the unique risks for the
year. For example, if a risk the KSC IT organization is created, the first risk for the 2011 year will be: KSC-
IT-2011-1. If the risk is a child risk for the example, it will append a period followed by a unique
identifier: KSC-IT-2011-1.1. The template for Risk IDs is {PROJECT}-{YEAR}-{ID}.
7.5.2. TREND REPRESENTATION
The Trend Representation is used throughout Calysto to depict where the Risk sites in the risk matrix
and how the risk is trending based on previous updates to the risk.
The color for the trend representation will be either:
Green - Low risk
Yellow - Medium risk
Red - High risk
The options for the trend are:
New – There is no previous version
Unchanged – The risk product has not changed from the previous version
Decreasing – The risk product has dropped since the previous version
Increasing – The risk product has increased since the previous version
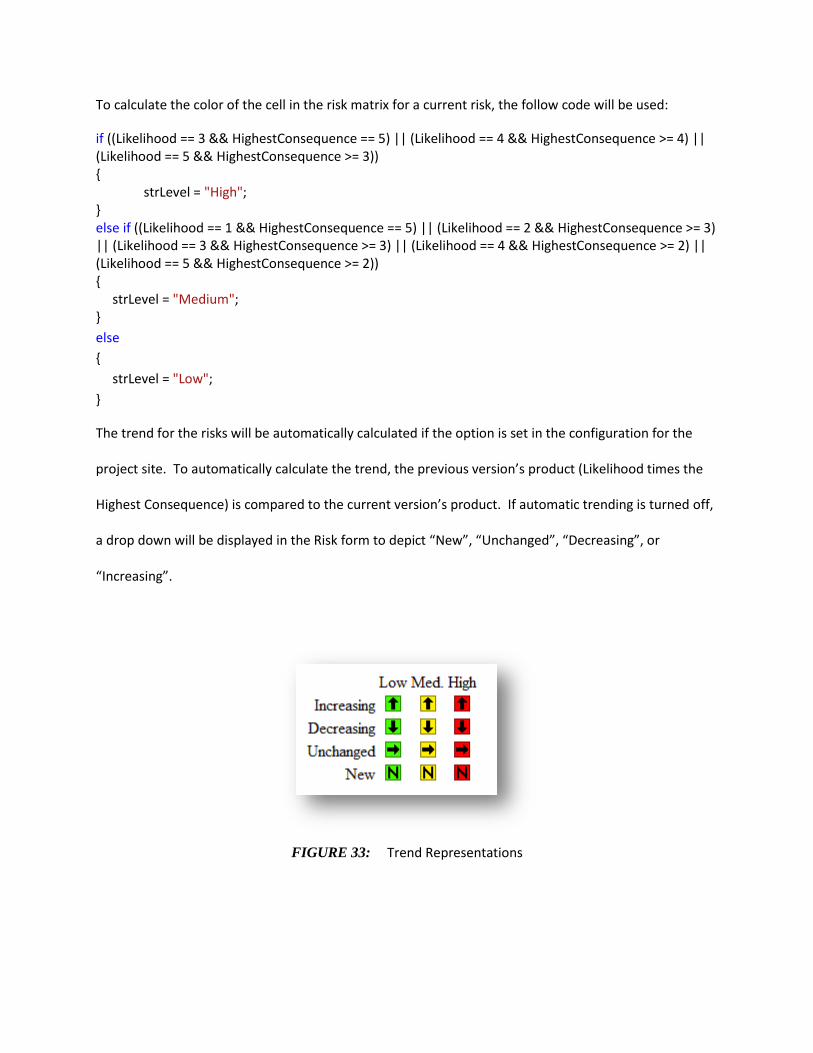
To calculate the color of the cell in the risk matrix for a current risk, the follow code will be used:
if ((Likelihood == 3 && HighestConsequence == 5) || (Likelihood == 4 && HighestConsequence >= 4) || (Likelihood == 5 && HighestConsequence >= 3)) {
strLevel = "High"; } else if ((Likelihood == 1 && HighestConsequence == 5) || (Likelihood == 2 && HighestConsequence >= 3) || (Likelihood == 3 && HighestConsequence >= 3) || (Likelihood == 4 && HighestConsequence >= 2) || (Likelihood == 5 && HighestConsequence >= 2)) { strLevel = "Medium"; }
else
{
strLevel = "Low";
}
The trend for the risks will be automatically calculated if the option is set in the configuration for the
project site. To automatically calculate the trend, the previous version’s product (Likelihood times the
Highest Consequence) is compared to the current version’s product. If automatic trending is turned off,
a drop down will be displayed in the Risk form to depict “New”, “Unchanged”, “Decreasing”, or
“Increasing”.
FIGURE 33: Trend Representations

7.6. PERMISSIONS
7.6.1. CALYSTO SYSTEM OWNERS
The Calysto System Owners will have SharePoint’s built in Full Control permission level. Only the
administrators of the application will have Full Control. The Calysto System Owners group is to be used
for provisioning new projects, support, and modifying/creating reports for use across the application
FIGURE 34: Calysto System Owners Permission Level

7.6.2. CALYSTO OWNERS
The Calysto Owners group for a project site is a derivative of SharePoint’s built in Contribute permission
set. Calysto owners are allowed to approve items in addition to all permissions in the Contribute
permission set.
FIGURE 35: Calysto Owners Permission Level

7.6.3. CALYSTO MEMBERS
The Calysto Members group for a project site is a copy of the standard SharePoint Contribute permission
set.
FIGURE 36: Calysto Members Permission Level

7.6.4. CALYSTO VISITORS
The Calysto Visitors group is a copy of the standard SharePoint Read permission set.
FIGURE 37: Calysto Visitors Permission Level