Caltrans Project Risk Management Handbook
65
P ROJECT R ISK M ANAGEMENT H ANDBOOK Threats and Opportunities Second Edition Revision 0 May 2, 2007 Office of Statewide Project Management Improvement (OSPMI)
Transcript of Caltrans Project Risk Management Handbook

PROJECT RISK MANAGEMENT
HANDBOOK Threats and Opportunities
Second Edition
Revision 0
May 2, 2007
Office of Statewide Project Management Improvement (OSPMI)

Office of Statewide Project Management Improvement (OSPMI) 1120 N Street, Mail Station 28 Sacramento, CA 95814 www.dot.ca.gov/hq/projmgmt Project Risk Management Handbook May 2, 2007 Second Edition, Rev 0
Preface
This handbook provides an overview of risk management (both threats and opportunities) at the California Department of Transportation (Department).
This version is effective as of May 2, 2007.
The project team thanks all individuals within and outside the Department for their support and contributions to the production of the Project Risk Management Handbook.
Purpose This document describes the basic concepts and processes that guide risk management planning and implementation during project development.
Audience Department project managers, functional managers, and other staff engaged in the delivery of capital projects.
Background The purpose of this handbook is to provide the districts with a complete and uniform approach to project risk management and to make the present policy/subject matter more useful and easier to understand.
Revisions The 2nd edition represents the first major update to the 1st edition.
Conventions Titles of books and other documents appear in italics. Website URLs appear in bold italics.
Like this example. Additional information, notes, and tips appear in the left margin.
Project Risk Management Handbook iii


C
CONTENTS
Preface .................................................................................................................................iii Purpose..........................................................................................................................iii Audience........................................................................................................................iii Background....................................................................................................................iii Revisions ........................................................................................................................iii Conventions...................................................................................................................iii
Figures ................................................................................................................................vii
Implementation of Risk Management in Project Delivery
Chief Engineer's Memorandum............................................................................... iX
Overview .................................................................................................................1 Why Risk Management? ....................................................................................................... 2
Definition ....................................................................................................................... 2 Objective........................................................................................................................ 2
Process Overview.....................................................................................................3 Key Success Factors for Project Risk Management………………………………………………………….4
Project Risk Management Process Flow Diagram .................................................................. 5 Processes and Outputs ......................................................................................................... 6 Key Responsibilities .............................................................................................................. 7
Project Risk Management Handbook v

C o n t e n t s
Process Steps ...........................................................................................................9 Risk Management Planning.................................................................................................10 Risk Identification ................................................................................................................11 Qualitative Risk Analysis ......................................................................................................13 Quantitative Risk Analysis....................................................................................................14
When to Use Quantitative Analysis................................................................................15 Risk Response Planning .......................................................................................................16 Risk Monitoring and Control ...............................................................................................19
Appendices............................................................................................................21 Appendix A: Sample Risk Management Plan (RMP) Template..............................................22
Appendix B: Risk breakdown structure ................................................................................27
Appendix C: Sample Risk List...............................................................................................29 Design Risks..................................................................................................................30 External Risks ................................................................................................................30 Environmental Risks ......................................................................................................31 Organizational Risks......................................................................................................32 Project Management Risks ............................................................................................32 Right of Way Risks .........................................................................................................33 Construction Risks ........................................................................................................33 Engineering Services Risks.............................................................................................34
Appendix D: Sample Risk Register .......................................................................................36 Appendix E: Risk Ranking ....................................................................................................39 Appendix F: References .......................................................................................................45
Glossary .................................................................................................................47
Acronyms...............................................................................................................51
Index .....................................................................................................................53
vi Project Risk Management Handbook

C o n t e n t s
Figures
Figure 1. Project Risk Management Process Flow Diagram ......................................................... 5
Figure 2. Sample Risk Register.................................................................................................. 36
Figure 3. Sample Probability x Impact (PxI) matrix for Threat ................................................... 42
Figure 4. Sample Probability x Impact (PxI) matrix for Opportunity .......................................... 42
Project Risk Management Handbook vii

Project Risk Management Handbook viii

Project Risk Management Handbook ix


1
OVERVIEW
This chapter defines:
Project risk and risk management
The objective of risk management within the Department
Project Risk Management Handbook 1

W h y R i s k M a n a g e m e n t ?
Why Risk Management?
The Capital Project Risk Management Process, described in this handbook, is intended to aid in the effective management of project risks, both threats and opportunities. The project manager (PM), project sponsor (Sponsor), and project team members (Project Development Team, PDT) jointly develop a written plan that enables them to identify, assess, quantify, prepare a response to, monitor, and control capital project risks.
Risk management goes further than planning, and the risk response actions planned and incorporated in a risk management plan need to be executed effectively and monitored for their effectiveness. The project manager should conduct frequent reviews of project risks and the progress made in addressing them, indicating where risks are being effectively handled and where additional actions and resources may be needed.
Project risk is an uncertain event or condition that, if it occurs, has a positive or a negative effect on at least one project objective. A risk may have one or more causes and, if it occurs, one or more impacts.1
Definition
Risk management is the systematic process of planning for, identifying, analyzing, responding to, and monitoring project risks. It involves processes, tools, and techniques that will help the project manager maximize the probability and results of positive events and minimize the probability and consequences of adverse events as indicated and appropriate within the context of risk to the overall project objectives of cost, time, scope and quality. Project risk management is most effective when first performed early in the life of the project and is a continuing responsibility throughout the project’s life cycle.
The project risk management process helps project sponsors and project teams make informed decisions regarding alternative approaches to achieving their objectives and the relative risk involved in each, in order to increase the likelihood of success in meeting or exceeding the most important objectives (e.g. time) sometimes at the expense of other objectives (e.g. cost). Risk management encourages the project team to take appropriate measures to:
Objective
Minimize adverse impacts to project scope, cost, and schedule (and quality, as a result).
Maximize opportunities to improve the project’s objectives with lower cost, shorter schedules, enhanced scope and higher quality.
Minimize management by crisis.
1A Guide to the Project Management Body of Knowledge (PMBOK® Guide), Third Edition, Chapter 11.
2 Project Risk Management Handbook
2
PROCESS OVERVIEW
This chapter describes key success factors, important documents of the process, associated tasks, outputs, and key responsibilities of project participants.
Project Risk Management Handbook 3
K e y S u c c e s s F a c t o r s f o r P r o j e c t R i s k M a n a g e m e n t
Key Success Factors for Project Risk Management
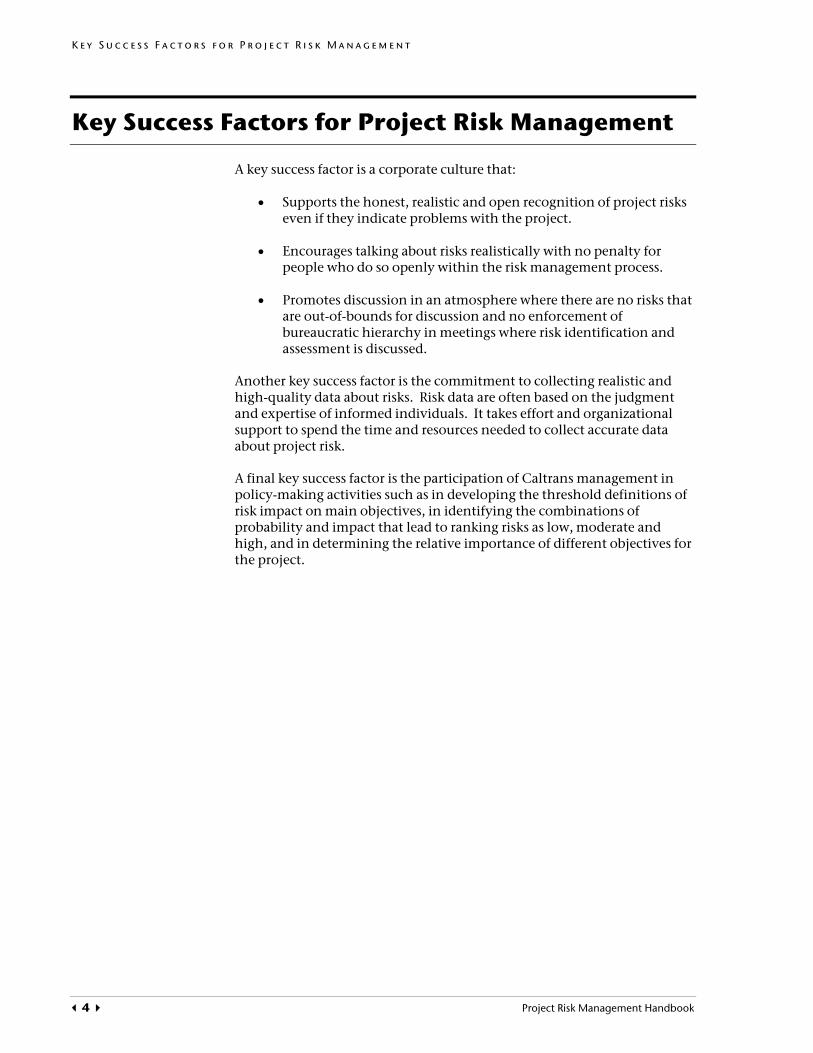
A key success factor is a corporate culture that:
• Supports the honest, realistic and open recognition of project risks even if they indicate problems with the project.
• Encourages talking about risks realistically with no penalty for people who do so openly within the risk management process.
• Promotes discussion in an atmosphere where there are no risks that are out-of-bounds for discussion and no enforcement of bureaucratic hierarchy in meetings where risk identification and assessment is discussed.
Another key success factor is the commitment to collecting realistic and high-quality data about risks. Risk data are often based on the judgment and expertise of informed individuals. It takes effort and organizational support to spend the time and resources needed to collect accurate data about project risk.
A final key success factor is the participation of Caltrans management in policy-making activities such as in developing the threshold definitions of risk impact on main objectives, in identifying the combinations of probability and impact that lead to ranking risks as low, moderate and high, and in determining the relative importance of different objectives for the project.
4 Project Risk Management Handbook

P r o j e c t R i s k M a n a g e m e n t P r o c e s s F l o w D i a g r a m
Project Risk Management Process Flow Diagram
The project team completes the risk management plan and the risk register (defined later in this Handbook) before the project initiation document (PID) component ends. The team updates the register regularly in each subsequent lifecycle component and continues to monitor and control risks throughout the life of the project.
Figure 1. Risk management process flow diagram
C onceptualize P ro ject S cope(R esponsib ility o f P ro ject M anager and Sponsor)
D ra ft P ro ject In itia tion D ocum ent(R esponsib ility of P ro ject M anager
and P ro ject Team )
D raft P ro ject W orkp lan w ith C ritica l Path
(R esponsib ility of P ro ject M anager and Support U n it)
R isk A ssessm ent(R esponsib ility o f P ro ject M anager and P ro ject Team )
A ssessm ent Inc ludes :(1 ) Identifica tion o f functional experts
(2) S cheduling the team m eeting(3) Identifica tion of s takeholders(4) U se o f facilita tor as needed
D raft W orkp lan and D raft P ro ject In itia tion D ocum ent(R esponsib ility o f P ro ject M anager and P ro ject Team
C ircu late and R espond to com m ents(R esponsib ility of P ro ject M anager and
P ro ject Team )
F ina lize P ro ject In itia tion D ocum ent and W orkp lan
(R esponsib ility of p ro ject M anager)
P rogram P roject(R esponsib ility o f P ro ject Sponsor)
U pdate , M on itor and C ontro l R isks Through The P ro ject D e livery C ycle
(R esponsib ility of P ro ject M anager and P ro ject Team )
C ircu lation C om m ents M ay
Ind ica te Add itiona l R isks
Project Risk Management Handbook 5

P r o c e s s e s a n d O u t p u t s
Processes and Outputs
This matrix shows the six main processes and all of the deliverables associated with project risk management.
Process Output(s) (deliverables)
Risk management planning Risk Management Plan (RMP)
Risk identification Risk Register (Register)
Qualitative risk analysis Risk Register (updates)
Prioritized list of risks classified as high, moderate, or low.
Quantitative risk analysis Quantitative Risk Analysis Reports
Numerical analysis of the project’s likelihood of achieving its overall objectives
(Risk Register updates)
Risk response planning 1- Risk Register (updates)
2- Project Management Plan (updates)
3- Project Risk Management Plan (updates)
4- Risk-related contractual agreements
The outcome may result in one or more of the following: residual risks, secondary risks, change control, contingency reserve (amounts of time or budget needed).
Risk monitoring and control Risk Register (updates)
The outcome may result in workaround plans, corrective actions, programming change request (PCR), and updates to risk identification checklists for future projects
6 Project Risk Management Handbook

K e y R e s p o n s i b i l i t i e s
Key Responsibilities
This matrix shows the six processes and the responsibilities of the project manager and stakeholders.
Role Process Tasks
Sponsor Deputy District Director, Program and Project Management
Project Manager
Project Manager Support/ Risk Officer
Project Team
Risk Owner
Risk management planning
C C R, A S S
Risk identification C C R S S
Qualitative risk analysis
R S S
Quantitative risk analysis (As applicable)
R S S
Risk response planning
C C R, A S S R
Risk monitoring and control
R S S R
Legend:
R = responsible
S = support
A = approve
C = concur
Project Risk Management Handbook 7

3
PROCESS STEPS
This chapter identifies and explains the six risk management processes:
1. Risk Management Planning
2. Risk Identification
3. Qualitative Risk Analysis
4. Quantitative Risk Analysis
5. Risk Response Planning
6. Risk Monitoring and Control
Project Risk Management Handbook 9

R i s k M a n a g e m e n t P l a n n i n g
Risk Management Planning
Careful and explicit planning enhances the possibility of success of the five other risk management processes. Risk Management Planning is the process of deciding how to approach and conduct the risk management activities for a project. Planning of risk management processes is important to ensure that the level, type, and visibility of risk management are commensurate with both the risk and importance of the project to the organization, to provide sufficient resources and time for risk management activities, and to establish an agreed-upon basis for evaluating risks. The Risk Management Planning process should be completed early during project planning, since it is crucial to successfully performing the other processes described in this handbook.1
Before starting project studies, the project manager establishes a PDT in accordance with Department policy. For details, see the “PDT Formation” sub-section of the Project Development Procedures Manual.
The result of Risk Management Planning is a Risk Management Plan. The risk management plan identifies and establishes the activities of risk management for the project in the project plan (RMP).
For a copy of Standard RMP template, see Appendix A. An electronic version of the template is also available on the Project Risk Management webpage. Please see project management guidance website at http://www.dot.ca.gov/hq/projmgmt/guidance.htm
10 Project Risk Management Handbook
R i s k I d e n t i f i c a t i o n
Risk Identification
Risk identification involves identifying potential project risks. Risk Identification produces a deliverable — the project Risk Register – where risks are identified that may affect the project’s ability to achieve its objectives. Risk Identification documents which risks might affect the project and documents their characteristics. The Risk Register is subsequently amended with the results from qualitative risk analysis and risk response planning, and is reviewed and updated throughout the project.
Participants in risk identification activities can include the following, where appropriate: project manager, project team members, risk management team (if assigned), subject matter experts both from the project and from outside the project team, customers, end users, other project managers, stakeholders, and risk management experts. While these personnel are often key participants for risk identification, all project personnel should be encouraged to identify risks.
Risk identification is an iterative process because new risks may become known as the project progresses through its life cycle and previously-identified risks may drop out. The frequency of iteration and who participates in each cycle will vary from case to case. The project team should be involved in the process so that they can develop and maintain a sense of ownership of, and responsibility for, the risks and associated risk response actions. Stakeholders outside the project team may provide additional objective information. The Risk Identification process is a requirement for the Qualitative Risk Analysis process.1
The assigned team members identify the potential risks (threats and opportunities), using:
The risk breakdown structure, suitably tailored to the project. An example of a risk breakdown structure is in Appendix B.
The sample risk list provided in Appendix C.
Their own knowledge of the project or similar projects.
Consultation with others who have significant knowledge of the project or its environment.
Consultation with others who have significant knowledge of similar projects.
Other tools and techniques such as those provided in Chapter 11, PMBOK.
It is important to specify the risk correctly. For instance, a risk has a cause and, if it occurs, an impact on a project objective. The risk statement structure that should be followed in specifying identified risks is: Because of the (cause, condition that is true), (a risk) may occur, leading to an impact (at this stage unanalyzed) on XX objective where XX is cost, time, scope and or quality.
Project Risk Management Handbook 11
R i s k I d e n t i f i c a t i o n
This structure helps specify the risk correctly.
As an example of the use of the risk statement structure, the fact that the bridge is built over water is not a risk, it is a cause. The risk may be unknown sub-surface conditions, which if they occur may lead to re-design of the supports. Mitigation could involve coring at the support location and engineering analysis based on the findings, to reduce the probability of unknown conditions.
In risk identification, sometimes there is a temptation to dismiss a risk because “we cannot do anything about it anyway”. This argument does not change the risk into a non-risk, simply because there is no viable mitigation strategy. The risk that cannot be mitigated may have an effect on the project and can be calibrated in qualitative and quantitative analysis. It is just not possible to handle this risk, but it is still a risk. Also, some of these risks may be affected by risk handling if people think carefully about it, for instance, political risk may be influenced by public outreach and information campaigns.
The team considers: Techniques for
identifying risks and opportunities are also taught in the Department’s Value Analysis courses.
Threats — a risk that will have a negative impact on a project objective if it occurs (what might happen to jeopardize the project’s ability to achieve its objectives)
Opportunities — a risk that will have a positive impact on a project objective if it occurs (what might happen to improve the project’s ability to achieve its objectives)
Triggers — symptoms and warning signs that indicate whether a risk is becoming a near-certain event and a contingency plan/response plan should be implemented.
The team should also consider:
The updated Risk Advertisement/Risk Vote guidance memo is posted on the project delivery intranet site. The new guidance requires use of the risk management register as part of the submittal.
Residual risks - Risks that remain even after developing responses to the project's original risks. Example: You identify delays caused by hazardous waste issues as one of your primary risks. If you are able to develop a response that mitigates only problems caused by underground fuel tanks, you may still have other hazardous waste risks. Your goal is to reduce residual risks to an acceptable level.
Secondary risks – Secondary risks are caused by responses to the project's original risks. For example, if you decide to hire outside help as a way of mitigating a project risk, you now have additional concerns that arise as a result of using the external vendor. The timeliness of their work and potential contractual disputes are risks you did not have before you decided to use their services.
Risk interaction - The combined effect of two or more risks occurring simultaneously is greater than the sum of the individual effects of each free standing risk. For instance, Federal budget cuts may increase delays in Federal Highway Administration permits at the same time federal programming dollars become scarcer.
12 Project Risk Management Handbook

Q u a l i t a t i v e R i s k A n a l y s i s
Qualitative Risk Analysis
Qualitative Risk Analysis includes methods for prioritizing the identified risks for further action, such as Quantitative Risk Analysis or Risk Response Planning. Organizations can improve the project’s performance effectively by focusing on high-priority risks.
Qualitative Risk Analysis assesses the priority of identified risks using their probability of occurring, the corresponding impact on project objectives if the risks do occur, as well as other factors such as the time frame and risk tolerance of the project constraints of cost, schedule, scope, and quality.1
Sometimes experts or functional units assess the risks in their respective fields and share these assessments with the team. Across the same project the definitions that will be used for levels of probability and impact should be the same.
The organization’s management, project customer or sponsor has an important role in the Qualitative Risk Analysis process.
The project sponsor defines for the risk analysis lead and team the levels of impact on time, cost, scope and quality that would qualify a risk as having a very low, low, moderate, high or very high impact on each objective.
The project sponsor determines the combinations of probability and impact that make a risk low, moderate and high priority for each objective in light of the definitions just mentioned.
Once the definitions are in place, team members assess the identified risks’ probability and impact and then put them into high, moderate, and low risk categories for each project objective (time, cost, scope, quality). They rank risks by degrees of probability and impact, using the definitions in place, and include their assessment rationale. For more information and a sample, see Appendix E: Risk Ranking.
Team members revisit qualitative risk analysis during the project’s lifecycle. When the team repeats qualitative analysis for individual risks, trends may emerge in the results. These trends can indicate the need for more or less risk management action on particular risks, or whether a risk mitigation plan is working.
Project Risk Management Handbook 13

Q u a n t i t a t i v e R i s k A n a l y s i s
Quantitative Risk Analysis
Quantitative risk analysis is a way of numerically estimating the probability that a project will meet its cost and time objectives. Quantitative analysis is based on a simultaneous evaluation of the impact of all identified and quantified risks. The result is a probability distribution of the project’s cost and completion date based on the identified risks in the project.
Quantitative risk analysis involves statistical techniques, primarily Monte Carlo simulation, that are most widely and easily used with specialized software.
Quantitative risk analysis starts with the model of the project, either its project schedule or its cost estimate depending on the objective. The degree of uncertainty in each schedule activity and each line-item cost element is represented by a probability distribution. The probability distribution is usually specified by determining the optimistic, the most likely and the pessimistic values for the activity or cost element – this is typically called the “3-point estimate.” The three points are estimated during an interview with subject matter experts who usually focus on the schedule or cost elements one at a time. The risks that lead to the three points are recorded for the quantitative risk analysis report and for risk response planning. For each activity or cost element a probability distribution type is chosen that best represents the risks discussed in the interview. Typical distributions usually include the triangular, beta, normal and uniform.
A specialized Monte Carlo simulation software program runs (iterates) the project schedule or cost estimate many times, drawing duration or cost values for each iteration at random from the probability distribution derived from the 3-point estimates and probability distribution types selected for each element. The Monte Carlo software develops from the results of the simulation a probability distribution of possible completion dates and project costs. From this distribution it is possible to answer such questions as:
• How likely is the current plan to come in on schedule or on budget?
• How much contingency reserve of time or money is needed to provide the agency with a sufficient degree of certainty?
• Using sensitivity analysis, which activities or line-item cost elements contribute the most to the possibility of overrunning schedule or cost targets?
Additional information on quantitative schedule and cost risk analysis are also available on the project management guidance website at http://www.dot.ca.gov/hq/projmgmt/guidance.htm
14 Project Risk Management Handbook

Q u a n t i t a t i v e R i s k A n a l y s i s
The Department does not require quantitative analysis for projects; however, the PDT or the District may determine that a project will need to undergo an in-depth quantitative risk analysis based on the cost, complexity or high profile of the project.
When to Use Quantitative Analysis
Project Risk Management Handbook 15

R i s k R e s p o n s e P l a n n i n g
Risk Response Planning
Risk Response Planning is the process of developing options, and determining actions to enhance opportunities and reduce threats to the project’s objectives. It focuses on the high-risk items evaluated in the qualitative and/or quantitative risk analysis. In Risk Response Planning parties are identified and assigned to take responsibility for each risk response. This process ensures that each risk requiring a response has an owner monitoring the responses, although a different party may be responsible for implementing the risk handling action itself.
The project manager and the PDT identify which strategy is best for each risk, and then design specific action(s) to implement that strategy.
Strategies for Negative Risks or Threats include:
Avoid. Risk avoidance involves changing the project plan to eliminate the risk or to protect the project objectives (time, cost, scope, quality) from its impact. The team might achieve this by changing scope, adding time, or adding resources (thus relaxing the so-called “triple constraint”).
These changes may require a Programming Change Request (PCR). Some negative risks (threats) that arise early in the project can be avoided by clarifying requirements, obtaining information, improving communication, or acquiring expertise.
Transfer. Risk transference requires shifting the negative impact of a threat, along with ownership of the response, to a third party. An example would be the team transfers the financial impact of risk by contracting out some aspect of the work.
Transference reduces the risk only if the contractor is more capable of taking steps to reduce the risk and does so. Risk transference nearly always involves payment of a risk premium to the party taking on the risk.
Transference tools can be quite diverse and include, but are not limited to the use of: insurance, performance bonds, warranties, guarantees, incentive/disincentive clauses, A+B Contracts, etc.
Mitigate. Risk mitigation implies a reduction in the probability and/or impact of an adverse risk event to an acceptable threshold. Taking early action to reduce the probability and/or impact of a risk is often more effective than trying to repair the damage after the risk has occurred.
Risk mitigation may take resources or time and hence may represent a tradeoff of one objective for another. However, it may still be preferable to going forward with an unmitigated risk.
16 Project Risk Management Handbook
R i s k R e s p o n s e P l a n n i n g
Monitoring the deliverables closely, increasing the number of parallel activities in the schedule, early involvement of regulatory agencies in the project, early and continuous outreach to communities/advocacy groups, implementing value engineering, performing corridor studies, adopting less complex processes, conducting more tests, or choosing a more stable supplier are examples of mitigation actions.
Strategies for Positive Risks or Opportunities include:
Exploit. The organization wishes to ensure that the opportunity is realized. This strategy seeks to eliminate the uncertainty associated with a particular upside risk by making the opportunity definitely happen. Examples include securing talented resources that may become available for the project.
Share. Allocating ownership to a third party who is best able to capture the opportunity for the benefit of the project. Examples include: forming risk-sharing partnerships, teams, working with elected officials, special-purpose companies, joint ventures, etc.
Enhance. This strategy modifies the size of an opportunity by increasing probability and/or positive impacts, and by identifying and maximizing key drivers of these positive-impact risks. Seeking to facilitate or strengthen the cause of the opportunity, and proactively targeting and reinforcing its trigger conditions, might increase probability. Impact drivers can also be targeted, seeking to increase the project’s susceptibility to the opportunity.
Strategy for both Threats and Opportunities:
Acceptance. A strategy that is adopted because it is either not possible to eliminate that risk from a project or the cost in time or money of the response is not warranted by the importance of the risk. When the project manager and the project team decide to accept a certain risk(s), they do not need to change the project plan to deal with that certain risk, or identify any response strategy other than agreeing to address the risk if and when it occurs. A workaround plan may be developed for that eventuality.
There are two types of acceptance strategy:
1- Active acceptance. The most common active acceptance strategy is to establish a contingency reserve, including amounts of time, money, or resources to handle the threat or opportunity.
i. Contingency Plan: Some responses are designed for use only if certain events occur. In this case, a response plan, also known as “Contingency Plan”, is developed by the project team that will only be executed under certain predefined conditions commonly called “triggers.”
Project Risk Management Handbook 17

R i s k R e s p o n s e P l a n n i n g
2- Passive acceptance. Requires no action leaving the project team to deal with the threats or opportunities as they occur.
i. Workaround:
Workaround is distinguished from contingency plan in that a workaround is a recovery plan that is implemented if the event occurs, whereas a contingency plan is to be implemented if a trigger event indicates that the risk is very likely to occur.
As with risk identification process, the team should also consider residual risks, secondary risks, and risk interaction in the risk response planning process. See page 10 for details.
18 Project Risk Management Handbook

R i s k M o n i t o r i n g a n d C o n t r o l
Risk Monitoring and Control
Risk monitoring and control keeps track of the identified risks, residual risks, and new risks. It also monitors the execution of planned strategies on the identified risks and evaluates their effectiveness.
Risk monitoring and control continues for the life of the project. The list of project risks changes as the project matures, new risks develop, or anticipated risks disappear.
Typically during project execution there should be regularly held risk meetings during which all or a part of the Risk Register is reviewed for the effectiveness of their handling and new risks are discussed and assigned owners. Periodic project risk reviews repeat the process of identification, analysis, and response planning. The project manager ensures that project risk is an agenda item at all PDT meetings. Risk ratings and prioritization commonly change during the project lifecycle.
If an unanticipated risk emerges, or a risk’s impact is greater than expected, the planned response may not be adequate. The project manager and the PDT must perform additional response planning to control the risk.
Risk control involves:
Choosing alternative response strategies
Implementing a contingency plan
Taking corrective actions
Re-planning the project, as applicable
The individual or a group assigned to each risk (risk owner) reports periodically to the project manager and the risk team leader on the status of the risk and the effectiveness of the response plan. The risk owner also reports on any unanticipated effects, and any mid-course correction that the PDT must consider in order to mitigate the risk.
Project Risk Management Handbook 19


A
APPENDICES
This chapter provides the documents referenced in the text.
Project Risk Management Handbook 21

A p p e n d i x A : S a m p l e R i s k M a n a g e m e n t P l a n T e m p l a t e
Appendix A: Sample Risk Management Plan Template
22 Project Risk Management Handbook

A p p e n d i x A : S a m p l e R i s k M a n a g e m e n t P l a n T e m p l a t e
Risk Management Plan
District____EA_______________ County________Route:_________PM________
Purpose
This document describes how Risk Management will be structured and performed on this project. The risk management plan includes methodology, roles and responsibilities, budgeting, timing, risk categories, definitions of risk probability and impact, probability and impact matrix, reporting formats, and tracking. The Caltrans Project Risk Management Handbook will be utilized as primary reference and guideline. A P P R O V E D B Y : ____________________________ ________________ Project Manager Date
Project Risk Management Handbook 23

A p p e n d i x A : S a m p l e R i s k M a n a g e m e n t P l a n T e m p l a t e
Roles and Responsibilities Project Manager responsibilities include:
♦ Incorporate the resources and time required to execute the Risk Management Plan in the project budget and schedule
♦ Develop, distribute and implement this Risk Management Plan
♦ Develop and update the Risk Register with the support of the Project Team and incorporate it into the workplan
♦ Coordinate with the risk owners to monitor risks and implement risk response strategies
Project Manager Support or Risk Officer responsibilities include:
♦ Support the Project Manager in developing and updating the Risk Management Plan and the Risk Register
♦ Maintain updates to the Risk Management Plan and the Risk Register
♦ Maintain a list of risk and response strategies of all the projects in the district
♦ Update the Sample Risk List and the lessons learned database (http://pd.dot.ca.gov/pm/PMPI/LessonsLearned/index.asp).
Project Team responsibilities include:
♦ Identify the risk and describe it
♦ Assess the probability that a risk will occur and specify the criteria used to assess the probability
♦ Assess the impact of risks on project cost, time, scope, and quality objectives, and specify the criteria used to assess the impact
♦ Help identify the risk owners and assist in developing the risk response strategies (Project Team members may be assigned as “Risk Owner”)
♦ Perform the risk response steps assigned
♦ Assist the PM in activities associated with Risk Monitoring and Control
Risk Owner responsibilities include:
♦ Develop and/or update the assigned risk response strategy
♦ Monitor the risk assigned and inform PM of any threats or opportunities to the project. This includes monitoring the risk trigger and informing the PM, if the risk becomes a real event.
24 Project Risk Management Handbook
A p p e n d i x A : S a m p l e R i s k M a n a g e m e n t P l a n T e m p l a t e
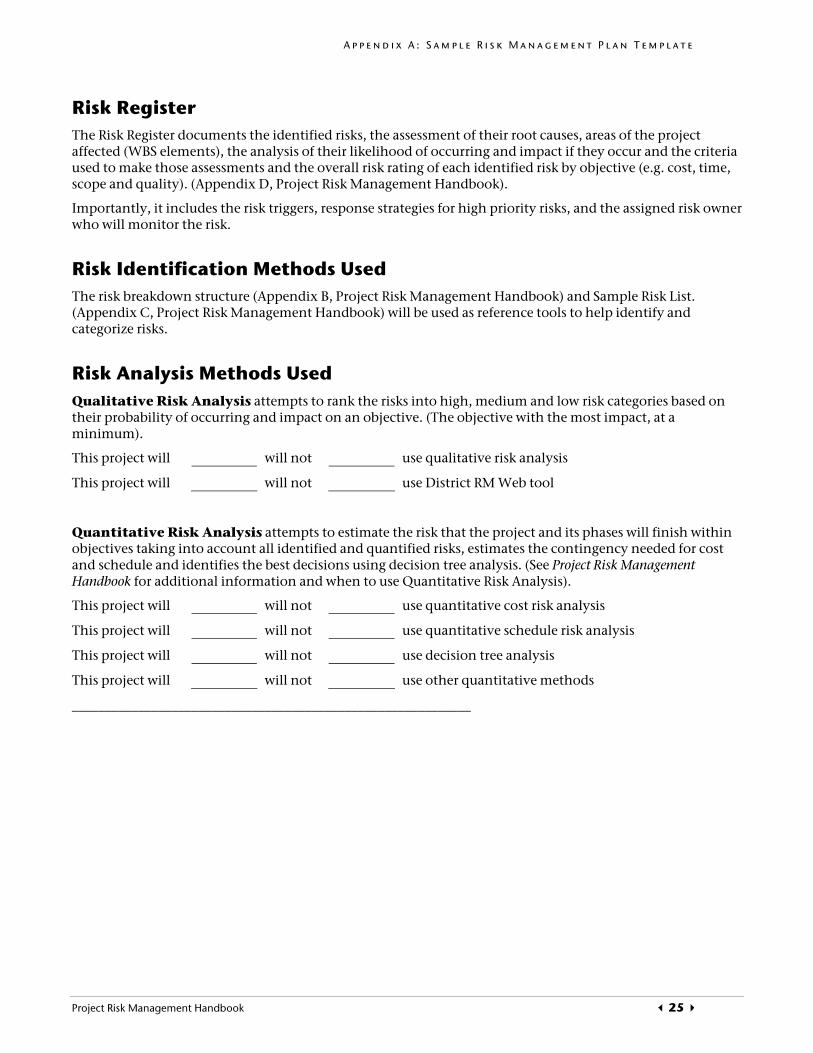
Risk Register The Risk Register documents the identified risks, the assessment of their root causes, areas of the project affected (WBS elements), the analysis of their likelihood of occurring and impact if they occur and the criteria used to make those assessments and the overall risk rating of each identified risk by objective (e.g. cost, time, scope and quality). (Appendix D, Project Risk Management Handbook).
Importantly, it includes the risk triggers, response strategies for high priority risks, and the assigned risk owner who will monitor the risk.
Risk Identification Methods Used The risk breakdown structure (Appendix B, Project Risk Management Handbook) and Sample Risk List. (Appendix C, Project Risk Management Handbook) will be used as reference tools to help identify and categorize risks.
Risk Analysis Methods Used Qualitative Risk Analysis attempts to rank the risks into high, medium and low risk categories based on their probability of occurring and impact on an objective. (The objective with the most impact, at a minimum).
This project will will not use qualitative risk analysis
This project will will not use District RM Web tool
Quantitative Risk Analysis attempts to estimate the risk that the project and its phases will finish within objectives taking into account all identified and quantified risks, estimates the contingency needed for cost and schedule and identifies the best decisions using decision tree analysis. (See Project Risk Management Handbook for additional information and when to use Quantitative Risk Analysis).
This project will will not use quantitative cost risk analysis
This project will will not use quantitative schedule risk analysis
This project will will not use decision tree analysis
This project will will not use other quantitative methods
____________________________________________________________
Project Risk Management Handbook 25
A p p e n d i x A : S a m p l e R i s k M a n a g e m e n t P l a n T e m p l a t e
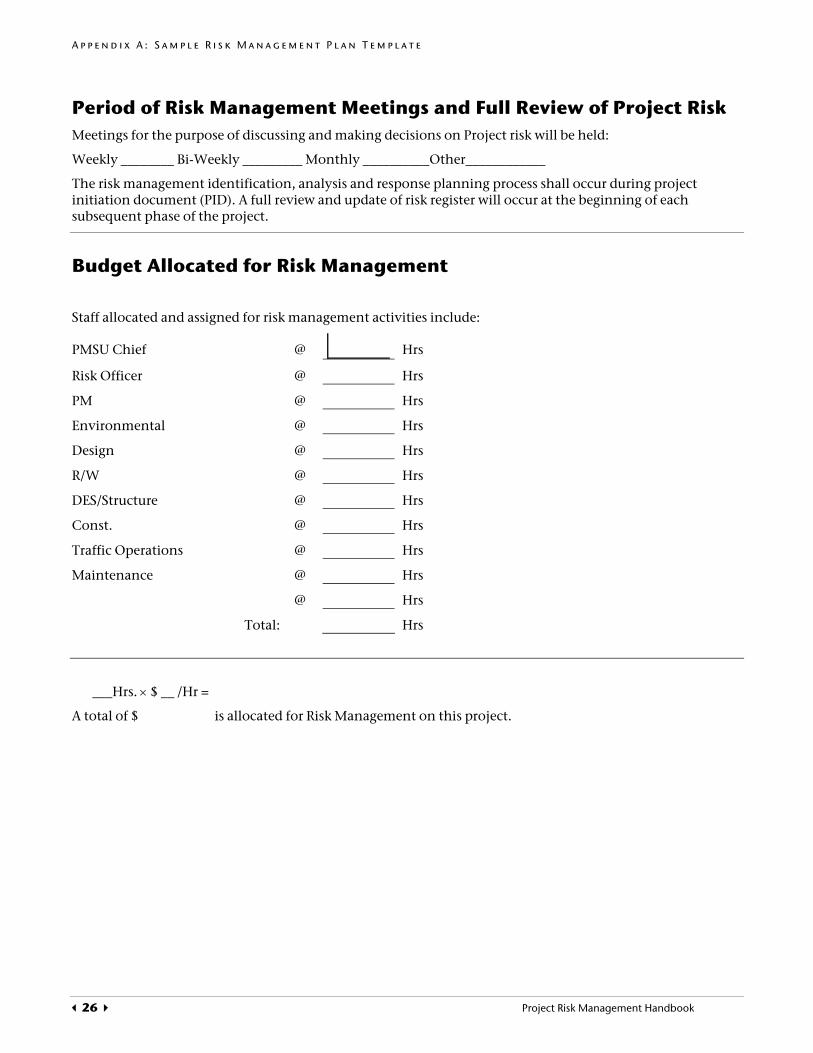
Period of Risk Management Meetings and Full Review of Project Risk Meetings for the purpose of discussing and making decisions on Project risk will be held:
Weekly ________ Bi-Weekly _________ Monthly __________Other____________
The risk management identification, analysis and response planning process shall occur during project initiation document (PID). A full review and update of risk register will occur at the beginning of each subsequent phase of the project.
Budget Allocated for Risk Management
Staff allocated and assigned for risk management activities include:
PMSU Chief @ Hrs
Risk Officer @ Hrs
PM @ Hrs
Environmental @ Hrs
Design @ Hrs
R/W @ Hrs
DES/Structure @ Hrs
Const. @ Hrs
Traffic Operations @ Hrs
Maintenance @ Hrs
@ Hrs
Total: Hrs
___Hrs. × $ __ /Hr =
A total of $ is allocated for Risk Management on this project.
26 Project Risk Management Handbook

A p p e n d i x B : R i s k b r e a k d o w n s t r u c t u r e
Appendix B: Risk breakdown structure
Project Risk Management Handbook 27

A p p e n d i x B : R i s k b r e a k d o w n s t r u c t u r e
28 Project Risk Management Handbook

A p p e n d i x C : S a m p l e R i s k L i s t
Appendix C: Sample Risk List
The process of risk identification produces a project risk list. The project team then puts the risks into categories and assigns each risk to a team member.
The project team members may use this sample risk checklist to help in developing a project specific risk list. This list is not meant to be all-inclusive; it is just a guide. Care should be taken to explore items that do not appear on this checklist. Team members add other risk areas from previous project results and as they arise during the project. Such sources might include:
Final project reports
Risk response plans
Organized lessons learned
The experience of project stakeholders or others in the organization
Published information such as commercial databases or academic studies
Project Risk Management Handbook 29
A p p e n d i x C : S a m p l e R i s k L i s t
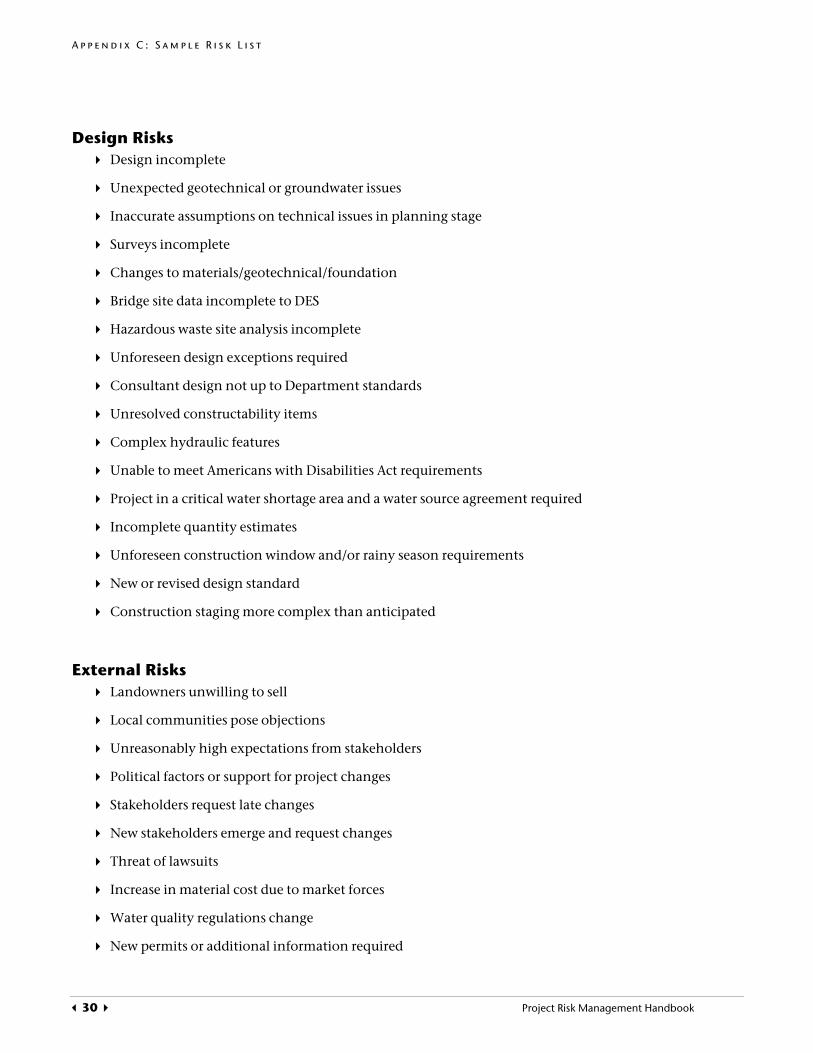
Design Risks Design incomplete
Unexpected geotechnical or groundwater issues
Inaccurate assumptions on technical issues in planning stage
Surveys incomplete
Changes to materials/geotechnical/foundation
Bridge site data incomplete to DES
Hazardous waste site analysis incomplete
Unforeseen design exceptions required
Consultant design not up to Department standards
Unresolved constructability items
Complex hydraulic features
Unable to meet Americans with Disabilities Act requirements
Project in a critical water shortage area and a water source agreement required
Incomplete quantity estimates
Unforeseen construction window and/or rainy season requirements
New or revised design standard
Construction staging more complex than anticipated
External Risks Landowners unwilling to sell
Local communities pose objections
Unreasonably high expectations from stakeholders
Political factors or support for project changes
Stakeholders request late changes
New stakeholders emerge and request changes
Threat of lawsuits
Increase in material cost due to market forces
Water quality regulations change
New permits or additional information required
30 Project Risk Management Handbook

A p p e n d i x C : S a m p l e R i s k L i s t
Reviewing agency requires longer than expected review time
Changes to storm-water requirements
Permits or agency actions delayed or take longer than expected
New information required for permits
Environmental regulations change
Controversy on environmental grounds expected
Pressure to deliver project on an accelerated schedule
Labor shortage or strike
Construction or pile driving noise and vibration impacting adjacent businesses or residents
Environmental Risks Environmental analysis incomplete
Availability of project data and mapping at the beginning of the environmental study is insufficient
New information after Environmental Document is completed may require re-evaluation or a new document (i.e. utility relocation beyond document coverage)
New alternatives required to avoid, mitigate or minimize impact
Acquisition, creation or restoration of on or off-site mitigation
Environmental clearance for staging or borrow sites required
Historic site, endangered species, riparian areas, wetlands and/or public park present
Design changes require additional Environmental analysis
Unforeseen formal NEPA/404 consultation is required
Unforeseen formal Section 7 consultation is required
Unexpected Section 106 issues expected
Unexpected Native American concerns
Unforeseen Section 4(f) resources affected
Project may encroach into the Coastal Zone
Project may encroach onto a Scenic Highway
Project may encroach to a Wild and Scenic River
Unanticipated noise impacts
Project causes an unanticipated barrier to wildlife
Project may encroach into a floodplain or a regulatory floodway
Project does not conform to the state implementation plan for air quality at the program and plan level
Project Risk Management Handbook 31
A p p e n d i x C : S a m p l e R i s k L i s t
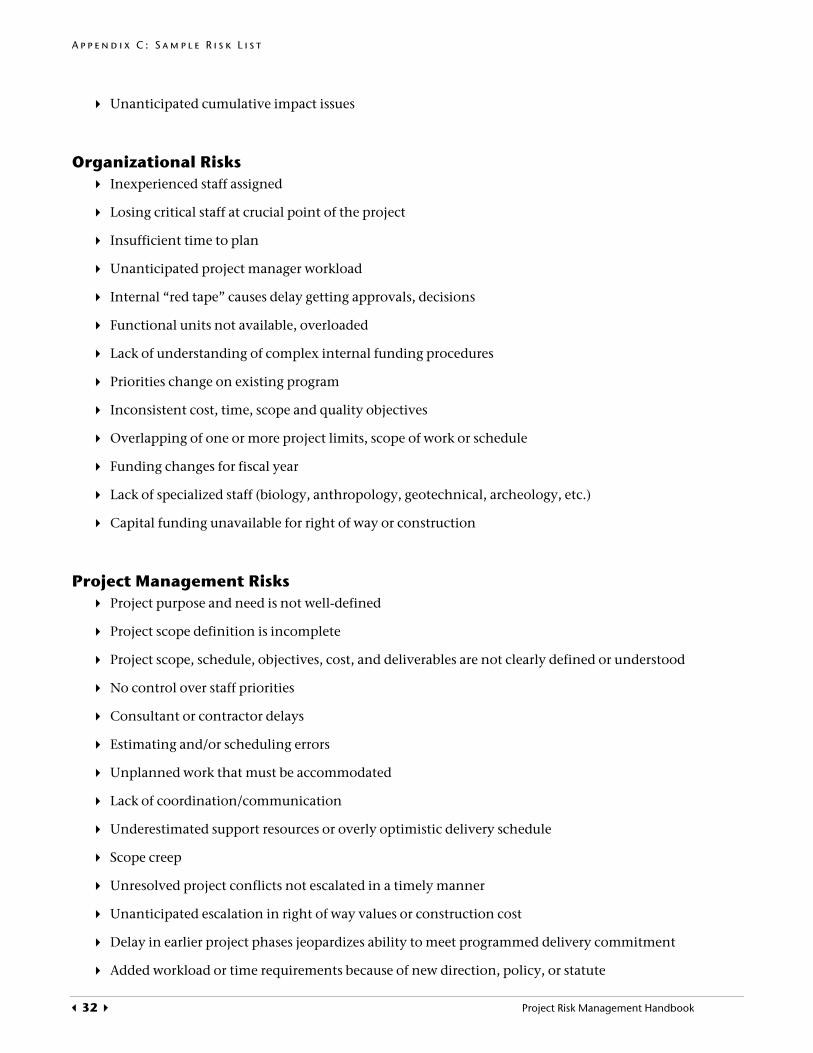
Unanticipated cumulative impact issues
Organizational Risks Inexperienced staff assigned
Losing critical staff at crucial point of the project
Insufficient time to plan
Unanticipated project manager workload
Internal “red tape” causes delay getting approvals, decisions
Functional units not available, overloaded
Lack of understanding of complex internal funding procedures
Priorities change on existing program
Inconsistent cost, time, scope and quality objectives
Overlapping of one or more project limits, scope of work or schedule
Funding changes for fiscal year
Lack of specialized staff (biology, anthropology, geotechnical, archeology, etc.)
Capital funding unavailable for right of way or construction
Project Management Risks Project purpose and need is not well-defined
Project scope definition is incomplete
Project scope, schedule, objectives, cost, and deliverables are not clearly defined or understood
No control over staff priorities
Consultant or contractor delays
Estimating and/or scheduling errors
Unplanned work that must be accommodated
Lack of coordination/communication
Underestimated support resources or overly optimistic delivery schedule
Scope creep
Unresolved project conflicts not escalated in a timely manner
Unanticipated escalation in right of way values or construction cost
Delay in earlier project phases jeopardizes ability to meet programmed delivery commitment
Added workload or time requirements because of new direction, policy, or statute
32 Project Risk Management Handbook
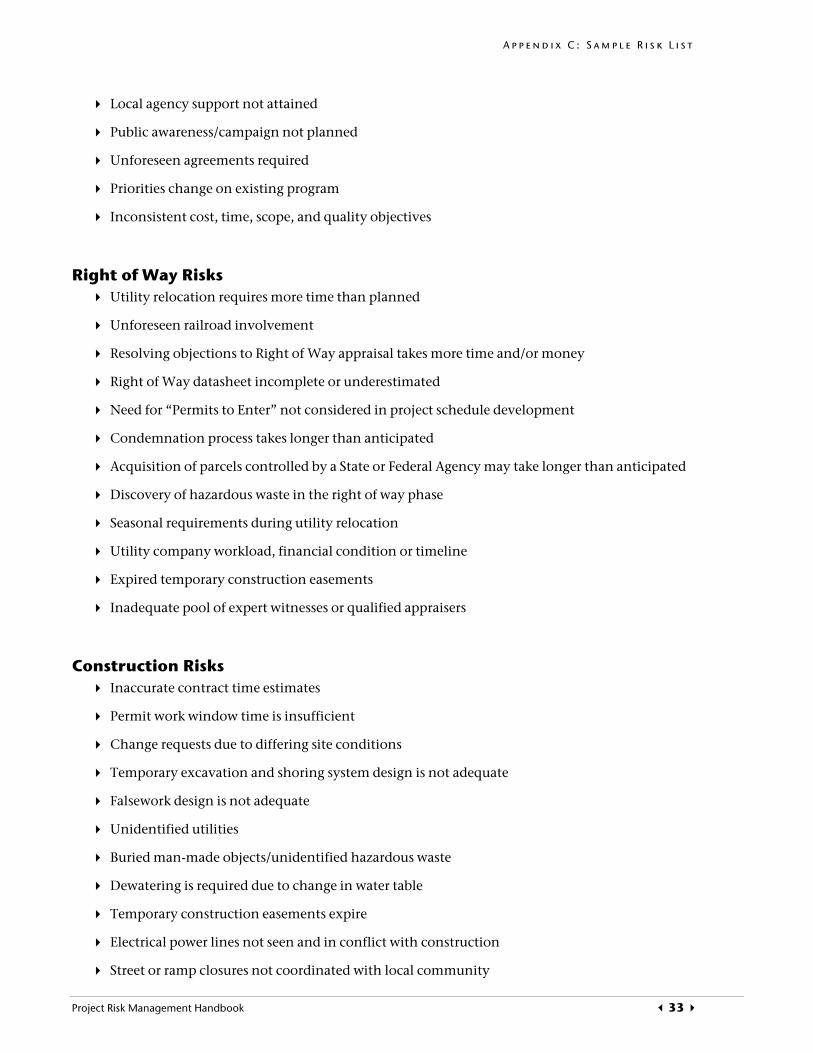
A p p e n d i x C : S a m p l e R i s k L i s t
Local agency support not attained
Public awareness/campaign not planned
Unforeseen agreements required
Priorities change on existing program
Inconsistent cost, time, scope, and quality objectives
Right of Way Risks Utility relocation requires more time than planned
Unforeseen railroad involvement
Resolving objections to Right of Way appraisal takes more time and/or money
Right of Way datasheet incomplete or underestimated
Need for “Permits to Enter” not considered in project schedule development
Condemnation process takes longer than anticipated
Acquisition of parcels controlled by a State or Federal Agency may take longer than anticipated
Discovery of hazardous waste in the right of way phase
Seasonal requirements during utility relocation
Utility company workload, financial condition or timeline
Expired temporary construction easements
Inadequate pool of expert witnesses or qualified appraisers
Construction Risks Inaccurate contract time estimates
Permit work window time is insufficient
Change requests due to differing site conditions
Temporary excavation and shoring system design is not adequate
Falsework design is not adequate
Unidentified utilities
Buried man-made objects/unidentified hazardous waste
Dewatering is required due to change in water table
Temporary construction easements expire
Electrical power lines not seen and in conflict with construction
Street or ramp closures not coordinated with local community
Project Risk Management Handbook 33
A p p e n d i x C : S a m p l e R i s k L i s t
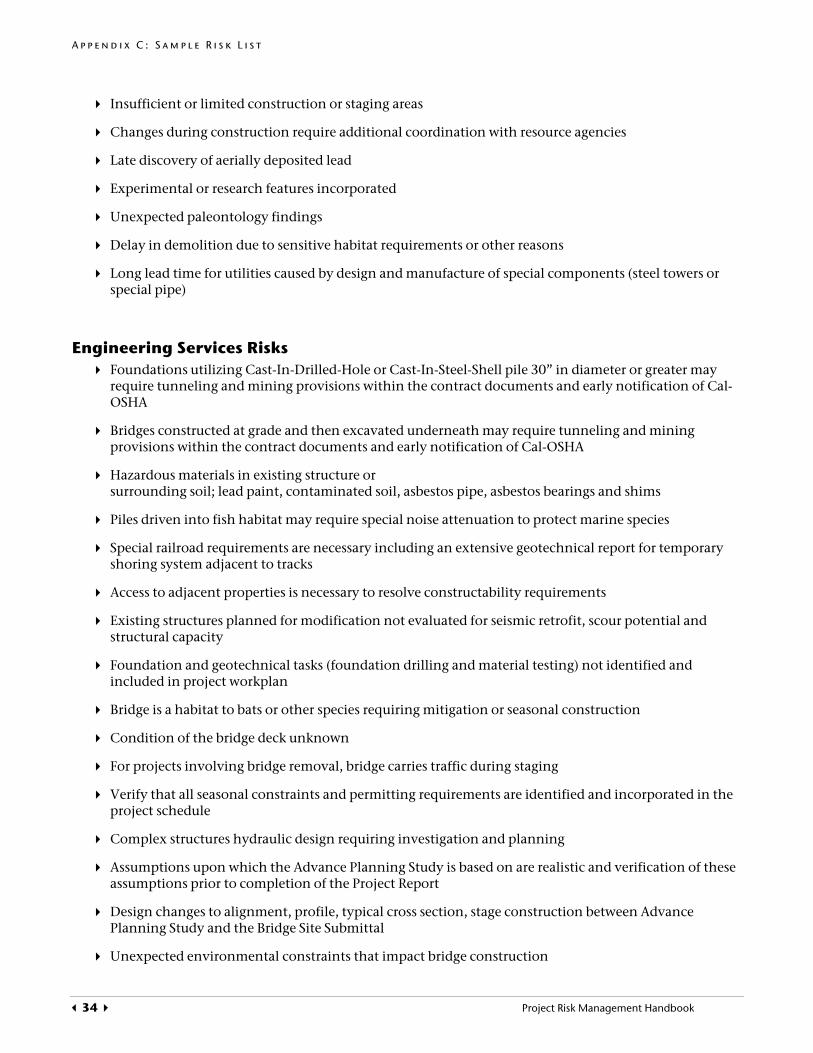
Insufficient or limited construction or staging areas
Changes during construction require additional coordination with resource agencies
Late discovery of aerially deposited lead
Experimental or research features incorporated
Unexpected paleontology findings
Delay in demolition due to sensitive habitat requirements or other reasons
Long lead time for utilities caused by design and manufacture of special components (steel towers or special pipe)
Engineering Services Risks Foundations utilizing Cast-In-Drilled-Hole or Cast-In-Steel-Shell pile 30” in diameter or greater may require tunneling and mining provisions within the contract documents and early notification of Cal-OSHA
Bridges constructed at grade and then excavated underneath may require tunneling and mining provisions within the contract documents and early notification of Cal-OSHA
Hazardous materials in existing structure or surrounding soil; lead paint, contaminated soil, asbestos pipe, asbestos bearings and shims
Piles driven into fish habitat may require special noise attenuation to protect marine species
Special railroad requirements are necessary including an extensive geotechnical report for temporary shoring system adjacent to tracks
Access to adjacent properties is necessary to resolve constructability requirements
Existing structures planned for modification not evaluated for seismic retrofit, scour potential and structural capacity
Foundation and geotechnical tasks (foundation drilling and material testing) not identified and included in project workplan
Bridge is a habitat to bats or other species requiring mitigation or seasonal construction
Condition of the bridge deck unknown
For projects involving bridge removal, bridge carries traffic during staging
Verify that all seasonal constraints and permitting requirements are identified and incorporated in the project schedule
Complex structures hydraulic design requiring investigation and planning
Assumptions upon which the Advance Planning Study is based on are realistic and verification of these assumptions prior to completion of the Project Report
Design changes to alignment, profile, typical cross section, stage construction between Advance Planning Study and the Bridge Site Submittal
Unexpected environmental constraints that impact bridge construction
34 Project Risk Management Handbook

A p p e n d i x C : S a m p l e R i s k L i s t
Unforeseen aesthetic requirements
Delay due to permits or agreements, from Federal, State, or local agencies for geotechnical subsurface exploration
Delay due to Right-of-Entry agreements for geotechnical subsurface exploration
Delay due to traffic management and lane closure for geotechnical subsurface exploration
Project Risk Management Handbook 35

Appendix D: Sample Risk Register
Using the sample risk list (Appendix C), the assigned project team members add their specific information to the risk register.
The following illustration shows a sample Excel spreadsheet that represents one possibility for what a risk register might include.
For a copy of the most recent electronic version of the risk register please visit the project management guidance Website at: http://www.dot.ca.gov/hq/projmgmt/guidance.htm
Project Risk Management Handbook 36

A p p e n d i x D : S a m p l e R i s k R e g i s t e r
Figure 2. Risk management plan spreadsheet sample
Project Risk Management Handbook 37

A p p e n d i x E : R i s k R a n k i n g
Appendix E: Risk Ranking
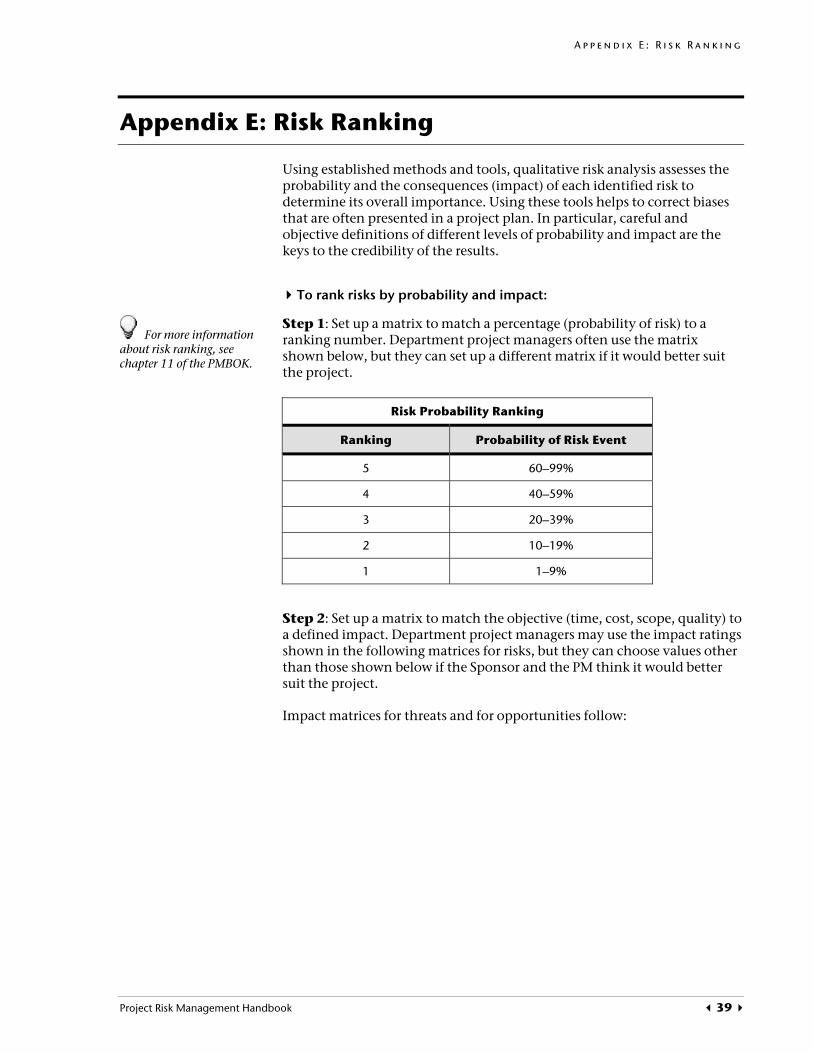
Using established methods and tools, qualitative risk analysis assesses the probability and the consequences (impact) of each identified risk to determine its overall importance. Using these tools helps to correct biases that are often presented in a project plan. In particular, careful and objective definitions of different levels of probability and impact are the keys to the credibility of the results.
To rank risks by probability and impact:
Step 1: Set up a matrix to match a percentage (probability of risk) to a ranking number. Department project managers often use the matrix shown below, but they can set up a different matrix if it would better suit the project.
For more information about risk ranking, see chapter 11 of the PMBOK.
Risk Probability Ranking
Ranking Probability of Risk Event
5 60–99%
4 40–59%
3 20–39%
2 10–19%
1 1–9%
Step 2: Set up a matrix to match the objective (time, cost, scope, quality) to a defined impact. Department project managers may use the impact ratings shown in the following matrices for risks, but they can choose values other than those shown below if the Sponsor and the PM think it would better suit the project.
Impact matrices for threats and for opportunities follow:
Project Risk Management Handbook 39

Evaluating Impact of a Threat on Major Project Objectives
Impact Very Low Low Moderate High Very High
Delivery Plan milestone delay outside fiscal year
Delivery Plan milestone delay of more than 1 quarter
Delivery Plan milestone delay of one quarter
Delivery Plan milestone delay within quarter
Insignificant Schedule Slippage Time
Insignificant Cost Increase
<5% Cost Increase
5-10% Cost Increase
10-20% Cost Increase
>20% Cost Increase Cost
Legend: C – Constructability, O – Operability, M – Maintainability
Legend: C – Constructability, O – Operability, M – Maintainability
Scope
Scope decrease is barely noticeable
Changes in project limits or features with <5% Cost Increase
Changes in project limits or features with 5-10% Cost Increase
Sponsor does not agree that Scope meets the purpose and need
Scope does not meet purpose and need
OB
JE
CT
IV
E
Quality degradation barely noticeable
No safety issues, C, O, M deficiencies approved by project team
No safety issues, C, O, M deficiencies require District management approval
Quality may be made acceptable through mitigation or agreement (i.e. Fact Sheet)
Quality does not meet one or all of the following Safety, C, O, & M
Quality
Evaluating Impact of an OPPORTUNITY on Major Project Objectives
Impact Very Low Low Moderate High Very High
Delivery Plan milestone improved by more than one quarter
Delivery Plan milestone does not improve but float is added
Delivery Plan milestone improves but still within the quarter
Delivery Plan milestone improves by 1 quarter.
Insignificant Schedule Improvement
Time
Insignificant Cost reduction
<1% Cost Decrease
1% - 3% Cost Decrease
3%-5% Cost Decrease
>5% Cost Decrease Cost
Scope Scope effect is not noticeable
Improves chances to achieve project limits or featureswith cost increases of 10% or more
Improves chances to achieve project limits or features with cost increases of 5%-10%
Improves chances to achieve project limits or features with cost increases of 2%-5%
Improves chances to achieve project limits or features with cost increases of < 2%
OB
JE
CT
IV
E
C, O, M improvement noticeable by project team
C, O, M improvement can be seen and measured
Quality improvement can be claimed for the project
Quality No quality improvement noticeable
Quality improvement is "best in class"
40 Project Risk Management Handbook
A p p e n d i x E : R i s k R a n k i n g
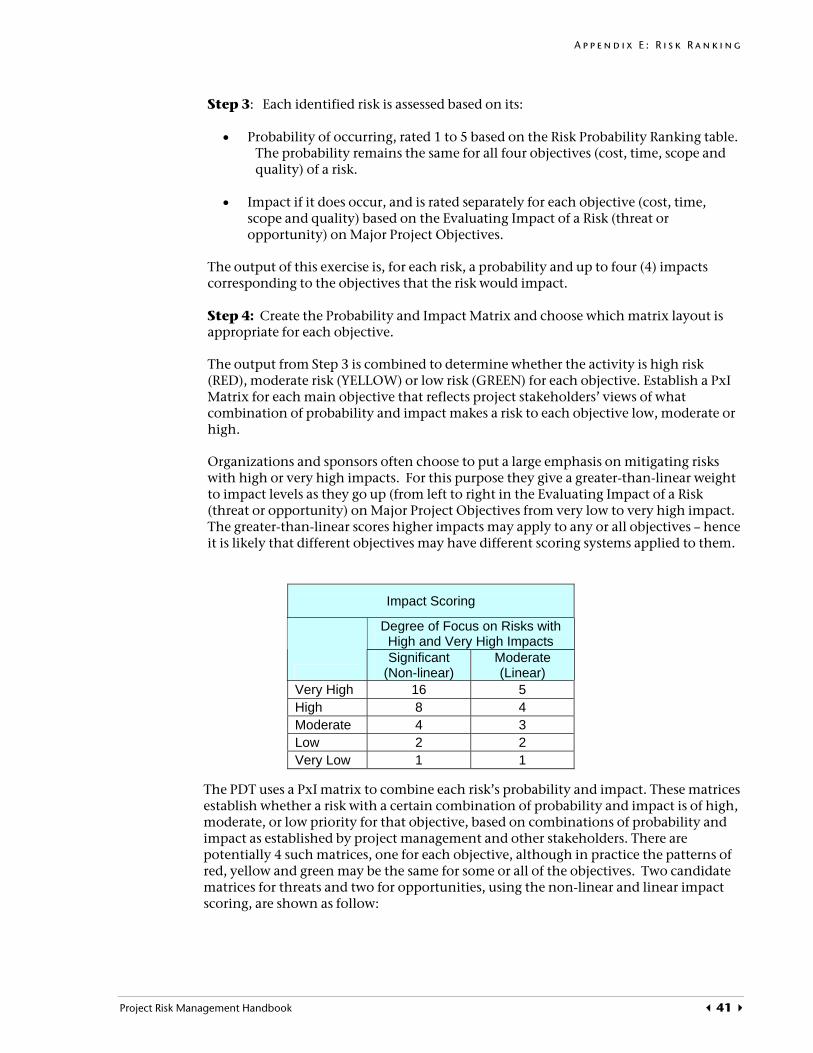
Step 3: Each identified risk is assessed based on its:
• Probability of occurring, rated 1 to 5 based on the Risk Probability Ranking table. The probability remains the same for all four objectives (cost, time, scope and quality) of a risk.
• Impact if it does occur, and is rated separately for each objective (cost, time, scope and quality) based on the Evaluating Impact of a Risk (threat or opportunity) on Major Project Objectives.
The output of this exercise is, for each risk, a probability and up to four (4) impacts corresponding to the objectives that the risk would impact.
Step 4: Create the Probability and Impact Matrix and choose which matrix layout is appropriate for each objective.
The output from Step 3 is combined to determine whether the activity is high risk (RED), moderate risk (YELLOW) or low risk (GREEN) for each objective. Establish a PxI Matrix for each main objective that reflects project stakeholders’ views of what combination of probability and impact makes a risk to each objective low, moderate or high.
Organizations and sponsors often choose to put a large emphasis on mitigating risks with high or very high impacts. For this purpose they give a greater-than-linear weight to impact levels as they go up (from left to right in the Evaluating Impact of a Risk (threat or opportunity) on Major Project Objectives from very low to very high impact. The greater-than-linear scores higher impacts may apply to any or all objectives – hence it is likely that different objectives may have different scoring systems applied to them.
Impact Scoring
Degree of Focus on Risks with High and Very High Impacts
Significant Moderate
(Non-linear) (Linear) Very High 16 5 High 8 4 Moderate 4 3 Low 2 2 Very Low 1 1
The PDT uses a PxI matrix to combine each risk’s probability and impact. These matrices establish whether a risk with a certain combination of probability and impact is of high, moderate, or low priority for that objective, based on combinations of probability and impact as established by project management and other stakeholders. There are potentially 4 such matrices, one for each objective, although in practice the patterns of red, yellow and green may be the same for some or all of the objectives. Two candidate matrices for threats and two for opportunities, using the non-linear and linear impact scoring, are shown as follow:
Project Risk Management Handbook 41

42 Project Risk Management Handbook
Option 1: PxI Matrix for Significant Focus on High and Very High Impacts
(Non-linear Impact Scoring)
Option 2: PxI Matrix for Moderate Focus on High and Very High Impacts (Linear Impact Scoring)
Probability Threats Probability Threats
5 5 10 20 40 80 5 5 10 15 20 25
4 4 8 16 32 64 4 4 8 12 16 20
3 3 6 12 24 48 3 3 6 9 12 15
2 2 4 8 16 32 2 2 4 6 8 10
1 1 2 4 8 16 1 1 2 3 4 5
1 2 4 8 16 1 2 3 4 5
Impact on Selected Objective
Impact on Selected Objective
Option 1: PxI Matrix for Significant Focus on High and Very High Impacts
(Non-linear Impact Scoring)
Option 2: PxI Matrix for Moderate Focus on High and Very High Impacts (Linear Impact Scoring)
Probability Opportunities Probability Opportunities
5 5 10 20 40 80 5 5 10 15 20 25
4 4 8 16 32 64 4 4 8 12 16 20
3 3 6 12 24 48 3 3 6 9 12 15
2 2 4 8 16 32 2 2 4 6 8 10
1 1 2 4 8 16 1 1 2 3 4 5
1 2 4 8 16 1 2 3 4 5
Impact on Selected Objective
Impact on Selected Objective
Figure 3. Sample PxImatrices
Translate Score to Risk Rank
Score Risk
1 – 6 Low
7 – 14 Moderate
15 – ++ High

A p p e n d i x E : R i s k R a n k i n g
The risk scores shown in the Risk Register for each objective reflect the PxI matrix chosen for impact on that particular objective. In the Risk Register the risks can then be displayed by high, moderate, and low groupings for each of the four objectives (time, cost, scope, quality) and for threats as well as opportunities. Department project managers often use the PxI matrices shown above, but they can set up a different matrix and assign different scores if it would better suit the project.
Some Department project managers use a PxI matrix based on narrative probabilities and impacts (very low, low, moderate, high, very high) rather than numerical ones.
Project Risk Management Handbook 43

44 Project Risk Management Handbook

A p p e n d i x F : R e f e r e n c e s
Appendix F: References
For more information about risk and risk management, see:
Chapter 11 of A Guide to Project Management Body of Knowledge (PMBOK® Guide), Third Edition, or later
Chapter 11 of the Government Extension to a Guide to the Project Management Body of Knowledge, 2000 Edition or later
Department Guide to Capital Project Work Breakdown Structure, Release 8.0 or later
project management guidance website at http://www.dot.ca.gov/hq/projmgmt/guidance.htm
Project Risk Management Handbook 45

46 Project Risk Management Handbook
G
GLOSSARY
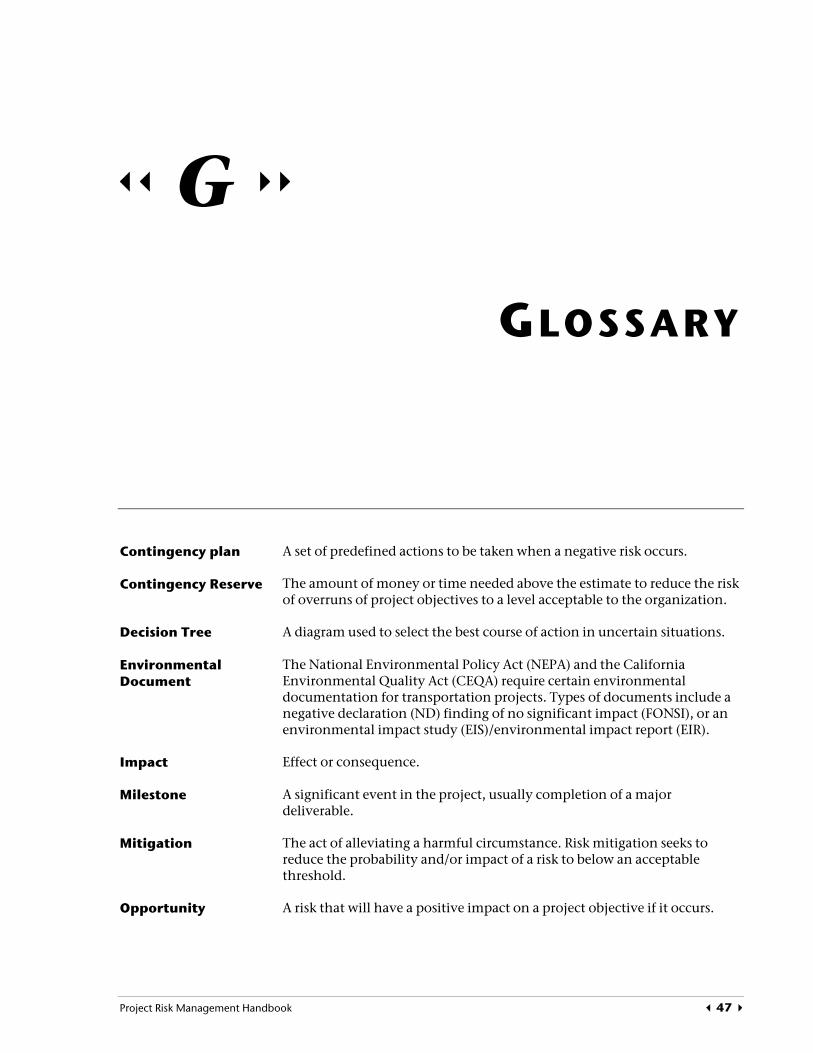
A set of predefined actions to be taken when a negative risk occurs. Contingency plan
The amount of money or time needed above the estimate to reduce the risk of overruns of project objectives to a level acceptable to the organization.
Contingency Reserve
A diagram used to select the best course of action in uncertain situations. Decision Tree
The National Environmental Policy Act (NEPA) and the California Environmental Quality Act (CEQA) require certain environmental documentation for transportation projects. Types of documents include a negative declaration (ND) finding of no significant impact (FONSI), or an environmental impact study (EIS)/environmental impact report (EIR).
Environmental Document
Effect or consequence. Impact
A significant event in the project, usually completion of a major deliverable.
Milestone
The act of alleviating a harmful circumstance. Risk mitigation seeks to reduce the probability and/or impact of a risk to below an acceptable threshold.
Mitigation
A risk that will have a positive impact on a project objective if it occurs. Opportunity
Project Risk Management Handbook 47

G l o s s a r y
Likelihood of the occurrence of any event. Probability Any significant changes to the scope, cost, or schedule of a programmed project (STIP, SHOPP, or TCRP) or special program project (toll seismic retrofit, soundwall) require a revision to the delivery commitment.
Program Change Request
2
An interdisciplinary team composed of key members of the project team as well as external stakeholders, that acts as a steering committee in directing the course of studies required to evaluate the various project alternatives during the early components of the project lifecycle.
Project Development Team
Concept approval document for candidate projects that contains: Project Initiation Document A defined project scope
A reliable capital and support cost estimate for each alternative solution
A project schedule (workplan) for the alternative recommended for programming the project
A particular goal of a project. All projects have these four objectives: Project Objective
Scope
Schedule
Cost
Quality
An uncertain event or condition that, if it occurs, has a positive or negative impact on at least one project objective.
Project Risk
Risks that remain even after developing responses to the project's original risks Residual Risk
The combined effect of two or more risks occurring simultaneously greater than the sum of the individual effects of each free standing risk.
Risk Interaction
A person assigned to monitor and maintain the project risk management activities/risk registers for all the projects in the district (District specific).
Risk Officer
2 Project Change Requests, memo dated September 21, 2002, Number 006 http://pd.dot.ca.gov/pm/ProjectOffice/ProcessGuidance_Directives/Guidance_DirectivesHome.asp
(Project Change Request is now referred to as Program Change Request).
48 Project Risk Management Handbook

A p p e n d i x F : R e f e r e n c e s
A person assigned to monitor the risk(s) and inform the project manager of any changes in the status of the risk.
Risk Owner
Secondary risks are caused by responses to the project's original risks. Secondary Risks
Encompasses the work that must be done to deliver a product with the specified features and functions.
Scope
A risk that will have a negative impact on a project objective if it occurs. Threat
Symptoms and warning signs that indicate whether a risk is becoming a near-certain event and a contingency plan/response plan should be implemented.
Trigger
A multi-disciplined team systematically applies recognized techniques to: Value Analysis
Identify the function of a product or service
Establish a worth for that function
Generate alternatives through the use of creative thinking
Reliably provide the needed functions at the lowest overall cost
The term is often interchanged with Value Engineering.
A team that performs value engineering. Value Analysis Team
A resourced schedule. The workplan identifies the project-specific WBS elements and defines the cost, timeline, and requirements for each. The current workplan guides the day-to-day operations of project execution and project control.
Workplan
Project Risk Management Handbook 49


A
ACRONYMS
California Environmental Quality Act CEQA
Environmental Impact Report EIR
Environmental Impact Study EIS
Finding of No Significant Impact FONSI
Negative Declaration ND
National Environmental Policy Act NEPA
Programming Change Request (Formerly Project Change Request) PCR
Project Development Team PDT
Project Initiation Document PID
Project Management Body of Knowledge PMBOK
Project Study Report PSR
Probability and Impact PxI
Risk breakdown structure Rbs
Project Risk Management Handbook 51
A c r o n y m s
Resource Breakdown Structure (Caltrans) RBS
Risk Management Plan RMP
State Highway Operation & Protection Program SHOPP
Subject Matter Expert SME
State Transportation Improvement Program STIP
Traffic Congestion Relief Program TCRP
Value Analysis VA
Work Breakdown Structure WBS
52 Project Risk Management Handbook

I
INDEX
A
design risks......................................................30 acceptance................................................ 17, 18
deputy district director for project and program management..................................7
assessment............................................ 4, 13, 25
avoidance ....................................................... 16
E C
engineering services risks................................34 categories of risk ....................................... 13, 29
environmental risks........................................31 change request ......................................See PCR. expert.......................................11, 13, 14, 33, 52 chief engineer............................................... 5, 9 external risks...................................................30 component........................................... 5, 34, 48
consequence......................................... 2, 39, 47 F construction risks ........................................... 33
flow diagram, risk management process...........5 contractor/consultant ........................ 16, 30, 32 functional manager ............................. iii, 13, 32 controlling risk ............................................... 19 functional unit..........................................13, 32
D funding ...........................................................32
degrees of risk ................................................. 13 I deliverables................................6, 11, 17, 32, 47
identifying risk ............................... 6, 11, 19, 29
Project Risk Management Handbook 53

I n d e x
quantitative analysis........................... 12, 14, 15 impact ............ 2, 4, 11, 16, 24, 31, 34, 39, 47, 51
L R lifecycle ...........................................5, 13, 19, 48 ranking risk.....................................................39
list...................................................... See risk list references........................................................45
regulatory risks ........................ See external risks
M residual risks ..............................6, 12, 18, 19, 48
response plan...........................12, 17, 19, 29, 49 mitigation ..............12, 13, 16, 17, 31, 34, 40, 47
response planning . 6, 7, 9, 11, 13, 14, 16, 18, 26 monitoring risk ................. 2, 6, 7, 16, 17, 19, 24
responsibilities.................................. 3, 7, 23, 24
right of way risks.............................................33 N risk
numeric analysis ......... See quantitative analysis advertisement.............................................12
breakdown structure...................................27
O categories..............................................13, 29
definition...................................... 2, 4, 13, 23
degrees........................................................13 objectives .... 2, 4, 6,11, 16, 24, 32, 40, 43, 47, 48 identification..4, 6, 7, 9, 11, 18, 19, 25, 26, 29 organizational risks ........................................ 32 list .............................. 6, 11, 19, 24, 25, 29, 36
outputs ............................................................. 6 management plan ......... 2, 5, 6, 10, 22, 24, 52
management planning................... 6, 7, 9, 10
P management process flow diagram ..............5
monitoring and control.............6, 7, 9, 19, 24 PCR....................................................... 6, 16, 51
officer ......................................... 7, 24, 26, 28 PDT................................ 2, 10, 15, 16, 19, 41, 51 qualitative analysis .....................................13
quantitative analysis ...................... 12, 14, 15 PID........................................................ 5, 26, 51
response planning ....... 6, 9, 11, 13, 16, 18, 26 probability............2, 4, 12, 16, 23, 39, 41, 47, 51 vote.............................................................12
probability and impact matrix ....................... 42 roles ..........................................................23, 24
programming change request ................See PCR
project change request ...........................See PCR
S project development team .....................See PDT
project initiation document....................See PID secondary risks................................ 6, 12, 18, 49
project management risks .............................. 32 specialist ............................................. See expert
project manager support ............................ 7, 24 sponsor ..................................2, 7, 13, 39, 40, 41
project manager..7, 10, 16, 19, 23, 32, 39, 43, 49 spreadsheet, register .................................36, 37
project sponsor...................... 2, 7, 13, 39, 40, 41 stakeholder ..........................7, 11, 29, 30, 41, 48
project team ...........2, 5, 7, 11, 17, 18, 29, 40, 48
T PxI matrix....................................................... 42
task manager.............................See project team
Q tasks ........................................................ 3, 7, 34
qualitative analysis......................................... 13 transference ....................................................16
54 Project Risk Management Handbook

I n d e x
trends ............................................................. 13
V value analysis ..................................... 12, 49, 52
W workplan .......................................24, 34, 48, 49
Project Risk Management Handbook 55