Calorimetry and scanning thermal measurementscmp.physics.iastate.edu/canfield/course/Calorimetry and...
36
Calorimetry and scanning thermal measurements R W McCallum Ames Laboratory And Materials Science and Engineering
Transcript of Calorimetry and scanning thermal measurementscmp.physics.iastate.edu/canfield/course/Calorimetry and...
Calorimetry and scanning thermal measurements
R W McCallumAmes Laboratory
And
Materials Science and Engineering
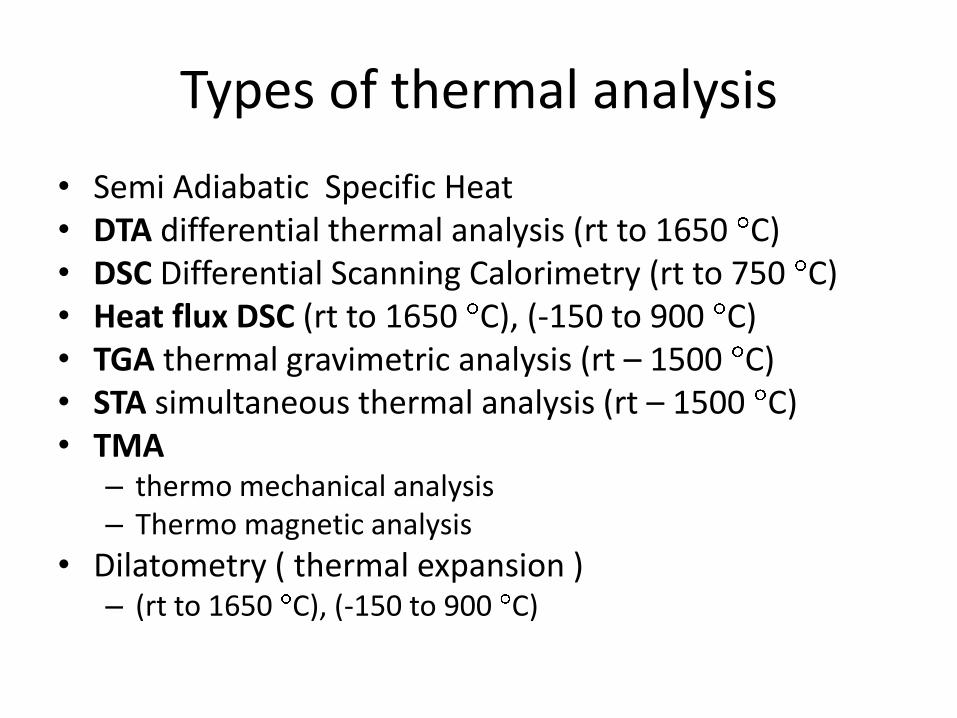
Types of thermal analysis
• Semi Adiabatic Specific Heat• DTA differential thermal analysis (rt to 1650 C)• DSC Differential Scanning Calorimetry (rt to 750 C)• Heat flux DSC (rt to 1650 C), (-150 to 900 C)• TGA thermal gravimetric analysis (rt – 1500 C)• STA simultaneous thermal analysis (rt – 1500 C)• TMA
– thermo mechanical analysis– Thermo magnetic analysis
• Dilatometry ( thermal expansion ) – (rt to 1650 C), (-150 to 900 C)
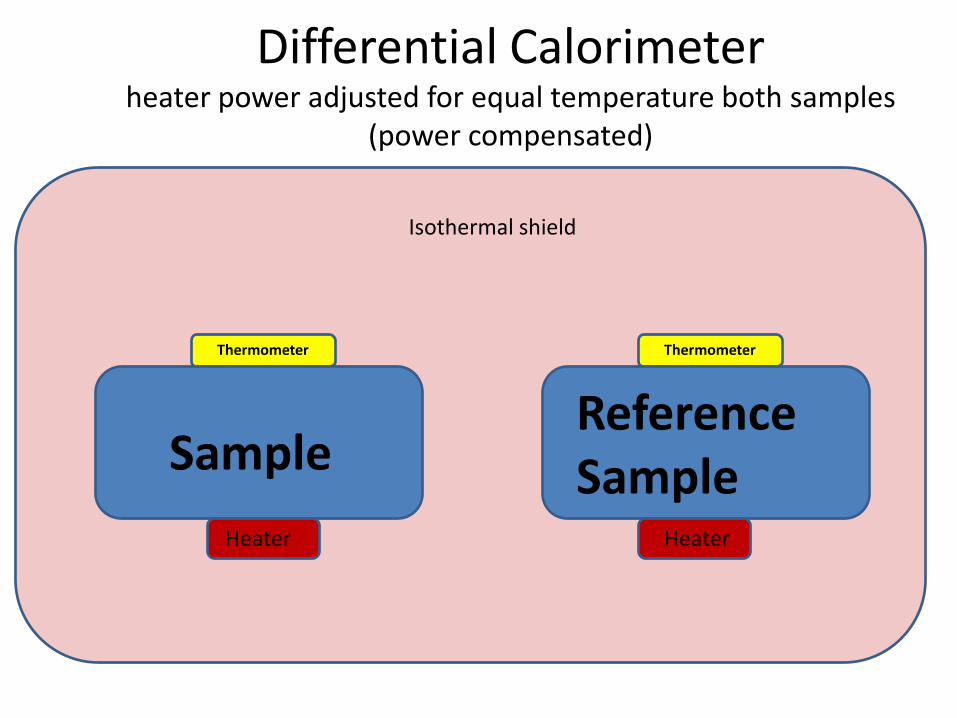
Differential Calorimeterheater power adjusted for equal temperature both samples
(power compensated)
Reference Sample
Thermometer
Heater
Isothermal shield
Sample
Thermometer
Heater
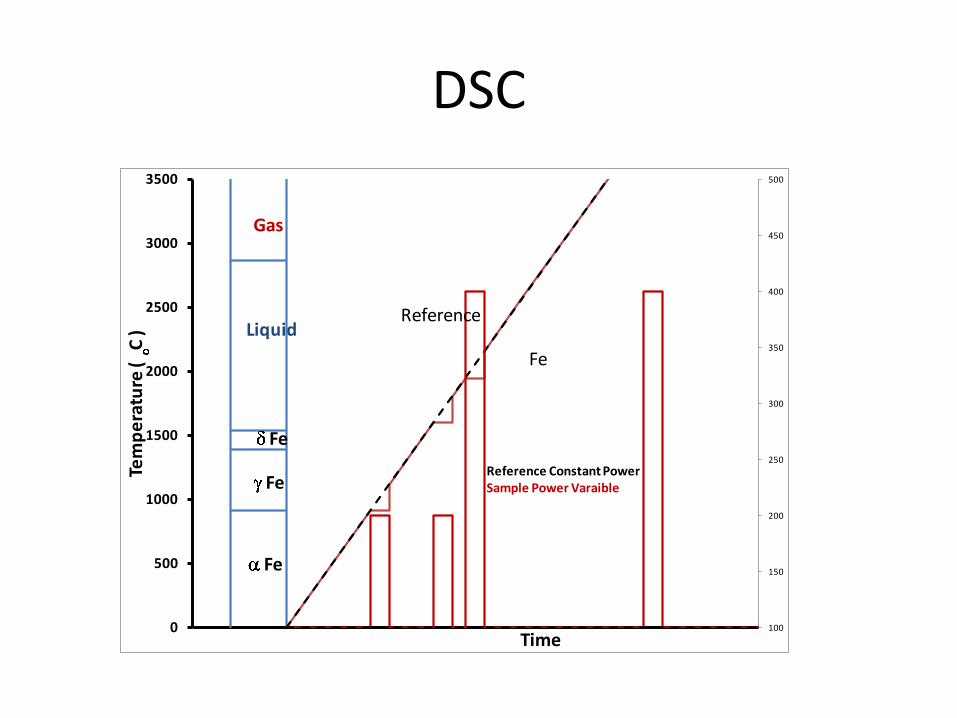
DSC
100
150
200
250
300
350
400
450
500
0
500
1000
1500
2000
2500
3000
3500
Tem
pe
ratu
re (
C )
Time
Gas
Liquid
Fe
Fe
Fe
Reference
Fe
Reference Constant PowerSample Power Varaible
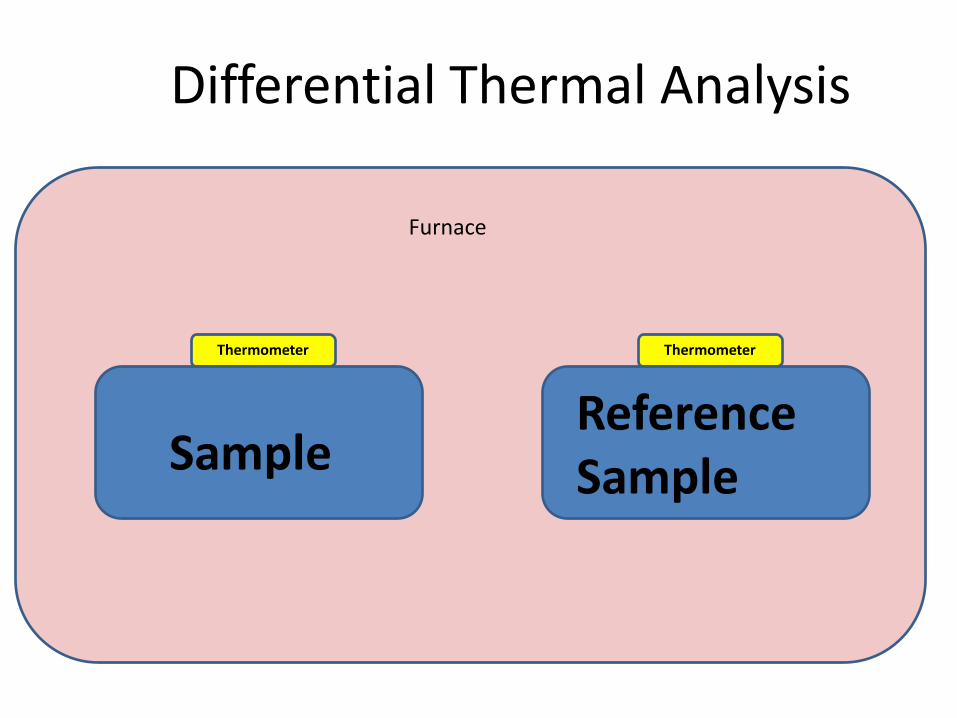
Differential Thermal Analysis
Reference Sample
Thermometer
Furnace
Sample
Thermometer
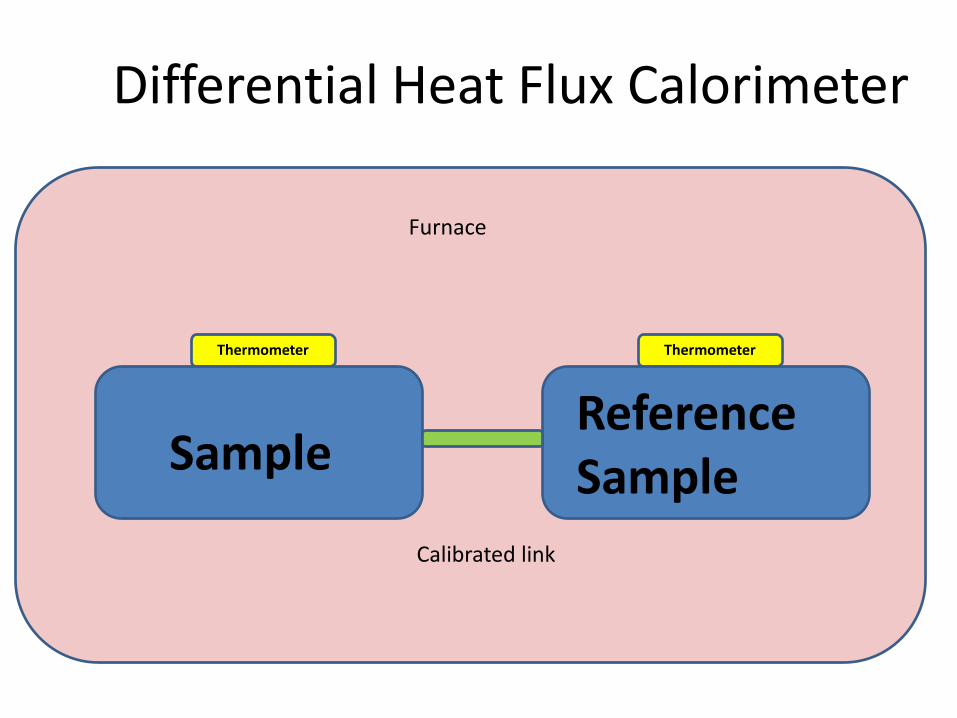
Differential Heat Flux Calorimeter
Reference Sample
Thermometer
Furnace
Sample
Thermometer
Calibrated link
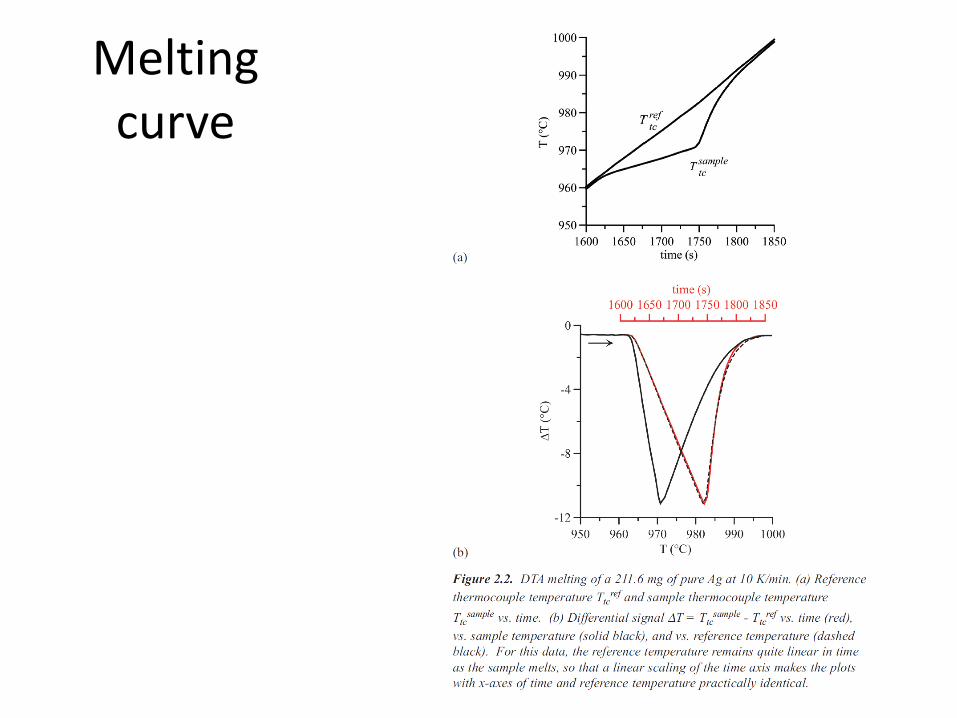
Melting curve
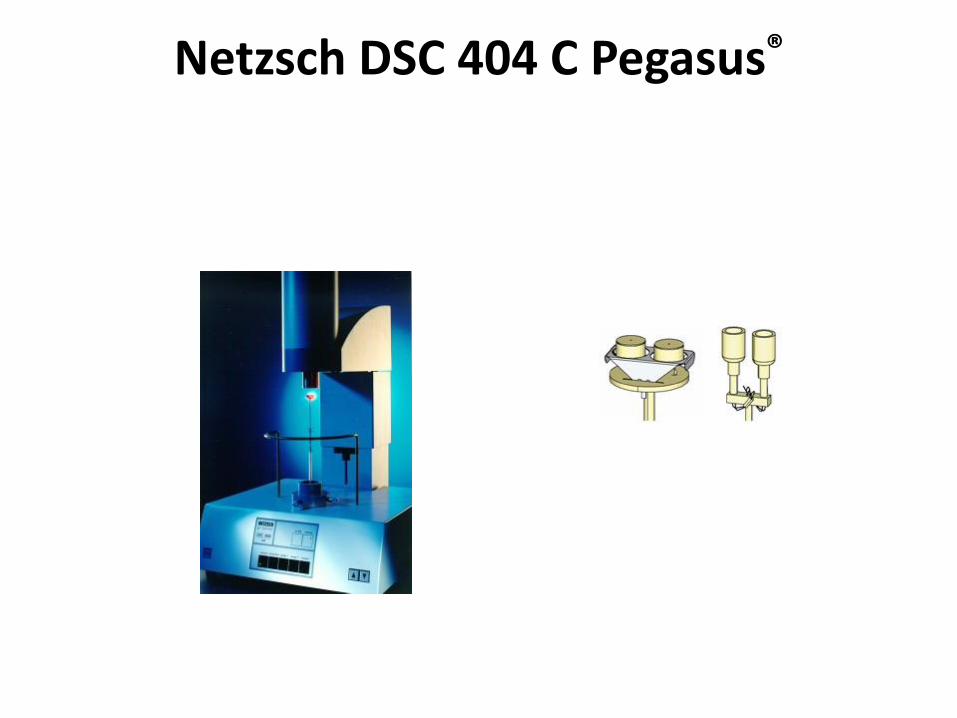
Netzsch DSC 404 C Pegasus®
500
700
900
1100
1300
1500
0 20 40 60 80 100
Tem
pera
ture
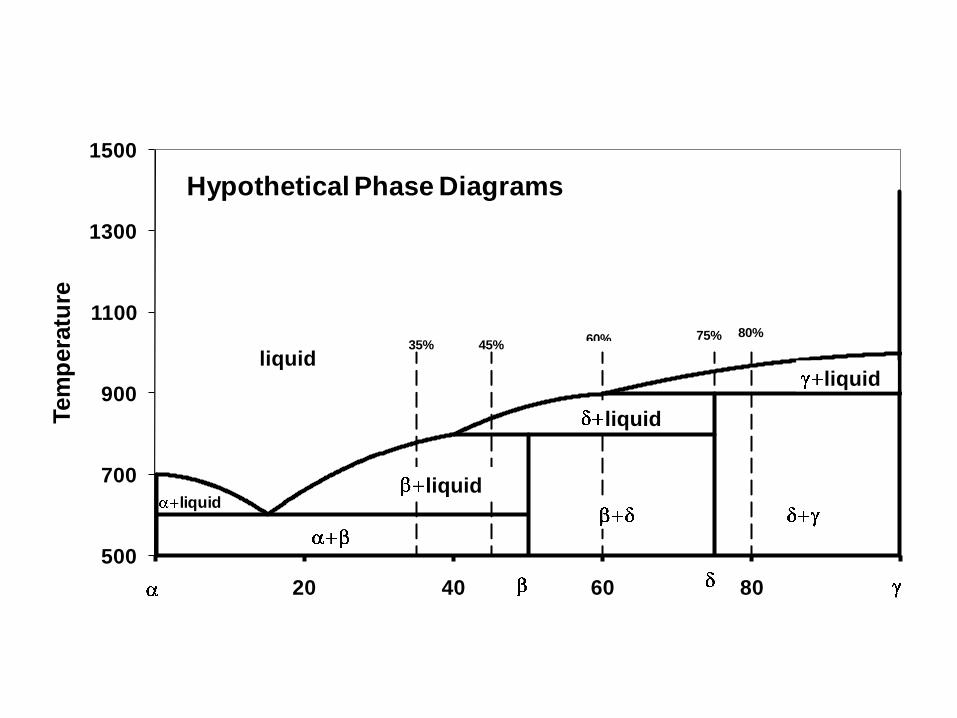
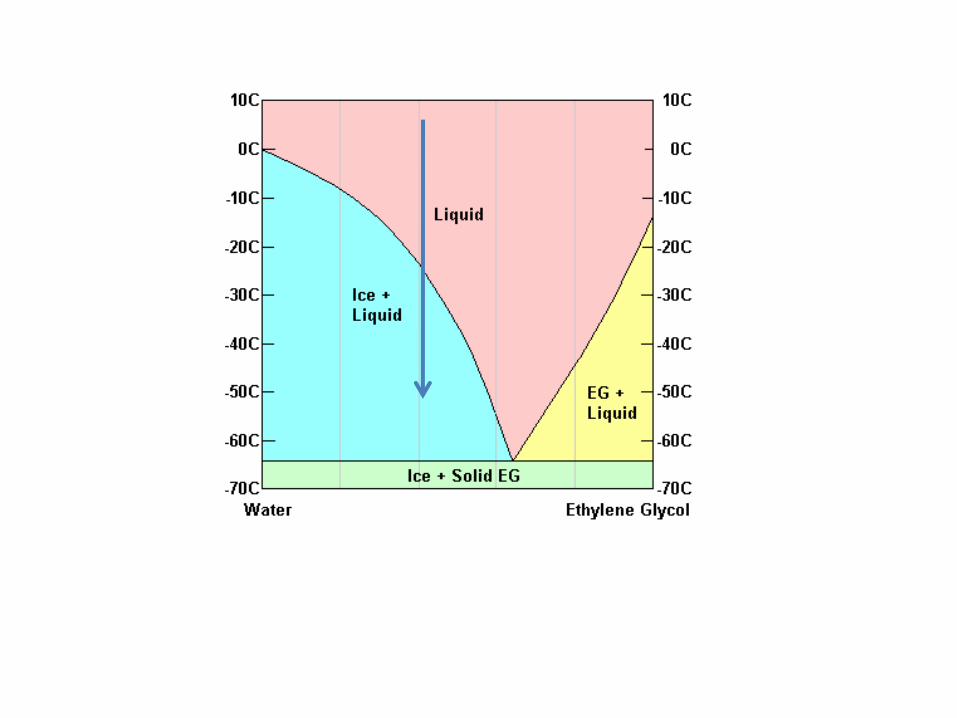
Hypothetical Phase Diagrams
35% 45%60% 75% 80%
liquidliquid
liquid
liquidliquid
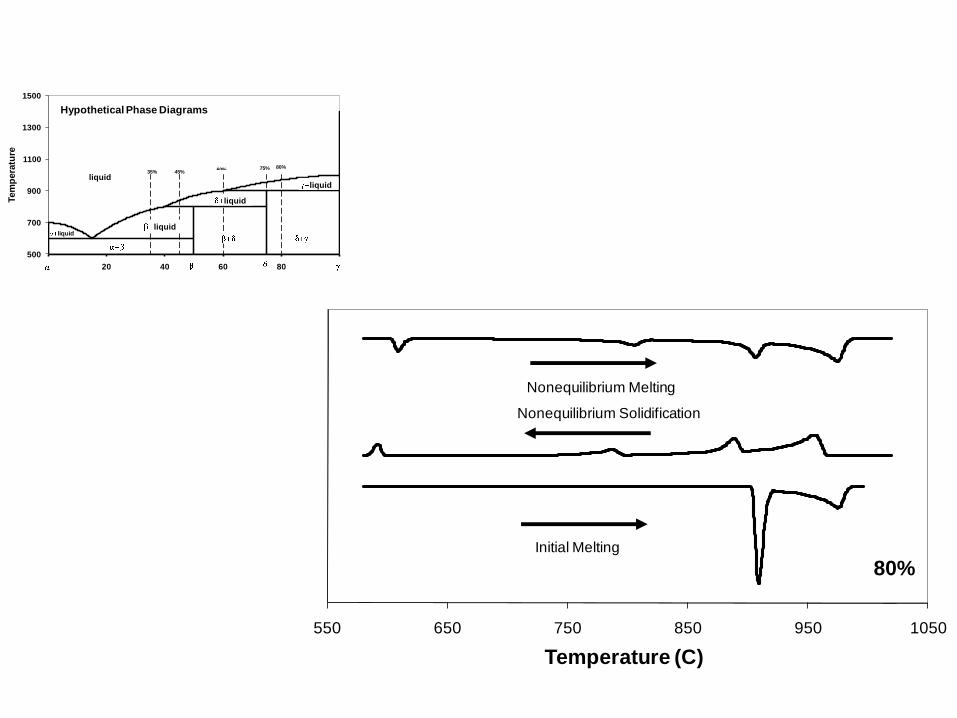
550 650 750 850 950 1050
Temperature (C)
80%Initial Melting
Nonequilibrium Solidification
Nonequilibrium Melting
500
700
900
1100
1300
1500
0 20 40 60 80 100
Tem
pera
ture
Hypothetical Phase Diagrams
35% 45%60% 75% 80%
liquidliquid
liquid
liquidliquid

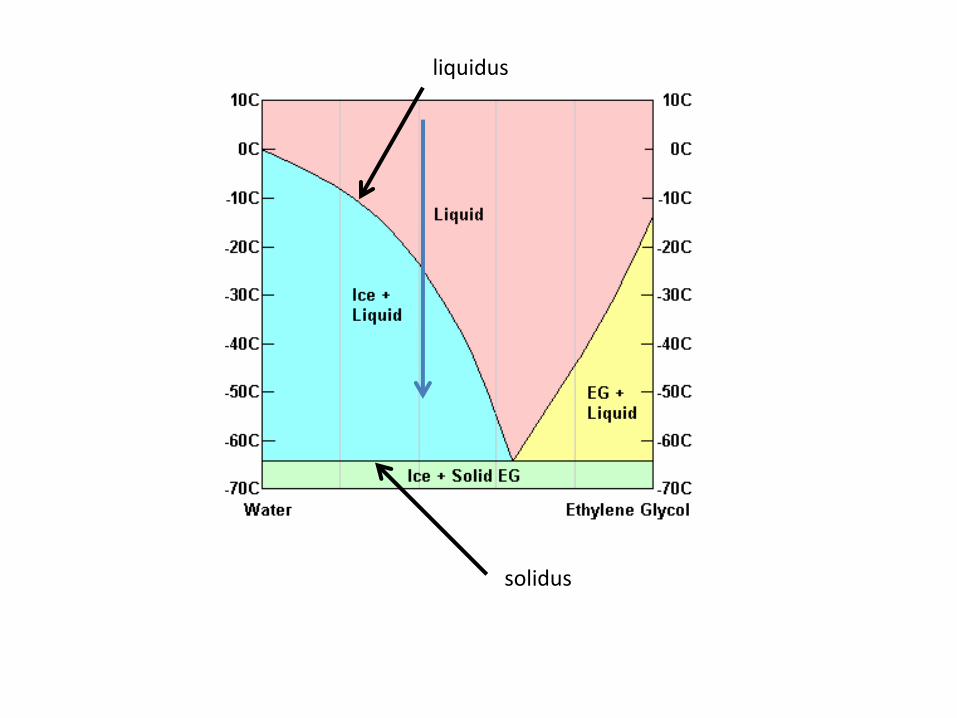
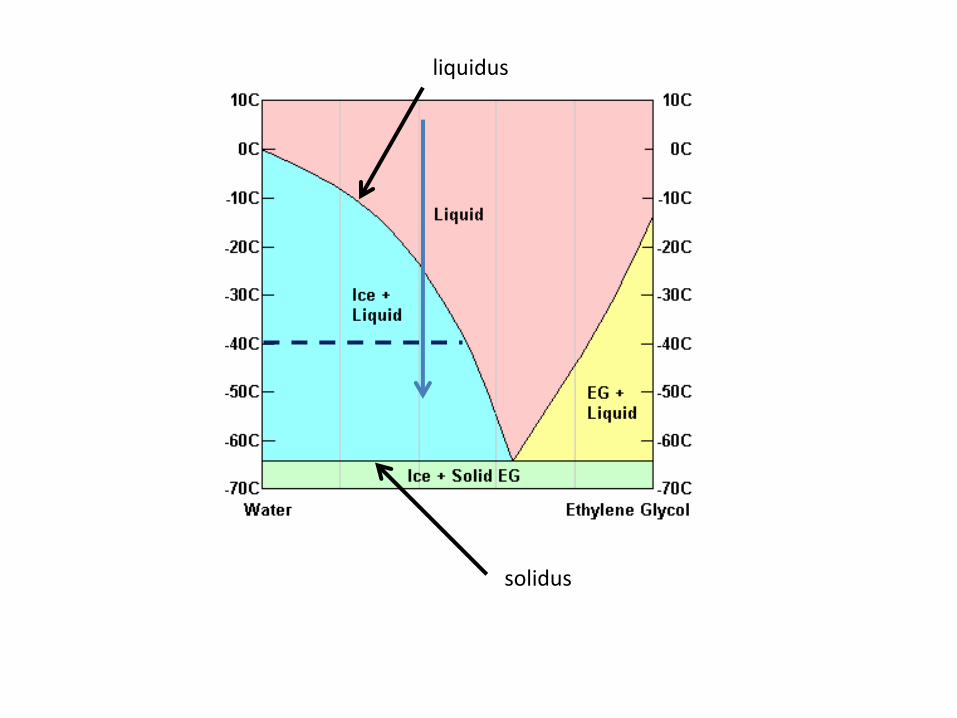
liquidus
solidus
liquidus
solidus
liquidus
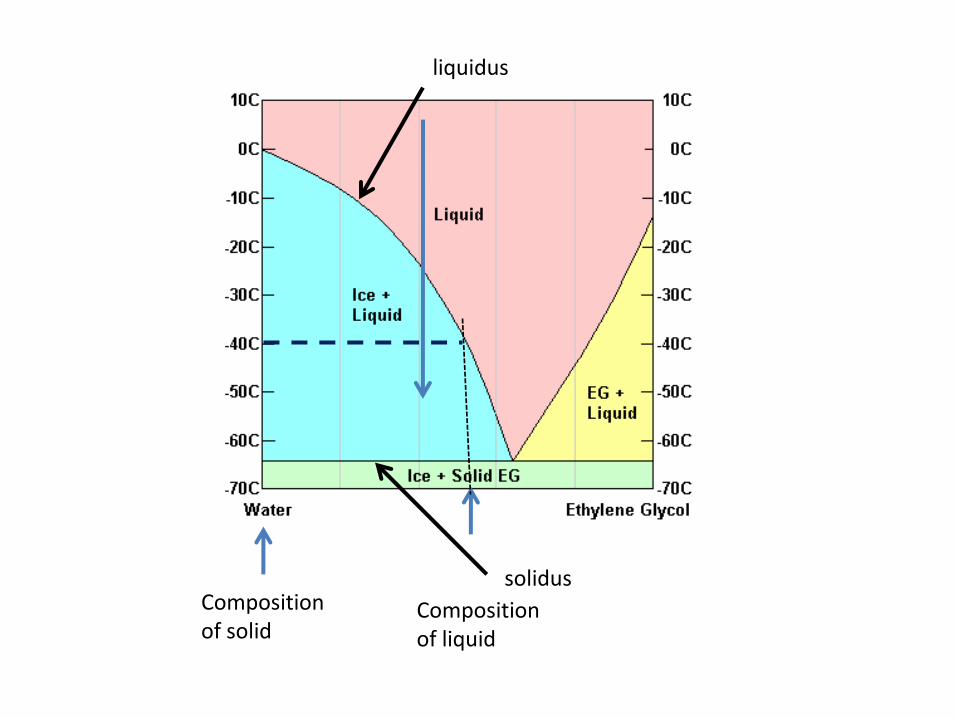
solidusComposition of solid
Composition of liquid

liquidus
solidusComposition of solid
Composition of liquid
a b
Fraction of liquid =a/(a+b)
Fraction of solid =b/(a+b)
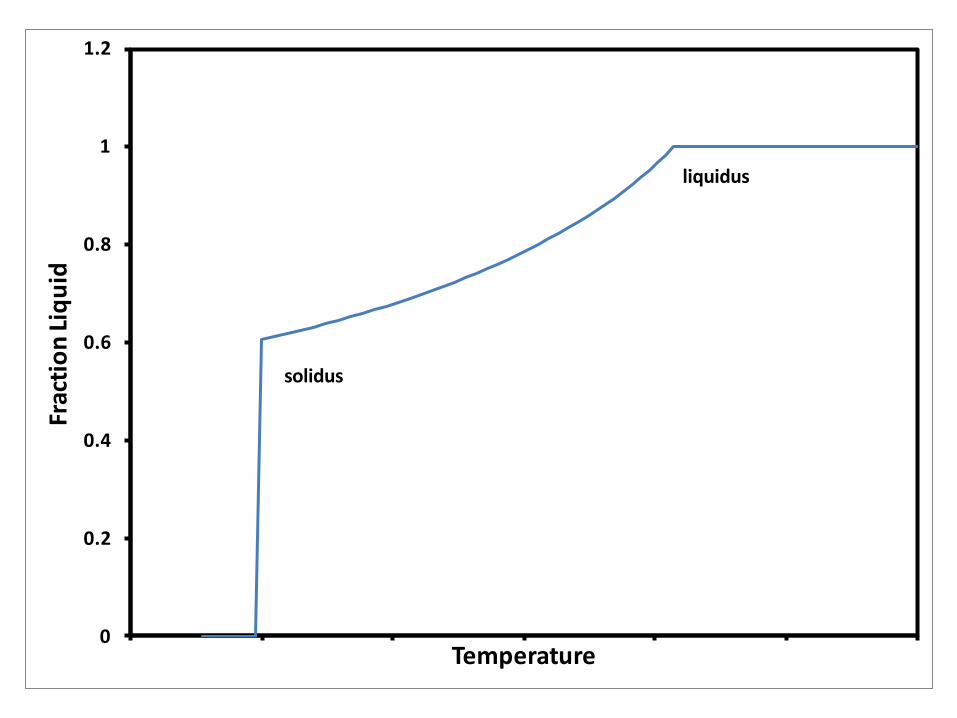
0
0.2
0.4
0.6
0.8
1
1.2Fr
acti
on
Liq
uid
Temperature
solidus
liquidus
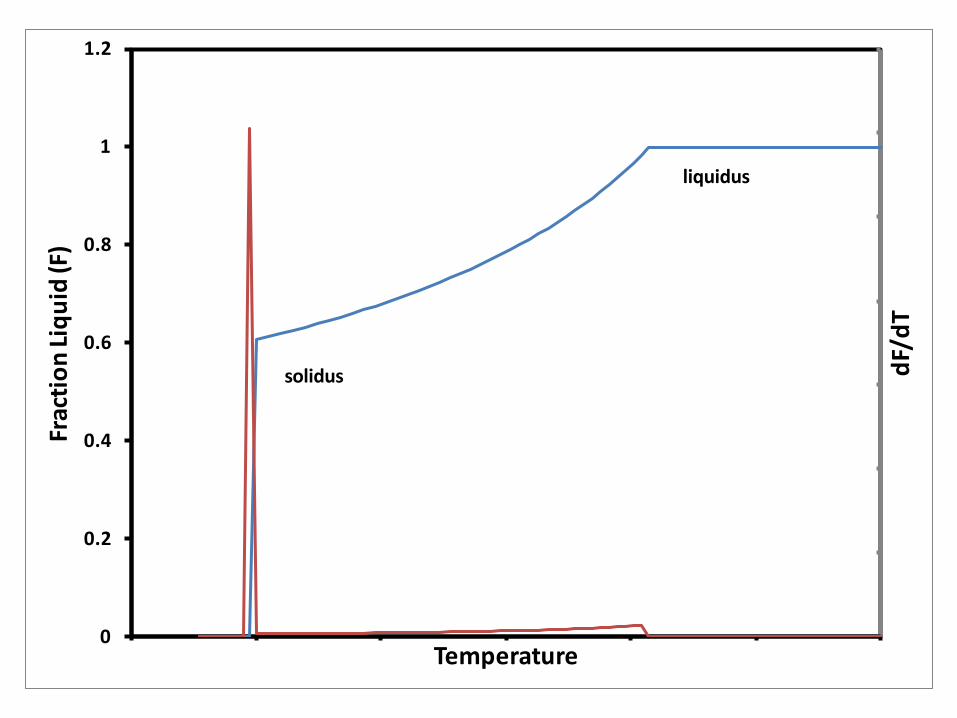
0
0.2
0.4
0.6
0.8
1
1.2
dF/
dT
Frac
tio
n L
iqu
id (F
)
Temperature
solidus
liquidus
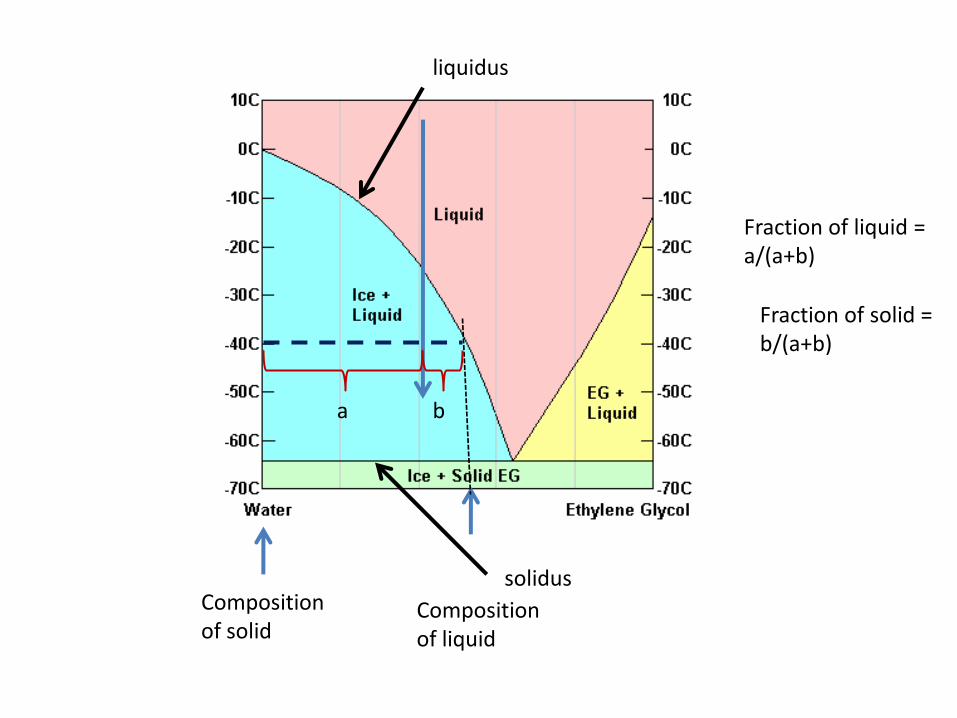
liquidus
solidusComposition of solid
Composition of liquid
a b
Fraction of liquid =a/(a+b)
Fraction of solid =b/(a+b)
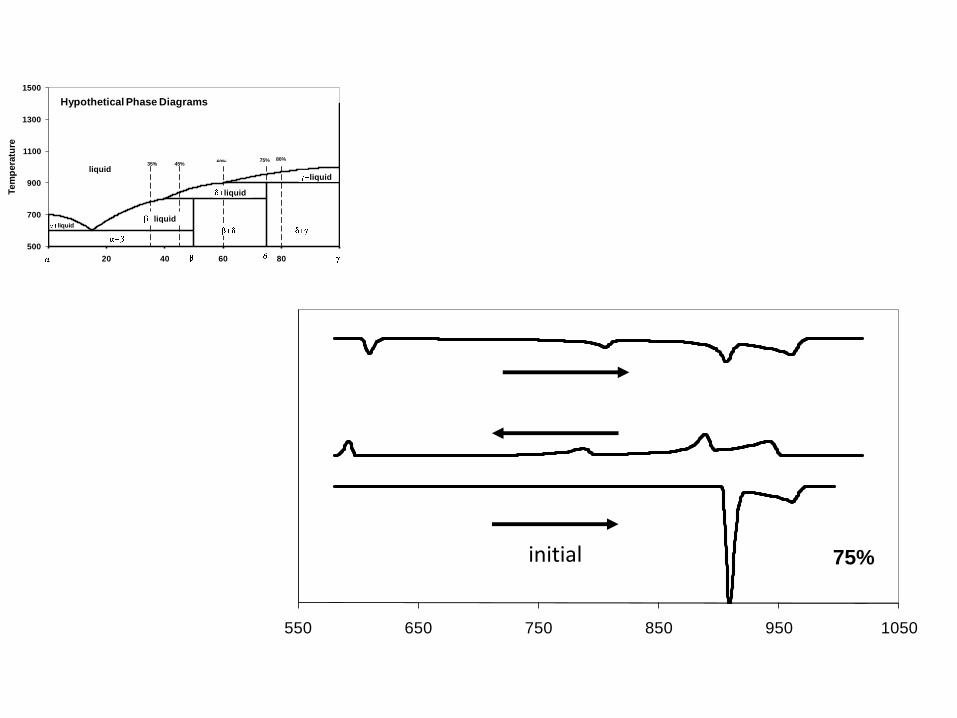
550 650 750 850 950 1050
75%initial
500
700
900
1100
1300
1500
0 20 40 60 80 100
Tem
pera
ture
Hypothetical Phase Diagrams
35% 45%60% 75% 80%
liquidliquid
liquid
liquidliquid
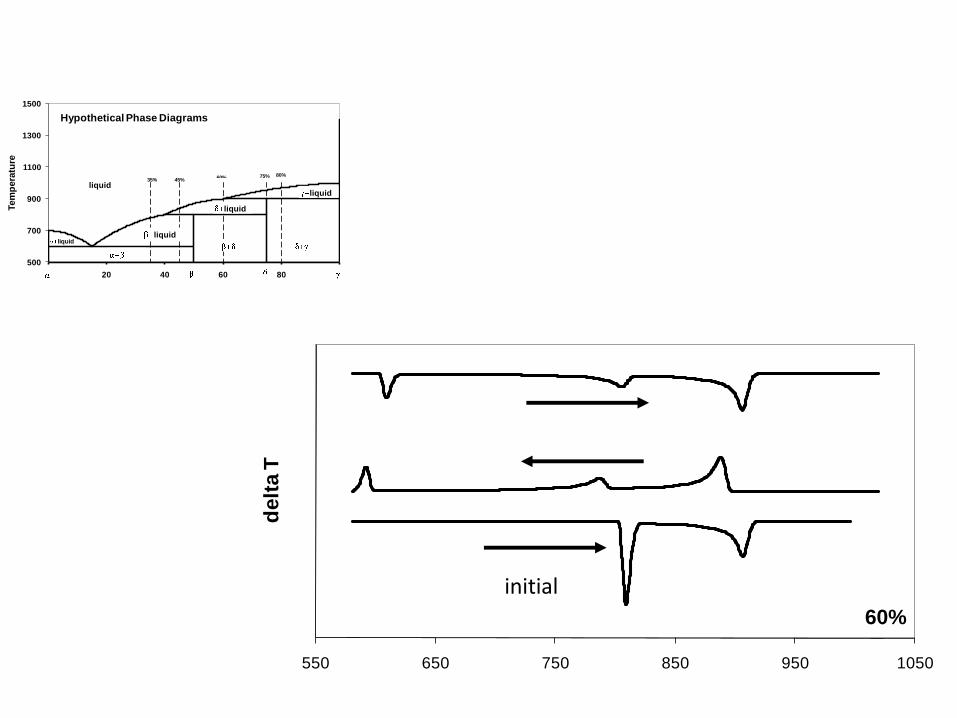
550 650 750 850 950 1050
de
lta
T
60%
initial
500
700
900
1100
1300
1500
0 20 40 60 80 100
Tem
pera
ture
Hypothetical Phase Diagrams
35% 45%60% 75% 80%
liquidliquid
liquid
liquidliquid
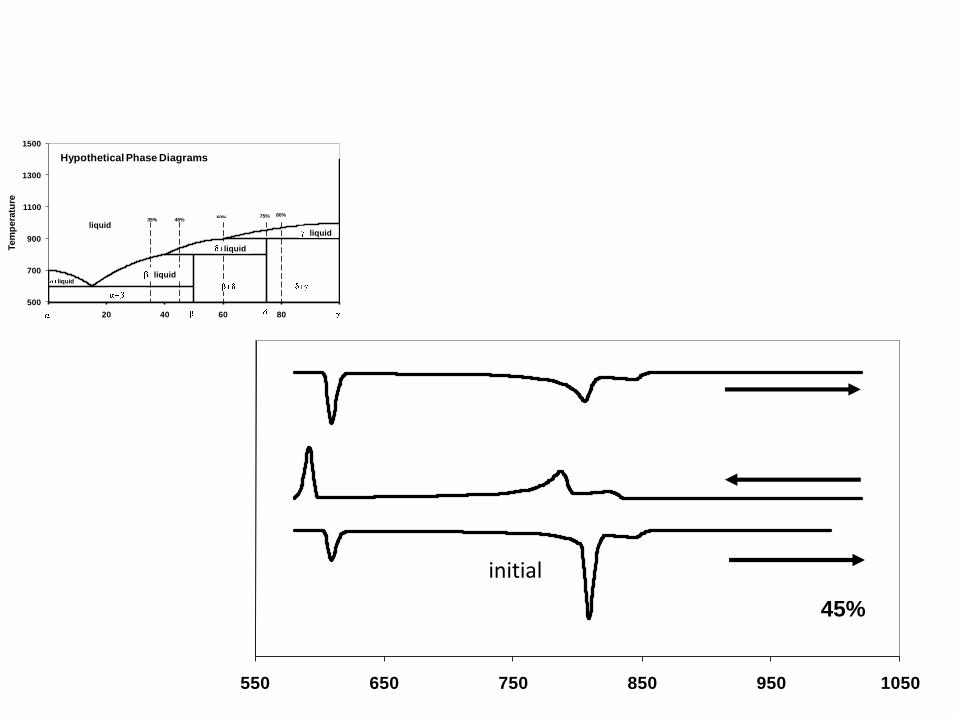
550 650 750 850 950 1050
45%
initial
500
700
900
1100
1300
1500
0 20 40 60 80 100
Tem
pera
ture
Hypothetical Phase Diagrams
35% 45%60% 75% 80%
liquidliquid
liquid
liquidliquid
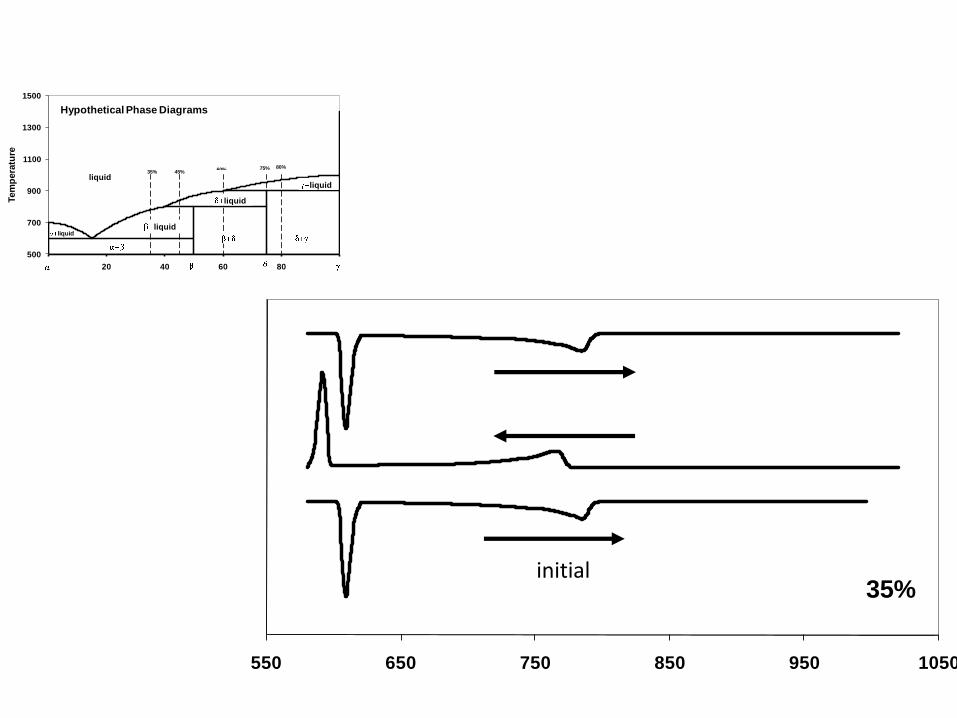
550 650 750 850 950 1050
35%initial
500
700
900
1100
1300
1500
0 20 40 60 80 100
Tem
pera
ture
Hypothetical Phase Diagrams
35% 45%60% 75% 80%
liquidliquid
liquid
liquidliquid
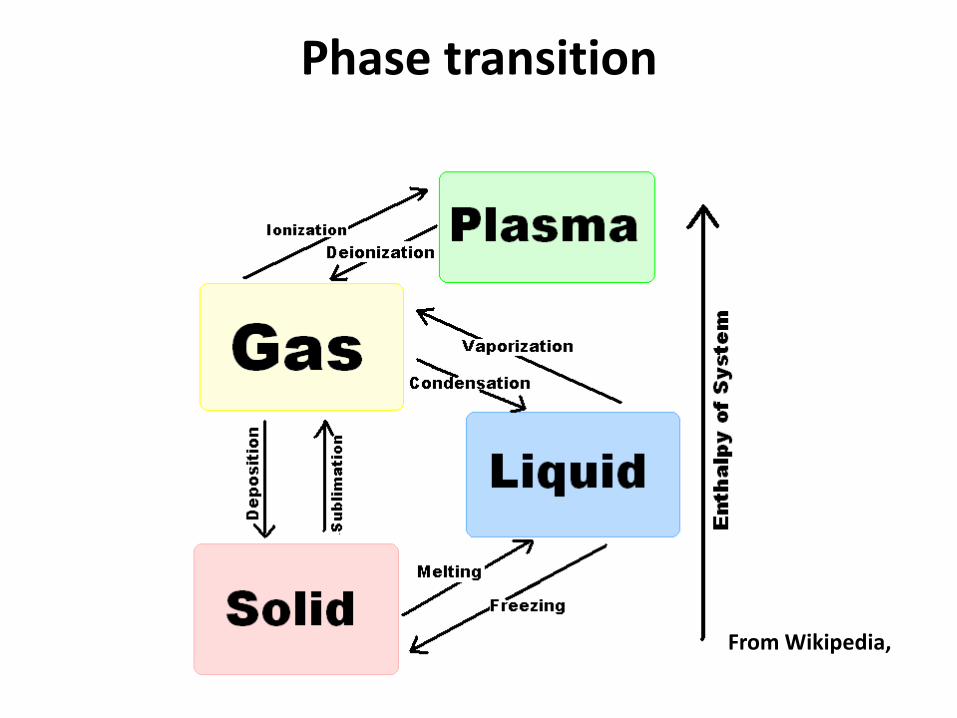
Phase transition
From Wikipedia,
Phase Transition
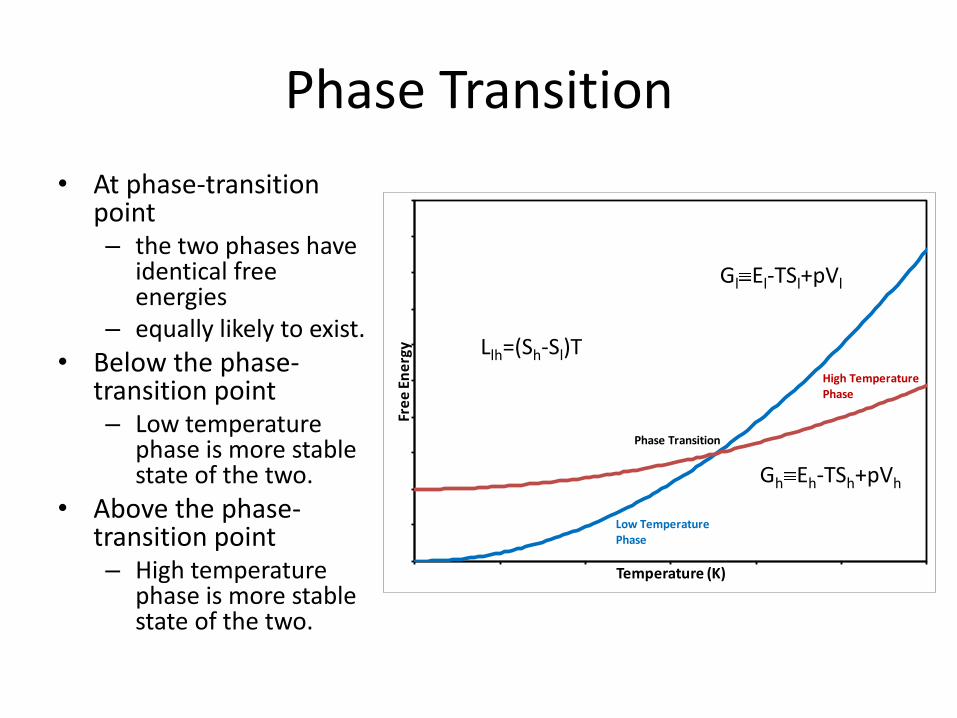
• At phase-transition point – the two phases have
identical free energies
– equally likely to exist.
• Below the phase-transition point – Low temperature
phase is more stable state of the two.
• Above the phase-transition point – High temperature
phase is more stable state of the two.
Fre
e E
ne
rgy
Temperature (K)
Low Temperature Phase
High Temperature Phase
Phase Transition
Gl El-TSl+pVl
Gh Eh-TSh+pVh
Llh=(Sh-Sl)T
Types of phase transitions
• first-order phase transitions– involve a latent heat
• system either absorbs or releases a fixed (and typically large) amount of energy.
• the temperature of the system will stay constant as heat is added or released.
– "mixed-phase regimes“• in which some parts of the system have completed the
transition and others have not. – a pot of boiling water:
» turbulent mixture of water and water vapor bubbles.
Ehrenfest's classification of phase transitions
• phase transitions labeled by the lowest derivative of the free energy that is discontinuous at the transition.
• First-order phase transitions– exhibit a discontinuity in the first derivative of the free energy with a
thermodynamic variable. – solid/liquid/gas transitions are first-order transitions
• because they involve a discontinuous change in density (which is the first derivative of the free energy with respect to chemical potential.)
• Second-order phase transitions– continuous in the first derivative– exhibit discontinuity in a second derivative of the free energy.
• example, the ferromagnetic phase transition in materials such as Fe, – magnetization ( the first derivative of the free energy with the applied magnetic field
strength), increases continuously from zero as the temperature is lowered below Tc– magnetic susceptibility (the second derivative of the free energy with the field) changes
discontinuously.
International Union of Pure and Applied Chemistry.first-order phase transitionA transition in which the molar Gibbs energies or molar Helmholtz energiesof the two phases (or chemical potentials of all components in the twophases) are equal at the transition temperature, but their first derivativeswith respect to temperature and pressure (for example, specific enthalpyof transition and specific volume) are discontinuous at the transition point,as for two dissimilar phases that coexist and that can be transformed intoone another by a change in a field variable such as pressure, temperature,magnetic or electric field.Example:The transition on heating CsCl to 752 K at which it changes from thelow-temperature, CsCl-type structure to the high-temperature NaCl-typestructure.Synonymous with discontinuous phase transition.1994, 66, 583IUPAC Compendium of Chemical Terminology 2nd Edition (1997)
second-order transitionA transition in which a crystal structure undergoes a continuous change and in which the first derivatives of the Gibbs energies (or chemical potentials) are continuous but the second derivatives with respect to temperature and pressure (i.e. heat capacity, thermal expansion, compressibility) are discontinuous. Example: The order-disorder transition in metal alloys, for example, CuZn. Synonymous with continuous transition.
NIST Recommended Practice GuideSpecial Publication 960-15
• DTA and Heat-flux DSC Measurements of Alloy Melting and Freezing– W. J. Boettinger, U. R. Kattner, K.-W. Moon
• Metallurgy Division• Materials Science and Engineering Laboratory,• National Institute of Standards and Technology
– J. H. Perepezko• Department of Materials Science and Engineering,• University of Wisconsin - Madison
– Special Publications– November 2006– U.S. Department of Commerce
Terms and definitions
• ASTM E473, "Standard Terminology Relating to Thermal Analysis," is a compilation of definitions of terms used in other ASTM documents on all thermal analysis methods including techniques besides DTA and HF-DSC.
• ASTM E1142, "Terminology Relating to Thermophysical Properties," is a compilation of definitions of terms used in other ASTM documents that involve the measurement of thermophysical properties in general.
ASTM Practice Standards
• ASTM E967, "Practice for Temperature Calibration of DSC and DTA," presents simple recipes for calibration for fixed mass and heating rate using two pure materials to obtain a linear correction for conversion of measured temperature to actual temperature. The onset temperature extracted from the melting peak is determined by the extrapolation method, see section 2.4.3. For some ♦DTA and Heat-flux DSC Measurements 5 materials the standard suggests using the peak for calibration, a method not recommended for metals.
• ASTM E968, "Standard Practice for Heat Flow Calibration of DSC," uses sapphire as heat capacity standard. The method is described in section 2.4.4.
• ASTM E2253, "Standard Method for Enthalpy Measurement Validation of Differential Scanning Calorimeters," presents a method using three small masses to determine the detection limit of DTA/DSC.
ASTM Practice Standards
• ASTM E928, "Standard Test Method for Determining Purity by DSC,” employs comparison of the shape of the melting peak of an impure sample to the shape for a high purity sample to determine the concentration of the impurity. The method uses the "1/F plot" which examines the down slope of the melting peak.
• ASTM E794, "Standard Test Method for Melting and Crystallization Temperatures by Thermal Analysis," employs the extrapolated onset determination method.
• ASTM E793, "Standard Test Method for Enthalpies of Fusion and Crystallization by DSC," uses area on signal vs. time plot for comparison to known heats of fusion of pure materials.
• ASTM E1269, "Standard Test Method for Determining Specific Heat Capacity by DSC," uses sapphire or aluminum as a standard.