
California’s Surface Water Ambient Monitoring Program SWAMP Today

1
David Rizzardo, PE
Chief, Snow Surveys Section
Hydrology Branch/Division of Flood Management
California Department of Water Resources
California’s Water Supply Forecasting
Water Education Foundation:
Challenges for Water Operations
February 23, 2016
2
Background on Water Supply Forecasting Products

Southern Cascades and Trinity: Mainly rainfall driven region with peak elevations around 3050 m/ 10000 ft. (other than Mt. Shasta and Mt. Lassen). Highly influenced by volcanic soils and some rain shadowed areas. Flood threats are driven by heavy precipitation events.
Northern Sierra: Rainfall driven region. Peak elevations top out at 3050-3350 m /10000-11000 ft. Heavy rainfall/snowfall events possible. Large area of upper Feather watershed sits in rain shadowed plateau. 1986 and 1997 extreme precipitation storms caused flooding downstream of this area.
Central/Southern Sierra: Snow melt driven basins. Large variety in size of watersheds. Characterized by high elevations (up to 4270 m / 14000 ft.), upper elevations consist of large areas of exposed granite batholiths. Susceptible to snow melt floods in heavy snow pack years. Limited data above 3350 m/11000 ft. which can account for up to 15% of watershed.
Eastern Sierra/Owens River: High elevation, snow melt driven basins. Watersheds are in rain shadow from Sierra Nevada. Rivers drain to terminal sinks in Nevada desert. Gage data is extremely limited. Most susceptible to snow melt flood events.
You are here
3

4

5
Bulletin 120: Seasonal Runoff Forecasts
April-July Forecast and % of Average
April-July Forecast 80% Prob. Range
Water Year F’Cast Distribution
Water Year Forecast and % of Avg. Water Year F’Cast 80% Prob. Range

6
Sacramento River Runoff (SRR) Sacramento Valley Index (SVI)
San Joaquin Valley Index is similar
Water Supply Index (WSI) / Water Year Runoff Forecasts

7
How Well Does Fall / Winter Unimpaired
Runoff Predict of AJ Volumes?
0
500
1000
1500
2000
2500
3000
3500
0.0 500.0 1000.0 1500.0
April
-Jul
y R
unof
f (ta
f)
Oct-March Runoff
Kings River
Feather River
0
500
1000
1500
2000
2500
3000
3500
4000
4500
0 1000 2000 3000 4000 5000 6000
October-March Runoff
April
-Jul
y Run
off (
taf)
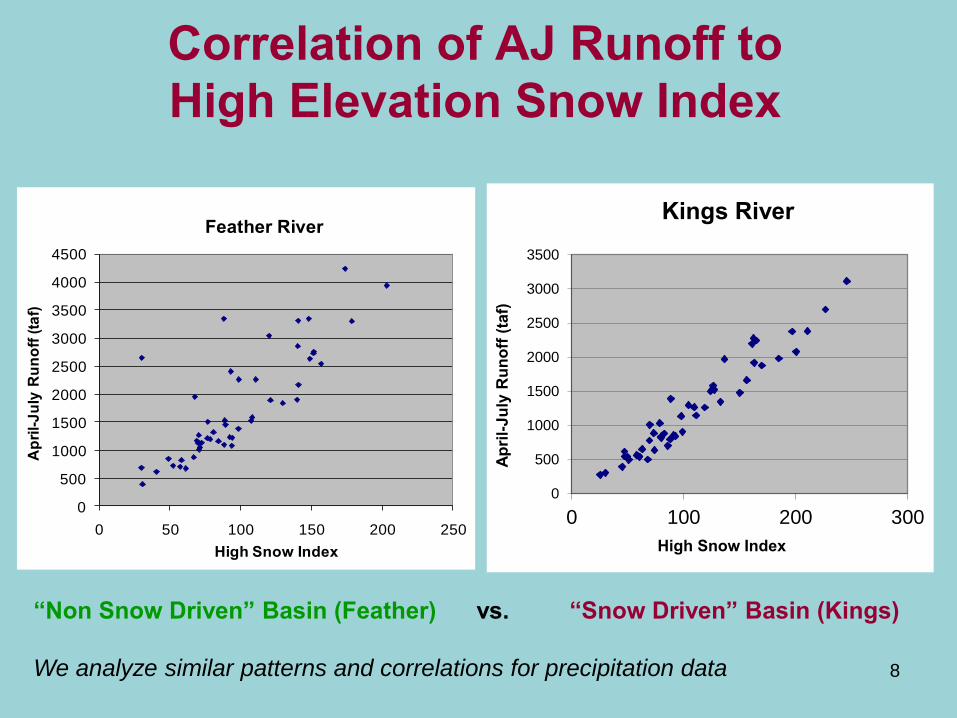
Correlation of AJ Runoff to High Elevation Snow Index
8
0
500
1000
1500
2000
2500
3000
3500
0 100 200 300Ap
ril-J
uly
Run
off (
taf)
High Snow Index
Kings River
0
500
1000
1500
2000
2500
3000
3500
4000
4500
0 50 100 150 200 250
Apr
il-Ju
ly R
unof
f (ta
f)
High Snow Index
Feather River
“Non Snow Driven” Basin (Feather) vs. “Snow Driven” Basin (Kings) We analyze similar patterns and correlations for precipitation data

Graphical Analyses = Reality Check
9

Water Supply Forecast Review
April and May Bulletin120 Forecasts
2011
10
Statewide Precip: 140% avg Statewide Precip: 135% avg
Snow Pack: 170% avg Snow Pack: 185% avg

Water Supply Forecast Review
April and May Bulletin120 Forecasts
2012
11
Statewide Precip: 70% avg Statewide Precip: 75% avg
Snow Pack: 50% avg Snow Pack: 40% avg

Water Supply Forecast Review
April and May Bulletin120 Forecasts
2013
12
Statewide Precip: 75% avg Statewide Precip: 75% avg
Snow Pack: 15% avg Snow Pack: 40% avg

Water Supply Forecast Review
April and May Bulletin120 Forecasts
2014
13
Statewide Precip: 50% avg Statewide Precip: 50% avg
Snow Pack: 15% avg Snow Pack: 25% avg

Water Supply Forecast Review
April and May Bulletin120 Forecasts
2015
14
Statewide Precip: 75% avg Statewide Precip: 70% avg
Snow Pack: 2% avg Snow Pack: 5% avg
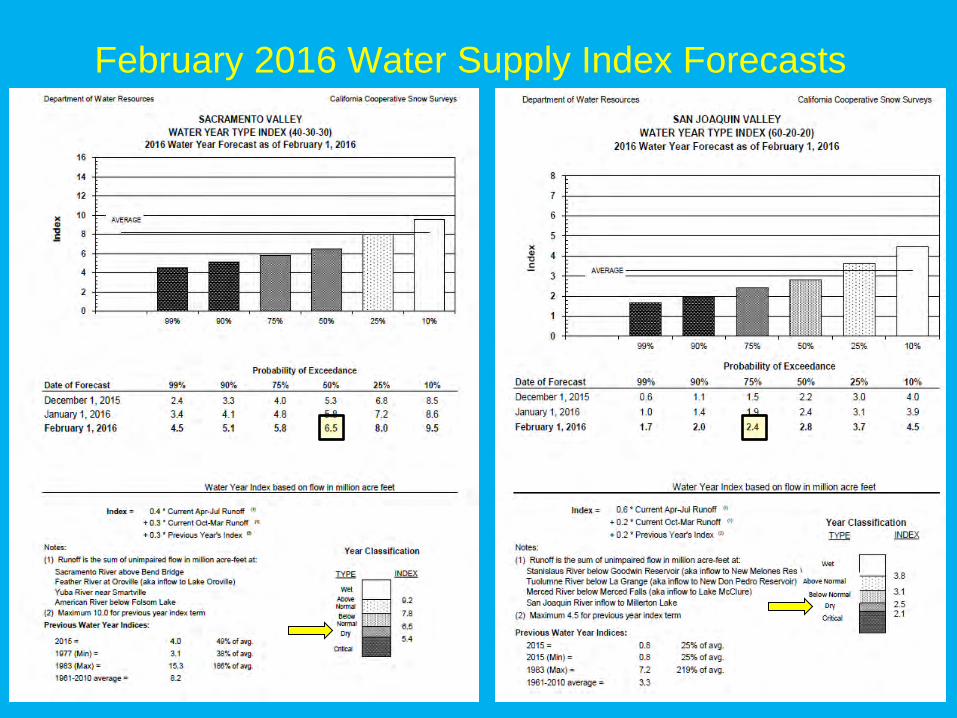
February 2016 Water Supply Index Forecasts
15

February 2016 Bulletin120 Forecasts
16
Statewide Precip: 115% avg
Snow Pack: 93% avg Snow Pack: 115% avg
Dry Feb. = Drop in Forecast

17
Questions?


