American Think Tanks: An Introduction Junfu Zhang Public Policy Institute of California.
PPIC STATEWIDE SURVEY OCTOBER 2016
Californians & Their Government Mark Baldassare Dean Bonner David Kordus Lunna Lopes
CONTENTS Press Release 3 November 2016 Election 6 State and National Issues 14 Regional Map 20 Methodology 21 Questionnaire and Results 23
Supported with funding from The James Irvine Foundation and the PPIC Donor Circle
The PPIC Statewide Survey provides a voice for the public and likely voters— informing policymakers, encouraging discussion, and raising awareness on critical issues of the day.
© 2016 Public Policy Institute of California
The Public Policy Institute of California is dedicated to informing and improving public policy in California through independent, objective, nonpartisan research.
PPIC is a public charity. It does not take or support positions on any ballot measures or on any local, state, or federal legislation, nor does it endorse, support, or oppose any political parties or candidates for public office.
Short sections of text, not to exceed three paragraphs, may be quoted without written permission provided that full attribution is given to the source.
Research publications reflect the views of the authors and do not necessarily reflect the views of our funders or of the staff, officers, advisory councils, or board of directors of the Public Policy Institute of California.
PPIC STATEWIDE SURVEY OCTOBER 2016
PPIC.ORG/SURVEY Californians and Their Government 3
CONTACT
Linda Strean 415-291-4412 Serina Correa 415-291-4417
News Release EMBARGOED: Do not publish or broadcast until 9:00 p.m. PDT on Wednesday, October 26, 2016.
Para ver este comunicado de prensa en español, por favor visite nuestra página de internet: www.ppic.org/main/pressreleaseindex.asp
PPIC STATEWIDE SURVEY: CALIFORNIANS AND THEIR GOVERNMENT
Clinton’s Lead Grows, Harris Ahead of Sanchez 2 to 1 MAJORITIES FAVOR MARIJUANA MEASURE, TAX INCREASES ON HIGH EARNINGS, CIGARETTES—SUPPORT LAGS FOR SCHOOL BOND
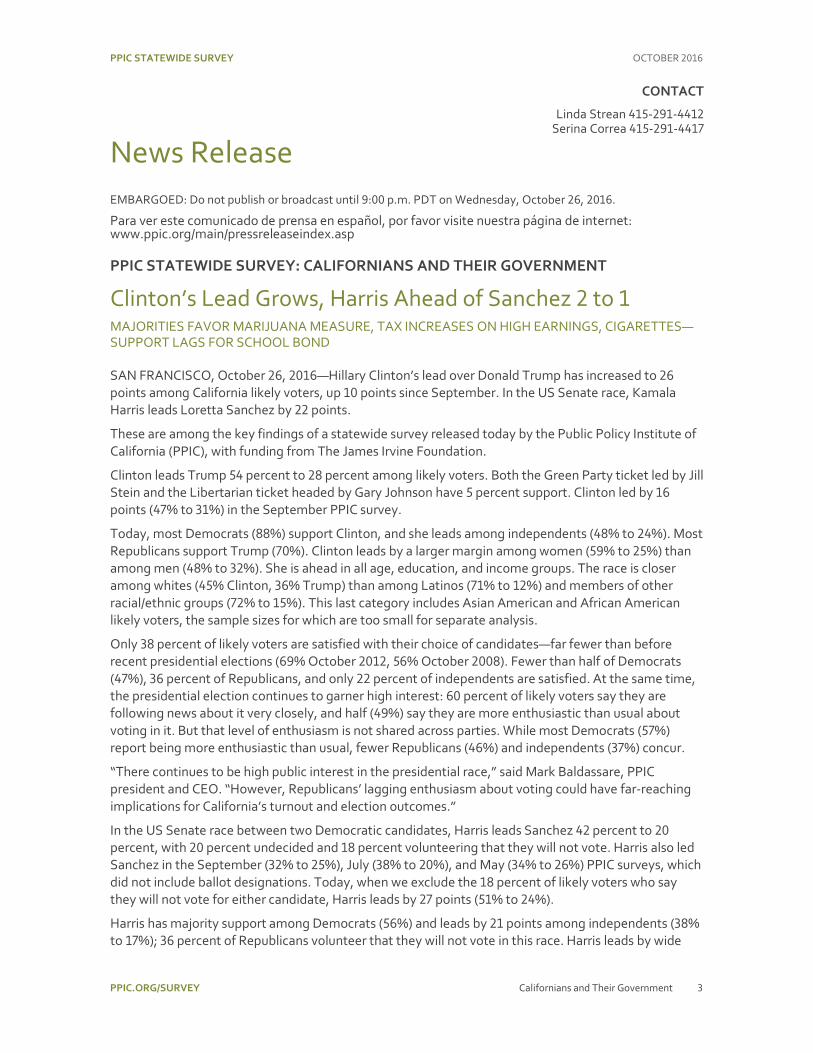
SAN FRANCISCO, October 26, 2016—Hillary Clinton’s lead over Donald Trump has increased to 26 points among California likely voters, up 10 points since September. In the US Senate race, Kamala Harris leads Loretta Sanchez by 22 points.
These are among the key findings of a statewide survey released today by the Public Policy Institute of California (PPIC), with funding from The James Irvine Foundation.
Clinton leads Trump 54 percent to 28 percent among likely voters. Both the Green Party ticket led by Jill Stein and the Libertarian ticket headed by Gary Johnson have 5 percent support. Clinton led by 16 points (47% to 31%) in the September PPIC survey.
Today, most Democrats (88%) support Clinton, and she leads among independents (48% to 24%). Most Republicans support Trump (70%). Clinton leads by a larger margin among women (59% to 25%) than among men (48% to 32%). She is ahead in all age, education, and income groups. The race is closer among whites (45% Clinton, 36% Trump) than among Latinos (71% to 12%) and members of other racial/ethnic groups (72% to 15%). This last category includes Asian American and African American likely voters, the sample sizes for which are too small for separate analysis.
Only 38 percent of likely voters are satisfied with their choice of candidates—far fewer than before recent presidential elections (69% October 2012, 56% October 2008). Fewer than half of Democrats (47%), 36 percent of Republicans, and only 22 percent of independents are satisfied. At the same time, the presidential election continues to garner high interest: 60 percent of likely voters say they are following news about it very closely, and half (49%) say they are more enthusiastic than usual about voting in it. But that level of enthusiasm is not shared across parties. While most Democrats (57%) report being more enthusiastic than usual, fewer Republicans (46%) and independents (37%) concur.
“There continues to be high public interest in the presidential race,” said Mark Baldassare, PPIC president and CEO. “However, Republicans’ lagging enthusiasm about voting could have far-reaching implications for California’s turnout and election outcomes.”
In the US Senate race between two Democratic candidates, Harris leads Sanchez 42 percent to 20 percent, with 20 percent undecided and 18 percent volunteering that they will not vote. Harris also led Sanchez in the September (32% to 25%), July (38% to 20%), and May (34% to 26%) PPIC surveys, which did not include ballot designations. Today, when we exclude the 18 percent of likely voters who say they will not vote for either candidate, Harris leads by 27 points (51% to 24%).
Harris has majority support among Democrats (56%) and leads by 21 points among independents (38% to 17%); 36 percent of Republicans volunteer that they will not vote in this race. Harris leads by wide

PPIC STATEWIDE SURVEY OCTOBER 2016
PPIC.ORG/SURVEY Californians and Their Government 4
margins among whites and members of other racial/ethnic groups, though Sanchez has a slight lead among Latinos (41% to 33%). Clinton supporters favor Harris over Sanchez (58% to 21%), while 45 percent of Trump supporters say they will not vote in the US Senate race. About half of likely voters (51%) are satisfied with their choice of candidates in the race, with most Democrats (70%) satisfied. Fewer than half of independents (48%) and only 27 percent of Republicans are satisfied.
Baldassare summed up: “In this US Senate race between two Democrats, Attorney General Kamala Harris has built a two-to-one lead over Congresswoman Loretta Sanchez, with more than half of Republicans continuing to say they won’t vote or are undecided about how they will vote.”
Most Prefer Democratic Control of Congress Attention is focused this election year on whether or not Republicans will maintain control of the US Congress. When California likely voters are asked what they would prefer, 55 percent favor a Congress controlled by Democrats and 35 percent favor Republican control.
The current Congress has a job approval rating of only 17 percent among California likely voters. President Obama’s approval rating is much higher—60 percent.
Support Holds for Propositions 55, 56, and 64 The survey also asks about four statewide ballot initiatives. All require simple majorities to pass. Fewer than half favor Proposition 51. When read the ballot title and label, 46 percent of likely
voters would vote yes, 41 percent would vote no, and 12 percent are undecided about this measure, which would authorize the state to issue $9 billion in bonds to fund construction and modernization of K–12 schools and community college facilities. A solid majority of Democratic likely voters (62%) would vote yes on the measure, but fewer than half of independents (45%) and even fewer Republicans (29%) support it. When asked about the importance of the outcome of Proposition 51, 41 percent say it is very important. Supporters are somewhat more likely than opponents to say that the outcome of the vote on this measure is very important to them. In response to a tracking question, the survey finds that support for Proposition 51 (46%) is lower than the level of general support for a state school bond (59%).
59 percent favor Proposition 55. A majority of likely voters say they would vote yes on this measure, which would extend by 12 years the temporary tax increase on earnings over $250,000 (31% no, 10% undecided). Revenue would be allocated to public schools, community colleges, and, in certain years, health care. Asked about the importance of the outcome on this measure, 47 percent say it is very important to them, with supporters more likely than opponents to express this view. Responses to our tracking question show that support for Proposition 55 (59%) is similar to the level of general support for raising state income taxes on high incomes (64%).
56 percent support Proposition 56. A majority of likely voters support this measure to increase the cigarette tax by $2 per pack to fund health care, tobacco use prevention, and law enforcement (38% no, 6% undecided). Majorities of Democratic (69%) and independent (55%) likely voters would vote yes, while Republicans are more divided (45% yes, 50% no). A solid majority of likely voters under age 55 would vote yes. About half of whites (49%) support Proposition 56, while Latinos (80%) and other racial/ethnic groups (65%) are much more likely to favor it. How important is the outcome of this measure? Forty-seven percent say very important. Those who would vote yes (49%) and those who would vote no (48%) are equally likely to call the outcome very important. Responses to our tracking question show that support for Proposition 56 (56%) is somewhat lower than general support for increasing state taxes on cigarette purchases (65%).
55 percent favor Proposition 64. A majority of likely voters would vote yes on this measure to legalize marijuana use under state law by adults 21 and older and tax sales and cultivation (38% no,

PPIC STATEWIDE SURVEY OCTOBER 2016
PPIC.ORG/SURVEY Californians and Their Government 5
6% undecided). Most Democratic (66%) and independent (56%) likely voters support the proposition, but a majority of Republicans (60%) would vote no. Majorities in all regions would vote yes. Just under half of Latino likely voters (47%) would vote yes, while majorities of other racial/ethnic groups (65%) and whites (55%) would do so. Across age groups, support is highest among those age 18 to 34 (78%). About half of likely voters (51%) say the outcome on Proposition 64 is very important. Opponents are more likely than proponents to hold this view (60% to 50%). Responses to our tracking question indicate that support for Proposition 64 (55%) is similar to the level of general support for legalizing the use of marijuana (57%).
“The state school bond continues to struggle to reach the majority needed to pass, while earlier support has held for state propositions that would legalize marijuana, extend the tax increase on the wealthy, and raise taxes on cigarettes,” Baldassare said.
With all seats in the state assembly and about half of the seats in the state senate up for election, the survey asks about the possibility of Democrats—who have a majority in the state legislature—attaining a two-thirds supermajority. Among likely voters, 41 percent say this would be a good thing, while 31 percent say it would be a bad thing and 24 percent say it would make no difference. Asked to assess the current state legislature, likely voters give a job approval rating of 43 percent. The legislature’s rating was much lower four years ago: 21 percent in October 2012. Governor Brown’s approval rating among likely voters is 56 percent today. It was also lower—45 percent—four years ago.
Jobs, Economy Named Most Important Issue Likely voters are more likely to name jobs and the economy than any other issue as the most important one facing Californians (27%), followed by water and drought (16%). Jobs and the economy is the most frequently named issue across parties.
California likely voters are divided in their views about the state’s economic future, with just under half (46%) saying that California will have good times financially in the next year. They are also divided on the direction of the US economy. Fewer than half (44%) say the nation will have good times financially in the year ahead.
California likely voters also approach the election with low levels of trust in Washington: 69 percent say they think the federal government can be trusted to do what is right only some or none of the time. A large majority say the federal government is pretty much run by a few big interests looking out for themselves (72%), and only 23 percent say it is run for the benefit of all the people. Most likely voters (62%) also say that people in the federal government waste a lot of taxpayer money. Notably, Trump supporters are far more likely than Clinton supporters to volunteer that the federal government can never be trusted (24% to 3%), to say that it is run by a few big interests (90% to 57%), and to say it wastes a lot of taxpayer money (90% to 43%).
Low Favorability Rating for Republican Party At the end of a contentious political season, half of California likely voters (50%) have a favorable opinion of the Democratic Party, while 24 percent have a favorable opinion of the Republican Party. About a quarter (27%) hold an unfavorable view of both parties. Most likely voters (62%) say that both major parties do such a poor job that a third major party is needed.
“One of the casualties of this national election is Californians’ view of the Republican Party,” Baldassare said. “As the campaign season winds down, many voters across the partisan divide agree that a third major party is needed.”

PPIC STATEWIDE SURVEY OCTOBER 2016
PPIC.ORG/SURVEY Californians and Their Government 6
November 2016 Election
Key Findings Hillary Clinton continues to lead Donald
Trump by a wide margin (54% to 28%) in the presidential race. Six in ten likely voters are closely following election news, and about half are more enthusiastic than usual about voting in the presidential race. (page 7)
Kamala Harris leads Loretta Sanchez in the US Senate race (42% to 20%). Thirty-eight percent of likely voters are undecided or say they will not vote in this race. (page 8)
Fifty-five percent of likely voters prefer Democratic control of the US Congress as an outcome of this election. A plurality (41%) say a two-thirds Democratic majority in the state legislature would be a good thing. (page 9)
Forty-six percent of likely voters would vote yes on Proposition 51 (school bond to fund construction projects), 41 percent would vote no, and 12 percent are unsure. Forty-one percent of likely voters say the outcome of this vote is very important. (page 10)
Fifty-nine percent of likely voters would vote yes on Proposition 55 (tax extension on high incomes), 31 percent would vote no, and 10 percent are unsure. Forty-seven percent of likely voters say the outcome of this vote is very important. (page 11)
Fifty-six percent of likely voters would vote yes on Proposition 56 (cigarette tax increase), and 38 percent would vote no. Forty-seven percent say the outcome of this vote is very important. (page 12)
Fifty-five percent of likely voters would vote yes on Proposition 64 (legalizing marijuana), and 38 percent would vote no. Fifty-one percent say the outcome of this vote is very important. (page 13)
61
70
47
57
46
37
0
20
40
60
80
Dem Rep Ind
Perc
ent l
ikel
y vo
ters
Oct 2012Oct 2016
More enthusiastic than usual about votingin the presidential race
47
54
46
59
0
20
40
60
80
Prop 51: School bond Prop 55: Tax extensionto fund education
Perc
ent l
ikel
y vo
ters
SeptemberOctober
Support for Propositions 51 and 55
59 6056 55
0
20
40
60
80
Prop 56: Cigarette tax Prop 64: Marijuanalegalization
Perc
ent l
ikel
y vo
ters
SeptemberOctober
Support for Propositions 56 and 64

PPIC STATEWIDE SURVEY OCTOBER 2016
PPIC.ORG/SURVEY Californians and Their Government 7
Presidential Election The final stretch of the 2016 presidential election has garnered considerable interest: 60 percent of likely voters say they are following news about the presidential candidates very closely, and 49 percent say they are more enthusiastic than usual about voting in the presidential election. Likely voters now favor Hillary Clinton over Donald Trump by 26 points (54% to 28%). Clinton led by 16 points in the September PPIC survey (47% to 31%) and the July PPIC survey (46% to 30%). Clinton is supported today by most Democrats (88%), Trump has the support of seven in ten Republicans, and Clinton leads among independents (48% to 24%). Clinton leads by a larger margin among women (59% to 25%) than among men (48% to 32%). Clinton is ahead of Trump in all age, education, and income groups. The race is closer among whites (45% Clinton, 36% Trump), but Clinton leads by wide margins among Latinos and members of other racial/ethnic groups (sample sizes for Asian American and African American likely voters are too small for separate analysis). Clinton leads by about 50 points in Los Angeles and the San Francisco Bay Area, while the race is closer in the Central Valley (35% Clinton, 44% Trump), Inland Empire (42% Clinton, 46% Trump), and Orange/San Diego (42% Clinton 34% Trump).
“If the November 8 presidential election were being held today, would you vote for: the Democratic ticket of Hillary Clinton and Tim Kaine, the Republican ticket of Donald Trump and Mike Pence, the Libertarian ticket of Gary Johnson and Bill Weld, or the Green Party ticket of Jill Stein and Ajamu Baraka?”
Likely voters only Clinton- Kaine
Trump- Pence
Johnson- Weld
Stein- Baraka
Someone else
(volunteered)
Would not vote for
president (volunteered)
Don’t know
All likely voters 54% 28% 5% 5% 2% 1% 4%
Party
Democrats 88 4 1 4 – – 2
Republicans 12 70 5 1 4 2 6
Independents 48 24 11 6 4 2 6
Gender Men 48 32 7 6 3 1 3
Women 59 25 3 5 2 1 5
Race/Ethnicity
Latinos 71 12 6 7 1 1 3
Whites 45 36 5 7 2 1 5
Other groups 72 15 3 2 3 – 5
About four in ten likely voters (38%) are satisfied with their choices of presidential candidates—similar to the September PPIC survey (42%) and the May PPIC survey (42%). Satisfaction with the candidates today is much lower than in surveys before recent presidential elections (69% October 2012, 56% October 2008). Today, just under half of Democrats (47%), 36 percent of Republicans, and 22 percent of independents are satisfied. Fewer than three in ten likely voters under 35 (27%) say they are satisfied.
“In general, would you say you are satisfied or not satisfied with your choices of candidates in the election for US president in 2016?”
Likely voters only All likely voters
Party Age
Dem Rep Ind 18 to 34 35 to 54 55 and older
Satisfied 38% 47% 36% 22% 27% 34% 45%
Not satisfied 58 49 60 74 69 64 50
Both (volunteered) 2 3 1 2 3 1 2
Don’t know 1 1 2 2 1 1 2

PPIC STATEWIDE SURVEY OCTOBER 2016
PPIC.ORG/SURVEY Californians and Their Government 8
US Senate Election Likely voters prefer Kamala Harris over Loretta Sanchez by 22 points (42% to 20%). Harris led Sanchez by 7 points in the September PPIC survey (32% to 25%), 18 points in the July PPIC survey (38% to 20%), and 8 points in the May PPIC survey (34% to 26%), when we were not including ballot designations. Today, Harris leads Sanchez by 27 points (51% to 24%) when we exclude the 18 percent who volunteer they would not vote for either Democratic candidate. Harris has majority support among Democrats (56%) and leads by 21 points among independents (38% to 17%); 36 percent of Republicans volunteer they will not vote in the US Senate race. Harris leads by wide margins among whites and members of other racial/ethnic groups while Sanchez has a slight lead among Latinos (41% to 33%). Support for Harris is similar among men and women, and is higher among those with higher incomes and college degrees, and those who are 35 and older. Harris leads by wide margins in the San Francisco Bay Area, Los Angeles, and Orange/San Diego, but the race is closer in the Inland Empire and the Central Valley. Clinton’s supporters favor Harris over Sanchez (58% to 21%), while about half of Trump’s supporters (45%) say they will not vote in the US Senate election between two Democrats.
“If the November 8 election for the US Senate were being held today, would you vote for Kamala Harris, a Democrat, Attorney General of California, or Loretta Sanchez, a Democrat, United States Congresswoman?”
Likely voters only Kamala Harris Loretta Sanchez Would not vote for US senator (volunteered)
Don’t know
All likely voters 42% 20% 18% 20%
Party
Democrats 56 22 5 16
Republicans 24 21 36 18
Independents 38 17 16 28
Income
Less than $40,000 36 22 20 22
$40,000 to $80,000 37 28 14 22
$80,000 or more 50 13 19 18
Race/Ethnicity
Latinos 33 41 6 19
Whites 39 17 22 22
Other groups 60 11 12 17
About half of likely voters (51%) are satisfied with their choices of candidates in the US Senate election—similar to 48 percent when we asked this question in the September PPIC survey and 57 percent when asked in the May PPIC survey, before the June primary. Today, a majority of Democrats (70%) are satisfied, but fewer than half of independents (48%) and fewer than three in ten Republicans (27%) are satisfied. Satisfaction is much higher among Clinton supporters (72%) than Trump supporters (18%). Latinos (63%) and other racial/ethnic groups (61%) are much more satisfied than whites (45%). Satisfaction with the US Senate candidate choices is higher among women than men (56% to 44%).
“In general, would you say you are satisfied or not satisfied with your choices of candidates in the election for US Senate in 2016?”
Likely voters only All likely voters
Party Race/Ethnicity
Dem Rep Ind Latinos Whites Other groups
Satisfied 51% 70% 27% 48% 63% 45% 61%
Not satisfied 36 18 64 30 25 42 27
Both (volunteered) 1 1 1 – – 1 –
Don’t know 12 11 8 22 11 12 11

PPIC STATEWIDE SURVEY OCTOBER 2016
PPIC.ORG/SURVEY Californians and Their Government 9
Outcome of Congressional and Legislative Elections Whether or not Republicans maintain control of the US Congress is a major subplot in the 2016 election. Fifty-five percent of likely voters prefer Democratic control and 35 percent prefer Republican control as the outcome of this year’s congressional elections. Support for Democratic control was similar in October 2012, when Republicans controlled Congress (52% Democratic control, 39% Republican control in October 2012 PPIC survey). In contrast, support for Democratic control was not as high in October 2010, when Democrats controlled Congress (45% Democratic control, 43% Republican control in October 2010 PPIC survey). Today, most Democrats (91%) and Clinton supporters (89%) prefer Democratic control, while Republicans (84%) and Trump supporters (90%) prefer Republican control. Independents prefer Democratic control (55% to 30%). Most Harris (75%) and Sanchez supporters (60%) prefer Democratic control. Latinos (74%) and members of other racial/ethnic groups (76%) prefer Democratic control, while whites are more divided (45% Democratic control, 46% Republican control). Support for Democratic control is highest among younger likely voters. Nationally, an October NBC News/Wall Street Journal survey found voters evenly divided (46% Democratic control, 44% Republican control).
“What is your preference for the outcome of this year's congressional elections: a Congress controlled by Republicans or a Congress controlled by Democrats?”
Likely voters only All likely voters
Party Age
Dem Rep Ind 18 to 34 35 to 54 55 and older
Republicans 35% 5% 84% 30% 23% 34% 42%
Democrats 55 91 7 55 68 55 50
Neither (volunteered) 5 3 4 7 6 5 5
Don’t know 4 1 5 8 2 6 3
In California, a key question is whether Democrats, who have majority control of the state legislature, will gain a supermajority as a result of the November 2016 election. Forty-one percent of likely voters say it would be a good thing for California if Democrats in the state legislature gained a two-thirds majority, while 31 percent say it would be a bad thing and 24 percent say it would make no difference. Likely voters were more divided about a Democratic supermajority before the 2014 statewide election (34% good thing, 37% bad thing, 28% no difference in September 2014 PPIC survey) and after the 2012 statewide election (41% good thing, 36% bad thing, 22% no difference in January 2013 PPIC survey). Today, most Democrats say it would be a good thing (66%) and most Republicans say it would be a bad thing (65%) if Democrats had a supermajority, while independents are more divided (38% good thing, 31% bad thing). Half in Los Angeles (50%) and 46 percent in the San Francisco Bay Area say it would be a good thing for California. Most Latinos (58%) and members of other racial/ethnic groups (49%) say it would be a good thing, while whites are divided (35% good thing, 39% bad thing).
“If the Democrats in the state legislature gained a two-thirds majority as a result of the November 2016 election, do you think that this would be a good thing or a bad thing for California, or does it make no difference?”
Likely voters only All likely voters
Party Race/Ethnicity
Dem Rep Ind Latinos Whites Other groups
Good thing 41% 66% 8% 38% 58% 35% 49%
Bad thing 31 8 65 31 15 39 16
No difference 24 21 23 26 23 22 28
Don’t know 4 5 4 4 5 3 7

PPIC STATEWIDE SURVEY OCTOBER 2016
PPIC.ORG/SURVEY Californians and Their Government 10
Proposition 51 Proposition 51 is a citizens’ initiative that would authorize the state to issue $9 billion in bonds to fund construction and modernization of K–12 schools and community college facilities. It is estimated that it would cost $17.6 billion to pay off the principal and interest on the bonds. This measure requires a simple majority to pass. When read the Proposition 51 ballot title and label, 46 percent of likely voters say they would vote yes, 41 percent would vote no, and 12 percent are undecided. Findings were similar in September (47% yes, 43% no, 10% don’t know). Today, support for Proposition 51 is similar among public school parents (47%) and other likely voters (46%). While a solid majority of Democratic likely voters (62%) would vote yes, fewer than half of independents (45%) and even fewer Republicans (29%) support the measure. Regionally, Proposition 51 only garners majority support in Los Angeles and Orange/San Diego. Latinos (64%) and members of other racial/ethnic groups (54%) are much more likely than whites (40%) to support Proposition 51. Across age groups, younger likely voters (58% age 18–34) are more likely to support this measure than are older likely voters.
“Proposition 51 is called the ‘School Bonds. Funding for K–12 School and Community College Facilities. Initiative Statute.’ If the election were held today, would you vote yes or no on Proposition 51?”*
Likely voters only Yes No Don’t know
All likely voters 46% 41% 12%
Public school parents 47 34 19
Party
Democrats 62 25 13
Republicans 29 62 8
Independents 45 42 14
Region
Central Valley 41 52 7
San Francisco Bay Area 43 41 16
Los Angeles 52 33 15
Orange/San Diego 53 34 13
Inland Empire 37 52 11 *For complete text of proposition question, see p. 25.
Forty-one percent of likely voters say the outcome of Proposition 51 is very important to them, similar to the September PPIC survey (42%). Across parties, independents are less likely than Republicans and Democrats to say the result is very important. Those who would vote yes on Proposition 51 are somewhat more likely than those who would vote no to say the outcome is very important to them.
“How important to you is the outcome of the vote on Proposition 51?”
Likely voters only All likely voters
Party Vote on Proposition 51
Dem Rep Ind Yes No
Very important 41% 42% 42% 31% 46% 38%
Somewhat important 38 40 33 41 47 31
Not too important 10 7 15 13 5 18
Not at all important 5 5 5 6 1 11
Don’t know 6 7 4 9 2 2
The response to our tracking question among likely voters indicates that support for Proposition 51 (46%) is lower than the level of general support for a state school bond (59%).

PPIC STATEWIDE SURVEY OCTOBER 2016
PPIC.ORG/SURVEY Californians and Their Government 11
Proposition 55 Proposition 55 is a citizens’ initiative that would extend by 12 years the temporary tax increase on earnings over $250,000, enacted in 2012 as part of Proposition 30 and set to expire in 2018. The revenue would be allocated to K–12 schools, community colleges, and health care in certain years. It requires a simple majority to pass. When read the Proposition 55 ballot title and label, 59 percent of likely voters say they would vote yes, 31 percent would vote no, and 10 percent are undecided. The margin between those saying yes and no is 28 points today; it was 16 points in the September PPIC survey (54% yes, 38% no, 8% undecided). Today, three-quarters of Democrats and a majority of independents would vote yes, while a majority of Republicans would vote no. Public school parents (60%) are about as likely as other likely voters (59%) to support the measure. Latinos (74%) and other racial/ethnic groups (66%) are much more likely than whites (53%) to be in favor. Support is higher among younger likely voters (81% age 18–34) and those making less than $40,000 (72%) than it is among older and more affluent likely voters.
“Proposition 55 is called the ‘Tax Extension to Fund Education and Healthcare. Initiative Constitutional Amendment.’ If the election were held today, would you vote yes or no on Proposition 55?”*
Likely voters only Yes No Don’t know
All likely voters 59% 31% 10%
Public school parents 60 32 8
Party
Democrats 76 14 10
Republicans 35 57 9
Independents 55 32 12
Region
Central Valley 51 43 6
San Francisco Bay Area 60 28 12
Los Angeles 67 19 14
Orange/San Diego 59 33 8
Inland Empire 45 45 11
Income
Under $40,000 72 18 10
$40,000 to $80,000 59 32 9
$80,000 or more 54 35 10
*For complete text of proposition question, see p. 25.
Forty-seven percent of likely voters say the outcome of Proposition 55 is very important to them, up slightly from the September PPIC survey (41%). Supporters are more likely than opponents—and Democrats and Republicans are more likely than independents—to say the outcome is very important.
“How important to you is the outcome of the vote on Proposition 55?”
Likely voters only All likely voters
Party Vote on Proposition 55
Dem Rep Ind Yes No
Very important 47% 51% 47% 36% 53% 43%
Somewhat important 37 36 30 45 40 35
Not too important 9 7 14 9 6 14
Not at all important 2 1 3 3 – 8
Don’t know 5 5 5 7 1 –
Responses to our tracking question among likely voters indicate that support for Proposition 55 (59%) is similar to the level of general support for raising state income taxes on high incomes (64%).

PPIC STATEWIDE SURVEY OCTOBER 2016
PPIC.ORG/SURVEY Californians and Their Government 12
Proposition 56 Proposition 56 would increase the cigarette tax by $2.00 per pack to fund health care, tobacco use prevention, and law enforcement. Cigarette tax measures fell short of the simple majority needed to pass in November 2006 (Proposition 86: 48.3% yes) and June 2012 (Proposition 29: 49.8% yes). When read the Proposition 56 ballot title and label, 56 percent of likely voters say they would vote yes, 38 percent would vote no, and 6 percent are undecided. Findings were similar in September (59% yes, 36% no, 5% undecided). Majorities of Democratic and independent likely voters would vote yes; Republicans are more divided. Half or more across income groups, and a solid majority of likely voters under age 55, would vote yes. Women (60%) are slightly more likely than men (53%), and Latinos (80%) and members of other racial/ethnic groups (65%) are more likely than whites (49%), to support the measure.
“Proposition 56 is called the ‘Cigarette Tax to Fund Healthcare, Tobacco Use Prevention, Research, and Law Enforcement. Initiative Constitutional Amendment and Statute.’ If the election were held today, would you vote yes or no on Proposition 56?”*
Likely voters only Yes No Don’t know
All likely voters 56% 38% 6%
Party
Democrats 69 25 6
Republicans 45 50 5
Independents 55 39 7
Region
Central Valley 47 49 5
San Francisco Bay Area 60 31 8
Los Angeles 67 28 5
Orange/San Diego 49 47 4
Inland Empire 51 43 6
Income
Under $40,000 55 40 5
$40,000 to $80,000 50 44 7
$80,000 or more 64 31 5
*For complete text of proposition question, see p. 26.
Forty-seven percent of likely voters call the outcome of Proposition 56 very important, similar to the September PPIC survey (43%). Democrats, Republicans, and independents are all about equally likely to hold this view. Supporters and opponents of Proposition 56 are about equally likely to call the outcome very important to them (49% to 48%).
“How important to you is the outcome of the vote on Proposition 56?”
Likely voters only All likely voters
Party Vote on Proposition 56
Dem Rep Ind Yes No
Very important 47% 46% 51% 46% 49% 48%
Somewhat important 36 40 27 40 42 29
Not too important 10 7 15 6 6 15
Not at all important 4 4 3 6 2 7
Don’t know 3 3 4 2 – 1
Responses to our tracking question among likely voters indicate that support for Proposition 56 (56%) is slightly lower than general support for increasing state taxes on the purchase of cigarettes (65%).

PPIC STATEWIDE SURVEY OCTOBER 2016
PPIC.ORG/SURVEY Californians and Their Government 13
Proposition 64 Proposition 64 would legalize marijuana under state law for use by adults age 21 or older and impose state taxes on sales and cultivation. A measure to legalize marijuana failed six years ago (Proposition 19: 46.5% yes). When read the Proposition 64 ballot title and label, 55 percent of likely voters say they would vote yes, 38 percent would vote no, and 6 percent are undecided. Findings were similar in September (60% yes, 36% no, 4% undecided). Today, majorities of Democratic and independent likely voters support Proposition 64, while a solid majority of Republicans would vote no. Majorities across all regions would vote yes. Majorities of whites and other racial/ethnic groups would vote yes, while Latinos are closely divided. Across age groups, support is highest among likely voters age 18–34 (78%, 57% age 35–54, 45% 55 and older). Support is much higher among those who say they have tried marijuana than among those who have not (69% to 40%).
“Proposition 64 is called the ‘Marijuana Legalization. Initiative Statute.’ If the election were held today, would you vote yes or no on Proposition 64?”*
Likely voters only Yes No Don’t know
All likely voters 55% 38% 6%
Party
Democrats 66 27 7
Republicans 33 60 7
Independents 56 38 5
Region
Central Valley 51 44 5
San Francisco Bay Area 66 29 5
Los Angeles 55 39 7
Orange/San Diego 55 42 4
Inland Empire 51 42 7
Race/Ethnicity
Latinos 47 48 6
Whites 55 39 7
Other groups 65 29 7 *For complete text of proposition question, see p. 26.
Fifty-one percent of likely voters say the outcome of Proposition 64 is very important to them, similar to the September PPIC survey (50%). Across parties, Republicans are most likely to hold this opinion. Those who would vote no on Proposition 64 are more likely than those who would vote yes to call the outcome very important to them (60% to 50%).
“How important to you is the outcome of the vote on Proposition 64?”
Likely voters only All likely voters
Party Vote on Proposition 64
Dem Rep Ind Yes No
Very important 51% 49% 57% 43% 50% 60%
Somewhat important 31 32 28 38 35 24
Not too important 12 12 9 11 13 10
Not at all important 3 4 2 5 2 6
Don’t know 2 3 3 2 – –
Responses to our tracking question among likely voters indicate that support for Proposition 64 (55%) is similar to the level of general support for legalizing the use of marijuana (57%).

PPIC STATEWIDE SURVEY OCTOBER
PPIC.ORG/SURVEY Californians and Their Government
State and National Issues
Key Findings Approval of Governor Brown ( %) is
higher than approval of the state legislature ( %). Approval ratings of state elected officials today are higher than they were four years ago. (page )
A strong majority of Californians approve of President Barack Obama ( %); approval of Congress ( %) is much lower, and approval ratings for federal elected officials are similar to four years ago. (page )
A majority of Californians say the state is headed in the right direction ( %), and four in ten say the nation is heading in the right direction ( %). (pages , )
When asked to name the most important issue facing the state, about percent say jobs and the economy. Slightly fewer than half of Californians say that the state ( %) and the nation ( %) will have good times economically over the next months. (page )
About two in three Californians think the federal government is run by a few big interests. Fifty-five percent say that the federal government wastes a lot of the money we pay in taxes, and about two in three say they think you can trust the federal government to do what is right some or none of the time. (page )
About half of Californians have a favorable opinion of the Democratic Party ( %), while percent have a favorable opinion of the Republican Party. Fifty-eight percent say that the two major parties are doing such a poor job that a third major party is needed. (page )
55
46
0
20
40
60
80
Oct-12 Oct-13 Oct-14 Oct-15 Oct-16
Perc
ent a
ll ad
ults
Governor Brown
California Legislature
Approval ratings of state elected officials
68
31
0
20
40
60
80
Oct-12 Oct-13 Oct-14 Oct-15 Oct-16
Perc
ent a
ll ad
ults
President Obama
US Congress
Approval ratings of federal elected officials
54
4339
50
0
20
40
60
80
California United States
Perc
ent a
ll ad
ults
Right Direction
Wrong Direction
Perceived direction of California and the US

PPIC STATEWIDE SURVEY OCTOBER 2016
PPIC.ORG/SURVEY Californians and Their Government 15
Approval Ratings of State Elected Officials More than half of adults (55%) and likely voters (56%) approve of the way Jerry Brown is handling his job as governor of California. Approval of the governor was similar in September (55% adults and likely voters), but it was lower four years ago in October 2012 (42% adults, 45% likely voters). Today, about seven in ten Democrats approve of Governor Brown compared to one in three Republicans and half of independents. Across regions, approval is highest in the San Francisco Bay Area (61%) and Los Angeles (58%), followed by Orange/San Diego (54%), the Inland Empire (47%), and the Central Valley (42%). Latinos (63%), Asian Americans (59%), and African Americans (56%) are more likely than whites (48%) to approve.
In November, all seats in the California State Assembly and half of the seats in the California State Senate will be up for election. Today, 46 percent of adults and 43 percent of likely voters approve of how the state legislature is handling its job. Approval of the legislature was similar in September (47% adults, 42% likely voters), but it was much lower four years ago in October 2012 (28% adults, 21% likely voters). Today, about six in ten Democrats approve of the state legislature, compared to fewer Republicans (23%) and independents (35%). About half of residents in Los Angeles (51%) and the San Francisco Bay Area (50%) approve, compared to fewer elsewhere (45% Orange/San Diego, 41% Inland Empire, 37% Central Valley). Approval is higher among Asian Americans (59%) and Latinos (55%) than among African Americans (38%) and whites (37%).
“Overall, do you approve or disapprove of…?”
All adults
Party Likely voters Dem Rep Ind
the way that Jerry Brown is handling his job as governor of California
Approve 55% 69% 34% 50% 56%
Disapprove 24 12 59 35 32
Don't know 21 18 8 15 12
the way that the California Legislature is handling its job
Approve 46 59 23 35 43
Disapprove 33 25 69 42 43
Don't know 20 16 8 22 14
With the November election drawing closer, California adults and likely voters are divided about the direction of the state. A majority of adults (54%) and half of likely voters (50%) say things are generally going in the right direction. Findings were similar in September (52% adults, 45% likely voters). Positive views were less prevalent in October 2012 (39% adults, 34% likely voters). Today, a strong majority of Democrats (67%) say things are going in the right direction, compared to one in five Republicans (22%) and under half of independents (45%). Optimism declines as age increases, and Asian Americans (79%), Latinos (61%), and African Americans (54%) are more likely than whites (44%) to hold a positive view.
“Do you think things in California are generally going in the right direction or the wrong direction?”
All adults
Party Likely voters Dem Rep Ind
Right direction 54% 67% 22% 45% 50%
Wrong direction 39 26 75 50 45
Don't know 7 7 4 6 5

PPIC STATEWIDE SURVEY OCTOBER 2016
PPIC.ORG/SURVEY Californians and Their Government 16
Approval Ratings of Federal Elected Officials As President Obama enters the homestretch of his time in office, his approval rating among Californians is at its highest since 2009. Sixty-eight percent of adults and 60 percent of likely voters approve of the president, similar to September (64% adults, 54% likely voters). In October 2012, 63 percent of adults and 54 percent of likely voters approved. There is a wide partisan divide, with 89 percent of Democrats approving and 74 percent of Republicans disapproving. Sixty-four percent of independents approve of the president. Majorities across regions and demographic groups approve of the president. African Americans (88%), Asian Americans (85%), and Latinos (77%) are more likely than whites (54%) to approve. Among likely voters who support Hillary Clinton, 95 percent support the president, while 95 percent of Donald Trump supporters disapprove. Nationally, 55 percent of adults approve of the president, according to an October CBS News poll.
In November, all 53 of California’s seats in the US House of Representatives and one of California’s seats in the US Senate will be up for election. Today, 31 percent of adults and 17 percent of likely voters approve of the way the US Congress is handling its job. Approval of Congress was similar in September (29% adults, 16% likely voters) and shortly before the 2012 congressional elections (26% adults, 15% likely voters in October 2012). Today, fewer than four in ten across parties and regions approve of Congress. Approval is below 50 percent across racial/ethnic, age, education, and income groups—with whites (16%), older Californians (21% 55 and older), higher-income Californians (21% $80,000 or more), and those who have attended college (22%) the least likely to approve. According to an October Gallup poll, 18 percent of adults nationwide approve of Congress.
“Overall, do you approve or disapprove of…?”
All adults
Party Likely voters Dem Rep Ind
the way Barack Obama is handling his job as president of the United States
Approve 68% 89% 24% 64% 60%
Disapprove 29 9 74 35 38
Don't know 3 2 2 1 2
the way the US Congress is handling its job
Approve 31 26 19 26 17
Disapprove 59 65 79 64 77
Don't know 10 9 2 9 6
Four in ten adults (43%) and likely voters (40%) think things in the United States are generally going in the right direction. Optimism about the direction of the nation was similar in September 2015 (44% adults, 35% likely voters) and in October 2012 (46% adults, 42% likely voters). Today, Democrats (57%) are much more likely than independents (33%) and Republicans (17%) to say that things in the United States are generally going in the right direction. Fewer than half across regions and age, education, and income groups say things are heading in the right direction.
“Do you think things in the United States are generally going in the right direction or the wrong direction?”
All adults
Party Likely voters Dem Rep Ind
Right direction 43% 57% 17% 33% 40%
Wrong direction 50 36 81 59 55
Don't know 7 7 2 8 5
PPIC STATEWIDE SURVEY OCTOBER 2016
PPIC.ORG/SURVEY Californians and Their Government 17
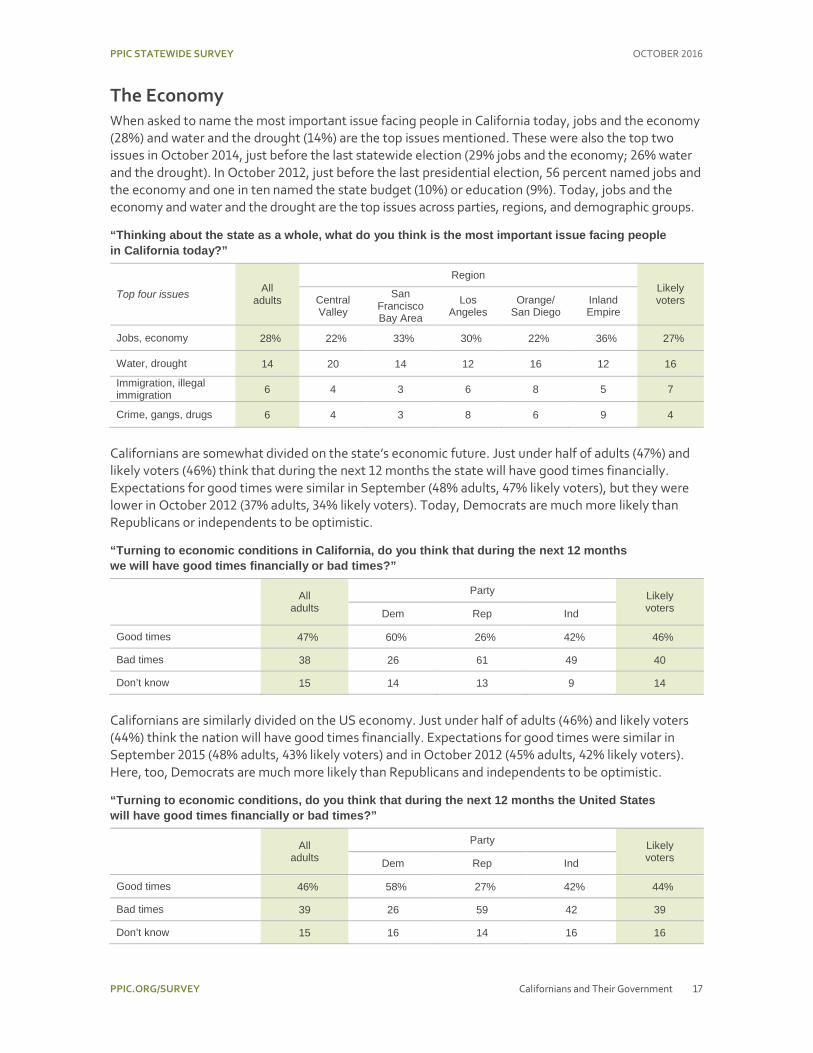
The Economy When asked to name the most important issue facing people in California today, jobs and the economy (28%) and water and the drought (14%) are the top issues mentioned. These were also the top two issues in October 2014, just before the last statewide election (29% jobs and the economy; 26% water and the drought). In October 2012, just before the last presidential election, 56 percent named jobs and the economy and one in ten named the state budget (10%) or education (9%). Today, jobs and the economy and water and the drought are the top issues across parties, regions, and demographic groups.
“Thinking about the state as a whole, what do you think is the most important issue facing people in California today?”
Top four issues All adults
Region Likely voters Central
Valley
San Francisco Bay Area
Los Angeles
Orange/ San Diego
Inland Empire
Jobs, economy 28% 22% 33% 30% 22% 36% 27%
Water, drought 14 20 14 12 16 12 16
Immigration, illegal immigration 6 4 3 6 8 5 7
Crime, gangs, drugs 6 4 3 8 6 9 4
Californians are somewhat divided on the state’s economic future. Just under half of adults (47%) and likely voters (46%) think that during the next 12 months the state will have good times financially. Expectations for good times were similar in September (48% adults, 47% likely voters), but they were lower in October 2012 (37% adults, 34% likely voters). Today, Democrats are much more likely than Republicans or independents to be optimistic.
“Turning to economic conditions in California, do you think that during the next 12 months we will have good times financially or bad times?”
All adults
Party Likely voters Dem Rep Ind
Good times 47% 60% 26% 42% 46%
Bad times 38 26 61 49 40
Don’t know 15 14 13 9 14
Californians are similarly divided on the US economy. Just under half of adults (46%) and likely voters (44%) think the nation will have good times financially. Expectations for good times were similar in September 2015 (48% adults, 43% likely voters) and in October 2012 (45% adults, 42% likely voters). Here, too, Democrats are much more likely than Republicans and independents to be optimistic.
“Turning to economic conditions, do you think that during the next 12 months the United States will have good times financially or bad times?”
All adults
Party Likely voters Dem Rep Ind
Good times 46% 58% 27% 42% 44%
Bad times 39 26 59 42 39
Don’t know 15 16 14 16 16
PPIC STATEWIDE SURVEY OCTOBER 2016
PPIC.ORG/SURVEY Californians and Their Government 18
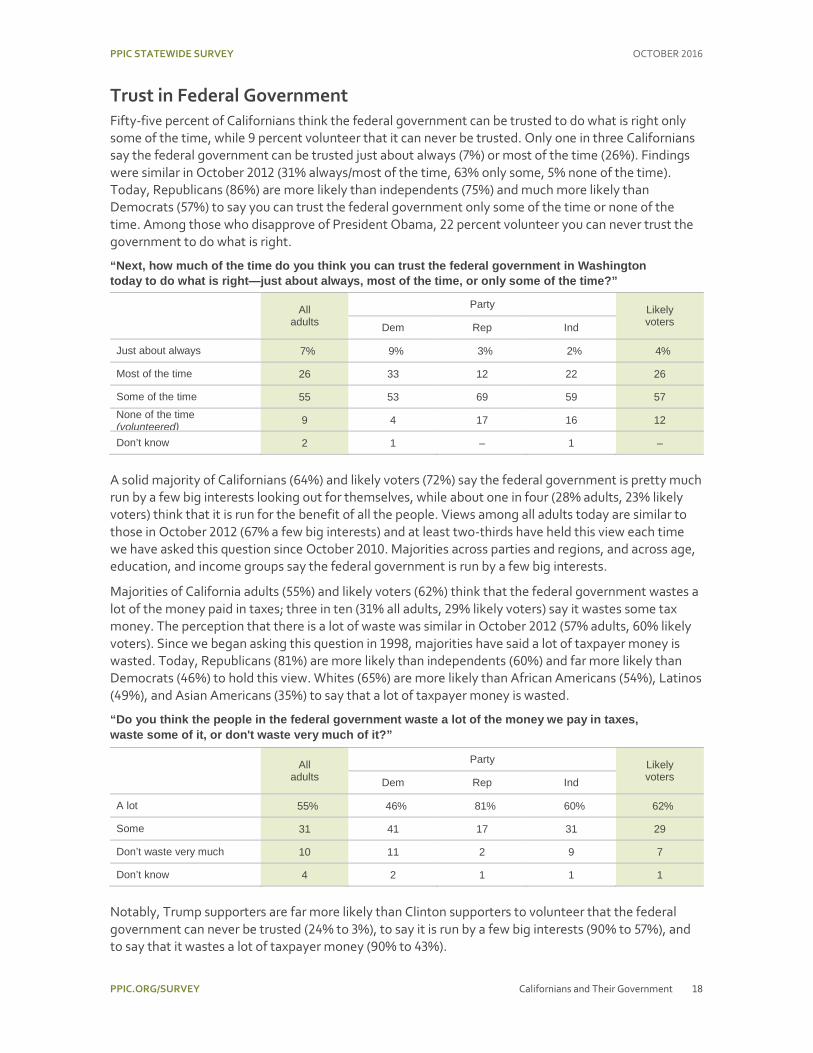
Trust in Federal Government Fifty-five percent of Californians think the federal government can be trusted to do what is right only some of the time, while 9 percent volunteer that it can never be trusted. Only one in three Californians say the federal government can be trusted just about always (7%) or most of the time (26%). Findings were similar in October 2012 (31% always/most of the time, 63% only some, 5% none of the time). Today, Republicans (86%) are more likely than independents (75%) and much more likely than Democrats (57%) to say you can trust the federal government only some of the time or none of the time. Among those who disapprove of President Obama, 22 percent volunteer you can never trust the government to do what is right.
“Next, how much of the time do you think you can trust the federal government in Washington today to do what is right—just about always, most of the time, or only some of the time?”
All adults
Party Likely voters Dem Rep Ind
Just about always 7% 9% 3% 2% 4%
Most of the time 26 33 12 22 26
Some of the time 55 53 69 59 57 None of the time (volunteered) 9 4 17 16 12
Don’t know 2 1 – 1 –
A solid majority of Californians (64%) and likely voters (72%) say the federal government is pretty much run by a few big interests looking out for themselves, while about one in four (28% adults, 23% likely voters) think that it is run for the benefit of all the people. Views among all adults today are similar to those in October 2012 (67% a few big interests) and at least two-thirds have held this view each time we have asked this question since October 2010. Majorities across parties and regions, and across age, education, and income groups say the federal government is run by a few big interests.
Majorities of California adults (55%) and likely voters (62%) think that the federal government wastes a lot of the money paid in taxes; three in ten (31% all adults, 29% likely voters) say it wastes some tax money. The perception that there is a lot of waste was similar in October 2012 (57% adults, 60% likely voters). Since we began asking this question in 1998, majorities have said a lot of taxpayer money is wasted. Today, Republicans (81%) are more likely than independents (60%) and far more likely than Democrats (46%) to hold this view. Whites (65%) are more likely than African Americans (54%), Latinos (49%), and Asian Americans (35%) to say that a lot of taxpayer money is wasted.
“Do you think the people in the federal government waste a lot of the money we pay in taxes, waste some of it, or don't waste very much of it?”
All adults
Party Likely voters Dem Rep Ind
A lot 55% 46% 81% 60% 62%
Some 31 41 17 31 29
Don’t waste very much 10 11 2 9 7
Don’t know 4 2 1 1 1
Notably, Trump supporters are far more likely than Clinton supporters to volunteer that the federal government can never be trusted (24% to 3%), to say it is run by a few big interests (90% to 57%), and to say that it wastes a lot of taxpayer money (90% to 43%).

PPIC STATEWIDE SURVEY OCTOBER 2016
PPIC.ORG/SURVEY Californians and Their Government 19
Party Perceptions As we near the end of a contentious election season, what do Californians think about the two major political parties? About half of adults (53%) and likely voters (50%) have a favorable impression of the Democratic Party, and about one in four (23% adults, 24% likely voters) have a favorable impression of the Republican Party. Democratic Party favorability was similar in October 2012 (58% all adults, 53% likely voters). However, the favorability of the Republican Party was higher in October 2012 (35% all adults, 38% likely voters) than it is today. Findings among all adults were similar in May. Today, across racial/ethnic groups, Latinos (67%), African Americans (62%), and Asian Americans (59%) are more likely than whites (42%) to have a favorable impression of the Democratic Party. More than six in ten Californians across racial/ethnic groups have an unfavorable impression of the Republican Party. Twenty-three percent of adults and 27 percent of likely voters have an unfavorable view of both parties.
In a September Gallup poll, 42 percent of adults nationwide had a favorable opinion of the Democratic Party and 39 percent had a favorable view of the Republican Party.
“Do you have a favorable or an unfavorable impression of the…?”
All adults
Party Likely voters Dem Rep Ind
Democratic Party
Favorable 53% 81% 16% 42% 50%
Unfavorable 37 16 81 49 47
Don't know 9 3 3 9 3
Republican Party
Favorable 23 9 47 21 24
Unfavorable 69 87 50 70 72
Don't know 8 4 3 9 4
A majority of Californians (58%) say that the Republican and Democratic Parties do such a poor job that a third major party is needed. Fewer said the same in the month before the 2012 election (48% October 2012). Today, majorities of Democrats (53%) and Republicans (63%) and a strong majority of independents (70%) think a third party is needed. Among those who are not satisfied with the choices of presidential candidates, 76 percent say a third party is needed. Majorities across regions and age, education, and income groups say that a third party is needed. The September Gallup Poll found that 57 percent of adults nationwide think the Democratic and Republican Parties do such a poor job that a third major party is needed.
“In your view, do the Republican and Democratic Parties do an adequate job representing the American people, or do they do such a poor job that a third major party is needed?”
All adults
Party Likely voters Dem Rep Ind
Adequate job 32% 38% 24% 19% 28%
Third party is needed 58 53 63 70 62
Don't know 10 9 13 10 10
Favorability of political parties over time
53
23
0
20
40
60
80
100
Oct-12 Oct-13 Oct-14 Oct-15 Oct-16
Perc
ent a
ll ad
ults
Democratic PartyRepublican Party

PPIC STATEWIDE SURVEY OCTOBER 2016
PPIC.ORG/SURVEY Californians and Their Government 20
Regional Map

PPIC STATEWIDE SURVEY OCTOBER 2016
PPIC.ORG/SURVEY Californians and Their Government 21
Methodology The PPIC Statewide Survey is directed by Mark Baldassare, president and CEO and survey director at the Public Policy Institute of California, with assistance from survey research associate David Kordus, project manager for this survey, associate survey director Dean Bonner, and survey research associate Lunna Lopes. The Californians and Their Government series is supported with funding from The James Irvine Foundation and the PPIC Donor Circle. The PPIC Statewide Survey invites input, comments, and suggestions from policy and public opinion experts and from its own advisory committee, but survey methods, questions, and content are determined solely by PPIC’s survey team.
Findings in this report are based on a survey of 1,704 California adult residents, including 852 interviewed on landline telephones and 852 interviewed on cell phones. Interviews took an average of 18 minutes to complete. Interviewing took place on weekend days and weekday nights from October 14–23, 2016.
Landline interviews were conducted using a computer-generated random sample of telephone numbers that ensured that both listed and unlisted numbers were called. All landline telephone exchanges in California were eligible for selection, and the sample telephone numbers were called as many as six times to increase the likelihood of reaching eligible households. Once a household was reached, an adult respondent (age 18 or older) was randomly chosen for interviewing using the “last birthday method” to avoid biases in age and gender.
Cell phone interviews were conducted using a computer-generated random sample of cell phone numbers. All cell phone numbers with California area codes were eligible for selection, and the sample telephone numbers were called as many as eight times to increase the likelihood of reaching an eligible respondent. Once a cell phone user was reached, it was verified that this person was age 18 or older, a resident of California, and in a safe place to continue the survey (e.g., not driving).
Cell phone respondents were offered a small reimbursement to help defray the cost of the call. Cell phone interviews were conducted with adults who have cell phone service only and with those who have both cell phone and landline service in the household.
Live landline and cell phone interviews were conducted by Abt SRBI, Inc., in English and Spanish, according to respondents’ preferences. Accent on Languages, Inc., translated new survey questions into Spanish, with assistance from Renatta DeFever.
Abt SRBI uses the US Census Bureau’s 2010–2014 American Community Survey’s (ACS) Public Use Microdata Series for California (with regional coding information from the University of Minnesota’s Integrated Public Use Microdata Series for California) to compare certain demographic characteristics of the survey sample—region, age, gender, race/ethnicity, and education—with the characteristics of California’s adult population. The survey sample was closely comparable to the ACS figures. To estimate landline and cell phone service in California, Abt SRBI used 2014 state-level estimates released by the National Center for Health Statistics—which used data from the National Health Interview Survey (NHIS) and the ACS—and 2015 estimates for the West Census Region in the latest NHIS report. The estimates for California were then compared against landline and cell phone service reported in this survey. We also used voter registration data from the California Secretary of State to compare the party registration of registered voters in our sample to party registration statewide. The landline and cell phone samples were then integrated using a frame integration weight, while sample balancing adjusted for differences across regional, age, gender, race/ethnicity, education, telephone service, and party registration groups.
The sampling error, taking design effects from weighting into consideration, is ±3.4 percent at the 95 percent confidence level for the total unweighted sample of 1,704 adults. This means that 95 times out of 100, the results will be within 3.4 percentage points of what they would be if all adults in California

PPIC STATEWIDE SURVEY OCTOBER 2016
PPIC.ORG/SURVEY Californians and Their Government 22
were interviewed. The sampling error for unweighted subgroups is larger: for the 1,358 registered voters, the sampling error is ±3.7 percent; for the 1,024 likely voters, it is ±4.3 percent. Sampling error is only one type of error to which surveys are subject. Results may also be affected by factors such as question wording, question order, and survey timing.
We present results for five geographic regions, accounting for approximately 90 percent of the state population. “Central Valley” includes Butte, Colusa, El Dorado, Fresno, Glenn, Kern, Kings, Madera, Merced, Placer, Sacramento, San Joaquin, Shasta, Stanislaus, Sutter, Tehama, Tulare, Yolo, and Yuba Counties. “San Francisco Bay Area” includes Alameda, Contra Costa, Marin, Napa, San Francisco, San Mateo, Santa Clara, Solano, and Sonoma Counties. “Los Angeles” refers to Los Angeles County, “Inland Empire” refers to Riverside and San Bernardino Counties, and “Orange/San Diego” refers to Orange and San Diego Counties. Residents of other geographic areas are included in the results reported for all adults, registered voters, and likely voters, but sample sizes for these less populous areas are not large enough to report separately.
We present specific results for non-Hispanic whites, who account for 43 percent of the state’s adult population, and also for Latinos, who account for about a third of the state’s adult population and constitute one of the fastest-growing voter groups. We also present results for non-Hispanic Asians, who make up about 15 percent of the state’s adult population, and non-Hispanic African Americans, who comprise about 6 percent. Results for other racial/ethnic groups—such as Native Americans—are included in the results reported for all adults, registered voters, and likely voters, but sample sizes are not large enough for separate analysis. We compare the opinions of those who report they are registered Democrats, registered Republicans, and decline-to-state or independent voters; the results for those who say they are registered to vote in other parties are not large enough for separate analysis. We also analyze the responses of likely voters—so designated per their responses to voter registration survey questions, previous election participation, intention to vote or if they have already voted in the presidential election in November, and current interest in politics.
The percentages presented in the report tables and in the questionnaire may not add to 100 due to rounding.
We compare current PPIC Statewide Survey results to those in our earlier surveys and to those in national surveys by CBS News, Gallup, and NBC News/Wall Street Journal. Additional details about our methodology can be found at www.ppic.org/content/other/SurveyMethodology.pdf and are available upon request through [email protected].

PPIC STATEWIDE SURVEY OCTOBER 2016
PPIC.ORG/SURVEY Californians and Their Government 23
Questionnaire and Results CALIFORNIANS AND THEIR GOVERNMENT
October 14–23, 2016 1,704 California Adult Residents: English, Spanish
MARGIN OF ERROR ±3.4% AT 95% CONFIDENCE LEVEL FOR TOTAL SAMPLE PERCENTAGES MAY NOT ADD TO 100 DUE TO ROUNDING
First, thinking about the state as a whole, what do you think is the most important issue facing people in California today?
[code, don’t read]
28% jobs, economy 14 water, drought 6 crime, gangs, drugs 6 immigration, illegal immigration
5 education, schools, teachers 4 environment, pollution, global
warming 4 government in general, election 4 infrastructure 3 homelessness 3 housing costs, housing availability 3 state budget, deficit, taxes 2 health care, health insurance 2 poverty, the poor 2 race relations, racial and ethnic
issues 2 terrorism, security issues 7 other (specify) 5 don’t know
Overall, do you approve or disapprove of the way that Jerry Brown is handling his job as governor of California?
55% approve 24 disapprove 21 don’t know
Overall, do you approve or disapprove of the way that the California Legislature is handling its job?
46% approve 33 disapprove 20 don’t know
Do you think things in California are generally going in the right direction or the wrong direction?
54% right direction 39 wrong direction 7 don’t know
Turning to economic conditions in California, do you think that during the next 12 months we will have good times financially or bad times?
47% good times 38 bad times 15 don’t know
Next, some people are registered to vote and others are not. Are you absolutely certain that you are registered to vote in California?
63% yes [ask Q6a] 37 no [skip to Q7b]
6a. Are you registered as a Democrat, a Republican, another party, or are you registered as a decline-to-state or independent voter?
43% Democrat [ask Q7] 27 Republican [skip to Q7a] 5 another party (specify) [skip to Q8] 24 independent [skip to Q7b]
Would you call yourself a strong Democrat or not a very strong Democrat?
60% strong 37 not very strong 2 don’t know
[skip to Q8]

PPIC STATEWIDE SURVEY OCTOBER 2016
PPIC.ORG/SURVEY Californians and Their Government 24
7a. Would you call yourself a strong Republican or not a very strong Republican?
50% strong 41 not very strong 9 don’t know
[skip to Q8]
7b. Do you think of yourself as closer to the Republican Party or Democratic Party?
19% Republican Party 51 Democratic Party 20 neither (volunteered) 10 don’t know
[likely voters only] If the November 8 presidential election were being held today, would you vote for: [rotate] (1) the Democratic ticket of Hillary Clinton and Tim Kaine, (2) the Republican ticket of Donald Trump and Mike Pence, (3) the Libertarian ticket of Gary Johnson and Bill Weld, [or] (4) the Green Party ticket of Jill Stein and Ajamu Baraka?
54% Hillary Clinton and Tim Kaine 28 Donald Trump and Mike Pence 5 Gary Johnson and Bill Weld 5 Jill Stein and Ajamu Baraka 2 someone else (specify) 1 would not vote for president
(volunteered) 4 don’t know
[likely voters only] In general, would you say you are satisfied or not satisfied with your choices of candidates in the election for US president in 2016?
38% satisfied 58 not satisfied 2 both (volunteered) 1 don’t know
[likely voters only] Next, how closely are you following news about candidates for the 2016 presidential election—very closely, fairly closely, not too closely, or not at all closely?
60% very closely 32 fairly closely 6 not too closely 1 not at all closely – don’t know
[likely voters only] Thinking about the presidential election that will be held this November, are you more enthusiastic about voting than usual, or less enthusiastic?
49% more enthusiastic 40 less enthusiastic 10 same/neither (volunteered) 1 don’t know
[likely voters only] If the November 8 election for the US Senate were being held today, would you vote for: [rotate] (1) Kamala Harris, a Democrat, Attorney General of California [or] (2) Loretta Sanchez, a Democrat, United States Congresswoman?
42% Kamala Harris, a Democrat, Attorney General of California
20 Loretta Sanchez, a Democrat, United States Congresswoman
18 neither/would not vote for US senator (volunteered)
20 don’t know
[likely voters only] In general, would you say you are satisfied or not satisfied with your choices of candidates in the election for US Senate in 2016?
51% satisfied 36 not satisfied 1 both (volunteered) 12 don’t know

PPIC STATEWIDE SURVEY OCTOBER 2016
PPIC.ORG/SURVEY Californians and Their Government 25
[likely voters only] What is your preference for the outcome of this year’s congressional elections: [rotate] (1) a Congress controlled by Republicans [or] (2) a Congress controlled by Democrats?
35% controlled by Republicans 55 controlled by Democrats 5 neither (volunteered) 4 don’t know
14a. [likely voters only] If the Democrats in the state legislature gained a two-thirds majority as a result of the November 2016 election, do you think that this would be [rotate] (1) [a good thing] [or] (2) [a bad thing] for California, or does it make no difference?
41% good thing 31 bad thing 24 no difference 4 don’t know
Next, we have a few questions to ask you about some of the propositions on the November ballot.
[likely voters only] Proposition 51 is called the “School Bonds. Funding for K–12 School and Community College Facilities. Initiative Statute.” It authorizes $9 billion in general obligation bonds for new construction and modernization of K–12 public school facilities, charter schools and vocational education facilities, and California Community Colleges facilities. The fiscal impact is state costs of about $17.6 billion to pay off both the principal of $9 billion and interest of $8.6 billion on the bonds with payments of about $500 million per year for 35 years. If the election were held today, would you vote yes or no on Proposition 51?
46% yes 41 No 12 don’t know
[likely voters only] How important to you is the outcome of the vote on Proposition 51—is it very important, somewhat important, not too important, or not at all important?
41% very important 38 somewhat important 10 not too important 5 not at all important 6 don’t know
[likely voters only] Proposition 55 is called the “Tax Extension to Fund Education and Healthcare. Initiative Constitutional Amendment.” It extends by 12 years the temporary personal income tax increases enacted in 2012 on earnings over $250,000, with revenues allocated to K–12 schools, California Community Colleges, and, in certain years, health care. The fiscal impacts are increased state revenues of $4 to $9 billion annually from 2019 through 2030—depending on the economy and stock market—and increased funding for schools, community colleges, health care for low-income people, budget reserves, and debt payments. If the election were held today, would you vote yes or no on Proposition 55?
59% yes 31 no 10 don’t know
[likely voters only] How important to you is the outcome of the vote on Proposition 55—is it very important, somewhat important, not too important, or not at all important?
47% very important 37 somewhat important 9 not too important 2 not at all important 5 don’t know

PPIC STATEWIDE SURVEY OCTOBER 2016
PPIC.ORG/SURVEY Californians and Their Government 26
[likely voters only] Proposition 56 is called the “Cigarette Tax to Fund Healthcare, Tobacco Use Prevention, Research, and Law Enforcement. Initiative Constitutional Amendment and Statute.” It increases the cigarette tax by $2.00 per pack, with an equivalent increase on other tobacco products and electronic cigarettes containing nicotine. The fiscal impacts are additional net state revenue of $1 to $1.4 billion in the next fiscal year, with potentially lower revenues in future years. This revenue would be used primarily to augment spending on health care for low-income Californians. If the election were held today, would you vote yes or no on Proposition 56?
56% yes 38 no 6 don’t know
[likely voters only] How important to you is the outcome of the vote on Proposition 56—is it very important, somewhat important, not too important, or not at all important?
47% very important 36 somewhat important 10 not too important 4 not at all important 3 don’t know
[likely voters only] Proposition 64 is called the “Marijuana Legalization. Initiative Statute.” It legalizes marijuana under state law, for use by adults 21 or older, and imposes state taxes on sales and cultivation. It also provides for industry licensing and establishes standards for marijuana products and allows local regulation and taxation. The fiscal impacts are additional tax revenues ranging from high hundreds of millions of dollars to over $1 billion annually, mostly dedicated to specific purposes, and reduced criminal justice costs of tens of millions of dollars annually. If the election were held today, would you vote yes or no on Proposition 64?
55% yes 38 no 6 don’t know
[likely voters only] How important to you is the outcome of the vote on Proposition 64—is it very important, somewhat important, not too important, or not at all important?
51% very important 31 somewhat important 12 not too important 3 not at all important 2 don’t know
For each of the following, please say if you favor or oppose the proposal.
[rotate 23 and 24]
[likely voters only] Do you favor or oppose raising the top rate of the state income tax paid by the wealthiest Californians?
64% favor 33 oppose 3 don’t know
[likely voters only] Do you favor or oppose increasing state taxes on the purchase of cigarettes?
65% favor 33 oppose 2 don’t know
Next,
[likely voters only] If the state ballot had a bond measure to pay for school construction projects, would you vote yes or no?
59% yes 34 no 7 don’t know
On another topic, overall, do you approve or disapprove of the way that Barack Obama is handling his job as president of the United States?
68% approve 29 disapprove 3 don’t know

PPIC STATEWIDE SURVEY OCTOBER 2016
PPIC.ORG/SURVEY Californians and Their Government 27
Overall, do you approve or disapprove of the way the US Congress is handling its job?
31% approve 59 disapprove 10 don’t know
Do you think things in the United States are generally going in the right direction or the wrong direction?
43% right direction 50 wrong direction 7 don’t know
Turning to economic conditions in California, do you think that during the next 12 months we will have good times financially or bad times?
46% good times 39 bad times 15 don’t know
Next, how much of the time do you think you can trust the federal government in Washington today to do what is right—just about always, most of the time, or only some of the time?
7% just about always 26 most of the time 55 only some of the time 9 none of the time (volunteered) 2 don’t know
Would you say the federal government is pretty much run by a few big interests looking out for themselves, or that it is run for the benefit of all of the people?
64% a few big interests 28 benefit of all of the people 8 don’t know
Do you think the people in the federal government waste a lot of the money we pay in taxes, waste some of it, or don’t waste very much of it?
55% a lot 31 some 10 don’t waste very much 4 don’t know
[rotate questions 33 and 34]
Do you have a favorable or an unfavorable impression of the Democratic Party?
53% favorable 37 unfavorable 9 don’t know
Do you have a favorable or an unfavorable impression of the Republican Party?
23% favorable 69 unfavorable 8 don’t know
In your view, do the Republican and Democratic parties do an adequate job representing the American people, or do they do such a poor job that a third major party is needed?
32% adequate job 58 third party is needed 10 don’t know
On another topic,
[likely voters only] Next, in general, do you think the use of marijuana should be legal, or not?
57% yes, legal 39 no, not legal 4 don’t know
36a. Keeping in mind that all of your answers in the survey are confidential, have you ever tried marijuana? (if yes, ask: have you used marijuana in the last 12 months?)
18% yes, have tried marijuana, used in the past year
25 yes, have tried marijuana, not in the past year
57 no, have not tried marijuana 1 don’t know

PPIC STATEWIDE SURVEY OCTOBER 2016
PPIC.ORG/SURVEY Californians and Their Government 28
Next, would you consider yourself to be politically:
[read list, rotate order top to bottom]
13% very liberal 22 somewhat liberal 30 middle-of-the-road 21 somewhat conservative 12 very conservative 3 don’t know
Generally speaking, how much interest would you say you have in politics—a great deal, a fair amount, only a little, or none?
25% great deal 34 fair amount 32 only a little 8 none – don’t know
[d1-23 demographic questions]

PPIC STATEWIDE SURVEY ADVISORY COMMITTEE
Ruben Barrales President and CEO GROW Elect
Angela Glover Blackwell President and CEO PolicyLink
Mollyann Brodie Senior Vice President Henry J. Kaiser Family Foundation
Bruce E. Cain Director Bill Lane Center for the American West Stanford University
Jon Cohen Vice President of Survey Research SurveyMonkey
Joshua J. Dyck Co-Director Center for Public Opinion University of Massachusetts, Lowell
Russell Hancock President and CEO Joint Venture Silicon Valley
Sherry Bebitch Jeffe Professor Sol Price School of Public Policy University of Southern California
Robert Lapsley President California Business Roundtable
Carol S. Larson President and CEO The David and Lucile Packard Foundation
Donna Lucas Chief Executive Officer Lucas Public Affairs
Sonja Petek Fiscal and Policy Analyst California Legislative Analyst’s Office
Lisa Pitney Vice President of Government Relations The Walt Disney Company
Mindy Romero Founder and Director California Civic Engagement Project at the UC Davis Center for Regional Change
Robert K. Ross, MD President and CEO The California Endowment
Most Reverend Jaime Soto Bishop of Sacramento Roman Catholic Diocese of Sacramento
Carol Whiteside Principal California Strategies
The PPIC Statewide Survey Advisory Committee is a diverse group of experts who provide advice on survey issues. However, survey methods, questions, content, and timing are determined solely by PPIC.

PPIC BOARD OF DIRECTORS
Mas Masumoto, Chair Author and Farmer
Mark Baldassare President and CEO Public Policy Institute of California
Ruben Barrales President and CEO GROW Elect
María Blanco Executive Director Undocumented Student Legal Services Center University of California Office of the President
Louise Henry Bryson Chair Emerita, Board of Trustees J. Paul Getty Trust
A. Marisa Chun Partner McDermott Will & Emery LLP
Chet Hewitt President and CEO Sierra Health Foundation
Phil Isenberg Former Chair Delta Stewardship Council
Donna Lucas Chief Executive Officer Lucas Public Affairs
Steven A. Merksamer Senior Partner Nielsen, Merksamer, Parrinello, Gross & Leoni, LLP
Gerald L. Parsky Chairman Aurora Capital Group
Kim Polese Chairman ClearStreet, Inc.
Gaddi H. Vasquez Senior Vice President, Government Affairs Edison International Southern California Edison

Public Policy Institute of California 500 Washington Street, Suite 600 San Francisco, CA 94111 T: 415.291.4400 F: 415.291.4401
PPIC.ORG
PPIC Sacramento Center Senator Office Building 1121 L Street, Suite 801 Sacramento, CA 95814 T: 916.440.1120 F: 916.440.1121