California Steelhead Fishing Report-Restoration Card
91
California Steelhead Fishing Report-Restoration Card A Report To The Legislature Department of Fish and Game July 2007 (Photo of Rebecca Weseloh [13] on the Mad River)
Transcript of California Steelhead Fishing Report-Restoration Card

California Steelhead Fishing Report-Restoration Card
A Report To The Legislature
Department of Fish and Game
July 2007
(Photo of Rebecca Weseloh [13] on the Mad River)

State of California The Resources Agency
Department of Fish and Game
California Steelhead Fishing Report-Restoration Card
A Report To The Legislature
by
Terry A. Jackson Associate Fisheries Biologist Fisheries Branch, Sacramento
Under the Supervision of
Neil Manji Chief
Fisheries Branch

INTRODUCTION
The Steelhead Trout Catch Report-Restoration Card (Report Card) was enacted by state legislation in 1991 and, was subsequently adopted by the California Fish and Game Commission (Commission). Fish and Game Code Sections 7380 and 7381 require anglers fishing for steelhead in inland waters to purchase a Report Card and record their steelhead fishing information. The Department of Fish and Game (Department) uses this information to manage steelhead angling to benefit steelhead and to prevent angling programs from having a detrimental effect on the steelhead populations. Section 7381 requires that all revenue derived from the sale of the Report Cards be used to monitor, restore, or enhance steelhead resources and to administer the program.
The Report Card regulation requires steelhead anglers 16 years of age or older to purchase and possess the nontransferable Report Card when fishing for steelhead in any of the State's anadromous waters. All steelhead caught must be recorded on the Report Card, whether kept or released, in addition to the date and location fished. Information contained on the Report Cards is used to estimate catch and harvest. The Department uses this information to develop angling and management regulations that avoid over harvesting wild steelhead, and to monitor the take of steelhead in California.
Section 7381, prior to AB 2773, required the Department to report to the Legislature on or before July 1, 2007, regarding the implementation of the Report Card program, the projects undertaken using revenues derived pursuant to that program, the benefits derived, and its recommendation regarding whether the Report Card requirement should be continued. This document fulfills the reporting requirement.
The Report Card serves two major roles, 1) to gather steelhead angling data to monitor catch trends over time and, 2) to generate revenue dedicated specifically for funding projects that contribute to the restoration of California’s steelhead habitat and recover steelhead populations. The program involves developing the statistical and survey methodologies to obtain and analyze harvest and angler-use information contained on the cards, updating the report card as necessary, and making management recommendations to restore and enhance steelhead trout resources statewide.
The Report Card goals are to restore watershed processes and functions, modify or remove barriers to migration, protect and restore steelhead instream habitat, increase long-term effectiveness of restoration efforts by monitoring and maintaining projects, encourage local government and community based partnerships through support for watershed organizations, identify watershed priorities and restoration projects through watershed evaluation and planning, and support public school watershed education and technical workshops and conferences.
The Report Card is the only statewide program designed to gather such data. Because the majority of California's steelhead populations are listed under the federal Endangered Species Act (ESA), angling information is critical to ensure that angling does not significantly impact steelhead populations. This information is critical to understanding how angling affects steelhead populations and is essential information needed to adjust angling regulations so that angling can be continued, consistent with provisions of the ESA.
The revenue from the Report Card funds investigations that increase our understanding of steelhead so that we more effectively manage steelhead for 1) protection and restoration of depleted stocks, and 2) provide recreational opportunities to steelhead anglers.
In summary, the steelhead Report Card program helps the Department fulfill its duel responsibility for steelhead, that of protecting public trust resources and maintaining and improving opportunities for steelhead angling.
-1-

OVERVIEW OF STEELHEAD BIOLOGY AND STATUS Steelhead (Oncorhynchus mykiss) is a sea-run (anadromous) form of rainbow trout and is a popular gamefish in the Pacific Northwest and California. In California, known spawning populations are found in coastal rivers and streams from San Mateo Creek in San Diego County to the Smith River near the Oregon border, and in the Sacramento and San Joaquin river systems. The present distribution of steelhead in California has been greatly reduced from historical levels. The decline of California steelhead appears to be part of a more prevalent West Coast steelhead decline. This decline prompted the National Marine Fisheries Service to list nearly all of California’s steelhead populations under the ESA. The major factors causing the steelhead decline in California, are freshwater habitat loss and degradation, which has resulted mainly from three factors: inadequate stream flows, blocked access to historic spawning and rearing areas due to dams, and human activities that discharge sediment and debris into watercourses. The Report Card has provided information on steelhead sport harvest rates which suggest that over-exploitation of wild stocks is not occurring on a widespread basis and thus is unlikely the cause of the general decline of wild populations. The Smith River is the only steelhead stream in California where wild steelhead may be kept (Figure 1). Steelhead populations throughout the state have faced many habitat degradation and loss challenges resulting in significant statewide declines. Steelhead runs in north coast drainages (north of San Francisco Bay) are comprised mostly of wild fish (Figure 2). Adverse impacts to north coast stocks are mainly from land use activities, primarily timber harvest, agriculture, water diversion dams, gravel mining, and predation by introduced Sacramento pikeminnow (Figure 3).
Figure 1. Wild steelhead caught on the Smith River (Photo by Dr. Walt Duffy). -2-
Figure 2. Wild steelhead in natural habitat (photo from Humboldt State University).
A B
DC
E
Figure 3. Land slide (A), log jam (B), water diversion (C), riparian grazing (D), Sacramento pikeminnow (E).
-3-

Steelhead ranged throughout the tributaries of the Sacramento and San Joaquin rivers prior to dam construction, water development, and watershed perturbations of the 19th, 20th and early 21st centuries. Populations have been most severely affected by dams blocking access to spawning and rearing habitat in the headwaters of all the major tributaries (Figure 4). Consequently, most runs are mitigated through artificial production in fish hatcheries.
A B
Figure 4. Examples of high Central Valley dams without anadromous passage: Shasta (A) and Folsom dams (B).
Southern steelhead (those occurring south of San Francisco Bay) were formerly found in coastal drainages as far south as the Santo Domingo River in northern Baja California and were present in many streams and rivers of southern California (Figure 5). Major adverse impacts to southern steelhead are from urbanization (Figure 6), water impoundment and diversion (Figure 7), and invasive plant species (Figure 8). Headwaters of a majority of these streams, now inaccessible to steelhead, remain healthy and could support steelhead spawning and rearing, if they were accessible (Figure 9).
Figure 5. A day’s catch of steelhead, Ventura River 1946.
-4-
A
B
Figure 6. Southern California stream urbanization: Concrete channelization (A) and Ford crossing migration barriers (B).
B
A
C
Figure 7. Southern California dams without upstream fish passage: Rindge Dam, Malibu Creek (A), Matilija Dam, Ventura River (B), Bradbury Dam, Santa Ynez River (C).
-5-

Steelhead are similar to some Pacific salmon in their ecological requirements and life history (Figure
Figure 9. Examples of Southern California stream headwaters above impassible barriers.
Figure 8. Invasive plants clogging streams and restricting fish passage.
10). They are born in freshwater, then emigrate to the ocean where most of their growth occurs, and
and
-6-
then return to freshwater to spawn. Unlike Pacific salmon, steelhead do not necessarily die after spawning. Post-spawning survival rates are generally low, however, and vary considerably between populations. In California, most steelhead spawn from December through April in small streams tributaries where cool, well-oxygenated water is available year-round. Juvenile steelhead typically spend two years in their natal streams before migrating to the ocean where they remain for one to threeyears before returning to freshwater to spawn.

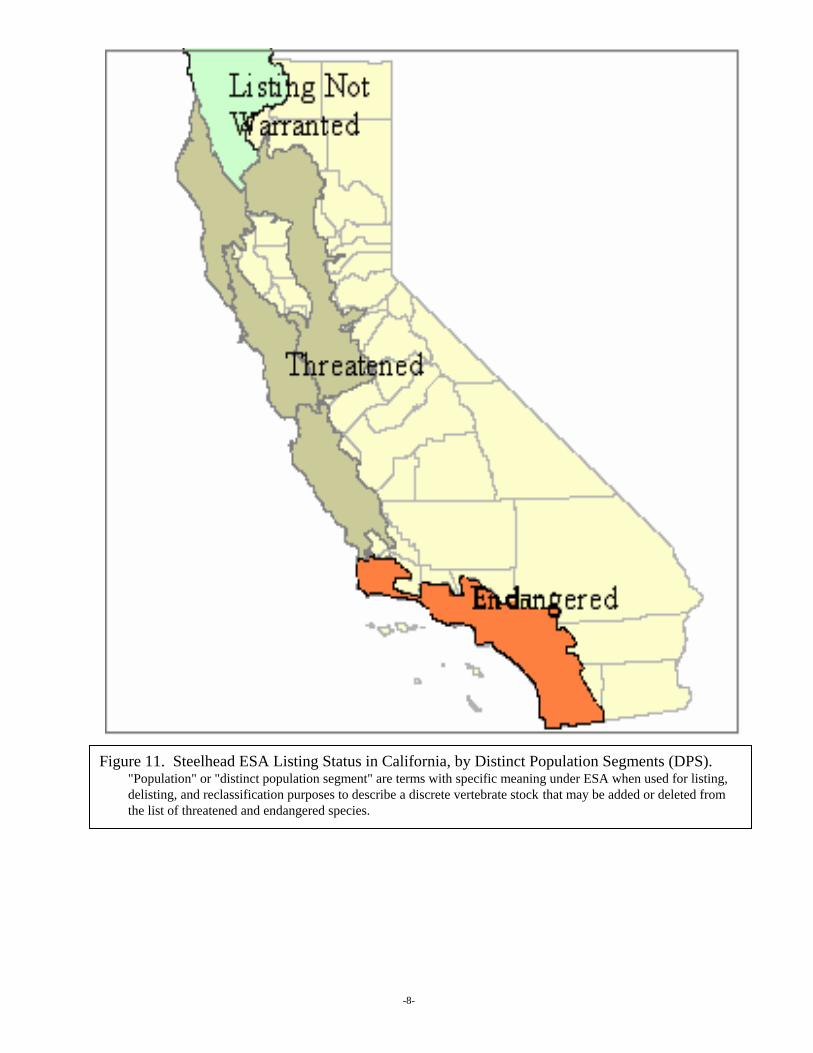
Because of the declines, the Federal Government, with the Department’s concurrence, listed all coastal steelhead populations south of the Russian River under the ESA in 1997. Central Valley steelhead were listed in 1998, and populations from the Russian River north to Redwood Creek were listed in 2000. All of these are listed as threatened species except for Southern California steelhead, which are listed as an endangered species. Only those populations north of and including the Klamath-Trinity system remain unlisted (Figure 11).
-7-
Figure 10. Lifecycle of a Steelhead (Department file photos).
-8-
Figure 11. Steelhead ESA Listing Status in California, by Distinct Population Segments (DPS). "Population" or "distinct population segment" are terms with specific meaning under ESA when used for listing, delisting, and reclassification purposes to describe a discrete vertebrate stock that may be added or deleted from the list of threatened and endangered species.

LEGISLATIVE HISTORY
The Report Card was enacted by state legislation in 1991 (Assembly Bill 2187, Chapter 1037) and, was subsequently adopted by the Commission. AB 2187 established Fish and Game Code Sections 7380 and 7381 that requires anglers fishing for steelhead in inland waters to purchase a Report Card and record their steelhead fishing information.
AB 2187 became inoperative on July 1, 1997 and was scheduled to sunset on January 1, 1998. The Department sponsored Senate Bill 183 (Stats 1997 ch 240) to reestablish the Report Card requirement and program until January 1, 2003. SB 183 changed the requirement that the angler record the date and location of their fishing trip before commencing fishing to after completing fishing for the day, and required the Department to report to the Legislature on or before July 1, 2002. In December 2000, the Department submitted a report to the Legislature to fulfill that requirement.
AB 2783 (Stats 2002 ch 594; Stats 2003 ch 741), reestablished and amended Fish and Game Code Sections 7380 and 7381, and added Section 7382 to contain the language repealing the Report Card requirement and program. Besides moving the repealing language from Section 7381 to Section 7382, Section 7380 was amended to increase the base cost of the Report Card from three dollars to five dollars as adjusted pursuant to Section 713, and to change the return of the Report Card from voluntary to mandatory.
AB 2773 (Stats 2006) reestablished and amended Fish and Game Code Sections 7380, 7381, and 7382. This bill changed the name of the Steelhead Trout Catch Report-Restoration Card to the Steelhead Fishing Report-Restoration Card, changed the information recording requirement from after fishing to before the cardholder begins fishing for the day, and appropriated $800,000 from the Report Card dedicated account to the Department for monitoring and restoring steelhead resources through the Report Card program. The money was made available for expenditure by the Department through June 30, 2009.
IMPLEMENTATION AND TENURE
The Department began implementing the Report Card program in 1993. An Associate Biologist position was established in 1992 to implement and coordinate the Steelhead Report-Restoration Card program. The duties of this position are to administer the program, collect the Report Card information through statistically valid surveys, analyze fishing and catch information, and review, prioritize, and coordinate the development of specific stream restoration projects to be funded by Report Card revenues.
The Department went to great lengths to inform the public about the program and the restoration ed
the benefits and the Department continues efforts to educate the public about the Report Card program throuaround the State, radio talk shows, and magazine articles.
Program implementation also required a close working relationship with the California Advisory Committee on Salmon and Steelhead Trout (CAC), a legislatively appointed advisory committee that advises the Department. The Steelhead Subcommittee of the CAC is composed of five members, representing sport fisheries and biologists. Prior to implementation, the Steelhead Subcommittee reviewed and advised the Department on the Report ard design and, together with the Department, developed a protocol for reviewing and approving steelhead projects to be funded by Report Card revenues. The Department and the Steelhead Subcommittee have a complementary relationship and the
projects that are funded. Based on comments received, the angling public appears to have recogniz
gh news releases, informational fliers, speaking engagements to angling and fisheries groups
C
-9-

Steelhead Subcommittee has provided valuable insight and advice. The Department has kept the teelhead Subcommittee apprisedS
and personal conversations. through e-mails, progress reports, memos, presentations, and phone
Design of the Report Card Numerous iterations of Report Card design were made before the 1993 design was accepted. The basicdesign, with minor management and clarity improve
ments annually, is still used (Figure 12). From
nt rainbow trout fishery (Figure 13). To eliminate inclusion of catch data for these rainbow trout from the Sacramento River
gn. For the first ten years of the program, return of the Report Card was voluntary. All
y. Those selected were mailed a survey form and a postage paid envelope, and requested to turn their Report Card to the Department, which resulted in an average response rate of 22%.
In 1997, the Department instituted a 100% marking program for all hatchery steelhead (Figure 14), cluding those raised at non-Department hatcheries and rearing projects. As a result, all hatchery
ad .
and
s
-10-
1993 through 1998, the Report Card was relatively small and difficult for many anglers to read. To increase readability and provide additional information for the angler, the Report Card size was increased.
In 1993, the Department recognized the section of the Sacramento River below Lake Shasta and upstream of the Deschutes Bridge Road (Shasta County) as a “trophy” reside
steelhead catch analyses, Location Code 26 was modified to exclude this area. This is the only anadromous water in the state where the Report Card is not required for fishing for rainbow trout greater than 16 inches. Collection of steelhead harvest data required the development and implementation of a repeatable sampling desiReport Card purchasers were requested to return the Report Card to the Department after the end of the survey period. This design was successful at gathering some useful data previously not available to the Department. However, overall returns were much lower than desired (approximately 8%) of Report Card purchases. It is well-documented that voluntary surveys are usually biased because the more successful anglers are more likely to return their information than less successful anglers. Thus, to improve statistical validity in our estimations and to increase the number of Report Card returns, each year a subset of 10,000 Report Card purchasers were surveyed with a stratified random survey methodologre
insteelhead are now marked with an adipose fin clip, and are readily identifiable to the angler as hatchery steelhead. In 1998, the Commission adopted regulations requiring all non adipose fin-clipped steelhead (i.e, wild steelhead) to be released, except in the Sacramento River above Redding and in the Smith River system
Since 1999, the Report Card has gathered information on the origin (hatchery or wild) of returning steelhead caught by anglers. A graphic showing the differences between wild and hatchery steelhewas displayed on the Report Card to assist the angler in properly distinguishing the two (see Figure 12)Hatchery/wild information is useful to determine catch rates and potential angling impacts to wild steelhead. This information is used to adjust angling regulations and direct management efforts to enhance the health of California’s wild steelhead stocks.
Though the voluntary return and stratified random survey method was successful at gathering datadeveloping reliable statewide harvest estimates, the Report Card return rates were much too low to develop reliable catch estimates for a majority of California’s steelhead streams. This prompted significant discussion within the Department and between the Department and the Steelhead Subcommittee to investigate options to increase the return rate, including looking at steelhead programin other states.

Figure 12. 2006 Steelhead Fishing Report-Restoration Card.
-11-

.
Oregon and Washington have tried several options with varying success, all with higher return rates than a strictly voluntary return methodology. Oregon, Washington and Idaho also have Automated License Data Systems (ALDS), which allows real-time accounting of anglers. Some of the measures they’ve implemented include: using a larger multi-section card with a perforated postage-paid return postcard for anglers to record their data and mail back at the end of the season (roughly 30% response); mandatory return laws with follow-up mailings and phone calls to non-compliant anglers (roughly 55% response); and raffling prizes to
Figure 14. Adipose fin clipping hatchery steelhead.
Figure 13. Resident rainbow trout, Sacramento River upstream of Deschutes Bridge Road.
those that return their data. The Department and Steelhead Subcommittee’s preferred choices were the raffle system, the incentive program and a mandatory return, respectively. The raffle incentive program proved to be too administratively problematic to implement, so the program opted for a mandatory return.
2-
-1

In 2002, the Department supported legislation to change the Report Card to require the purchaser to return the Report Card to the Department. In 2003, language on the Report Card was amended to reflect this major change. The Department disseminated several news releases and provided license agents with fliers (Figure 15) prior to the January 31, 2004 return deadline to inform anglers of the mandatory law and potential of a misdemeanor for noncompliance. The Department also developed a web page (http://www.dfg.ca.gov/nafwb/steelhead.html) specifically for steelhead (Appendix A). A marked increase in Report Card returns was immediately realized, with nearly an 11% initial return of 2003 Report Cards. Anglers who had not returned their 2003 Report Card were mailed a reminder postcard (Figure 16) in May 2004 informing them that they needed to return their Report Card. The result was a tremendous increase in return of the Report Card of nearly 61% response from noncompliant anglers after being contacted with the reminder postcard (Figure 17). This provides the Department with significantly more data to analyze and use for management decisions. In December 2004, the Department again produced several news releases and provided license agents with fliers to inform anglers of the mandatory law and potential of a misdemeanor for noncompliance. Based on numerous questions from the public regarding the Report Card program, the Department developed a “Frequently Asked Questions” link
://www.dfg.ca.gov/nafwb/SteelheadReportCardFAQ.html(http ) on the Department’s steelhead website ppendix B). With increased awareness of the new
eport Card. The Department is hopeful that anglers will provide this information.
a
to address the majority of angler’s questions (Amandatory return law, the Department initially received nearly 15% of the 2004 Report Cards without notifying anglers and approximately a 70% response to the reminder postcards. As with the 2003 Report Card, anglers were requested to write “Did Not Fish” on their Report Card if they had not fished for steelhead in 2004, but numerous returned Report Cards had nothing written on them or “none caught”. A phone survey was conducted on a randomly selected subset of these anglers to clarify if this meant they didn’t fish or if they had not recorded, as required, their “unsuccessful” fishing trips. Approximately 50% of these anglers had fished at least one day. Several claimed they refused to record unsuccessful trips because they didn’t want to fill-up their Report Card, but the majority had not read the instructions and assumed, based on the word “Catch” in the title of the Steelhead Trout Catch Report-Restoration Card, that they were only to record their catches. To avoid this confusion in the future, in 2005 the Commission, based on recommendations from the Department, changed the name of the Report Card from the Steelhead Trout Catch Report-Restoration Card to the Steelhead Fishing Report-Restoration Card. Reminder postcards were mailed in November 2006 to steelhead anglers who had not returned their 2005 Report Cards. The Department developed a process to allow anglers to report on-line, which hopefully will be helpful to anglers and the Department. In an effort to better disseminate information to the anglers and reduce postage costs, a space to provide an e-mail address was added to the 2006 R All other Pacific States that have steelhead populations have report card-type requirements that provide means to monitor steelhead fisheries, but only California requires that the proceeds from card sales beused exclusively for steelhead restoration projects.
-13-

-14-
Figure 15. Flier provided to license agents to inform anglers of the mandatory law.

0%
10%
20%
30%
40%
50%
60%
70%
1993-2002 Volunteer 2003-2005 Mandatory
Years
Perc
ent
Average Initial Return Average Return after follow-up Contact
-15-
Figure 16. Reminder Postcard.
Figure 17. Steelhead Report Card return rates, comparing voluntary and mandatory return requirements.

Overview of Funding and Restoration Efforts
Prior to 1993, steelhead seldom received funding for projects specific to population monitoring, habitat restoration or enhancement. Any benefit received was indirect from salmon projects under the supposition of “what’s good for salmon must be good for steelhead too.” This is often not the case. The Report Card provides a specific funding source for steelhead restoration and is the only state-wide program designed for such a purpose.
Revenue received from sales of the Report Card are placed in a dedicated account and may only be expended to monitor, restore, or enhance steelhead trout resources consistent with Fish and Game Code sections 6901 and 69021, and to administer the Report Card program. Typical projects include: assessing angler harvest, restoring spawning and rearing habitat, securing adequate streamflows, and removing barriers to migration.
Proposals for steelhead habitat restoration and enhancement projects throughout the range of steelhead in California are considered for funding. Project proposals received by the Department come from non-profit organizations, local, state and terprise. Proposals are reviewed each spring by the Department for biological soundness, cost effectiveness, technical merit and use of
atching funds by the applicant. These proposals are also reviewed by the Steelhead Subcommittee. he Department and the Steelhead Subcommittee meet annually to discuss each proposal and decide
which proposals should be funded by the Report Card program, and at what level. Proposals that adhere to the management goals outlined in the Department's Steelhead Restoration and Management Plan for California (Steelhead Plan) receive the greatest consideration for funding. Habitat restoration projects must use Department-standardized methodologies described in the California Salmonid Stream Habitat Restoration Manual.
To date, the Report Card program has funded, or co-funded, 111 steelhead projects totaling approximately $1,198,500 (Figure 18). These projects include steelhead population assessment and monitoring, rearing, habitat restoration, and education. Some projects combine restoration and education, where students and/or volunteers from communities implement the project under Department supervision. Many of the assessment-monitoring and restoration projects are still in progress. Some projects, such as educational projects (e.g., "Salmonids in the Classroom"), have provided immediate success and gratification for students and teachers alike.
federal agencies, and private en
mT
1 Fish and Game Code sections 6901 and 6902 are part of the Salmon, Steelhead Trout, and Anadromous Fisheries Program
Act, which primarily focuses on naturally spawning salmon and steelhead resources. These sections direct the Department
to protect and increase naturally spawning salmon, steelhead, and anadromous fish populations primarily through the
improvement of stream habitat.
-16-

-17-
Figure 18. Projects, by type and location, funded by the steelhead Report Card program, 1993-2007.
FISCAL
Report Card Cost
Purchasing a Report Card is an investment into the future of California’s steelhead resource. Each Report Card costs $5.80 (2007) and allows for 30 steelhead fishing trips. In addition, anglers must purchase a Sport Fishing License for $33.50. Permit costs in Oregon, Washington and Idaho are similar to California.
A resident Oregon Angling License is $24.75. The Combined Angling Harvest Tag (currently $21.50 for adults) is required for all anglers to fish for salmon, steelhead, sturgeon or Pacific halibut. The Combined Tag allows a harvest of 20 salmon or steelhead per year. In addition, anglers may purchase a Hatchery Harvest Tag (currently $12.00), which allows the angler to harvest an additional combined total of 10 hatchery salmon or steelhead.
A resident Washington Annual Combination License (freshwater & saltwater) is $41.61. The State of Washington provides the first catch record card free with the purchase of a license. Replacements and additional catch record cards are $10.95 for all ages. Anglers are allowed to harvest one wild steelhead statewide annually.
A resident Idaho Fishing License is $23.50. A prmit is required to fish for steelhead and costs $11.50.
Finances
An essential responsibility of the Report Card Coordinator has been an accounting of the Report Card budget, revenue and expenditures. The number of Report Cards sold and annual revenue generated for calendar years 1993 through 2005 are shown in Figure 19. For both 1993 and 1994, the sale of over 77,000 Report Cards each year generated over $230,000 annually. From 1994 through 1998, Report Card sales declined steadily to a low of approximately 39,500 in 1998. Several factors probably accounted for this:
• Inclement weather that causes high, turbid stream flows can have a substantial affect on angling opportunity and was a factor in the 1994-95 and 1996-97 fishing seasons. The Klamath River system, for example, was not fishable for steelhead for 57% of the time during the 1996-97 season. Likewise, the Eel River was not fishable for 38% of the time during this same season.
• Declining stocks led to more restrictive angling regulations and stream closures.
• Publicity regarding the ESA listing of steelhead likely led some anglers to conclude that steelhead angling was no longer allowed.
From 1998, Report Card sales steadily increased to approximately 56,000 Report Cards sold annually, and held steady for three years (2002-2004). Since 2002, revenue also increased because of the increase of the cost of the Report Card, pursuant to Section 713. Starting in 2004, legislation increased the base cost of the Report Card from $3.00 to $5.00, which increased revenue to the program for steelhead projects.
In 2005, Report Card sales dropped slightly to approximately 51,000, and dropped again to roughly 45,000 for 2006. A number of Report Card purchasers reported to the Department that they only purchased the Report Card to support the program, with no intention of fishing for steelhead. With the implementation of the mandatory return requirement, we speculate that the decrease in sales was the result of these “supportive” individuals choosing to discontinue purchasing the Report Card because of
-18-

$200,000
$250,000
70,000
80,000
$100,000
$150,000
Reve
nue
40,000
50,000
Num
ber S
o
$0
$50,000
10,000
20,000
$300,000
1993 1994 1995 1996 1997 1998 1999 2000 2001 2002 2003 2004 2005 20060
30,000
60,000
90,000
100,000
ld
Year
Revenue Number Sold
loose sales of the Report Card to these individuals, no steelhead angler data are lost, and
e tim
Since 1994, the Report Card’s annual spending authority has been below annual revenue. For several years
50, dedicated account continues to grow and, as of December 2006, was $1,000,900. With the signing of AB2773
satisfactory balance and numerous additional steelhead monitoring and habitat restoration projects, particularly as identified within the Steelhead Plan, will be implemented.
the requirement to return their blank Report Card to the Department. Though it is unfortunate to the revenue from the
Figure 19. Annual steelhead Report Card sales and revenue, 1993-2005.
in fact, removal of these non-steelhead anglers will strengthen the Department’s angling and harvest s ates.
the program’s spending authority was approximately $96,000 and is currently approximately $1 000. With annual revenue exceeding annual spending authority, the Report Card
and the appropriation of $800,000 through June 2009, the dedicated account will be reduced to a
-19-

PROJECTS FUNDED
1993-1997
In the 1997 Report to the Legislature, we reported that from FY 1993/94 through FY 1996/97, 67 steelhead projects throughout the state were funded by the Report Card program. A total of $410,919 was spent on these projects, which involved steelhead habitat restoration, habitat and population assessment, public education, restoration-education and fin clipping hatchery raised steelhead. All of the projects were considered critical for improving steelhead resources throughout the state, and few would have been funded without the Report Card program. Several projects and their successes are described below:
• In 1993, the Carmel River steelhead brood stock project (Figure 20) was established to prevent probable extirpation of the native steelhead run and to help return the steelhead population to a self-sustaining level. The project successfully achieved its objective. The Carmel River brood stock program has ended and the river now has a reestablished steelhead run that has been reopened for steelhead angling.
• Many immediate benefits have been derived from projects that include public involvement and education. One highlight from the 1994-95 education projects was the completion of the Instruction Manual for Hatching Salmon and Trout Eggs in Classroom Aquarium-Incubators (Figure 21) to educate teachers conducting the Salmonids in the Classroom program.
• In 1995, the construction of a fish screen funded by the Report Card on lower Etna Creek was completed (Figure 22). The screen prevents an estimated annual loss of several thousand juvenile steelhea l.
-20-
d and potentially prevents the loss of adult steelhead to the diversion as wel
Figure 20. Carmel Broodstock project.
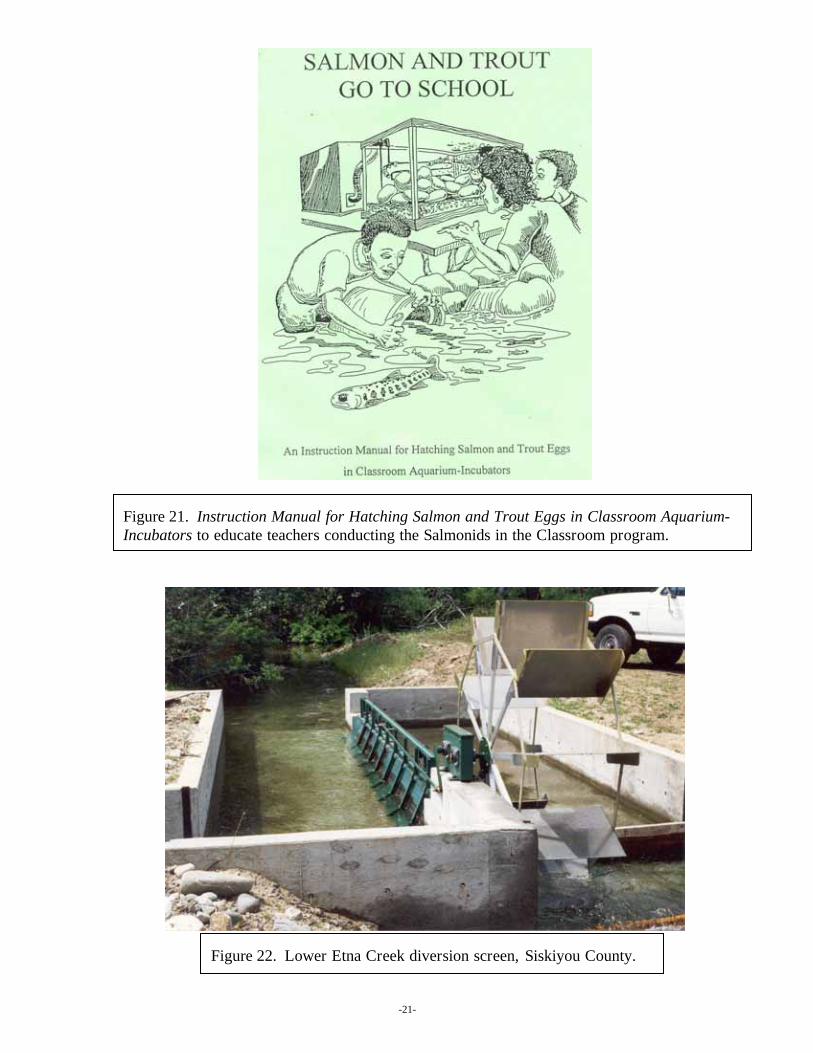
Figure 21. Instruction Manual for Hatching Salmon and Trout Eggs in Classroom Aquarium-Incubators to educate teachers conducting the Salmonids in the Classroom program.
Figure 22. Lower Etna Creek diversion screen, Siskiyou County.
-21-

• A steelhead restoration highlight was the removal of Trout Haven Dam on Monkey Creek in Del Norte County (Figure 23). Monkey Creek is within the Smith River drainage. Removal of this obsolete dam opened four miles of stream for steelhead to spawn. The U.S. Forest Service monitored the use of these four miles by steelhead and salmon, and reported that the project was successful, where adult steelhead densities exceeded comparison reaches. Juvenile steelhead densities increased dramatically, and went from lower densities to higher densities than comparison streams. The increase was attributed to adult access, increased quantity and quality of spawning gravel and quality of accessible over-wintering habitat.
• In 1995/96, we funded a project to evaluate the mortality of angler caught-and-released summer steelhead adults in the summer holding areas of the NF Trinity and Mad rivers. This study was conducted by a graduate student at Humboldt State University. The study, Mortality of Angler-Caught and Released Summer Steelhead, found that hooking mortality was highly correlated with water temperature (p=0.002), stress time decreased significantly with increasing water temperature before mortality occurred, and no significant relationship was found between hook type and mortality (p>0.05). Mortality was found to increase sharply at water temperatures exceeding 69.8o F (21o C).
1997-2001
In the 2000 Report to the Legislature, we reported that from FY 1997/98 through FY 2000/01, ten additional steelhead projects throughout the state were funded by the Report Card program for $120,972. Because of a low fund balance in FY 1997/98, and steadily declining Report Card sales through 1998, funding for steelhead projects was substantially reduced. As a result, only one project (fin-clipping steelhead at Rowdy Creek Fish Hatchery on the Smith River) for $3,060 was funded in FY 997/98.
ec
rogram. This grant funded four steelhead habitat restoration and habitat assessment projects that addressed sediment reduction, instream habitat structures, non-native vegetation removal and native vegetation replanting for shade, and water temperature assessment. In FY 1999/00 an additional six projects were funded (culvert modification/fish passage, salmonid classroom education, drafting a summer steelhead (Figure 24) plan, Carmel River angler survey, genetic analyses, hooking mortality) for $78,444, and two Rotary Screw Traps were purchased ($25,000 for both) for future downstream migrant trapping programs.
The Report Card funded the salmonid classroom education project to purchase eight 20 gallon aquarium setups. The program was conducted in 52 classes throughout Humboldt and Mendocino Counties, which helped expand the 12 year program from 43 aquariums in 23 schools to 60 aquariums in 33 schools. The program utilized the Instruction Manual for Hatching Salmon and Trout Eggs in Classroom Aquarium-Incubators, and was well received by students, teachers, parents and community members and raised community awareness about the state of salmon and steelhead in California, their life histories and what their habitat requirements are.
-22-
1
BMarine Fisheries Service (NOAA Fisheries) awarded a multiyear grant of $39,468 to the Report Card
ause of the reduced Report Card sales and depleted fund balance, in FY 1998/99 the National
p

-23-
Figure 23. Smith River: Monkey Creek Trout Haven Dam site 1995 and 2005.
Day after blast
July 2005
Oct. 1995
Blast: Summer 1995 Late Spring 1995

2001- Present
With increasing Report Card sales and utilization of the NOAA Fisheries grant, the Report Card fund balance recovered to approximately $250,000 by 2000. Since the last Legislative Report in 2000, the Report Card program has funded 34 additional projects for over $666,600. In addition, NOAA Fisheries provided an additional $75,000 grant for Report Card data statistical analyses and a statistical comparison of Smith River Angler Survey with Smith River Report Card angling data. These analyses are incomplete; however, preliminary results indicate that the two methodologies for collecting steelhead angling data are not comparable and produce different estimates (Figure 25).
Comparing Apples with Oranges
What did we learn? Challenges to overcome.
Nearly everything significantly different (p<0.01), except some catch estimates andtotal hours fished
Possible: Angler Survey under estimates hours per trip or over estimatesnumber of trips, thus lower catch estimates
Possible: Report Card over estimates catch per trip with non-recordedunsuccessful trips (under estimates number of trips), thus higher catch estimates
VERY challenging, a lot of weighting, not really comparable.
-24-
Figure 24. School of summer steelhead holding in a deep pool on the Middle Fork Eel River.
Figure 25. Preliminary conclusions regarding the statistical comparison of Smith River Creel Census with Smith River Report Card angling data.

For several years, the Report Card program has provided partial funding to two annual monitoring projects: the Redwood Creek downstream migrant study (Figure 26), conducted by the US Fish and Wildlife Service in 2003 and thereafter by the Department (nearly $221,000), and the Smith River Angler Survey (approximately $65,000). The Report Card also continues to annually support Rowdy Creek Fish Hatchery (Smith River) juvenile steelhead fin clipping ($8,000 for 2003-2005). The hatchery provides excellent public support for the Report Card program through word of mouth and their newsletter (Figure 27). In 2003, the Report Card program funded a Yurok Tribe project to estimate juvenile steelhead abundance in tributaries of the lower Klamath River ($15,500), and a Gualala River steelhead rescue-rearing program ($15,000).
In 2001 and again in 2005, we funded ($8,000 total) a study to evaluate the occurrence of wild and hatchery “half-pounder” steelhead (Figure 28) caught by anglers in the Klamath and Trinity rivers (these reports are available on the Steelhead Report Card web site). In California, “half-pounders” are distinctive to the Klamath River System. These 10-16 inch immature steelhead migrate upstream after only a few months in the ocean, return to the ocean after a few months in freshwater, and then migrate upstream the following year as mature adult steelhead. Interestingly, 91% of the total 2001 half-pounder catch (Trinity River included) were wild fish; yet the two hatcheries released 854,402 adipose fin clipped steelhead smolts in the spring of 2001, a large portion of which would have been expected to return as half-pounders later that year. Thus, either the wild fish were so abundant that their numbers masked the presence of hatchery fish, or the survivA 1
nd diseases have certainly affected Klamath River lower river adult fish kill and the even more extensive juvenile die offs.) and may
y e
extensive Central Valley steelhead/resident rainbow trout life-history study, $20,000 to evaluate anadromy/residence of Central Valley rainbow trout, and $2,300 to evaluate the life-history of the upper Sacramento River resident rainbow trout (“River Tr cramento River study suggested that the vast majority (>99%) of trout caught in the catch-and-release reach of the Sacramento River between Lake Shasta and Deschutes Bridge Road are non-anadromous, as suspected; thus, reinforcing the Department’s decision to not include the upper section of the Sacramento River on the Report Card.
The Report Card program contributed $12,144 in 2004 and 2005 to a two-year survey of the Smith River summer steelhead and other salmonid populations. The surveys covered nearly 75 miles of the upper Smith River forks. The project also collated all the previous years’ counts to evaluate summer steelhead population trends. Summer steelhead counts (13 total were observed), in 2005 were the largest recorded since 1982 equating to roughly one steelhead every 2.5 miles of stream.
al of hatchery fish was low for some reason. lthough more anglers participated in the 2005 survey, the total catch was smaller than in the 200
survey - 3,539 compared to 8,838. Low warm water asalmon (e.g., 2002also be negatively affecting steelhead survival. In 2005, the Klamath River half-pounder catch comprised 86% of all half-pounders reported while the Trinity River half-pounder catch comprised onl14%. In the Klamath River 93% of half-pounders were wild, and 64% of half-pounders were wild in thTrinity River.
A continuing question, particularly in the Central Valley, has been the relationship between steelhead and resident rainbow trout: do these two life history types comprise a single, interbreeding population or two distinct populations? The Report Card program contributed $7,500 to an
out”). Results are still pending; however, the upper Sa
-25-

ning
and to collect data necessary to make responsible management decisions for the Trinity River. The New River project examined the proportion of the summer steelhead run in the area open to
d
planting roughly 700 conifers and 3,000 willow and baccharis cuttings. The plantings were conducted in a two-hase project, and met its objective.
In 2005, we funded a Trinity River tributaries winter steelhead spawning survey ($12,634) and a New River summer steelhead snorkel survey ($3,158). On the Trinity River, steelhead redds (spawnests) were counted to provide an index of winter steelhead spawner escapement, and spawning habitat was evaluated on twelve tributaries. This project was necessary to further assess status and long-term population trends
angling to assess their vulnerability to angling. Roughly 1,300 adult summer steelhead were observeduring October 2005 in New River and its tributaries.
Also in 2005, we co-funded with the Resource Conservation District a habitat restoration project ($6,189) within the South Fork Eel River drainage to slow the erosion from a landslide, by
p
-26-
A B
C
D
E
F
Figure 26. Upper (A) and Lower (B) Redwood Creek downstream migrant rotary screw trapsjuvenile coho (C) and Chinook (D) salmon, juvenile steelhead (E), and adult steelhead caught in the trap (F) on journey to return to the ocean after spawning.
,
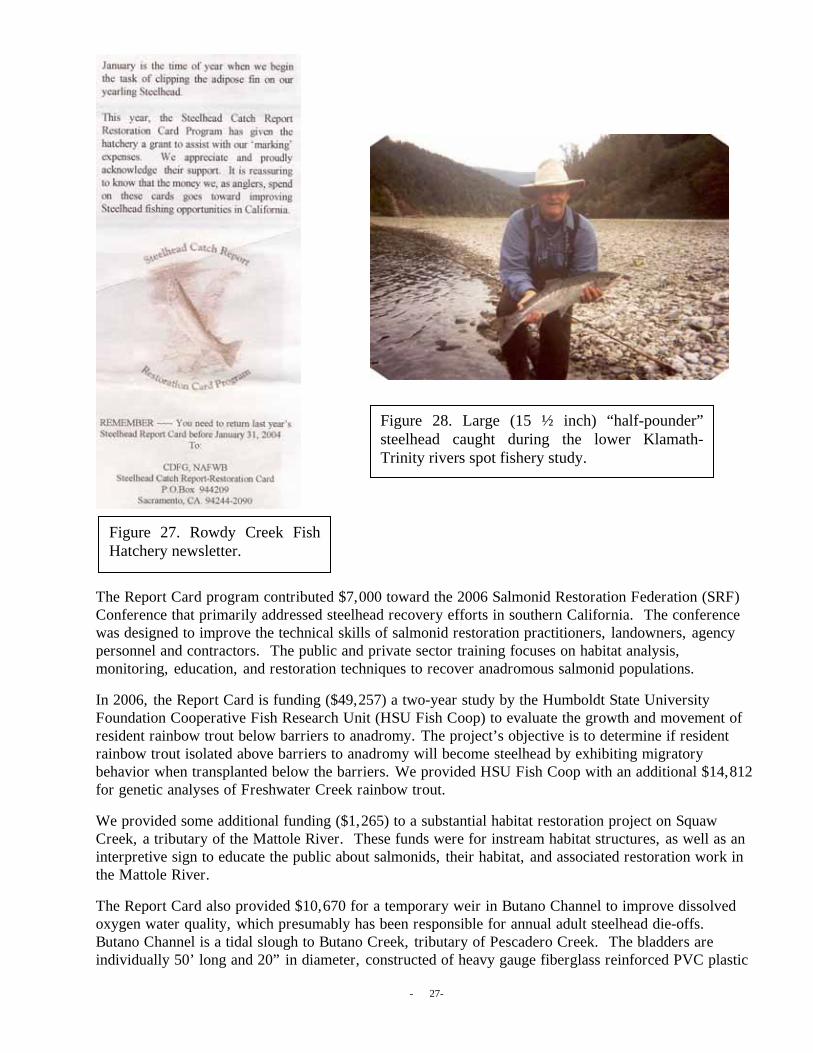
Figure 28. Large (15 ½ inch) “half-pounder” steelhead caught during the lower Klamath-Trinity rivers spot fishery study.
Figure 27. Rowdy Creek Fish Hatchery newsletter.
onference that primarily addressed steelhead recovery efforts in southern California. The conference
vided HSU Fish Coop with an additional $14,812
about salmonids, their habitat, and associated restoration work in
e Mattole River.
he Report Card also provided $10,670 for a temporary weir in Butano Channel to improve dissolved oxygen water quality, which presumably has been responsible for annual adult steelhead die-offs.
utano Channel is a tidal slough to Butano Creek, tributary of Pescadero Creek. The bladders are individually 50’ long and 20” in diameter, constructed of heavy gauge fiberglass reinforced PVC plastic
27-
The Report Card program contributed $7,000 toward the 2006 Salmonid Restoration Federation (SRF) Cwas designed to improve the technical skills of salmonid restoration practitioners, landowners, agency personnel and contractors. The public and private sector training focuses on habitat analysis, monitoring, education, and restoration techniques to recover anadromous salmonid populations.
In 2006, the Report Card is funding ($49,257) a two-year study by the Humboldt State University Foundation Cooperative Fish Research Unit (HSU Fish Coop) to evaluate the growth and movement of resident rainbow trout below barriers to anadromy. The project’s objective is to determine if resident rainbow trout isolated above barriers to anadromy will become steelhead by exhibiting migratory behavior when transplanted below the barriers. We profor genetic analyses of Freshwater Creek rainbow trout.
We provided some additional funding ($1,265) to a substantial habitat restoration project on Squaw Creek, a tributary of the Mattole River. These funds were for instream habitat structures, as well as aninterpretive sign to educate the publicth
T
B
-

(Figure 29). The temporary bladder weir was intended to slow the flow of water from the marsh through the breach, trap fine organic sediment in Butano Channel, and improve water quality throughout the marsh. The project was in cooperation between the NOAA Restoration Center, the Department of Parks and Recreation and the Department of Fish and Game, and has been successful.
The Report Card is providing $41,572 to the Pacific States Marine Fisheries Commission (PSMFC) to complete Phase II of a geographic distributio hout California. The Report Card paid to collect, compile, and evaluate steelhead observation data and derive range and distribution GIS layers (Fig be used to help guide steelhead management and planning efforts. Having an easily-accessible, continually updated distribution map for steelhead will greatly enhance development and evaluation of restoration proposals, creation of status maps, etc. Additionally, this dataset can be used to focus further research and assessment efforts, such as targeting specific streams that appear to be under-sampled or serving as a guide to develop a steelhead monitoring program. These data could also be used in conjunction with similar data for other species (e.g., coho and Chinook salmon) to facilitate multi-species planning efforts.
lhead
00
n
ric documents regarding fish distribution and abundance in the study area in a searchable database, and a report that presents results in text, tables,
d
ummarize what is known about passage, population structure, causes of population decline, and other factors that are essential to an understanding of the fishery.
the to
-2
Figure 29. Example of bladders for temporary weir.
n dataset of steelhead and resident rainbow trout throug
ure 30). The primary benefits will
In 2006, we again supported Rowdy Creek Fish Hatchery (Smith River), and provided them with $7,653 for juvenile steelhead fin clipping over the next three years. The objective was to produce hatchery steelhead for anglers to harvest and help relieve pressure on the Smith River wild steepopulation.
In 2007, the Report Card is providing the Center for Ecosystem Management and Restoration $30,0to collect available information related to steelhead resources of the south central and south coast, including DFG repositories, the Los Padres National Forest office in Santa Maria, UC Santa Barbara, and several other sources, and to provide references for the past distribution and current populatiostatus of steelhead and salmon in the coastal watersheds south of San Francisco. The products are to be a DVD that contains digital copies of several thousand histo
and maps with an associated Microsoft Access® database (Figure 31). These data also will be utilizeby PSFMC for the geographic distribution project. This will provide a comprehensive complete list of steelhead streams south of San Francisco, assess the historical distribution of steelhead and salmon in those streams, and s
The Report Card program is providing $15,000 for a project on the Garcia River. The purpose of project is to assist a rancher to switch from a direct stream agricultural diversion, to an offsite well reduce surface flow impacts, and to provide juvenile salmonid rearing areas in the lower Garcia River.
8-
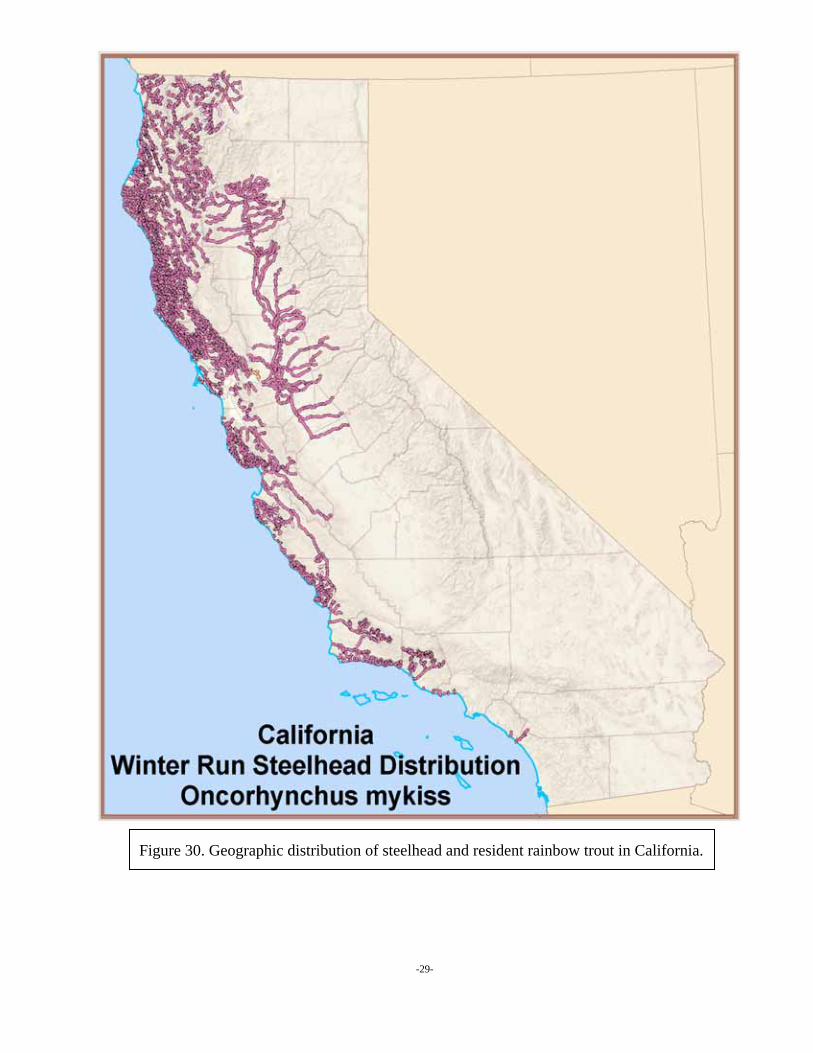
Figure 30. Geographic distribution of steelhead and resident rainbow trout in California.
-29-

The Report Card is also providing $52,972 to the HSU Fish Coop for an “Age Structure of Steelhead in the Klamath River Basin and the Effect of the Half-Pounder Life History on Populations” project. One objective is to determine the current age structure of steelhead stocks throughout the Klamath River basin. These data will be compared to biological and age structure steelhead data collected two decades ago. A second objective is to investigate the benefit of the “half-pounder” life history to steelhead populations in the Klamath River basin. Knowing how the half-pounder life history phenomenon contributes to the sustainability (reproductive success or population viability) of the Klamath River steelhead population should assist in managing the fishery.
The Report Card program recently approved $40,000 toward a HSU master’s thesis in fisheries. The thesis will investigate the “Possible Decline in the Half-pounder Life History among Trinity River Steelhead”. This study will complement the Klamath River half-pounder study through scale collections and genetic analysis. The project will evaluate hatchery practices evaluation by examining and contrasting spawning, rearing and release protocols at Trinity River Hatchery.
The R t dditional resources are available with the additional $800,000 appropriation.
Figure 31. Example of tables with an associated searchable Microsoft Access® database.
eport Card program is currently considering several additional proposals, as word is out thaa
-30-

ANGLING DATA
The Report Card has provided the Department with data on how many steelhead anglers there are, where they live, where they fish, and how successful they are in catching steelhead. Angler effort and harvest data provide indications of steelhead population status and help the Department identify areas potentially requiring additional restoration, and adjust angling regulations according to management objectives.
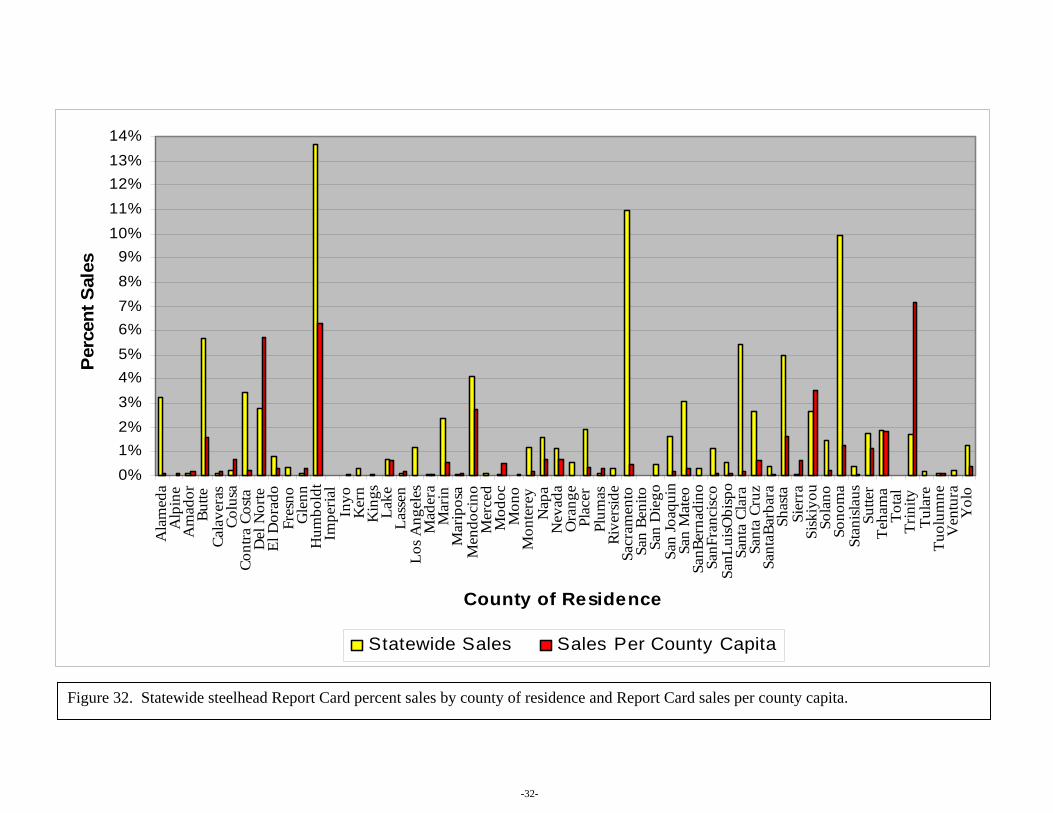
Annually, the greatest percentage of Report Cards are sold to Humboldt, Sacramento and Sonoma county residents (Figure 32, Table 1). However, by comparing the number of Report Cards sold within
ercentage
at although only 1.7% of Report Card sales are to Trinity County residence (Table 1), roughly 7% of Trinity County residents purchase Report Cards. Humboldt, Del Norte, Siskiyou and Mendocino
%), e 33). tely
(including Feather, Yuba and American rivers) received approximately 13% of the statewide effort from 1993-1998.
ing
the d a notable increase in
steelhead fishing effort since 1998. This information is useful for determining angling pressure on
-31-
aof steelhead anglers within a county. Interestingly, annual Report Card sales per county capita shows county to the number of residence within a county (“per county capita”) we can assess the p
th
counties also have relatively large percentages of steelhead anglers. Conversely, though nearly 11% of annual Report Card sales are to Sacramento County residence, only 0.5% of Sacramento County residence purchase a Report Card. Sonoma County sales are similar to Sacramento County.
From 1993 through 1998, the majority of steelhead fishing in California took place in the Smith (18Klamath (16.2%), Trinity (9.6%), Mad (8.3%), Russian (7.8%), and Feather rivers (5.6%) (FigurCombined, the Klamath-Trinity watershed received the greatest steelhead angling effort (approxima27% of the statewide effort). The Sacramento River system
From 1999 through 2005, many of the same rivers received the majority of the state’s steelhead fisheffort, but there were several notable shifts in fishing effort (Figure 33). Nearly all coastal streams (with the exception of the Klamath and Trinity rivers) decreased in fishing effort since 1998, andTrinity and Central Valley rivers (Sacramento and San Joaquin systems) receive
individual river systems.
0%1%2%3%4%5%6%7%8%9%
10%11%12%13%14%
Ala
med
aA
lpin
eA
mad
orBu
tteCa
lave
ras
Colu
saCo
ntra
Cos
taD
el N
orte
El D
orad
oFr
esno
Gle
nnH
umbo
ldt
Impe
rial
Inyo
Ker
nK
ings
Lake
Lass
en
Ora
nge
Plac
er
San
Mat
eoSa
nBer
nadi
noSa
nFra
ncisc
oSa
nLui
sObi
spo
Sant
a Cl
ara
Sant
a Cr
uzSa
ntaB
arba
raSh
asta
Sier
raSi
skiy
ouSo
lano
Sono
ma
Stan
islau
sSu
tter
Teha
ma
Tota
lTr
inity
Tula
reTu
olum
neV
entu
raY
olo
es
Perc
ent S
ales
ale unty Capita
Plum
asRi
vers
ide
Sacr
amen
toSa
n Be
nito
San
Die
goSa
n Jo
aqui
n
idence
s Per Co
Los A
ngel
esM
ader
aM
arin
Mar
ipos
aM
endo
cino
Mer
ced
Mod
ocM
ono
Mon
tere
yN
apa
Nev
ada
County of R
Statewide Sales S
-32-
Figure 32. Statewid port t sa ce a ard sales per county capita. nd Report Cles by county of residen Card percene steelhead Re

Table 1. Statewide steelhead Report Card percent sales by county of residence and Report Card sales per county capita. County Statewide Sales Sales Per County Capita Alameda 3.23% 0.13% Alpine 0.00% 0.13% Amador 0.12% 0.18% Butte 5.68% 1.56% Calaveras 0.12% 0.15% Colusa 0.24% 0.68% Contra Costa 3.47% 0.20% Del Norte 2.78% 5.70% El Dorado 0.77% 0 .26%Fresno 0.36% 0.02% Glenn 0.13% 0.27% Humboldt 13.65% 6.31% Imperial 0.02% 0.01% Inyo 0.01% 0.04% Kern 0.27% 0.02% Kings 0.04% 0.02% Lake 0.70% 0.63% Lassen 0.11% 0.19% Los Angeles 1.17% 0.01% Madera 0.08% 0.03% Marin 2.37% 0.56% Mariposa 0.04% 0.12% Mendocino 4.08% 2.75% Merced 0.10% 0.02% Modoc 0.08% 0.51% Mono 0.01% 0.05% Monterey 1.21% 0.18% Napa 1.57% 0.70% Nevada 1.13% 0.68% Orange 0.55% 0.01% Placer 1.95% 0.35% Plumas 0.10% 0.29% Riverside 0.27% 0.01% Sacramento 10.97% 0.47% San Benito 0.02% 0.03% San Bernadino 0.30% 0.01% San Diego 0.45% 0.01% San Francisco 1.11% 0.09% San Joaquin 1.67% 0.15% San Luis Obispo 0.58% 0.13% San Mateo 3.04% 0.26% Santa Barbara 0.41% 0.06% Santa Clara 5.46% 0.19% Santa Cruz 2.69% 0.64% Shasta 5.00% 1.65% Sierra 0.04% 0.62% Siskiyou 2.67% 3.51% Solano 1.47% 0.21% Sonoma 9.94% 1.26% Stanislaus 0.39% 0.05% Sutter 1.75% 1.13% Tehama 1.87% 1.80% Trinity 1.72% 7.14% Tulare 0.14% 0.02% Tuolumne 0.10% 0.11% Ventura 0.24% 0.02% Yolo 1.27% 0.40% Yuba 0.26% 0.22%
-33-

0.0%
2.0%
4.0%
6.0%
8.0%
10.0%
12.0%
14.0%
16.0%Sm
ith R
iver
Sm to
Kla
m
Kla
mat
h R
iver
SF T
rini
ty R
iver
Trin
ity R
iver
Kla
m to
Mad
Mad
Riv
er
Mad
to E
el
Eel R
iver
Van
Duz
en R
iver
SF E
el R
iver
MF
Eel R
iver
Eel t
o M
att
Mat
tole
Riv
er
Mat
t to
Noy
oN
oyo
Riv
er
Noy
o to
Nav
Nav
arro
Riv
er
Nav
to G
ual
Gua
lala
Riv
er
Gua
l to
Rus
Rus
sian
Riv
er
Rus
sian
to S
F
Bay
Trib
sSa
cram
ento
Feat
her
Riv
er
Yub
a R
iver
Am
eric
an R
iver
San
Joaq
uin
Riv
er
Bay
- San
Lore
nzo
San
Lore
nzo
Riv
er
SLR
to S
alin
as
Car
mel
Riv
er
Car
mel
to S
LOSL
O to
PtC
once
pt
PtC
once
pt to
Ven
t
Ven
tura
Riv
er
Sant
a C
lara
Riv
er
Sout
h of
San
ta C
lara
Location
er E
ffort
(sta
tew
ide
perc
ent)
18.0%A
ngl
1993-1998 1999-2005
-34-
Figure 33. Steelhead angling effort by location, 1993-1998 and 1999-2005, expressed as a percentage of total statewide effort.

Figure 34 displays the number of steelhead caught per trip (wild and hatchery combined) for individual rivers throughout California from the periods of 1993-1998 and 1999-2005. These numbers are likely over-estimates of actual catch per trip, as many anglers did not record unsuccessful fishing trips, but they represent a good relative index between streams. The Feather, Yuba and Klamath rivers had the highest likelihood of catching a steelhead on a given fishing trip from 1993 to 1998. Interestingly, some streams that received little fishing pressure had relatively high success rates (i.e., South Fork Trinity had less than 1% of the statewide effort (see Figure 33), yet anglers reported catching greater than one steelhead per trip). This is likely from local anglers familiar with good fishing spots on a relatively healthy steelhead run. Conversely, the Russian River received nearly 8% of the angling effort with less than one steelhead caught every two trips from 1993-1998.
Figure 34 also illustrates that on a statewide basis, since 1998 anglers are catching more steelhead (wild and hatchery combined) per trip, particularly on the coastal rivers. The Carmel River was reopened to angling in 1998/99 season, after the river reconnected with the Pacific Ocean for several years and steelhead populations rebounded (see Figure 19). For the streams south of Carmel, few anglers expend effort on these streams and are likely local anglers knowledgeable about fishing their familiar spots.
For the northern coastal streams and Central Valley rivers, a couple of possibilities (stand alone or combined) are apparent. Steelhead populations have indeed improved on the north coast streams, and steelhead catch per trip has improved, and 2) Central Valley steelhead populations have remained relatively constant. However taking into consideration angler effort information (Figure 34), it is probable that steelhead populations have improved within the Central Valley rivers and the semi-static catch per trip is a reflection of the shifting of steelhead angler effort toward Central Valley rivers.
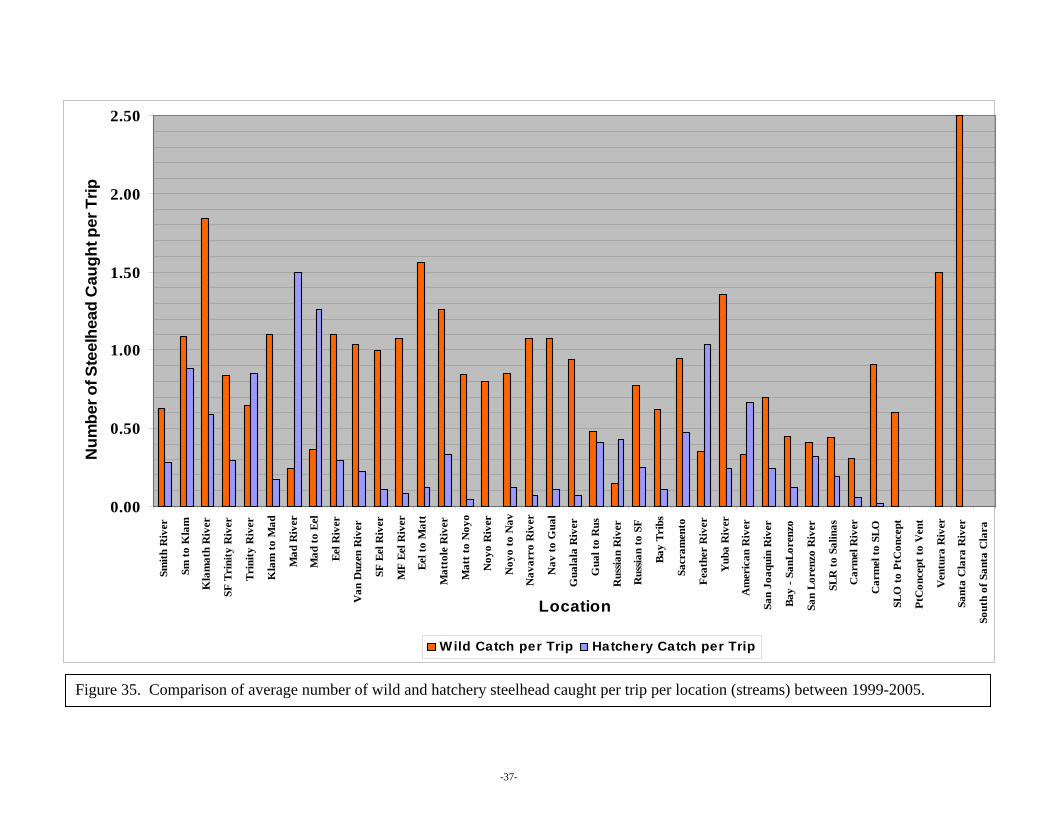
As mentioned previously, prior to 1999, the Department and steelhead anglers were unable to differentiate between wild and unmarked hatchery-reared steelhead. By fin clipping all hatchery-reared steelhead and having anglers record their catches, we are now able to evaluate wild steelhead run size relative to hatchery run size and the percentage of straying2. This is tremendously important for evaluating whether management objectives are being met, effectiveness of hatchery practices, and evaluating directives set by FGC 6900 et seq. Figure 35 illustrates the average number of wild and hatchery steelhead caught per trip (1999-2005) on a given anadromous stream throughout California. In general, wild steelhead are caught predominantly throughout the state. Several streams with hatchery programs (Smith, Klamath, Trinity, Mad, Russian, Sacramento, Feather, American, and San Lorenzo and area streams) have high hatchery steelhead catches.
Also, the Report Card data reveal that most non-hatchery streams have low catch rates of hatchery steelhead, indicting that some straying is occurring, but that generally only a low percent of the overall steelhead run within these streams are hatchery. Particularly notable are several coastal streams that are managed as wild steelhead streams, where the data indicate that a considerable proportion of those runs are now hatchery strays. The Department is currently investigating the implication of these data.
2 Hatchery steelhead caught in streams that do not have hatchery releases.
-35-

0.00
0.50
1.00
1.50
2.00
2.50
Smith
Riv
er
Sm to
Kla
m
Kla
mat
h R
iver
SF T
rini
ty R
iver
Trin
ity R
iver
Kla
m to
Mad
Mad
Riv
er
Car
mel
Riv
er
Car
mel
to S
LO
SLO
to P
tCon
cept
PtC
once
pt to
Ven
t
Ven
tura
Riv
er
Sant
a C
lara
Riv
er
Sout
h of
San
ta C
lara
Mad
to E
el
Eel R
iver
Van
Duz
en R
iver
SF E
el R
iver
MF
Eel R
iver
San
Lore
nzo
Riv
er
SLR
to S
alin
as
i
Eel t
o M
att
Mat
tole
Riv
er
Mat
t to
Noy
o
Noy
o R
iver
Noy
o to
Nav
Nav
arro
Riv
er
Nav
to G
ual
Gua
lala
Riv
er
LocatG
ual t
o R
us
Rus
sian
Riv
er
Rus
sian
to S
F
Bay
Trib
s
Sacr
amen
to
Feat
her
Riv
er
on
Yub
a R
iver
Am
eric
an R
iver
San
Joaq
uin
Riv
er
Bay
- San
Lore
nzo
Num
ber o
f Ste
elhe
ad C
augh
t per
Trip
1993-1998 1999-2005
-36-
Figure 34. Comparison of averag elhe ocat and 1999-2005. ion (streams) between 1993-1998 ad caught per trip per le number of ste
0.00
0.50
1.00
1.50
2.00
2.50
Smith
Riv
er
Sm to
Kla
m
Kla
mat
h R
iver
SF T
rini
ty R
iver
Trin
ity R
iver
Kla
m to
Mad
Mad
Riv
er
Mad
to E
el
Eel R
iver
Van
Duz
en R
iver
SF E
el R
iver
MF
Eel R
iver
Eel t
o M
att
Mat
tole
Riv
er
Mat
t to
Noy
o
Noy
o R
iver
Noy
o to
Nav
Nav
arro
Riv
er
Nav
to G
ual
Gua
lala
Riv
er
Gua
l to
Rus
Rus
sian
Riv
er
Rus
sian
to S
F
Bay
Trib
s
Sacr
amen
to
Feat
her
Riv
er
Yub
a R
iver
Am
eric
an R
iver
San
Joaq
uin
Riv
er
Bay
- San
Lore
nzo
San
Lore
nzo
Riv
er
SLR
to S
alin
as
Car
mel
Riv
er
Car
mel
to S
LO
SLO
to P
tCon
cept
PtC
once
pt to
Ven
t
Ven
tura
Riv
er
Sant
a C
lara
Riv
er
Sout
h of
San
ta C
lara
Location
Num
ber o
f Ste
elhe
ad C
augh
t per
Trip
W ild Catch per Trip Hatchery Catch per Trip
-37-
Figure 35. Comparison of average number of wild and hatchery steelhead caught per trip per location (streams) between 1999-2005.

California Steelhead anglers in general tend to practice catch-and-release. Even prior to the implementation of a catch-and-release requirement in 1998 for wild steelhead, anglers generally released 70% of all steelhead caught, regardless of whether they were hatchery or wild (Figure 36). Since the marking of all hatchery-reared steelhead and requirement that all wild steelhead be released (with the exception of the Smith River), conservation of wild and naturally spawning steelhead, per FGC 6900 et seq., can be monitored, regulated and managed because of the Report Card Program.
From 1999 through 2005, steelhead anglers continued to release the majority of their steelhead (including hatchery steelhead) caught in most streams (Figure 37). Though all wild steelhead are to be released, with the exception of the Smith River, a small percentage of wild steelhead are harvested annually. This may be from a lack on knowledge regarding the regulations, or possibly some anglers chose to keep an injured wild steelhead regardless of the regulations. Although anglers are allowed to keep as many as 5 wild steelhead annually on the Smith River, only 27% of those caught were kept. Conversely, in the relatively remote coastal rivers and streams entering the ocean between the Gualala and Russian rivers, 21% of the wild steelhead were reported illegally harvested. There are likely many other steelhead that go unreported.
Regarding the high rate of release of hatchery steelhead, several factors likely contribute. Steelhead anglers generally tend to be concerned with the resource and conservation. Thus releasing the steelhead, in theory, would improve the future fishery. However, releasing hatchery steelhead to potentially spawn with wild steelhead is contrary to the Department’s management objectives (per FGC 6900 et seq.) and can alter the resilience of the wild run (e.g., shift run timing, alter patters of genetic diversity) that has adapted to the environmental conditions of the stream or drainage. This could be tremendously unfavorable in the case of hatchery steelhead straying into streams managed strictly for wild stocks. An outreach program to educate steelhead anglers may be necessary to educate and encourage anglers to keep hatchery steelhead, consistent with the regulations especially in streams with small wild populations or streams designated for management of run as “wild”.
Anglers also may be releasing hatchery steelhead because the regulations limit their ability to keep hatchery steelhead and continue fishing, e.g. if the regulation prevents anglers from retaining hatchery steelhead or limits angler possession to one hatchery steelhead per day. The angler is thus put in a dilemma of keeping the hatchery steelhead and ending their day of fishing, or releasing it to continue their fishing experience, which they have often traveled long distances to do. The Department is evaluating the freshwater sport fishing regulations regarding harvest of hatchery steelhead throughout California to try to address this issue.
The Report Card data were combined into California steelhead DPSs to look at trends. These data show that since 1998, there has been a shift in angler effort from the Northern and Central California steelhead DPS to the Central Valley DPS (Figure 38). Several factors may contribute to this shift, including increased fuel costs causing anglers to fish closer to home (e.g., Central Valley anglers choosing to fish locally rather than traveling to coastal streams). Additionally, anglers may be targeting hatchery steelhead and the Central Valley overall provides better opportunity for harvesting a hatchery steelhead.
Looking at the number of steelhead (wild or hatchery) caught per trip within each DPS, the Report Card data indicate that steelhead fishing has improved overall since 1998, with the exception of the Central Valley (Figure 39). One explanation for this increase in catch per trip may be that, in general, steelhead populations statewide have indeed improved, but steelhead populations have remained relatively constant within the Central Valley rivers. This takes into consideration the increased angler effort (fishing pressure) exerted on Central Valley rivers. It is also possible that steelhead populations have also improved within the Central Valley rivers and the slight decrease in catch per trip is a reflection of the tremendous shifting of steelhead angler effort toward Central Valley rivers.
-38-

Car
mel
to S
LOSL
O to
PtC
once
ptPt
Con
cept
to V
ent
Ven
tura
Riv
erSa
nta
Cla
ra R
iver
Sout
h of
San
ta C
lara
Yub
a R
iver
Am
eric
an R
iver
San
Joaq
uin
Riv
erBa
y - S
anLo
renz
oSa
n Lo
renz
o R
iver
SLR
to S
alin
asC
arm
el R
iver
SF T
rini
ty R
iver
Van
Duz
en R
iver
Noy
o to
Nav
Feat
her
Riv
er
Nav
arro
Riv
erN
av to
Gua
lG
uala
la R
iver
Gua
l to
Rus
Rus
sian
Riv
erR
ussia
n to
SF
Bay
Trib
sSa
cram
ento
LocationKept Released
0%
10%
20%
30%
40%
50%
60%
70%
80%
90%
100%
Smith
Riv
erSm
to K
lam
Kla
mat
h R
iver
Pece
nt o
f Ste
elhe
ad K
ept a
nd R
elea
sed
Trin
ity R
iver
Kla
m to
Mad
Mad
Riv
erM
ad to
Eel
Eel R
iver
SF E
el R
iver
MF
Eel R
iver
Eel t
o M
att
Mat
tole
Riv
erM
att t
o N
oyo
Noy
o R
iver
-39-
Fig of st rele 993-1998. ased by location, 1eelhead kept and ure 36. Percentage

0%
10%
20%
30%
40%
50%
60%
70%
80%
90%
100%
Smith
Riv
erSm
to K
lam
Kla
mat
h R
iver
SF T
rini
ty R
iver
Tri
nity
Riv
erK
lam
to M
adM
ad R
iver
Mad
to E
elE
el R
iver
Van
Duz
en R
iver
SF E
el R
iver
MF
Eel
Riv
erE
el to
Mat
tM
atto
le R
iver
Mat
t to
Noy
oN
oyo
Riv
erN
oyo
to N
avN
avar
ro R
iver
Nav
to G
ual
Gua
lala
Riv
erG
ual t
o R
usR
ussi
an R
iver
Rus
sian
to S
FB
ay T
ribs
Sacr
amen
toFe
athe
r R
iver
Yub
a R
iver
Am
eric
an R
iver
San
Joaq
uin
Riv
erB
ay -
SanL
oren
zoSa
n L
oren
zo R
iver
SLR
to S
alin
asC
arm
el R
iver
Car
mel
to S
LO
SLO
to P
tCon
cept
PtC
once
pt to
Ven
tV
entu
ra R
iver
Sant
a C
lara
Riv
erSo
uth
of S
anta
Cla
ra
Location
Pece
nt o
f Wild
and
Hat
cher
y St
eelh
ead
Rel
ease
d
W ild Released Hatchery Released
-40-
Figure 37. Percentage of steelhead kept and released by location, 1999-2005.

0%5%
10%15%20%25%30%35%40%45%50%
Klamath Northern Central Central Valley South Central Southern
California's Distinct Population Segments
Stat
ewid
e A
ngle
r Effo
rt
MountainsProvince
California California Coast California
(DPS) for Steelhead
1993-1998 1999-2005
Figure 38. Steelhead angling effort by California’s Distinct Population Segments for steelhead, 1993-1998 and 1999-2005, expressed as a percentage of total statewide effort.
0.00
0.20
0.40
0.60
0.80
1.00
1.20
1.40
1.60
1.80
2.00
KlamathMountainsProvince
NorthernCalifornia
CentralCalifornia
Central Va nCali ia
California's Distinct Population Segments (DPS) for Steelhead
Num
ber o
f Ste
elhe
ad C
augh
t per
Trip
lley South CentralCoast
Southerforn
1993-1998 1999-2005
Figure 39. Steelhead angling effort by California’s Distinct Population Segments for steelhead, 1993-1998 and 1999-2005, expressed as a percentage of total statewide effort.
-41-

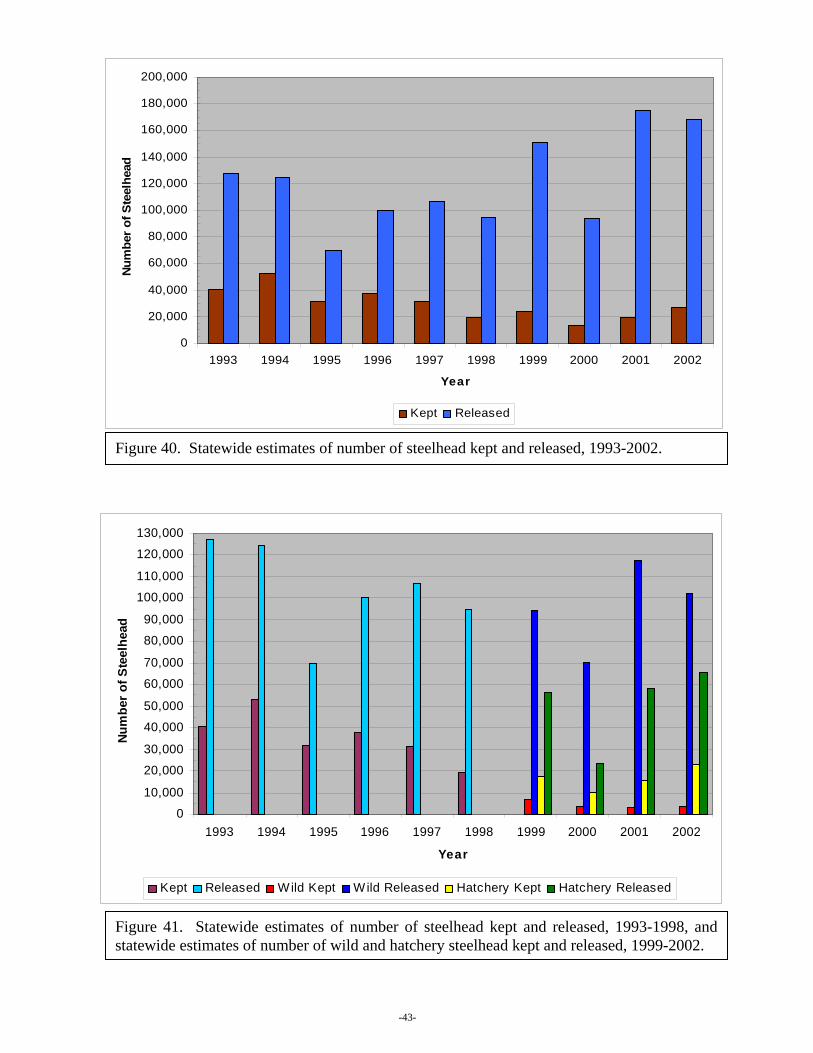
The Report Card has provided the Department with the ability to estimate total statewide steelhead catches. From 1993 through 2002, the number of steelhead kept and released has fluctuated annually (Figure 40), with the greatest number of steelhead caught and released in 2001 and 2002. The 2003 through 2005 data are currently being analyzed for catch estimates, and the 2006 data are still being returned by anglers and entered by the Department.
Again, prior to 1999 hatchery raised steelhead were not marked with an adipose fin clip. Being able to distinguish hatchery steelhead from wild steelhead has allowed the Department to develop better harvest estimates (Figure 41). In 1999, approximately 7,000 wild steelhead were kept statewide, which may be an overestimate since anglers were learning to differentiate between wild and hatchery, and some hatchery fish may not have been clipped (1996 hatch, but clipping didn’t start until 1997). However, the estimate may be accurate as it was prior to more restrictive harvest regulations for wild fish, and over 17,000 hatchery steelhead were kept in 1999. An estimated average of 3,500 wild steelhead were kept statewide in 2000, 2001 and 2002. An increasing number of hatchery steelhead were kept and released annually from 2000 through 2002. Since 1999, an average of 1.5 times more wild steelhead have been caught statewide than hatchery steelhead.
An important benefit of the Report Card data are that they allow the Department to look at streams individually for management specific to the needs of the stream. Prior to the mandatory return requirement implemented in 2003, catch estimates per stream were not possible because there were too few data for the majority of streams. The Department anticipates being able to provide individual stream catch estimates annually with future analyses, as more anglers comply with the mandatory return. Data presented in Table 2 provides an indication of steelhead angling effort and catch for each location.
steelhead migration, angler effort and angler success by month for each stream. Angling effort and success for the majority of California’s streams for the periods of 1993 through 1998, and 1999 through 2005 (hatchery steelhead differentiated) are provided in Appendix C. These figures display the percent of angler effort and percent of steelhead catch each month in a given steam for 1993-1998, and percent of wild and hatchery steelhead catch each month for 1999-2005. The figures illustrate the run timing for those streams. Additional and detailed annual analyses for each stream and DPS, beyond the scope of this report, will be available in a forthcoming biological and management-focused administrative report.
-42-
Ta
his table displays, for 2003 to 2005, the average number of steelhead fishing trips reported, and theverage number of wild and hatchery steelhead reported caught annually for each location.
The angling data gathered from the Report Cards allows the Department to evaluate the timing of
0
160,000
180,000
200,000
20,000
40,000
60,000
80,000
100,000
120,000
140,000
Num
ber
of S
teel
head
1993 1994 1995 1996 1997 1998 1999 2000 2001 2002
Year
Kept Released
Figure 40. Statewide estimates of number of steelhead kept and released, 1993-2002.
0
10,000
20,000
30,000
40,000
50,000
60,000
70,000
80,000
90,000
100,000
110,000
120,000
130,000
lhea
d
1993 1994 1995 1996 1997 1998 1999 2000 2001 2002
Year
Num
ber
of S
tee
Kept Released Wild Kept Wild Released Hatchery Kept Hatchery Released
Figure 41. Statewide estimates of number of steelhead kept and released, 1993-1998, and statewide estimates of number of wild and hatchery steelhead kept and released, 1999-2002.
-43-

Table 2. Average number of steelhead fishing trips and average number of wild and hatchery steelhead reported annually (2003-3005).
Location Code Location Trips Wild Kept Wild Released Hatchery Kept Hatchery Released 2a Smith River 3,783 623 1,355 537 687 2b NF Smith River 78 13 32 5 16 2c MF Smith River 965 129 494 104 174 2d SF Smith River 705 116 567 56 126 3 Smith to Klamath 55 4 67 13 42
4a Upper Klamath River 1,936 31 3,188 105 867 4a1 Shasta River 10 1 5 2 1 4a2 Scott River 116 0 199 1 2 4a3 Salmon River 121 0 227 0 6 4b Lower Klamath River 1,232 24 2,012 104 909 5a SF Trinity River 115 8 97 9 38 5b Hayfork Creek 26 1 28 2 0 6a Trinity River 5,296 55 2,974 606 3,968 6b New River 53 0 49 1 1 7 Klamath to Mad 190 2 219 13 23 8 Mad River 1,244 9 248 650 1,320 9 Mad to Eel 23 0 5 9 31
10 Eel River 111 3 130 5 31 11 Van Duzen River 74 1 67 1 6 12 SF Eel River 250 4 265 2 30 13 MF Eel River 20 1 23 1 1 14 Eel to Mattole 10 0 15 0 0 15 Mattole River 132 10 173 1 4 16 Mattole to Noyo 65 0 42 1 1 17 Noyo River 12 0 9 0 0 18 Noyo to Navarro 14 0 14 1 2 19 Navarro River 104 0 105 0 9 20 Navarro to Gualala 164 2 195 1 9 21 Gualala River 316 2 231 4 13 22 Gualala to Russian 17 0 2 3 2 23 Russian River 1,089 4 115 249 204 24 Russian to SF 66 0 52 3 15 25 Bay Tributaries 29 1 15 1 1
26a Upper Sacramento 445 11 344 37 124 26b Mid-Upper Sacramento 271 4 237 31 96 26c Mid-Lower Sacramento 126 2 43 15 38 26d Lower Sacramento 59 1 16 9 9
26c1 Feather River 1,667 20 562 262 1,297 26c2 Yuba River 767 2 1,046 10 172 26c3 American River 3,542 31 1,809 359 1,440 26d1 Putah Creek 2 0 0 0 0 27a San Joaquin River 7 0 7 1 0 27b Merced River 24 0 20 1 3 27c Tuolumne River 8 0 11 0 0 27d Stanislaus River 110 1 41 1 20 27e Mokelumne River 92 2 81 4 20 27f Calaveras River 34 0 45 1 2 28 Bay to San Lorenzo 111 1 49 4 11 29 San Lorenzo River 429 4 159 3 150 30 SLR to Salinas 139 0 55 0 23 31 Carmel River 70 1 15 1 1 32 Carmel to San Luis Obispo 57 0 28 0 1 33 SLO to Pt Concept 2 0 2 0 0 34 Pt Concept to Ventura 0 0 0 0 0 35 Ventura River 0 0 0 0 0 36 Santa Clara River 1 0 1 0 0 37 South of Santa Clara 1 0 0 0 0
-44-
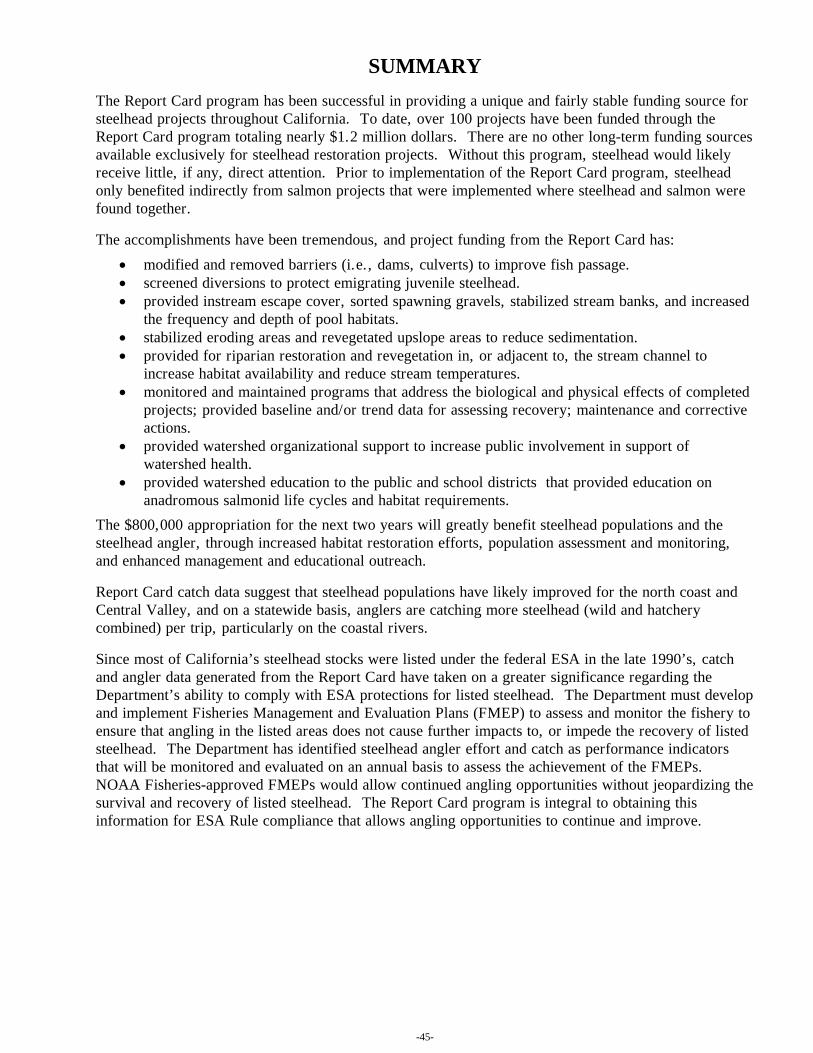
SUMMARY
The m has been sful in iding a un d fairly sta unding source fosteelhead projects throughout California. To date, over 100 projects have been funded through the Repo taling nearly million ars. There o other long m funding sourcavailable exclusively for steelhead restoration projects. Without this program, steelhead would likely receive little, if any, direct attention. Prior to implementation of the Report Card program, steelhead only benefited indirectly from salmon projects that were implemented where steelhead and salmon were fou g
The accomplishments have been tremendous, and project funding from the Report Card has:
• oved barrier ., dams, lverts) to imp e fish passage• ons to prote grating ju ile steelhe• am escape co rted spa ng gravels lized stream ks, and increa
• e areas to r e sedimenta •
n bitat availability an duce strea temperature•
ided baseline an trend dat r assessing very; mainten ce and corrective
• shed organizatio support t
• school districts that provided education on
The $800,000 appropriation for the next two years will greatly benefit steelhead populations and the steelhead angler, through increased habitat restoration efforts, population assessment and monitoring, and enhanced management and educational outreach.
Repo suggest that ead popul ons have lik mproved fo north coast andCentral Valley, and on a statewide basis, anglers are catching more steelhead (wild and hatchery combined) per trip, particularly on the coastal rivers.
Since most of California’s steelhead stocks were listed under the federal ESA in the late 1990’s, catch and angler data generated from the Report Card have taken on a greater significance regarding the Dep ply with E protection or listed stee d. The Depa ent must developand implement Fisheries Management and Evaluation Plans (FME assess and itor the fisheren h e listed area not caus rther imp , or impede recovery of lisste ent has ide steelhea gler effor atch as perf nce indicatorsthat will be monitored and evaluated on an annual basis to assess the achievement of the FMEPs. NOAA Fisheries-approved FMEPs would allow continued angling ortunities wit t jeopardizing thesurvival and recovery of listed steelhead. The Report Card program is integral to obtaining this information for ESA Rule compliance that allows angling opportunities to continue and improve.
Report Card progra succes prov ique an ble f r
rt Card program to $1.2 doll are n -ter es
nd to ether.
modified and rem s (i.e cu rov . screened diversi ct
ver, soemi ven ad
, stabi.
provided instre wni ban sed the frequency and depth of pool habitats. stabilized eroding areas and revegetated upslop educ tion.provided for riparian restoration and revegetation in, or adjacent to, the stream channel to i crease ha d re m s.
monitored and maintained programs that address the biological and physical effects of completed projects; prov d/or a fo reco an actions.
provided water nal o increase public involvement in support of watershed health.
provided watershed education to the public and anadromous salmonid life cycles and habitat requirements.
rt Card catch data steelh ati ely i r the
artment’s ability to com SA s f lhea rtm P) to mon y to
sure t at angling in th. The Departm
sntified
does ed an
fu acts to ormathe te
d
elhead t and c
opp hou
-45-

RECOMMENDATIONS
on wild steelhead separately from hatchery steelhead, it is a tremendously valuable ent of the
incr se valuate steelhead ang g
The Department also recommends that the Report Card program’s annual spending authority be incr se number and/or larger steelhead projects. This would allow for an acceleration of the restoration of habitat conditions for Cal g opportunities, and angler success soo .spent wapproximately the annual revenue (roughly $250,000). This would allow the Department to fund stee a lance.
The Department recommends that the Steelhead Fishing Report-Restoration Card requirement and program be continued.
The Department believes that the Report Card program provides the best option for generating steelhead catch data to assess harvest and meet management goals outlined in the Steelhead Plan, to measure potential angling impacts to ESA-listed steelhead in compliance with the ESA, and to generate revenue to implement restoration measures identified in the Steelhead Plan and elsewhere. Because the Report Card captures datatool for managing steelhead populations listed under the ESA. The mandatory return requiremReport Card is currently the best option for recovering the steelhead angler’s data, and has appreciably
ea d the volume of data which significantly improves the Department’s ability to elin and manage each stream separately.
ea d, subsequent to the sunset of the $800,000 appropriation, to allow for a greater
ifornia steelhead, thus improving steelhead populations, anglinner Revenue generated from steelhead anglers purchasing a Report Card should be managed and
isely to improve the resource. It is recommended that an annual spending be set at
lhe d projects, while maintaining a prudent reserve but not accruing a substantial unspent ba
-46-

APPENDIX A
Department’s
Steelhead Fishing Report-Restoration Program
Web Page,
currently:
(http://www.dfg.ca.gov/nafwb/SteelheadReportCard.html)

A–1

A–2

APPENDIX B
Frequently Asked Questions
Currently:
(http://www.dfg.ca.gov/nafwb/SteelheadReportCardFAQ.html)

B–1

B–2

B–3

B–4

B–5

B–6

APPENDIX C
Monthly Angling Effort and Monthly Catch
for the Majority of California’s Streams 1993 through 1998,
and 1999 through 2005
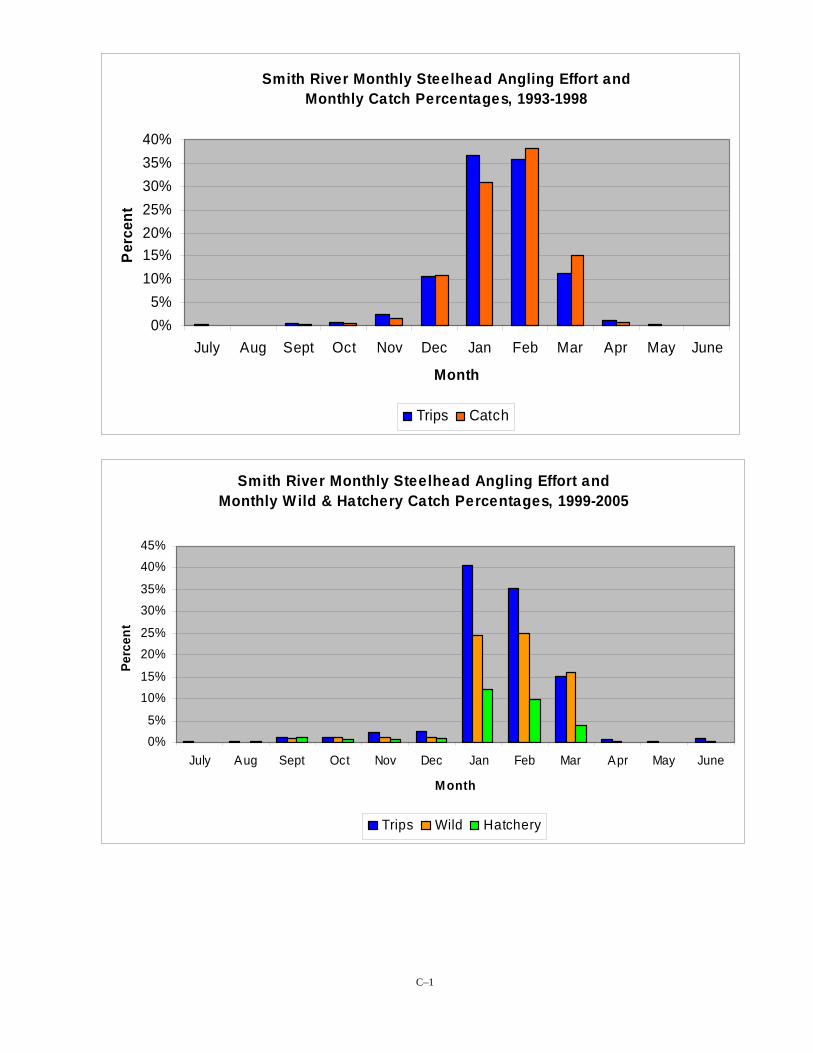
Smith River Monthly Steelhead Angling Effort and Monthly Catch Percentages, 1993-1998
0%5%
10%15%20%25%30%35%40%
July Aug Sept Oct Nov Dec Jan Feb Mar Apr May June
Perc
ent
Month
Trips Catch
Smith River Monthly Steelhead Angling Effort and
0%5%
10%15%
20%25%
30%35%
40%45%
July Aug Sept Oct Nov Dec Jan Feb Mar Apr May June
Month
Perc
ent
Monthly Wild & Hatchery Catch Percentages, 1999-2005
Trips Wild Hatchery
C–1
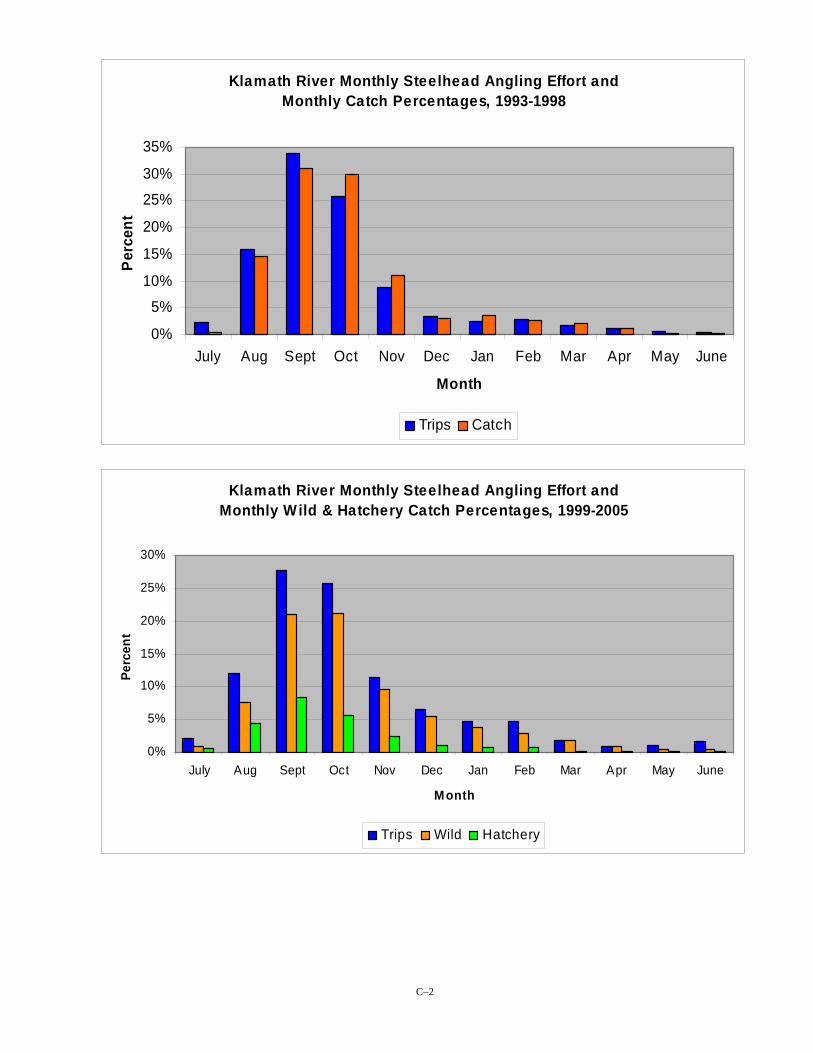
Klamath River Monthly Steelhead Angling Effort and Monthly Catch Percentages, 1993-1998
0%
5%
10%
15%
20%
25%
30%
35%
July Aug Sept Oct Nov Dec Jan Feb Mar Apr May June
Month
Perc
ent
Trips Catch
Klamath River Monthly Steelhead Angling Effort and Monthly Wild & Hatchery Catch Percentages, 1999-2005
0%
5%
10%
15%
20%
25%
30%
July Aug Sept Oct Nov Dec Jan Feb Mar Apr May June
Month
Perc
ent
Trips Wild Hatchery
C–2

SF Trinity River Monthly Steelhead Angling Effort and Monthly Catch Percentages, 1993-1998
0%
5%
10%
15%
20%
25%
30%
July Aug Sept Oct Nov Dec Jan Feb Mar Apr May June
Month
Perc
ent
Trips Catch
SF Trinity River Monthly Steelhead Angling Effort and Monthly Wild & Hatchery Catch Percentages, 1999-2005
0%
5%
10%
15%
20%
25%
July Aug Sept Oct Nov Dec Jan Feb Mar Apr May June
Month
Perc
ent
Trips Wild Hatchery
C–3

Trinity River Monthly Steelhead Angling Effort and Monthly Catch Percentages, 1993-1998
0%
5%
10%
15%
20%
25%
30%
July Aug Sept Oct Nov Dec Jan Feb Mar Apr May June
Month
Per
cent Trips
Catch
Trinity River Monthly Steelhead Angling Effort and Monthly Wild & Hatchery Catch Percentages, 1999-2005
0%
5%
10%
15%
20%
25%
July Aug Sept Oct Nov Dec Jan Feb Mar Apr May June
M onth
Perc
ent
Trips Wild Hatchery
C–4

Rivers between Klamath and Mad rivers (Loc. 7)Monthly Steelhead Angling Effort and Monthly Catch Percentages, 1993-1998
0%
5%
10%
15%
20%
25%
30%
July Aug Sept Oct Nov Dec Jan Feb Mar Apr May June
Month
Per
cent
Trips Catch
Rivers between Klamath and Mad rivers (Loc. 7) Monthly Steelhead Angling Effort and
Monthly Wild & Hatchery Catch Percentages, 1999-2005
0%
5%
10%
15%
20%
25%
30%
35%
July Aug Sept Oct Nov Dec Jan Feb Mar Apr May June
Month
Perc
ent
Trips Wild Hatchery
C–5

Mad River Monthly Steelehead Angling Effort and Monthly Catch Percentages, 1993-1998
0%
5%
10%
15%
20%
25%
30%
July Aug Sept Oct Nov Dec Jan Feb Mar Apr May June
Month
Perc
ent
Trips Catch
Mad River Monthly Steelhead Angling Effort and Monthly Wild & Hatchery Catch Percentages, 1999-2005
0%
5%10%
15%
20%25%
30%
35%40%
45%
July Aug Sept Oct Nov Dec Jan Feb Mar Apr May June
Month
Perc
ent
Trips Wild Hatchery
C–6
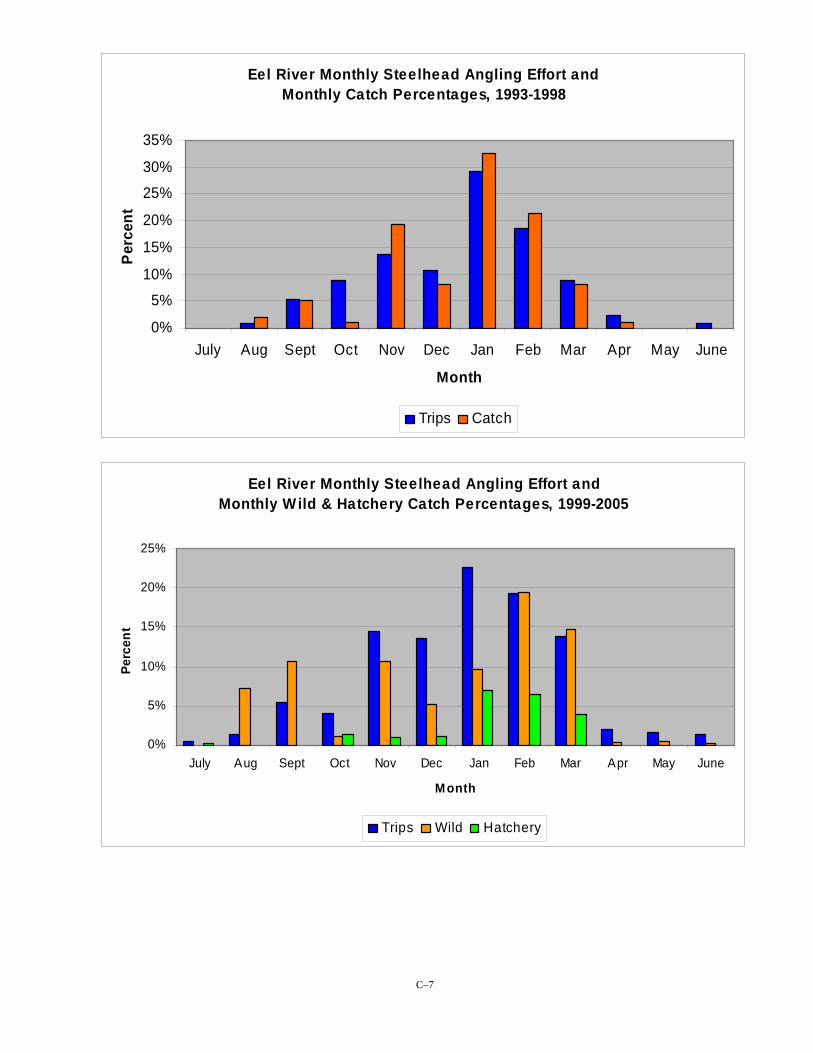
Eel River Monthly Steelhead Angling Effort and Monthly Catch Percentages, 1993-1998
0%
5%
10%
15%
20%
25%
30%
35%
July Aug Sept Oct Nov Dec Jan Feb Mar Apr May June
Month
Perc
ent
Trips Catch
Eel River Monthly Steelhead Angling Effort and Monthly Wild & Hatchery Catch Percentages, 1999-2005
0%
5%
10%
15%
20%
25%
July Aug Sept Oct Nov Dec Jan Feb Mar Apr May June
Month
Perc
ent
Trips Wild Hatchery
C–7
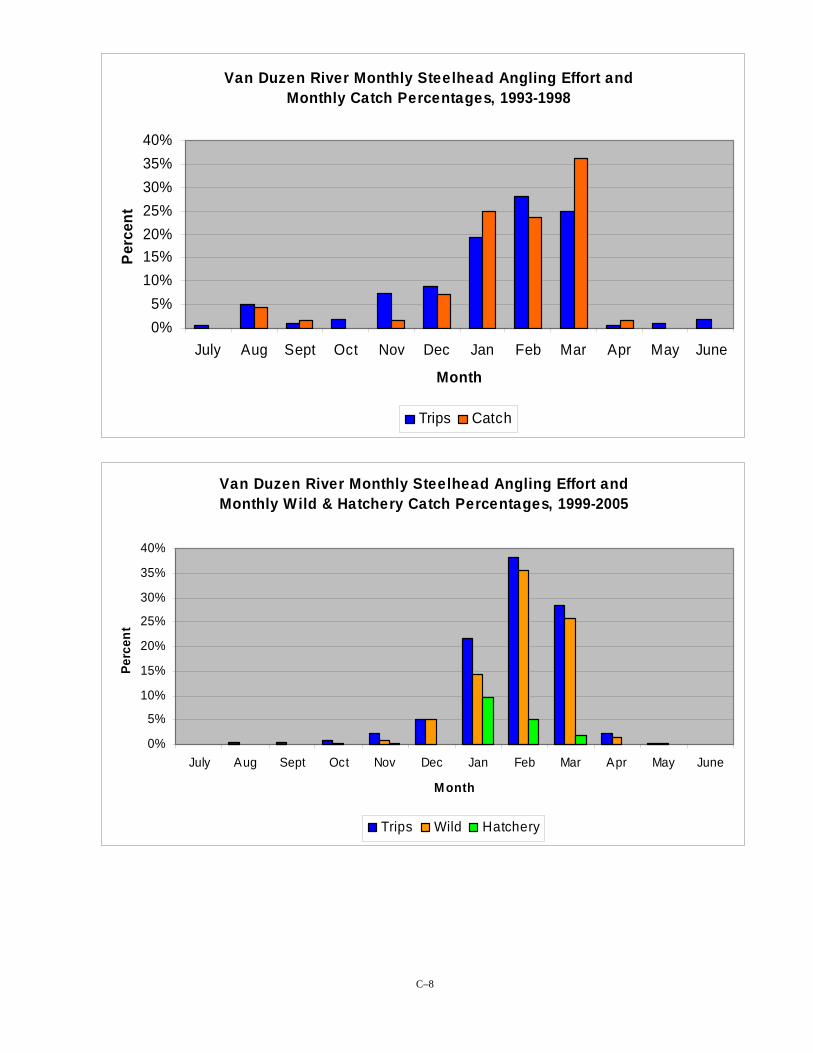
Van Duzen River Monthly Steelhead Angling Effort and Monthly Catch Percentages, 1993-1998
0%5%
10%15%20%25%30%35%40%
July Aug Sept Oct Nov Dec Jan Feb Mar Apr May June
Month
Perc
ent
Trips Catch
Van Duzen River Monthly Steelhead Angling Effort and Monthly Wild & Hatchery Catch Percentages, 1999-2005
0%
5%
10%
15%
20%
25%
30%
35%
40%
July Aug Sept Oct Nov Dec Jan Feb Mar Apr May June
Month
Perc
ent
Trips Wild Hatchery
C–8

SF Eel River Monthly Steelhead Angling Effort and Monthly Catch Percentages, 1993-1998
0%5%
10%15%20%25%30%35%40%45%
July Aug Sept Oct Nov Dec Jan Feb Mar Apr May June
Month
Perc
ent
Trips Catch
SF Eel River Monthly Steelhead Angling Effort and Monthly Wild & Hatchery Catch Percentages, 1999-2005
0%
5%
10%
15%
20%
25%
30%
35%
40%
July Aug Sept Oct Nov Dec Jan Feb Mar Apr May June
Month
Perc
ent
Trips Wild Hatchery
C–9
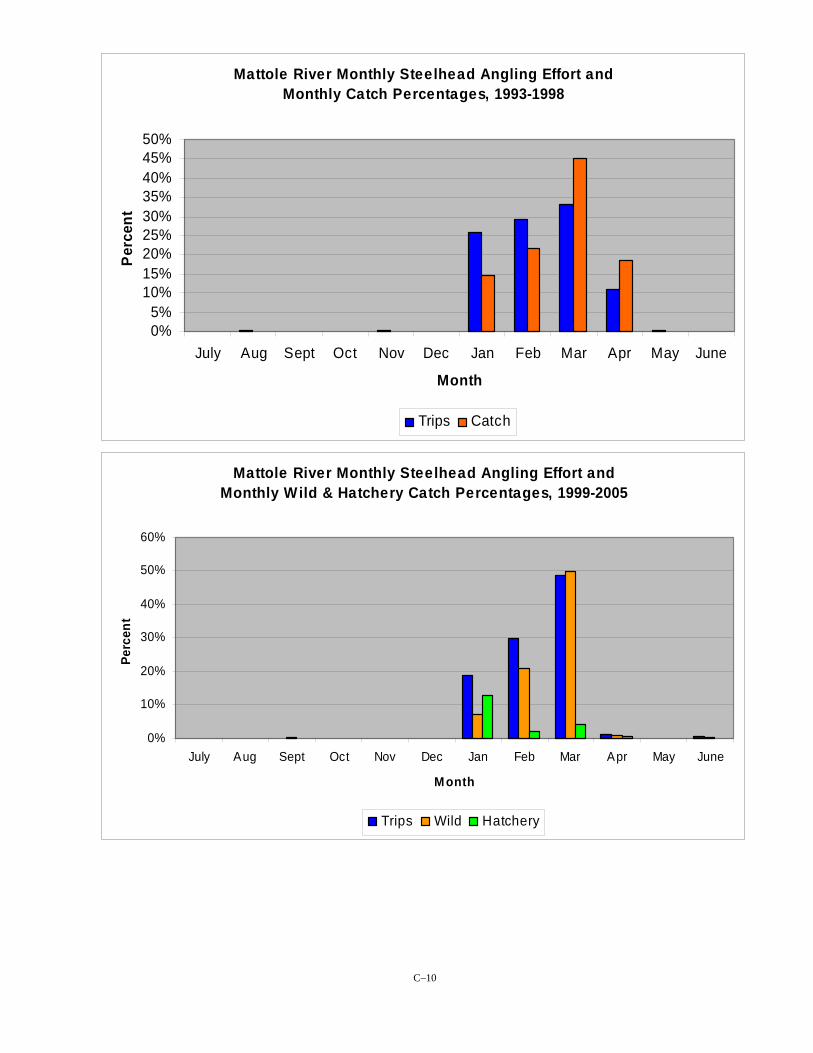
Mattole River Monthly Steelhead Angling Effort and Monthly Catch Percentages, 1993-1998
0%5%
10%15%20%25%30%35%40%45%50%
July Aug Sept Oct Nov Dec Jan Feb Mar Apr May June
Month
Per
cent
Trips Catch
Mattole River Monthly Steelhead Angling Effort andMonthly Wild & Hatchery Catch Percentages, 1999-2005
0%
10%
20%
30%
40%
50%
60%
July Aug Sept Oct Nov Dec Jan Feb Mar Apr May June
Month
Perc
ent
Trips Wild Hatchery
C–10

Noyo River Monthly Steelhead Angling Effort and Monthly Catch Percentages, 1993-1998
0%5%
10%15%20%25%30%35%40%45%50%
July Aug Sept Oct Nov Dec Jan Feb Mar Apr May June
Month
Perc
ent
Trips Catch
Noyo River Monthly Steelhead Angling Effort andMonthly Wild & Hatchery Catch Percentages, 1999-2005
0%
5%
10%
15%
20%
25%
30%
35%
40%
45%
July Aug Sept Oct Nov Dec Jan Feb Mar Apr May June
Month
Perc
ent
Trips Wild Hatchery
C–11

Navarro River M onthly Stee lhead Angling Effort and M onthly Catch Percentages, 1993-1998
0%
10%
20%
30%
40%
50%
July Aug Sept Oct Nov Dec Jan Feb Mar Apr May June
M onth
Perc
ent
Trips Catch
Navarro River Monthly Steelhead Angling Effort andMonthly Wild & Hatchery Catch Percentages, 1999-2005
0%5%
10%15%20%25%30%35%40%45%50%
July Aug Sept Oct Nov Dec Jan Feb Mar Apr May June
Month
Perc
ent
Trips Wild Hatchery
C–12

Rivers between Navarro and Gualala rivers (Loc. 20)M onthly Stee lhead Angling Effort and
M onthly Catch Percentages, 1993-1998
0%
10%
20%
30%
40%
50%
July Aug Sept Oct Nov Dec Jan Feb Mar Apr May June
M onth
Perc
ent
Trips Catch
Rivers between Navarro and Gualala rivers (Loc. 20) Monthly Steelhead Angling Effort and
Monthly Wild & Hatchery Catch Percentages, 1999-2005
0%
5%
10%
15%
20%
25%
30%
35%
July Aug Sept Oct Nov Dec Jan Feb Mar Apr May June
Month
Perc
ent
Trips Wild Hatchery
C–13

Gualala River Monthly Steelhead Angling Effort and Monthly Catch Percentages, 1993-1998
0%5%
10%15%20%25%30%35%40%45%
July Aug Sept Oct Nov Dec Jan Feb Mar Apr May June
Trips Catch
Gualala River Monthly Steelhead Angling Effort and Monthly Wild & Hatchery Catch Percentages, 1999-2005
0%
5%10%
15%
20%25%
30%
35%40%
45%
July Aug Sept Oct Nov Dec Jan Feb Mar Apr May June
Month
Perc
ent
Trips Wild Hatchery
C–14

Russian River Monthly Steelhead Angling Effort and Monthly Catch Percentages, 1993-1998
0%5%
10%15%20%25%30%35%40%45%
July Aug Sept Oct Nov Dec Jan Feb Mar Apr May June
Month
Perc
ent
Trips Catch
Russian River Monthly Steelhead Angling Effort and Monthly Wild & Hatchery Catch Percentages, 1999-2005
0%
5%
10%
15%
20%
25%
30%
35%
July Aug Sept Oct Nov Dec Jan Feb Mar Apr May June
Month
Perc
ent
Trips Wild Hatchery
C–15

Upper Sacramento River (Deschutes to Red Bluff, "26a") Monthly Steelhead Angling Effort and Monthly Catch Percentages, 1993-1998
0%
10%
20%
30%
40%
50%
60%
July Aug Sept Oct Nov Dec Jan Feb Mar Apr May June
Month
Per
cent
Trips Catch
Upper Sacramento River (Deschutes to Red Bluff, "26a") Monthly Steelhead Angling Effort and Monthly Wild & Hatchery Catch
Percentages, 1999-2005
0%
5%
10%
15%
20%
25%
30%
35%
July Aug Sept Oct Nov Dec Jan Feb Mar Apr May June
Month
Perc
ent
Trips Wild Hatchery
C–16

Mid-Upper Sacramento River (Red Bluff to Meridian, "26b") Monthly Steelhead Angling Effort and Monthly Catch Percentages, 1993-1998
0%5%
10%15%20%25%30%35%40%
July Aug Sept Oct Nov Dec Jan Feb Mar Apr May June
Month
Per
cent
Trips Catch
Mid-Upper Sacramento River (Red Bluff to Meridian, "26b") Monthly Steelhead Angling Effort and Monthly Wild & Hatchery Catch
Percentages, 1999-2005
0%
5%
10%
15%
20%
25%
July Aug Sept Oct Nov Dec Jan Feb Mar Apr May June
Month
Perc
ent
Trips Wild Hatchery
C–17

Mid-Lower Sacramento River (Meridian to Bus. 80, "26c") Monthly Steelhead Angling Effort and Monthly Catch Percentages, 1993-1998
0%
5%
10%
15%
20%
25%
30%
35%
July Aug Sept Oct Nov Dec Jan Feb Mar Apr May June
Month
Per
cent
Trips Catch
Mid-Lower Sacramento River (Meridian to Bus. 80, "26c") Monthly Steelhead Angling Effort and Monthly Wild & Hatchery Catch
Percentages, 1999-2005
0%
5%
10%
15%
20%
July Aug Sept Oct Nov Dec Jan Feb Mar Apr May June
Month
Perc
ent
Trips Wild Hatchery
C–18
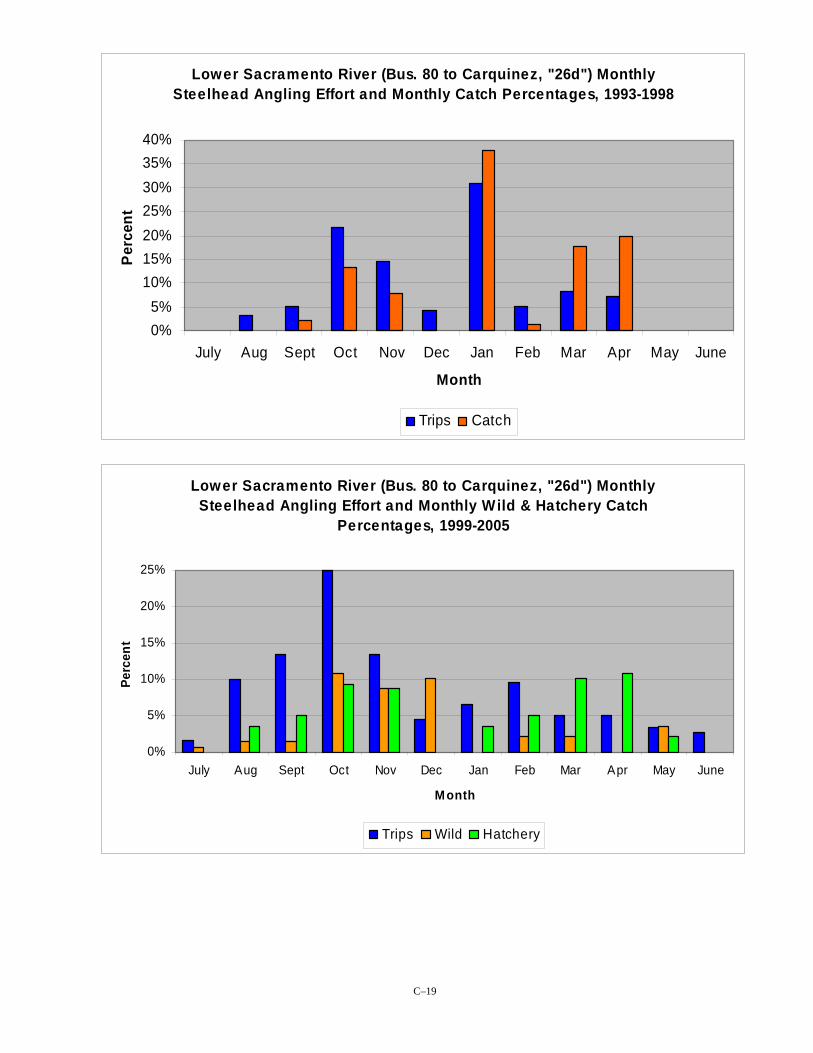
Lower Sacramento River (Bus. 80 to Carquinez, "26d") Monthly Steelhead Angling Effort and Monthly Catch Percentages, 1993-1998
0%5%
10%15%20%25%30%35%40%
July Aug Sept Oct Nov Dec Jan Feb Mar Apr May June
Month
Perc
ent
Trips Catch
Lower Sacramento River (Bus. 80 to Carquinez, "26d") Monthly Steelhead Angling Effort and Monthly Wild & Hatchery Catch
Percentages, 1999-2005
0%
5%
10%
15%
20%
25%
July Aug Sept Oct Nov Dec Jan Feb Mar Apr May June
Month
Perc
ent
Trips Wild Hatchery
C–19

Feather River Monthly Steelhead Angling Effort and Monthly Catch Percentages, 1993-1998
0%
5%
10%
15%
20%
25%
30%
35%
July Aug Sept Oct Nov Dec Jan Feb Mar Apr May June
Month
Per
cent
Trips Catch
Feather River Monthly Steelhead Angling Effort andMonthly Wild & Hatchery Catch Percentages, 1999-2005
0%
5%
10%
15%
20%
25%
July Aug Sept Oct Nov Dec Jan Feb Mar Apr May June
Month
Perc
ent
Trips Wild Hatchery
C–20

Yuba River Monthly Steelhead Angling Effort and Monthly Catch Percentages, 1993-1998
0%5%
10%15%20%25%30%35%40%45%
July Aug Sept Oct Nov Dec Jan Feb Mar Apr May June
Month
Perc
ent
Trips Catch
Yuba River Monthly Steelhead Angling Effort andMonthly Wild & Hatchery Catch Percentages, 1999-2005
0%
5%
10%
15%
20%
July Aug Sept Oct Nov Dec Jan Feb Mar Apr May June
Month
Perc
ent
Trips Wild Hatchery
C–21
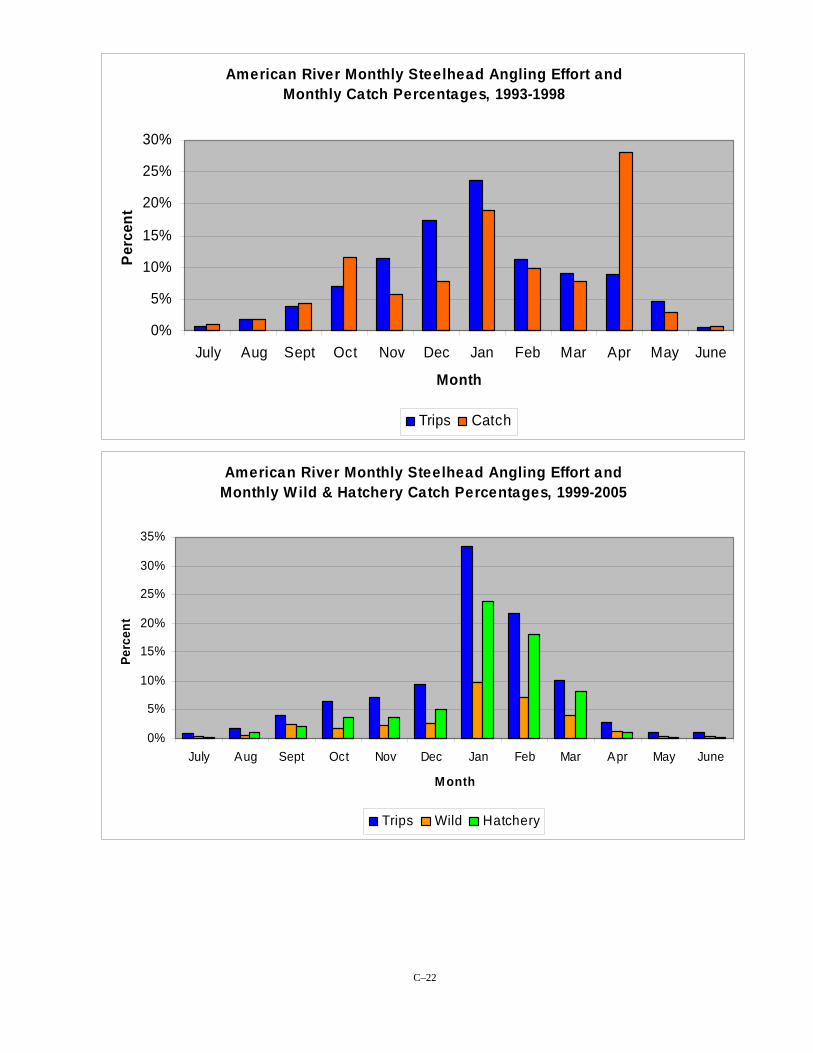
American River Monthly Steelhead Angling Effort and Monthly Catch Percentages, 1993-1998
0%
5%
10%
15%
20%
25%
30%
July Aug Sept Oct Nov Dec Jan Feb Mar Apr May June
Month
Perc
ent
Trips Catch
American River Monthly Steelhead Angling Effort and Monthly Wild & Hatchery Catch Percentages, 1999-2005
0%
5%
10%
15%
20%
25%
30%
35%
July Aug Sept Oct Nov Dec Jan Feb Mar Apr May June
Month
Perc
ent
Trips Wild Hatchery
C–22

San Joaquin River Drainage Monthly Steelhead Angling Effort and Monthly Catch percentages, 1993-1998
0%
5%
10%
15%
20%
25%
30%
35%
July Aug Sept Oct Nov Dec Jan Feb Mar Apr May June
Month
Perc
ent
Trips Catch
San Joaquin River Drainage Monthly Steelhead Angling Effort and Monthly Wild & Hatchery Catch Percentages, 1999-2005
0%
5%
10%
15%
20%
25%
30%
35%
July Aug Sept Oct Nov Dec Jan Feb Mar Apr May June
Month
Perc
ent
Trips Wild Hatchery
C–23

Merced River Monthly Steelhead Angling Effort andMonthly Wild & Hatchery Catch Percentages, 1999-2005
0%
10%
20%
30%
40%
50%
60%
July Aug Sept Oct Nov Dec Jan Feb Mar Apr May June
Month
Perc
ent
Trips Wild Hatchery
Tuolumne River Monthly Steelhead Angling Effort andMonthly Wild & Hatchery Catch Percentages, 1999-2005
0%5%
10%15%20%25%30%35%40%45%50%
July Aug Sept Oct Nov Dec Jan Feb Mar Apr May June
M onth
Perc
ent
Trips Wild Hatchery
C–24
Stanislaus River Monthly Steelhead Angling Effort andMonthly Wild & Hatchery Catch Percentages, 1999-2005
0%
5%
10%
15%
20%
25%
30%
July Aug Sept Oct Nov Dec Jan Feb Mar Apr May June
Month
Perc
ent
Trips Wild Hatchery
Mokelumne River Monthly Steelhead Angling Effort andMonthly Wild & Hatchery Catch Percentages, 1999-2005
0%
5%
10%
15%
20%
25%
30%
35%
40%
45%
July Aug Sept Oct Nov Dec Jan Feb Mar Apr May June
Month
Perc
ent
Trips Wild Hatchery
C–25

Rivers between Golden Gate and San Lorenzo River (Loc. 28)M onthly Stee lhead Angling Effort and
M onthly Catch Percentages, 1993-1998
0%5%
10%15%20%25%30%35%40%
July Aug Sept Oct Nov Dec Jan Feb Mar Apr May June
M onth
Perc
ent
Trips Catch
Rivers between Golden Gate and San Lorenzo River (Loc. 28) Monthly Steelhead Angling Effort and
Monthly Wild & Hatchery Catch Percentages, 1999-2005
0%
5%
10%
15%
20%
25%
30%
35%
40%
July Aug Sept Oct Nov Dec Jan Feb Mar Apr May June
Month
Perc
ent
Trips Wild Hatchery
C–26

San Lorenzo River Monthly Steelhead Angling Effort and Monthly Catch Percentages, 1993-1998
0%5%
10%15%20%25%30%35%40%
July Aug Sept Oct Nov Dec Jan Feb Mar Apr May June
Month
Perc
ent
Trips Catch
San Lorenzo River Monthly Steelhead Angling Effort and Monthly Wild & Hatchery Catch Percentages, 1999-2005
0%
5%
10%
15%
20%
25%
30%
35%
40%
July Aug Sept Oct Nov Dec Jan Feb Mar Apr May June
M onth
Perc
ent
Trips Wild Hatchery
C–27

Rivers So. of San Lorenzo R. to Salinas R., inclusive (Loc. 30)M onthly Stee lhead Angling Effort and
M onthly Catch Percentages, 1993-1998
0%
10%
20%
30%
40%
50%
July Aug Sept Oct Nov Dec Jan Feb Mar Apr May June
M onth
Perc
ent
Trips Catch
Rivers So. of San Lorenzo River to Salinas River, inclusive (Loc. 30) Monthly Steelhead Angling Effort and
Monthly Wild & Hatchery Catch Percentages, 1999-2005
0%
5%
10%
15%
20%
25%
30%
35%
40%
July Aug Sept Oct Nov Dec Jan Feb Mar Apr May June
M onth
Perc
ent
Trips Wild Hatchery
C–28

Carmel River M onthly Stee lhead Angling Effort and M onthly Catch Percentages, 1993-1998
0%
20%
40%
60%
80%
100%
July Aug Sept Oct Nov Dec Jan Feb Mar Apr May June
M onth
Perc
ent
Trips Catch
Carmel River Monthly Steelhead Angling Effort andMonthly Wild & Hatchery Catch Percentages, 1999-2005
0%
10%
20%
30%
40%
50%
60%
July Aug Sept Oct Nov Dec Jan Feb Mar Apr May June
M onth
Perc
ent
Trips Wild Hatchery
C–29

Rivers between Carmel R. to SLO Creek, inclusive (Loc. 32)M onthly Stee lhead Angling Effort and
M onthly Catch Percentages, 1993-1998
0%
10%
20%
30%
40%
50%
60%
July Aug Sept Oct Nov Dec Jan Feb Mar Apr May June
M onth
Perc
ent
Trips Catch
Rivers between Carmel R. to San Luis Obispo Cr., inclusive (Loc. 32) Monthly Steelhead Angling Effort and
Monthly Wild & Hatchery Catch Percentages, 1999-2005
0%5%
10%15%20%25%30%35%40%45%
July Aug Sept Oct Nov Dec Jan Feb Mar Apr May June
M onth
Perc
ent
Trips Wild Hatchery
C–30
Only 3 trips reported from 1993-1998: 1 in September, 2 in October, zero steelhead caught
Rivers between SLO Creek and Pt. Conception (Loc. 33) Monthly Steelhead Angling Effort and
Monthly Wild & Hatchery Catch Percentages, 1999-2005
0%
10%
20%
30%
40%
50%
60%
70%
July Aug Sept Oct Nov Dec Jan Feb Mar Apr May June
Month
Perc
ent
Trips Wild Hatchery
C–31

Ventura River (Loc. 35) M onthly Stee lhead Angling Effort and M onthly Catch Percentages, 1993-1998
0%10%
20%30%
40%
t
50%
60%70%
July Aug Sept Oct Nov Dec Jan Feb Mar Apr May June
M onth
Perc
en
Trips Catch
No Fishing on Ventura River 1999-2005: Southern steelhead listed Endangered under ESA
C–32


![Fishing and Hatcheries · Fall Chinook Spring Chinook Winter Steelhead Summer Steelhead Coho iddle Rogue/Applegate Hatcheries Above William Jess Da Cole ivers Hatche Skunk]Greens](https://static.fdocuments.in/doc/165x107/5f98aafb2a473200456716ee/fishing-and-hatcheries-fall-chinook-spring-chinook-winter-steelhead-summer-steelhead.jpg)