California Sea Otter (Enhydra lutris nereis) Census ... · California Sea Otter ... center in...
18
U.S. Department of the Interior U.S. Geological Survey Data Series 1067 California Sea Otter ( Enhydra lutris nereis ) Census Results, Spring 2017
Transcript of California Sea Otter (Enhydra lutris nereis) Census ... · California Sea Otter ... center in...

U.S. Department of the InteriorU.S. Geological Survey
Data Series 1067
California Sea Otter (Enhydra lutris nereis) Census Results, Spring 2017


California Sea Otter (Enhydra lutris nereis) Census Results, Spring 2017
By M. Tim Tinker and Brian B. Hatfield
Data Series 1067
U.S. Department of the InteriorU.S. Geological Survey
U.S. Department of the InteriorRYAN K. ZINKE, Secretary
U.S. Geological SurveyWilliam H. Werkheiser, Acting Director
U.S. Geological Survey, Reston, Virginia: 2017
For more information on the USGS—the Federal source for science about the Earth, its natural and living resources, natural hazards, and the environment—visit https://www.usgs.gov or call 1–888–ASK–USGS.
For an overview of USGS information products, including maps, imagery, and publications, visit https://store.usgs.gov.
Any use of trade, firm, or product names is for descriptive purposes only and does not imply endorsement by the U.S. Government.
Although this information product, for the most part, is in the public domain, it also may contain copyrighted materials as noted in the text. Permission to reproduce copyrighted items must be secured from the copyright owner.
Suggested citation:Tinker, M.T., and Hatfield, B.B., 2017, California sea otter (Enhydra lutris nereis) census results, spring 2017: U.S. Geological Survey Data Series 1067, 9 p., https://doi.org/10.3133/ds1067.
ISSN 2327-638X (online)

iii
Contents
Abstract ...........................................................................................................................................................1Introduction.....................................................................................................................................................1California Sea Otter Census Results ..........................................................................................................3
Range-Wide Summary .........................................................................................................................3Range-Wide Trends ..............................................................................................................................3Regional Trends .....................................................................................................................................3Geographic Distribution .......................................................................................................................9
Acknowledgments .........................................................................................................................................9References Cited............................................................................................................................................9
Figures
1. Map showing distribution of sea otters along the mainland coast of central California and at San Nicolas Island, 2017 ...............................................................................2
2. Graph showing trends in abundance of sea otters in California, based on 3-year running averages of raw counts ................................................................................................5
3. Graph showing regional trends in abundance of sea otters along the mainland coast of central California ...........................................................................................................6
4. Map showing variation in local population density of sea otters along the mainland coast, central California ..............................................................................................................7
5. Map showing local trends in abundance of sea otters along the mainland coast, central California ..........................................................................................................................8
Table
1. Summary of spring survey counts of sea otters in California, and 3-year averages,1990–2017 .....................................................................................................................4

iv
Conversion Factors
International System of Units to U.S. customary units
Multiply By To obtain
Lengthmeter (m) 3.281 foot (ft) meter (m) 1.094 yard (yd)kilometer (km) 0.6214 mile (mi)
DatumHorizontal coordinate information is referenced to the North American Datum of 1983 (NAD83).

California Sea Otter (Enhydra lutris nereis) Census Results, Spring 2017
By M. Tim Tinker and Brian B. Hatfield
AbstractThe 2017 census of southern sea otters (Enhydra lutris
nereis) was conducted between late April and early July along the mainland coast of central California and in April at San Nicolas Island in southern California. The 3-year average of combined counts from the mainland range and San Nicolas Island was 3,186, down by 86 sea otters from the previous year. This is the second year that the official index has exceeded 3,090, the Endangered Species Act delisting threshold identified in the U.S. Fish and Wildlife Service’s Southern Sea Otter Recovery Plan (the threshold would need to be exceeded for 3 consecutive years before delisting consideration). The 5-year average trend in abundance, including both the mainland range and San Nicolas Island populations, remains positive at 2.3 percent per year. Continuing lack of growth in the range peripheries likely explains the cessation of range expansion.
IntroductionA range-wide census is conducted each spring by the
U.S. Geological Survey, in partnership with the California Department of Fish and Wildlife and the Monterey Bay Aquarium, to monitor trends in abundance and distribution of the southern sea otter (Enhydra lutris nereis), and thus provide State and Federal resource agencies with the information they need for effective management. The standardized census has been completed annually since 1982 (with the exception of 2011, when weather conditions prevented survey completion),
using a combination of aerial and shore-based counts, and provides an uncorrected and exhaustive count of the entire range of the sea otter in coastal California. Shore-based counts are used in all areas accessible by ground-based observers, except in regions where otters are often located far off shore (such as shallow, sandy embayments) and are therefore more difficult to count reliably from the shore. In these areas, aerial surveys are flown along contiguous transects oriented parallel to the shore and covering all areas between the coastline and the 60-m depth contour. For this year’s survey, see Tinker and Hatfield (2017) for details of survey methods as well as data and metadata. Methods, data and metadata for previous years’ surveys are available at https://doi.org/10.5066/F7R2109J.
The spring 2017 mainland sea otter count began on April 30, and although the shore-based counts were completed by May 12, 2017, the aerial counts were not completed until July 12, 2017. Overall viewing conditions this year were good, although not as good as conditions experienced during the 2016 spring census (View Score 2.4 versus 3.1, where 0=poor, 1=fair, 2=good, 3=very good, and 4=excellent). The surface canopies of kelp (Macrocystis sp.) were considered by most participants to be considerably below normal for this time of year in most areas of the mainland range. Sea otters along the mainland coast were surveyed from Pillar Point in San Mateo County in the north to Rincon Point in the south at the Santa Barbara/Ventura County line (fig. 1). A separate ground-based survey of the sea otter population at San Nicolas Island was completed earlier in the spring (April 21–25) under good survey viewing conditions (View Score = 2.0). Surface kelp canopies at San Nicolas were also estimated to be considerably below the seasonal norm at the time of the survey.

2 California Sea Otter (Enhydra lutris nereis) Census Results, Spring 2017
sac16-4086_fig01
PACIFIC OCEAN
Seaside
Cayucos
Pt. Sur
Cambria
Monterey
Pigeon Pt.
Cape San Martin
Santa Cruz
Pismo Beach
Santa Barbara
San Francisco
San Simeon Pt.
Pt. Conception
San Nicolas Island
GaviotaState
Beach
Morro Bay
Monterey Bay
Half Moon Bay
Rincon Pt.
0 50 10025 KILOMETERS
0 50 10025 MILES
119°120°121°122°123°
38°
37°
36°
35°
34°
Base map from the California Dept Fish and Wildlife, Marine Region GIS department, California Coastline map California Teale Albers, datum is NAD83
EXPLANATION
Southern sea otter distribution
Current extent of established rangeOtters counted outside of range
1 (single) otter2 otters3 otters3–5 otters5–25 otters
CALIFORNIA
OREGON
NEVADA
IDA
HO
WASHINGTON
Area of map
Figure 1. Distribution of sea otters (Enhydra lutris nereis) along the mainland coast of central California and at San Nicolas Island, 2017.

California Sea Otter Census Results 3
California Sea Otter Census Results
Range-Wide Summary
The U.S. Fish and Wildlife Service’s Southern Sea Otter Recovery Plan (U.S. Fish and Wildlife Service, 2003) recommends using the 3-year running average of total counts as the official metric for monitoring trends, thereby reducing the influence of anomalously high or low counts from any particular year. The 3-year average of combined counts from the mainland range and San Nicolas Island therefore comprises the official index of abundance for southern sea otters, the current value of which is 3,186 (table 1). For southern sea otters to be considered for delisting under the Endangered Species Act, the index of abundance would have to exceed 3,090 for 3 consecutive years, according to the threshold established under the Southern Sea Otter Recovery Plan (U.S. Fish and Wildlife Service, 2003). Although this year’s range-wide index of abundance is 86 animals lower than last year’s value, this is the second consecutive year that it has exceeded the delisting threshold (fig. 2).
Range-Wide Trends
There is a considerable degree of uncertainty (random variation due to sampling and measurement error) in any 1 year’s count, and thus longer term trends are far more informative than year-to-year differences. We therefore report trends over the past 5 years, λ, calculated as the geometric mean of λ, the annual rate of change (annual λ values are computed by dividing the 3-year running average count by the equivalent value from the previous year, and thus λ = 1 indicates a constant population). The 3-year running average count of the mainland population is 3,104, which is down by almost 3 percent from the previous year’s value and reflects an unusually low 2017 annual raw count (table 1). This decrease in numbers is associated with a reduction in the 5-year trend for the mainland to 2.1 percent per year (λ =1.02, down from last year’s value of 1.03). Although the number of independent sea otters (juveniles and older) counted in the mainland range this year was markedly lower than last year, the number of pups observed resulted in an increase in the pup-to-independent ratio to 17.91 (table 1). The 3-year running average total count of the San Nicolas Island population is 82 (table 1), which continues a positive trend of approximately 10 percent per year (λ= 1.10; fig. 2). The overall 5-year trend for southern sea otters (including both mainland and San Nicolas Island populations) is 2.3 percent per year (λ = 1.02).
Regional Trends
Within the mainland range, regional trends in abundance can vary considerably. With the exception of the Monterey Peninsula area, the survey count in the center portion of the range, between Seaside and Cayucos (fig. 1), was markedly lower than last year’s high count (fig. 3), although the 5-year trend remains positive at 6.2 percent per year (λ = 1.06) in this area. There are multiple possible explanations for this year’s low count in the range center. Very sparse surface kelp canopies likely influenced sea otter distribution, possibly in a manner that negatively affected our ability to count them. Less favorable viewing conditions this year could also have influenced the census. Increased mortality can also not be ruled out: in particular, we previously hypothesized that a possible explanation for the high survey counts in the range center in 2015–16 was the dramatic increase in sea urchins (sea otter prey) that began after 2013, leading to improved juvenile survival (Tinker and Hatfield, 2016). This explanation was consistent with observations of more urchins in sea otter diets and a decrease in the pup ratio, suggesting more juveniles and subadults recruiting to the population. This year’s survey results show a return of raw counts and pup ratio to values similar to those for 2013, which could indicate reduced survivorship of these younger animals in the range center. Continued surveys will be required to determine whether this hypothesized explanation is supported.
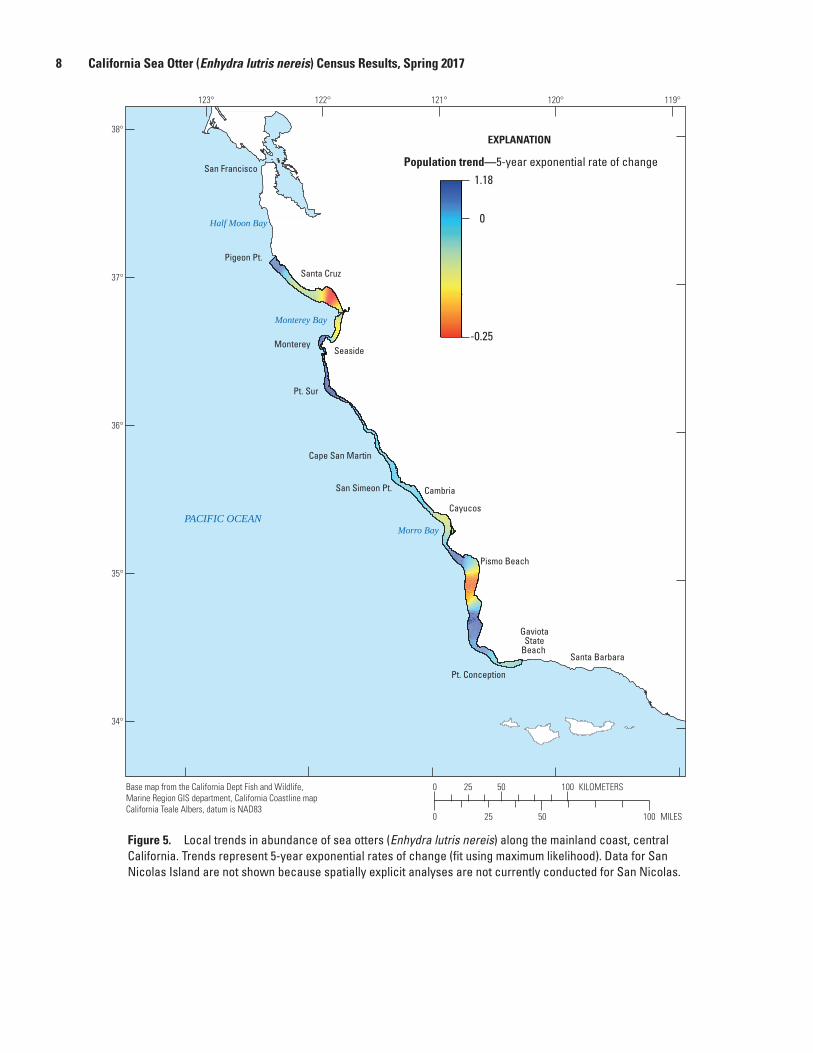
The patterns are somewhat different to the north and south of the central region, with a 5-year trend of approximately -5.5 percent per year (λ = 0.95) in the northern region and -3.4 percent per year (λ = 0.97) in the southern region (fig. 3). These continued localized declines are consistent with the elevated levels of shark bite mortality over the last 10 years in these peripheral areas of lower population density (fig. 4, Tinker and others, 2015; USGS unpublished data). The specific areas where the population trends are most negative (from Pigeon Point to north Monterey Bay, and from Cayucos to Point Conception; fig. 5) coincide with the areas of highest shark bite mortality (Tinker and others, 2015). The lack of population growth in these areas to the north and south of the central region continues to be of concern, as growth in these peripheral areas is required to drive future range expansion (Tinker and others, 2008; Lafferty and Tinker, 2014). While the 2017 range-wide 5-year trend remained positive, the 2018 spring count will be crucial for determining whether the dip in the count this year was an anomaly or the beginning of a longer term reduction in the rate of recovery.

4 California Sea Otter (Enhydra lutris nereis) Census Results, Spring 2017Ta
ble
1.
Sum
mar
y of
spr
ing
surv
ey c
ount
s of
sea
otte
rs (E
nhyd
ra lu
tris
nere
is) i
n Ca
lifor
nia,
and
3-y
ear a
vera
ges,
199
0–20
17.
[–, n
o da
ta]
Mai
nlan
d ra
nge
San
Nic
olas
Isla
ndRa
nge-
wid
e
Year
Inde
pend
ents
(r
aw c
ount
)Pu
ps
(raw
cou
nt)
Tota
l
(r
aw c
ount
)Pu
ps p
er 1
00
inde
pend
ents
Inde
pend
ents
(3
-yea
r av
erag
e)
Pups
(3
-yea
r av
erag
e)
Tot
al
(3-y
ear
aver
age)
Inde
pend
ents
(r
aw c
ount
)Pu
ps
(raw
cou
nt)
Tota
l
(raw
cou
nt)
Tot
al
(3-y
ear
aver
age)
Inde
x of
ab
unda
nce
1990
1,46
621
41,
680
14.6
01,
514
240
1,75
414
317
––
1991
1,70
024
11,
941
14.1
81,
579
247
1,82
614
216
––
1992
1,81
029
12,
101
16.0
81,
659
249
1,90
710
212
15–
1993
2,02
221
72,
239
10.7
31,
844
250
2,09
47
411
13–
1994
2,07
628
32,
359
13.6
31,
969
264
2,23
310
414
12–
1995
2,09
528
22,
377
13.4
62,
064
261
2,32
59
413
13–
1996
1,96
331
52,
278
16.0
52,
045
293
2,33
812
416
14–
1997
1,91
931
02,
229
16.1
51,
992
302
2,29
516
016
15–
1998
1,95
515
92,
114
8.13
1,94
626
12,
207
122
1415
–19
991,
858
232
2,09
012
.50
1,91
123
42,
144
183
2117
–20
002,
053
264
2,31
712
.90
1,95
521
82,
174
212
2319
–20
011,
863
298
2,16
116
.00
1,92
526
52,
189
215
2623
–20
021,
846
293
2,13
915
.90
1,92
128
52,
206
225
2725
–20
032,
270
235
2,50
510
.40
1,99
327
52,
268
335
3830
–20
042,
495
330
2,82
513
.20
2,20
428
62,
490
274
3132
–20
052,
417
318
2,73
513
.20
2,39
429
42,
688
223
2531
–20
062,
369
323
2,69
213
.60
2,42
732
42,
751
365
4132
–20
072,
637
389
3,02
614
.80
2,47
434
32,
818
264
3032
–20
082,
434
326
2,76
013
.40
2,48
034
62,
826
223
2532
–20
092,
263
391
2,65
417
.28
2,44
536
92,
813
276
3329
–20
102,
452
267
2,71
910
.90
2,38
332
82,
711
387
4534
–20
11–
––
––
––
446
5043
–20
122,
486
379
2,86
515
.25
2,46
932
32,
792
4810
5851
–20
132,
444
455
2,89
918
.62
2,46
541
72,
882
548
6257
2,93
920
142,
410
469
2,87
919
.46
2,44
743
42,
881
599
6863
2,94
420
152,
688
505
3,19
318
.79
2,51
447
62,
990
547
6164
3,05
420
163,
078
433
3,51
114
.07
2,72
546
93,
194
9212
104
783,
272
2017
2,21
139
62,
607
17.9
12,
659
445
3,10
472
981
823,
186
5-ye
ar g
eom
etri
c m
ean
annu
al g
row
th r
ate
(% c
hang
e):
Mai
nlan
d: 2
.14
|
San
Nic
olas
: 9.9
6
| C
ombi
ned:
2.3
0

California Sea Otter Census Results 5
sac16-4086_fig02
0
10
20
30
40
50
60
70
80
90
100
0
300
600
900
1,200
1,500
1,800
2,100
2,400
2,700
3,000
3,300
1990 1995 2000 2005 2010 2015
Num
ber o
f otte
rs (3
-yea
r ave
rage
cou
nt),
San
Nic
olas
Isla
nd
Num
ber o
f otte
rs (3
-yea
r ave
rage
cou
nt),
mai
nlan
d / r
ange
wid
e
Year
EXPLANATION
Delisting criteria
Mainland population
Mainland independents
San Nicolas population
San Nicolas independents
Total population
Figure 2. Trends in abundance of sea otters (Enhydra lutris nereis) in California, based on 3-year running averages of raw counts. Data are shown for all otters and independents (non-pups) for the mainland range (left axis), San Nicolas Island (right axis), and for the entire range after 2012 (left axis), when counts were combined to create an official index of abundance.

6 California Sea Otter (Enhydra lutris nereis) Census Results, Spring 2017
sac16-4086_fig03
0
500
1,000
1,500
2,000
2,500
1982 1987 1992 1997 2002 2007 2012 2017
Num
ber o
f otte
rs c
ount
ed
Year
North (Pigeon Pt – Seaside)
Central (Seaside – Cayucos)
South (Cayucos – Gaviota)
EXPLANATION
Figure 3. Regional trends in abundance of sea otters (Enhydra lutris nereis) along the mainland coast of central California. Raw counts and 3-year running averages (dashed lines) are plotted for the north, central, and southern regions. The most recent 5-year average trend (calculated as the geometric mean annual rate of change) is shown as a solid line at the end of each time series.

California Sea Otter Census Results 7
sac16-4086_fig04
PACIFIC OCEAN
Seaside
Cayucos
Pt. Sur
Cambria
Monterey
Pigeon Pt.
Cape San Martin
Santa Cruz
Pismo Beach
Santa Barbara
San Francisco
San Simeon Pt.
Pt. Conception
GaviotaState
Beach
Morro Bay
Monterey Bay
Half Moon Bay
0 50 10025 KILOMETERS
0 50 10025 MILES
119°120°121°122°123°
38°
37°
36°
35°
34°
Base map from the California Dept Fish and Wildlife, Marine Region GIS department, California Coastline map California Teale Albers, datum is NAD83
EXPLANATION
Sea otter density—Otters per 500 meters of coast12
6
0
CALIFORNIA
OREGON
NEVADA
IDA
HO
WASHINGTON
Area of map
Figure 4. Variation in local population density (number of sea otters per 500 meters of coast) of sea otters (Enhydra lutris nereis) along the mainland coast, central California. Data for San Nicolas Island are not shown because spatially explicit analyses are not currently conducted for San Nicolas.
8 California Sea Otter (Enhydra lutris nereis) Census Results, Spring 2017
sac16-4086_fig05
PACIFIC OCEAN
PACIFIC OCEAN
Seaside
Cayucos
Pt. Sur
Cambria
Monterey
Morro Bay
Pigeon Pt.
Cape San Martin
Santa Cruz
Pismo Beach
Monterey Bay
Santa Barbara
San Francisco
Half Moon Bay
GaviotaState
Beach
San Simeon Pt.
Pt. Conception
0 50 10025 KILOMETERS
0 50 10025 MILES
119°120°121°122°123°
38°
37°
36°
35°
34°
Base map from the California Dept Fish and Wildlife, Marine Region GIS department, California Coastline map California Teale Albers, datum is NAD83
EXPLANATION
Population trend—5-year exponential rate of change1.18
0
-0.25
Figure 5. Local trends in abundance of sea otters (Enhydra lutris nereis) along the mainland coast, central California. Trends represent 5-year exponential rates of change (fit using maximum likelihood). Data for San Nicolas Island are not shown because spatially explicit analyses are not currently conducted for San Nicolas.

References Cited 9
Geographic Distribution
The northernmost sea otters detected in this year’s mainland survey were near Point Año Nuevo. At the southern end of the mainland range, 62 sea otters were counted southeast of Point Conception, 10 fewer than were counted during the spring 2016 census. Five sea otters were counted this year southeast of Gaviota State Beach (four more than last spring), with the farthest east individual being seen near Coal Oil Point off the UC Santa Barbara campus. The northern limit of the sea otter’s range along the mainland coast remains unchanged from 2016: the northern boundary is considered to be approximately 2.5 km southeast of Pigeon Pt. The southern limit of the range was also unchanged from 2016 and is 7 km west of Gaviota State Beach (fig. 1). The mainland range limits are defined as the points farthest from the range center (to the north and south) at which five or more otters are counted within a 10 km contiguous stretch of coastline (as measured along the 10 m bathymetric contour) during the two most recent spring censuses, or at which these same criteria were met in the previous year.
Additional data summaries and GIS data for this year’s survey, as well as detailed methods and metadata, are available in Tinker and Hatfield (2017).
AcknowledgmentsThe annual census is a cooperative effort between
USGS-Western Ecological Research Center, California Department of Fish and Wildlife–Marine Wildlife Veterinary Care and Research Center, Monterey Bay Aquarium, University of California-Santa Cruz, the U.S. Fish and Wildlife Service, and many experienced and dedicated volunteers. Assistance was also received from staff of the Bureau of Ocean Energy Management.
References Cited
Lafferty, K.D., and Tinker, M.T., 2014, Sea otters are recolonizing southern California in fits and starts: Ecosphere (Ecological Society of America), doi: 10.1890/ES13-00394.1.
Tinker, M.T., Doak, D.F., and Estes, J.A., 2008, Using demography and movement behavior to predict range expansion of the southern sea otter: Ecological Applications, v. 18, no. 7, p. 1,781–1,794.
Tinker, M.T., and Hatfield, B.B., 2016, California sea otter (Enhydra lutris nereis) census results, spring 2016: U.S. Geological Survey Data Series 1018, 10 p., https://doi.org/10.3133/ds1018.
Tinker, M.T., and Hatfield, B.B., 2017, Annual California sea otter census—2017 spring census summary: U.S. Geological Survey data release, https://doi.org/10.5066/F7R2109J.
Tinker, M.T., Hatfield, B.B., Harris, M.D., and Ames, J.A., 2015, Dramatic increase in sea otter mortality from white sharks in California: Marine Mammal Science, v. 32, no. 1, p. 309–326, doi:10.1111/mms.12261.
U.S. Fish and Wildlife Service, 2003, Final revised recovery plan for the southern sea otter (Enhydra lutris nereis): U.S. Fish and Wildlife Service, Region 1, Portland Oregon, 58 p., accessed August 8, 2016, at https://www.fws.gov/ventura/docs/species/sso/recoveryPlan/ssorecplan.pdf.


Publishing support provided by the U.S. Geological SurveyScience Publishing Network, Tacoma Publishing Service Center
For more information concerning the research in this report, contact theDirector, Western Ecological Research CenterU.S. Geological Survey3020 State University DriveModoc Hall, Room 4004Sacramento, California 95819https://www.werc.usgs.gov/

Tinker and Hatfield—California Sea O
tter (Enhydra lutris nereis) Census Results, Spring 2017—Data Series 1067
ISSN 2327-638X (online)https://doi.org/10.3133/ds1067