California: Revised water targets
26
DRAFT Urban Water Supplier Conservation Standard for Extended Emergency Regulation Rulemaking - 2016 Supplier Conservation Standards Adelanto City of 20% 16% Alameda County Water District 16% 16% Alco Water Service 24% 24% Alhambra City of 24% 24% Amador Water Agency 24% 21% American Canyon, City of 20% 16% Anaheim City of 20% 20% Anderson, City of 36% 33% Antioch City of 28% 28% Apple Valley Ranchos Water Company 28% 24% Arcadia City of 36% 36% Arcata City of 4% 4% Arroyo Grande City of 28% 28% Arvin Community Services District 28% 21% Atascadero Mutual Water Company 28% 28% Atwater City of 36% 33% Azusa City of 20% 20% Bakersfield City of 36% 33% Bakman Water Company 36% 34% Banning City of 32% 28% Beaumont-Cherry Valley Water District 36% 36% Bella Vista Water District 36% 33% Bellflower-Somerset Mutual Water Company 20% 20% Benicia City of 20% 20% Beverly Hills City of 32% 32% Big Bear City Community Services District 16% 13% Blythe City of 32% 28% Brawley City of 32% 24% Brea City of 24% 24% Brentwood City of 32% 29% Buena Park City of 20% 20% Burbank City of 24% 24% Burlingame City of 16% 16% Calaveras County Water District 16% 13% Calexico City of 20% 16% California City City of 36% 28% California Water Service Company Antelope Valley 36% 33% California Water Service Company Bakersfield 32% 29% California Water Service Company Bear Gulch 36% 36% California Water Service Company Chico District 32% 30% California Water Service Company Dixon, City of 28% 25% California Water Service Company Dominguez 16% 16% Supplier Name Original Conservation Standard (Released 7/17/15) DRAFT Adjusted Conservation Standard 1 1 Based on REVISED R-GPCD (as reported by 1/1/16) and Climate Adjustment For more information see Adjustments to Supplier Conservation Standards table (page 11) Last Updated January 25, 2016 Page 1 of 26
-
Upload
bayareanewsgroup -
Category
Documents
-
view
6 -
download
0
description
How each city will be affected by changes to the state water conservation rules
Transcript of California: Revised water targets

DRAFT Urban Water Supplier Conservation Standard for Extended Emergency Regulation Rulemaking - 2016
Supplier Conservation Standards
Adelanto City of 20% 16%
Alameda County Water District 16% 16%
Alco Water Service 24% 24%
Alhambra City of 24% 24%
Amador Water Agency 24% 21%
American Canyon, City of 20% 16%
Anaheim City of 20% 20%
Anderson, City of 36% 33%
Antioch City of 28% 28%
Apple Valley Ranchos Water Company 28% 24%
Arcadia City of 36% 36%
Arcata City of 4% 4%
Arroyo Grande City of 28% 28%
Arvin Community Services District 28% 21%
Atascadero Mutual Water Company 28% 28%
Atwater City of 36% 33%
Azusa City of 20% 20%
Bakersfield City of 36% 33%
Bakman Water Company 36% 34%
Banning City of 32% 28%
Beaumont-Cherry Valley Water District 36% 36%
Bella Vista Water District 36% 33%
Bellflower-Somerset Mutual Water Company 20% 20%
Benicia City of 20% 20%
Beverly Hills City of 32% 32%
Big Bear City Community Services District 16% 13%
Blythe City of 32% 28%
Brawley City of 32% 24%
Brea City of 24% 24%
Brentwood City of 32% 29%
Buena Park City of 20% 20%
Burbank City of 24% 24%
Burlingame City of 16% 16%
Calaveras County Water District 16% 13%
Calexico City of 20% 16%
California City City of 36% 28%
California Water Service Company Antelope Valley 36% 33%
California Water Service Company Bakersfield 32% 29%
California Water Service Company Bear Gulch 36% 36%
California Water Service Company Chico District 32% 30%
California Water Service Company Dixon, City of 28% 25%
California Water Service Company Dominguez 16% 16%
Supplier Name
Original Conservation
Standard(Released 7/17/15)
DRAFT
Adjusted Conservation
Standard1
1 Based on REVISED R-GPCD (as reported by 1/1/16) and Climate Adjustment
For more information see Adjustments to Supplier Conservation Standards table (page 11)
Last Updated January 25, 2016 Page 1 of 26

DRAFT Urban Water Supplier Conservation Standard for Extended Emergency Regulation Rulemaking - 2016
Supplier Conservation Standards
Supplier Name
Original Conservation
Standard(Released 7/17/15)
DRAFT
Adjusted Conservation
Standard1
California Water Service Company East Los Angeles 8% 8%
California Water Service Company Hermosa/Redondo 20% 20%
California Water Service Company Kern River Valley 28% 25%
California Water Service Company King City 12% 10%
California Water Service Company Livermore 24% 21%
California Water Service Company Los Altos/Suburban 32% 32%
California Water Service Company Marysville 24% 21%
California Water Service Company Mid Peninsula 16% 16%
California Water Service Company Oroville 28% 26%
California Water Service Company Palos Verdes 36% 36%
California Water Service Company Redwood Valley 16% 16%
California Water Service Company Salinas District 16% 16%
California Water Service Company Selma 32% 30%
California Water Service Company South San Francisco 8% 8%
California Water Service Company Stockton 20% 18%
California Water Service Company Visalia 32% 30%
California Water Service Company Westlake 36% 36%
California Water Service Company Willows 28% 26%
California-American Water Company Los Angeles District 28% 28%
California-American Water Company Monterey District 8% 8%
California-American Water Company Sacramento District 20% 17%
California-American Water Company San Diego District 8% 8%
California-American Water Ventura District 32% 32%
Camarillo City of 20% 20%
Cambria Community Services District 8% 8%
Camrosa Water District 32% 32%
Carlsbad Municipal Water District 28% 28%
Carmichael Water District 36% 33%
Carpinteria Valley Water District 20% 20%
Casitas Municipal Water District 32% 32%
Castaic Lake Water Agency Santa Clarita Water Division 32% 29%
Ceres City of 28% 26%
Cerritos City of 28% 28%
Chino City of 24% 24%
Chino Hills City of 28% 28%
Citrus Heights Water District 32% 29%
City of Big Bear Lake, Dept of Water & Power 16% 13%
City of Newman Water Department 24% 21%
Clovis City of 36% 34%
Coachella City of 24% 20%
Coachella Valley Water District 36% 32%
Coalinga City of 32% 30%
1 Based on REVISED R-GPCD (as reported by 1/1/16) and Climate Adjustment
For more information see Adjustments to Supplier Conservation Standards table (page 11)
Last Updated January 25, 2016 Page 2 of 26

DRAFT Urban Water Supplier Conservation Standard for Extended Emergency Regulation Rulemaking - 2016
Supplier Conservation Standards
Supplier Name
Original Conservation
Standard(Released 7/17/15)
DRAFT
Adjusted Conservation
Standard1
Coastside County Water District 8% 8%
Colton, City of 20% 20%
Compton City of 8% 8%
Contra Costa Water District 28% 25%
Corcoran, City of 36% 32%
Corona City of 28% 28%
Covina City of 28% 28%
Crescent City City of 16% 16%
Crescenta Valley Water District 20% 20%
Crestline Village Water District 8% 8%
Cucamonga Valley Water District 32% 32%
Daly City City of 8% 8%
Davis City of 28% 25%
Del Oro Water Company 24% 21%
Delano City of 24% 21%
Desert Water Agency 36% 32%
Diablo Water District 28% 25%
Dinuba City of 32% 32%
Discovery Bay Community Services District 32% 29%
Downey City of 20% 20%
Dublin San Ramon Services District 12% 12%
East Bay Municipal Utilities District 16% 16%
East Niles Community Service District 36% 33%
East Orange County Water District 36% 36%
East Palo Alto, City of 8% 8%
East Valley Water District 28% 28%
Eastern Municipal Water District 28% 28%
El Centro City of 24% 20%
El Dorado Irrigation District 28% 25%
El Monte City of 8% 8%
El Segundo City of 20% 20%
El Toro Water District 24% 24%
Elk Grove Water Service 28% 25%
Elsinore Valley Municipal Water District 28% 28%
Escondido City of 20% 20%
Estero Municipal Improvement District 12% 12%
Eureka City of 4% 4%
Exeter City of 36% 34%
Fair Oaks Water District 36% 33%
Fairfield City of 20% 20%
Fallbrook Public Utility District 36% 36%
Fillmore City of 28% 28%
1 Based on REVISED R-GPCD (as reported by 1/1/16) and Climate Adjustment
For more information see Adjustments to Supplier Conservation Standards table (page 11)
Last Updated January 25, 2016 Page 3 of 26

DRAFT Urban Water Supplier Conservation Standard for Extended Emergency Regulation Rulemaking - 2016
Supplier Conservation Standards
Supplier Name
Original Conservation
Standard(Released 7/17/15)
DRAFT
Adjusted Conservation
Standard1
Folsom City of 32% 29%
Fortuna City of 24% 20%
Fountain Valley City of 20% 20%
Fresno City of 28% 26%
Fruitridge Vista Water Company 36% 29%
Fullerton City of 28% 28%
Galt City of 32% 29%
Garden Grove City of 20% 20%
Georgetown Divide Public Utilities District 32% 29%
Gilroy City of 24% 24%
Glendale City of 20% 20%
Glendora City of 36% 36%
Golden State Water Company Artesia 16% 16%
Golden State Water Company Barstow 24% 20%
Golden State Water Company Bay Point 12% 12%
Golden State Water Company Bell-Bell Gardens 8% 8%
Golden State Water Company Claremont 32% 32%
Golden State Water Company Cordova 36% 33%
Golden State Water Company Cowan Heights 36% 36%
Golden State Water Company Culver City 16% 16%
Golden State Water Company Florence Graham 8% 8%
Golden State Water Company Norwalk 12% 12%
Golden State Water Company Orcutt 32% 32%
Golden State Water Company Placentia 24% 24%
Golden State Water Company S Arcadia 24% 24%
Golden State Water Company S San Gabriel 12% 12%
Golden State Water Company San Dimas 28% 28%
Golden State Water Company Simi Valley 24% 24%
Golden State Water Company Southwest 12% 12%
Golden State Water Company West Orange 16% 16%
Goleta Water District 12% 12%
Great Oaks Water Company Incorporated 20% 20%
Greenfield, City of 16% 16%
Groveland Community Services District 24% 21%
Grover Beach City of 8% 8%
Hanford City of 28% 24%
Hawthorne City of 16% 16%
Hayward City of 8% 8%
Healdsburg City of 24% 24%
Helix Water District 20% 20%
Hemet City of 32% 16%
Hesperia Water District City of 32% 28%
1 Based on REVISED R-GPCD (as reported by 1/1/16) and Climate Adjustment
For more information see Adjustments to Supplier Conservation Standards table (page 11)
Last Updated January 25, 2016 Page 4 of 26

DRAFT Urban Water Supplier Conservation Standard for Extended Emergency Regulation Rulemaking - 2016
Supplier Conservation Standards
Supplier Name
Original Conservation
Standard(Released 7/17/15)
DRAFT
Adjusted Conservation
Standard1
Hi-Desert Water District 16% 13%
Hillsborough Town of 36% 36%
Hollister City of 20% 20%
Humboldt Bay Municipal Water District 4% 4%
Humboldt Community Service District 24% 12%
Huntington Beach City of 20% 20%
Huntington Park City of 8% 8%
Imperial, City of 24% 20%
Indian Wells Valley Water District 36% 32%
Indio City of 32% 28%
Inglewood City of 12% 12%
Irvine Ranch Water District 16% 16%
Joshua Basin Water District 28% 20%
Jurupa Community Service District 28% 28%
Kerman, City of 32% 29%
Kingsburg, City of 36% 34%
La Habra City of Public Works 28% 28%
La Palma City of 20% 20%
La Verne City of 32% 32%
Laguna Beach County Water District 24% 24%
Lake Arrowhead Community Services District 16% 13%
Lake Hemet Municipal Water District 28% 28%
Lakeside Water District 20% 20%
Lakewood City of 20% 20%
Lamont Public Utility District 28% 25%
Las Virgenes Municipal Water District 36% 36%
Lathrop, City of 20% 18%
Lee Lake Water District 32% 32%
Lemoore City of 32% 28%
Lincoln City of 32% 29%
Lincoln Avenue Water Company 28% 28%
Linda County Water District 32% 29%
Livermore City of Division of Water Resources 20% 17%
Livingston City of 32% 29%
Lodi City of Public Works Department 32% 30%
Loma Linda City of * 32% 32%
Lomita City of 20% 20%
Lompoc City of 12% 12%
Long Beach City of 16% 12%
Los Angeles County Public Works Waterworks District 29 36% 36%
Los Angeles County Public Works Waterworks District 40 32% 28%
Los Angeles Department of Water and Power 16% 16%
1 Based on REVISED R-GPCD (as reported by 1/1/16) and Climate Adjustment
For more information see Adjustments to Supplier Conservation Standards table (page 11)
Last Updated January 25, 2016 Page 5 of 26

DRAFT Urban Water Supplier Conservation Standard for Extended Emergency Regulation Rulemaking - 2016
Supplier Conservation Standards
Supplier Name
Original Conservation
Standard(Released 7/17/15)
DRAFT
Adjusted Conservation
Standard1
Los Banos, City of 28% 25%
Lynwood City of 16% 16%
Madera City of 28% 26%
Madera County 36% 34%
Mammoth Community Water District 20% 17%
Manhattan Beach City of 20% 20%
Manteca City of 32% 30%
Marin Municipal Water District 20% 20%
Marina Coast Water District 12% 12%
Martinez City of 20% 20%
McKinleyville Community Service District 4% 4%
Menlo Park City of 16% 16%
Merced City of 36% 34%
Mesa Water District 20% 20%
Mid-Peninsula Water District 20% 20%
Millbrae City of 16% 16%
Milpitas City of 12% 12%
Mission Springs Water District 28% 28%
Modesto, City of 36% 34%
Monrovia City of 28% 28%
Monte Vista Water District 24% 24%
Montebello Land and Water Company 16% 16%
Montecito Water District 32% 32%
Monterey Park City of 20% 20%
Morgan Hill City of 28% 28%
Morro Bay City of 12% 12%
Moulton Niguel Water District 20% 20%
Mountain House Community Services District 25% 25%
Mountain View City of 16% 16%
Myoma Dunes Mutual Water Company 36% 32%
Napa City of 20% 20%
Nevada Irrigation District 36% 33%
Newhall County Water District 28% 25%
Newport Beach City of 28% 28%
Nipomo Community Services District 28% 28%
Norco City of 36% 36%
North Coast County Water District 8% 8%
North Marin Water District 24% 24%
North Tahoe Public Utility District 28% 25%
Norwalk City of 20% 20%
Oakdale City of 32% 30%
Oceanside City of 20% 20%
1 Based on REVISED R-GPCD (as reported by 1/1/16) and Climate Adjustment
For more information see Adjustments to Supplier Conservation Standards table (page 11)
Last Updated January 25, 2016 Page 6 of 26

DRAFT Urban Water Supplier Conservation Standard for Extended Emergency Regulation Rulemaking - 2016
Supplier Conservation Standards
Supplier Name
Original Conservation
Standard(Released 7/17/15)
DRAFT
Adjusted Conservation
Standard1
Oildale Mutual Water Company 36% 33%
Olivehurst Public Utility District 36% 33%
Olivenhain Municipal Water District 32% 32%
Ontario City of 24% 24%
Orange City of 28% 28%
Orange Vale Water Company 36% 33%
Orchard Dale Water District 12% 12%
Otay Water District 20% 20%
Oxnard City of 12% 12%
Padre Dam Municipal Water District 20% 20%
Palmdale Water District 32% 28%
Palo Alto City of 24% 24%
Paradise Irrigation District 36% 33%
Paramount City of 12% 12%
Park Water Company 8% 8%
Pasadena City of 28% 28%
Paso Robles City of 28% 24%
Patterson City of 28% 25%
Perris, City of 24% 24%
Petaluma City of 16% 16%
Phelan Pinon Hills Community Services District 32% 28%
Pico Rivera City of 16% 16%
Pico Water District 24% 24%
Pinedale County Water District 36% 26%
Pismo Beach City of 24% 24%
Pittsburg City of 20% 20%
Placer County Water Agency 32% 29%
Pleasanton City of 24% 24%
Pomona City of 20% 20%
Port Hueneme City of 8% 8%
Porterville City of 32% 26%
Poway City of 32% 32%
Quartz Hill Water District 36% 32%
Rainbow Municipal Water District 36% 36%
Ramona Municipal Water District 28% 28%
Rancho California Water District 36% 36%
Red Bluff City of 36% 33%
Redding City of 36% 33%
Redlands City of 36% 36%
Redwood City City of 8% 8%
Reedley City of 24% 22%
Rialto City of 28% 28%
1 Based on REVISED R-GPCD (as reported by 1/1/16) and Climate Adjustment
For more information see Adjustments to Supplier Conservation Standards table (page 11)
Last Updated January 25, 2016 Page 7 of 26

DRAFT Urban Water Supplier Conservation Standard for Extended Emergency Regulation Rulemaking - 2016
Supplier Conservation Standards
Supplier Name
Original Conservation
Standard(Released 7/17/15)
DRAFT
Adjusted Conservation
Standard1
Rincon Del Diablo Municipal Water District 32% 32%
Rio Linda - Elverta Community Water District 36% 33%
Rio Vista, city of 36% 33%
Ripon City of 36% 34%
Riverbank City of 32% 30%
Riverside City of 28% 24%
Riverside Highland Water Company 36% 36%
Rohnert Park City of 16% 16%
Rosamond Community Service District 28% 24%
Roseville City of 28% 25%
Rowland Water District 20% 20%
Rubidoux Community Service District 28% 28%
Rubio Canyon Land and Water Association 36% 36%
Sacramento City of 28% 25%
Sacramento County Water Agency 32% 25%
Sacramento Suburban Water District 32% 29%
San Bernardino City of 28% 28%
San Bernardino County Service Area 64 32% 28%
San Bernardino County Service Area 70J 28% 25%
San Bruno City of 8% 8%
San Buenaventura City of 16% 16%
San Clemente City of 24% 24%
San Diego City of 16% 16%
San Dieguito Water District 28% 28%
San Fernando City of 24% 24%
San Francisco Public Utilities Commission 8% 8%
San Gabriel County Water District 20% 20%
San Gabriel Valley Fontana Water Company 28% 28%
San Gabriel Valley Water Company 16% 16%
San Jacinto City of 32% 32%
San Jose City of 20% 20%
San Jose Water Company 20% 20%
San Juan Capistrano City of 28% 28%
San Juan Water District 36% 33%
San Lorenzo Valley Water District 12% 12%
San Luis Obispo City of 12% 12%
Sanger City of 28% 26%
Santa Ana City of 12% 12%
Santa Barbara City of 12% 12%
Santa Clara City of 16% 16%
Santa Cruz City of 8% 8%
Santa Fe Irrigation District 36% 36%
1 Based on REVISED R-GPCD (as reported by 1/1/16) and Climate Adjustment
For more information see Adjustments to Supplier Conservation Standards table (page 11)
Last Updated January 25, 2016 Page 8 of 26

DRAFT Urban Water Supplier Conservation Standard for Extended Emergency Regulation Rulemaking - 2016
Supplier Conservation Standards
Supplier Name
Original Conservation
Standard(Released 7/17/15)
DRAFT
Adjusted Conservation
Standard1
Santa Fe Springs City of 16% 16%
Santa Margarita Water District 24% 24%
Santa Maria City of 16% 16%
Santa Monica City of 20% 20%
Santa Paula City of 28% 28%
Santa Rosa City of 16% 16%
Scotts Valley Water District 16% 16%
Seal Beach City of 8% 12%
Serrano Water District 36% 36%
Shafter City of 36% 33%
Shasta Lake City of 28% 25%
Sierra Madre City of 32% 32%
Soledad, City of 24% 24%
Sonoma City of 28% 28%
Soquel Creek Water District 8% 8%
South Coast Water District 24% 24%
South Feather Water and Power Agency 36% 33%
South Gate City of 12% 12%
South Pasadena City of 28% 28%
South Tahoe Public Utilities District 20% 17%
Stockton City of 28% 26%
Suburban Water Systems San Jose Hills 24% 24%
Suburban Water Systems Whittier/La Mirada 28% 28%
Suisun-Solano Water Authority 28% 20%
Sunny Slope Water Company 24% 24%
Sunnyslope County Water District 28% 26%
Sunnyvale City of 16% 16%
Susanville City of 36% 33%
Sweetwater Authority 12% 12%
Sweetwater Springs Water District 16% 16%
Tahoe City Public Utilities District 20% 17%
Tehachapi, City of 28% 25%
Thousand Oaks City of 28% 28%
Torrance City of 20% 20%
Trabuco Canyon Water District 28% 28%
Tracy City of 28% 25%
Triunfo Sanitation District / Oak Park Water Service 32% 32%
Truckee-Donner Public Utilities District 28% 25%
Tulare, City of 32% 30%
Tuolumne Utilities District 24% 21%
Turlock City of 32% 29%
Tustin City of 28% 28%
1 Based on REVISED R-GPCD (as reported by 1/1/16) and Climate Adjustment
For more information see Adjustments to Supplier Conservation Standards table (page 11)
Last Updated January 25, 2016 Page 9 of 26

DRAFT Urban Water Supplier Conservation Standard for Extended Emergency Regulation Rulemaking - 2016
Supplier Conservation Standards
Supplier Name
Original Conservation
Standard(Released 7/17/15)
DRAFT
Adjusted Conservation
Standard1
Twentynine Palms Water District 28% 24%
Ukiah City of 20% 20%
Upland City of 36% 36%
Vacaville City of 32% 29%
Valencia Water Company 24% 21%
Vallecitos Water District 24% 24%
Vallejo City of 16% 16%
Valley Center Municipal Water District 36% 36%
Valley County Water District 16% 16%
Valley of the Moon Water District 20% 20%
Valley Water Company 36% 36%
Vaughn Water Company 36% 33%
Ventura County Waterworks District No 1 32% 32%
Ventura County Waterworks District No. 8 28% 28%
Vernon City of 8% 8%
Victorville Water District 28% 24%
Vista Irrigation District 20% 20%
Walnut Valley Water District 28% 28%
Wasco City of 36% 33%
Watsonville City of 20% 20%
West Kern Water District 28% 25%
West Sacramento City of 28% 25%
West Valley Water District 32% 32%
Westborough Water District 8% 8%
Western Municipal Water District of Riverside 32% 32%
Westminster City of 20% 20%
Whittier City of 20% 20%
Windsor, Town of 16% 16%
Winton Water & Sanitary District 36% 33%
Woodland City of 24% 21%
Yorba Linda Water District 36% 36%
Yreka, City of 32% 30%
Yuba City City of 32% 29%
Yucaipa Valley Water District 36% 36%
1 Based on REVISED R-GPCD (as reported by 1/1/16) and Climate Adjustment
For more information see Adjustments to Supplier Conservation Standards table (page 11)
Last Updated January 25, 2016 Page 10 of 26

DRAFT Urban Water Supplier Conservation Standard for Extended Emergency Regulation Rulemaking - 2016
Adjustments to Supplier Conservation Standards
Last Updated January 25, 2016
Supplier Name
Supplier
CIMIS ETo
Zone2
Supplier
Average ETo
Jul-Sep (inches/month)
% Deviation
from Statewide
Average ETo
Jul-Sep(6.34 in/month)
Climate
Adjustment3
Adelanto City of 108.5 17 8.40 33% 4% 16%
Alameda County Water District 88.3 6 5.84 -8% 0% 16%
Alco Water Service 124.2 3 5.02 -21% 0% 24%
Alhambra City of 118.3 9 6.65 5% 0% 24%
Amador Water Agency 113.2 13 7.48 18% 3% 21%
American Canyon, City of 92.1 8 6.35 0% 0% 16%
Anaheim City of 108.6 6 5.84 -8% 0% 20%
Anderson, City of 260.8 14 7.38 16% 3% 33%
Antioch City of 141.9 8 6.35 0% 0% 28%
Apple Valley Ranchos Water Company 159.8 17 8.40 33% 4% 24%
Arcadia City of 318.5 9 6.65 5% 0% 36%
Arcata City of 49.4 1 3.99 -37% n/a 4%
Arroyo Grande City of 132.2 3 5.02 -21% 0% 28%
Arvin Community Services District 112.8 15 7.38 16% 3% 21%
Atascadero Mutual Water Company 163.0 6 5.84 -8% 0% 28%
Atwater City of 308.0 15 7.38 16% 3% 33%
Azusa City of 97.3 9 6.65 5% 0% 20%
Bakersfield City of 279.9 15 7.38 16% 3% 33%
Bakman Water Company 302.2 12 6.86 8% 2% 34%
Banning City of 179.4 16 7.99 26% 4% 28%
Beaumont-Cherry Valley Water District 269.7 9 6.65 5% 0% 36%
Bella Vista Water District 386.3 14 7.38 16% 3% 33%
Bellflower-Somerset Mutual Water Company 96.1 3 5.02 -21% 0% 20%
Benicia City of 105.6 8 6.35 0% 0% 20%
Beverly Hills City of 208.9 6 5.84 -8% 0% 32%
Big Bear City Community Services District 89.8 14 7.38 16% 3% 13%
REVISED
Jul-Sep
2014
R-GPCD(as reported
by 1/1/16)
Climate Adjustment
DRAFT
Adjusted
Conservation
Standard1
1 Based on REVISED R-GPCD and Climate Adjustment
2 Zone Map - http://wwwcimis.water.ca.gov/App_Themes/images/etozonemap.jpg
3 "n/a" if supplier conservation standard cannot drop below 8% or is in 4% tier Page 11 of 26

DRAFT Urban Water Supplier Conservation Standard for Extended Emergency Regulation Rulemaking - 2016
Adjustments to Supplier Conservation Standards
Last Updated January 25, 2016
Supplier Name
Supplier
CIMIS ETo
Zone2
Supplier
Average ETo
Jul-Sep (inches/month)
% Deviation
from Statewide
Average ETo
Jul-Sep(6.34 in/month)
Climate
Adjustment3
REVISED
Jul-Sep
2014
R-GPCD(as reported
by 1/1/16)
Climate Adjustment
DRAFT
Adjusted
Conservation
Standard1
Blythe City of 185.8 18 8.40 33% 4% 28%
Brawley City of 156.0 18 8.40 33% 4% 24%
Brea City of 125.9 6 5.84 -8% 0% 24%
Brentwood City of 174.8 14 7.38 16% 3% 29%
Buena Park City of 107.0 3 5.02 -21% 0% 20%
Burbank City of 128.2 9 6.65 5% 0% 24%
Burlingame City of 90.8 6 5.84 -8% 0% 16%
Calaveras County Water District 82.7 11 7.07 12% 3% 13%
Calexico City of 104.6 18 8.40 33% 4% 16%
California City City of 190.7 17 8.40 33% 4% 28%
California Water Service Company Antelope Valley 297.0 14 7.38 16% 3% 33%
California Water Service Company Bakersfield 197.6 15 7.38 16% 3% 29%
California Water Service Company Bear Gulch 252.5 8 6.35 0% 0% 36%
California Water Service Company Chico District 210.4 12 6.86 8% 2% 30%
California Water Service Company Dixon, City of 144.3 14 7.38 16% 3% 25%
California Water Service Company Dominguez 83.7 3 5.02 -21% 0% 16%
California Water Service Company East Los Angeles 51.4 6 5.84 -8% n/a 8%
California Water Service Company Hermosa/Redondo 96.4 1 3.99 -37% 0% 20%
California Water Service Company Kern River Valley 148.9 14 7.38 16% 3% 25%
California Water Service Company King City 67.7 12 6.86 8% 2% 10%
California Water Service Company Livermore 120.5 14 7.38 16% 3% 21%
California Water Service Company Los Altos/Suburban 173.8 8 6.35 0% 0% 32%
California Water Service Company Marysville 125.5 14 7.38 16% 3% 21%
California Water Service Company Mid Peninsula 87.4 6 5.84 -8% 0% 16%
California Water Service Company Oroville 131.6 12 6.86 8% 2% 26%
California Water Service Company Palos Verdes 255.4 3 5.02 -21% 0% 36%
1 Based on REVISED R-GPCD and Climate Adjustment
2 Zone Map - http://wwwcimis.water.ca.gov/App_Themes/images/etozonemap.jpg
3 "n/a" if supplier conservation standard cannot drop below 8% or is in 4% tier Page 12 of 26

DRAFT Urban Water Supplier Conservation Standard for Extended Emergency Regulation Rulemaking - 2016
Adjustments to Supplier Conservation Standards
Last Updated January 25, 2016
Supplier Name
Supplier
CIMIS ETo
Zone2
Supplier
Average ETo
Jul-Sep (inches/month)
% Deviation
from Statewide
Average ETo
Jul-Sep(6.34 in/month)
Climate
Adjustment3
REVISED
Jul-Sep
2014
R-GPCD(as reported
by 1/1/16)
Climate Adjustment
DRAFT
Adjusted
Conservation
Standard1
California Water Service Company Redwood Valley 93.3 4 5.32 -16% 0% 16%
California Water Service Company Salinas District 86.0 3 5.02 -21% 0% 16%
California Water Service Company Selma 189.2 12 6.86 8% 2% 30%
California Water Service Company South San Francisco 48.8 2 4.50 -29% n/a 8%
California Water Service Company Stockton 97.6 12 6.86 8% 2% 18%
California Water Service Company Visalia 191.7 12 6.86 8% 2% 30%
California Water Service Company Westlake 336.7 9 6.65 5% 0% 36%
California Water Service Company Willows 168.6 12 6.86 8% 2% 26%
California-American Water Company Los Angeles District 156.8 9 6.65 5% 0% 28%
California-American Water Company Monterey District 56.0 6 5.84 -8% n/a 8%
California-American Water Company Sacramento District 107.8 14 7.38 16% 3% 17%
California-American Water Company San Diego District 51.9 1 3.99 -37% n/a 8%
California-American Water Ventura District 184.6 9 6.65 5% 0% 32%
Camarillo City of 107.5 3 5.02 -21% 0% 20%
Cambria Community Services District 44.0 6 0.00 -100% n/a 8%
Camrosa Water District 183.3 9 6.65 5% 0% 32%
Carlsbad Municipal Water District 138.6 3 5.02 -21% 0% 28%
Carmichael Water District 242.5 14 7.38 16% 3% 33%
Carpinteria Valley Water District 98.2 3 5.02 -21% 0% 20%
Casitas Municipal Water District 183.0 3 5.02 -21% 0% 32%
Castaic Lake Water Agency Santa Clarita Water Division 174.8 14 7.38 16% 3% 29%
Ceres City of 166.3 12 6.86 8% 2% 26%
Cerritos City of 153.6 3 5.02 -21% 0% 28%
Chino City of 126.7 9 6.65 5% 0% 24%
Chino Hills City of 157.8 6 5.84 -8% 0% 28%
Citrus Heights Water District 201.4 14 7.38 16% 3% 29%
1 Based on REVISED R-GPCD and Climate Adjustment
2 Zone Map - http://wwwcimis.water.ca.gov/App_Themes/images/etozonemap.jpg
3 "n/a" if supplier conservation standard cannot drop below 8% or is in 4% tier Page 13 of 26

DRAFT Urban Water Supplier Conservation Standard for Extended Emergency Regulation Rulemaking - 2016
Adjustments to Supplier Conservation Standards
Last Updated January 25, 2016
Supplier Name
Supplier
CIMIS ETo
Zone2
Supplier
Average ETo
Jul-Sep (inches/month)
% Deviation
from Statewide
Average ETo
Jul-Sep(6.34 in/month)
Climate
Adjustment3
REVISED
Jul-Sep
2014
R-GPCD(as reported
by 1/1/16)
Climate Adjustment
DRAFT
Adjusted
Conservation
Standard1
City of Big Bear Lake, Dept of Water & Power 80.8 14 7.38 16% 3% 13%
City of Newman Water Department 129.2 14 7.38 16% 3% 21%
Clovis City of 232.9 12 6.86 8% 2% 34%
Coachella City of 125.5 18 8.40 33% 4% 20%
Coachella Valley Water District 288.6 18 8.40 33% 4% 32%
Coalinga City of 193.8 10 6.76 7% 2% 30%
Coastside County Water District 61.9 1 5.84 -8% n/a 8%
Colton, City of 109.8 9 6.65 5% 0% 20%
Compton City of 63.6 3 5.02 -21% n/a 8%
Contra Costa Water District 139.9 14 7.38 16% 3% 25%
Corcoran, City of 223.7 16 7.99 26% 4% 32%
Corona City of 144.7 6 5.84 -8% 0% 28%
Covina City of 154.7 9 6.65 5% 0% 28%
Crescent City City of 94.5 1 3.99 -37% 0% 16%
Crescenta Valley Water District 109.4 9 6.65 5% 0% 20%
Crestline Village Water District 60.4 14 7.38 16% n/a 8%
Cucamonga Valley Water District 184.2 9 6.65 5% 0% 32%
Daly City City of 58.8 1 3.99 -37% n/a 8%
Davis City of 143.9 14 7.38 16% 3% 25%
Del Oro Water Company 116.7 13 7.48 18% 3% 21%
Delano City of 119.4 15 7.38 16% 3% 21%
Desert Water Agency 244.2 16 7.99 26% 4% 32%
Diablo Water District 147.7 14 7.38 16% 3% 25%
Dinuba City of 172.3 12 0.00 -100% 0% 32%
Discovery Bay Community Services District 189.6 14 7.38 16% 3% 29%
Downey City of 106.9 3 5.02 -21% 0% 20%
1 Based on REVISED R-GPCD and Climate Adjustment
2 Zone Map - http://wwwcimis.water.ca.gov/App_Themes/images/etozonemap.jpg
3 "n/a" if supplier conservation standard cannot drop below 8% or is in 4% tier Page 14 of 26

DRAFT Urban Water Supplier Conservation Standard for Extended Emergency Regulation Rulemaking - 2016
Adjustments to Supplier Conservation Standards
Last Updated January 25, 2016
Supplier Name
Supplier
CIMIS ETo
Zone2
Supplier
Average ETo
Jul-Sep (inches/month)
% Deviation
from Statewide
Average ETo
Jul-Sep(6.34 in/month)
Climate
Adjustment3
REVISED
Jul-Sep
2014
R-GPCD(as reported
by 1/1/16)
Climate Adjustment
DRAFT
Adjusted
Conservation
Standard1
Dublin San Ramon Services District 75.9 8 6.35 0% 0% 12%
East Bay Municipal Utilities District 94.2 1 3.99 -37% 0% 16%
East Niles Community Service District 271.8 15 7.38 16% 3% 33%
East Orange County Water District 277.6 6 5.84 -8% 0% 36%
East Palo Alto, City of 58.9 6 5.84 -8% n/a 8%
East Valley Water District 169.4 9 6.65 5% 0% 28%
Eastern Municipal Water District 130.7 6 5.84 -8% 0% 28%
El Centro City of 119.5 18 8.40 33% 4% 20%
El Dorado Irrigation District 166.2 13 7.48 18% 3% 25%
El Monte City of 56.0 9 6.65 5% n/a 8%
El Segundo City of 97.9 1 3.99 -37% 0% 20%
El Toro Water District 119.9 6 5.84 -8% 0% 24%
Elk Grove Water Service 145.3 14 7.38 16% 3% 25%
Elsinore Valley Municipal Water District 146.3 6 5.84 -8% 0% 28%
Escondido City of 103.6 9 6.65 5% 0% 20%
Estero Municipal Improvement District 72.8 6 5.84 -8% 0% 12%
Eureka City of 75.2 1 3.99 -37% n/a 4%
Exeter City of 224.9 12 6.86 8% 2% 34%
Fair Oaks Water District 274.1 14 7.38 16% 3% 33%
Fairfield City of 106.7 8 6.35 0% 0% 20%
Fallbrook Public Utility District 217.3 6 5.84 -8% 0% 36%
Fillmore City of 165.6 9 6.65 5% 0% 28%
Folsom City of 213.7 14 7.38 16% 3% 29%
Fortuna City of 96.0 1 3.99 -37% 0% 20%
Fountain Valley City of 100.2 3 5.02 -21% 0% 20%
Fresno City of 146.4 12 6.86 8% 2% 26%
1 Based on REVISED R-GPCD and Climate Adjustment
2 Zone Map - http://wwwcimis.water.ca.gov/App_Themes/images/etozonemap.jpg
3 "n/a" if supplier conservation standard cannot drop below 8% or is in 4% tier Page 15 of 26

DRAFT Urban Water Supplier Conservation Standard for Extended Emergency Regulation Rulemaking - 2016
Adjustments to Supplier Conservation Standards
Last Updated January 25, 2016
Supplier Name
Supplier
CIMIS ETo
Zone2
Supplier
Average ETo
Jul-Sep (inches/month)
% Deviation
from Statewide
Average ETo
Jul-Sep(6.34 in/month)
Climate
Adjustment3
REVISED
Jul-Sep
2014
R-GPCD(as reported
by 1/1/16)
Climate Adjustment
DRAFT
Adjusted
Conservation
Standard1
Fruitridge Vista Water Company 186.7 14 7.38 16% 3% 29%
Fullerton City of 136.8 6 5.84 -8% 0% 28%
Galt City of 207.2 14 7.38 16% 3% 29%
Garden Grove City of 98.3 3 5.02 -21% 0% 20%
Georgetown Divide Public Utilities District 170.4 14 7.38 16% 3% 29%
Gilroy City of 117.6 8 6.35 0% 0% 24%
Glendale City of 107.1 9 6.65 5% 0% 20%
Glendora City of 242.0 9 6.65 5% 0% 36%
Golden State Water Company Artesia 83.4 3 5.02 -21% 0% 16%
Golden State Water Company Barstow 125.4 17 8.40 33% 4% 20%
Golden State Water Company Bay Point 69.3 8 6.35 0% 0% 12%
Golden State Water Company Bell-Bell Gardens 60.8 3 5.02 -21% n/a 8%
Golden State Water Company Claremont 213.2 9 6.65 5% 0% 32%
Golden State Water Company Cordova 224.5 14 7.38 16% 3% 33%
Golden State Water Company Cowan Heights 401.6 6 5.84 -8% 0% 36%
Golden State Water Company Culver City 84.8 3 5.02 -21% 0% 16%
Golden State Water Company Florence Graham 59.7 3 5.02 -21% n/a 8%
Golden State Water Company Norwalk 72.2 3 5.02 -21% 0% 12%
Golden State Water Company Orcutt 199.8 3 5.02 -21% 0% 32%
Golden State Water Company Placentia 119.0 6 5.84 -8% 0% 24%
Golden State Water Company S Arcadia 118.5 9 6.65 5% 0% 24%
Golden State Water Company S San Gabriel 73.6 9 6.65 5% 0% 12%
Golden State Water Company San Dimas 159.0 9 6.65 5% 0% 28%
Golden State Water Company Simi Valley 129.8 9 6.65 5% 0% 24%
Golden State Water Company Southwest 68.2 3 5.02 -21% 0% 12%
Golden State Water Company West Orange 94.2 3 5.02 -21% 0% 16%
1 Based on REVISED R-GPCD and Climate Adjustment
2 Zone Map - http://wwwcimis.water.ca.gov/App_Themes/images/etozonemap.jpg
3 "n/a" if supplier conservation standard cannot drop below 8% or is in 4% tier Page 16 of 26

DRAFT Urban Water Supplier Conservation Standard for Extended Emergency Regulation Rulemaking - 2016
Adjustments to Supplier Conservation Standards
Last Updated January 25, 2016
Supplier Name
Supplier
CIMIS ETo
Zone2
Supplier
Average ETo
Jul-Sep (inches/month)
% Deviation
from Statewide
Average ETo
Jul-Sep(6.34 in/month)
Climate
Adjustment3
REVISED
Jul-Sep
2014
R-GPCD(as reported
by 1/1/16)
Climate Adjustment
DRAFT
Adjusted
Conservation
Standard1
Goleta Water District 65.5 3 5.02 -21% 0% 12%
Great Oaks Water Company Incorporated 104.2 8 6.35 0% 0% 20%
Greenfield, City of 82.9 12 0.00 -100% 0% 16%
Groveland Community Services District 127.5 11 7.07 12% 3% 21%
Grover Beach City of 62.1 1 3.99 -37% n/a 8%
Hanford City of 160.0 16 7.99 26% 4% 24%
Hawthorne City of 86.7 3 5.02 -21% 0% 16%
Hayward City of 62.1 6 5.84 -8% n/a 8%
Healdsburg City of 128.2 8 6.35 0% 0% 24%
Helix Water District 103.6 6 5.84 -8% 0% 20%
Hemet City of 89.2 9 6.65 5% 0% 16%
Hesperia Water District City of 174.6 17 8.40 33% 4% 28%
Hi-Desert Water District 90.3 14 7.38 16% 3% 13%
Hillsborough Town of 324.5 6 5.84 -8% 0% 36%
Hollister City of 104.4 3 5.02 -21% 0% 20%
Humboldt Bay Municipal Water District 132.1 3 5.02 -21% n/a 4%
Humboldt Community Service District 73.7 1 3.99 -37% 0% 12%
Huntington Beach City of 109.0 2 4.50 -29% 0% 20%
Huntington Park City of 51.9 3 5.02 -21% n/a 8%
Imperial, City of 127.6 18 8.40 33% 4% 20%
Indian Wells Valley Water District 240.8 17 8.40 33% 4% 32%
Indio City of 186.6 18 8.40 33% 4% 28%
Inglewood City of 65.1 3 5.02 -21% 0% 12%
Irvine Ranch Water District 91.7 6 5.84 -8% 0% 16%
Joshua Basin Water District 126.6 17 8.40 33% 4% 20%
Jurupa Community Service District 155.5 6 5.84 -8% 0% 28%
1 Based on REVISED R-GPCD and Climate Adjustment
2 Zone Map - http://wwwcimis.water.ca.gov/App_Themes/images/etozonemap.jpg
3 "n/a" if supplier conservation standard cannot drop below 8% or is in 4% tier Page 17 of 26

DRAFT Urban Water Supplier Conservation Standard for Extended Emergency Regulation Rulemaking - 2016
Adjustments to Supplier Conservation Standards
Last Updated January 25, 2016
Supplier Name
Supplier
CIMIS ETo
Zone2
Supplier
Average ETo
Jul-Sep (inches/month)
% Deviation
from Statewide
Average ETo
Jul-Sep(6.34 in/month)
Climate
Adjustment3
REVISED
Jul-Sep
2014
R-GPCD(as reported
by 1/1/16)
Climate Adjustment
DRAFT
Adjusted
Conservation
Standard1
Kerman, City of 192.7 15 7.38 16% 3% 29%
Kingsburg, City of 332.7 12 6.86 8% 2% 34%
La Habra City of Public Works 137.5 6 5.84 -8% 0% 28%
La Palma City of 96.1 3 5.02 -21% 0% 20%
La Verne City of 176.5 9 6.65 5% 0% 32%
Laguna Beach County Water District 121.0 3 5.02 -21% 0% 24%
Lake Arrowhead Community Services District 81.5 14 7.38 16% 3% 13%
Lake Hemet Municipal Water District 150.5 9 6.65 5% 0% 28%
Lakeside Water District 109.2 9 6.65 5% 0% 20%
Lakewood City of 105.0 3 5.02 -21% 0% 20%
Lamont Public Utility District 163.9 15 7.38 16% 3% 25%
Las Virgenes Municipal Water District 318.4 3 5.02 -21% 0% 36%
Lathrop, City of 100.5 12 6.86 8% 2% 18%
Lee Lake Water District 173.0 6 5.84 -8% 0% 32%
Lemoore City of 198.9 16 7.99 26% 4% 28%
Lincoln City of 193.4 14 7.38 16% 3% 29%
Lincoln Avenue Water Company 137.2 9 6.65 5% 0% 28%
Linda County Water District 211.0 14 7.38 16% 3% 29%
Livermore City of Division of Water Resources 100.0 14 7.38 16% 3% 17%
Livingston City of 204.2 15 7.38 16% 3% 29%
Lodi City of Public Works Department 210.3 12 6.86 8% 2% 30%
Loma Linda City of * 173.2 9 6.65 5% 0% 32%
Lomita City of 98.3 3 0.00 -100% 0% 20%
Lompoc City of 76.6 3 5.02 -21% 0% 12%
Long Beach City of 79.5 3 5.02 -21% 0% 12%
Los Angeles County Public Works Waterworks District 29 325.2 3 5.02 -21% 0% 36%
1 Based on REVISED R-GPCD and Climate Adjustment
2 Zone Map - http://wwwcimis.water.ca.gov/App_Themes/images/etozonemap.jpg
3 "n/a" if supplier conservation standard cannot drop below 8% or is in 4% tier Page 18 of 26

DRAFT Urban Water Supplier Conservation Standard for Extended Emergency Regulation Rulemaking - 2016
Adjustments to Supplier Conservation Standards
Last Updated January 25, 2016
Supplier Name
Supplier
CIMIS ETo
Zone2
Supplier
Average ETo
Jul-Sep (inches/month)
% Deviation
from Statewide
Average ETo
Jul-Sep(6.34 in/month)
Climate
Adjustment3
REVISED
Jul-Sep
2014
R-GPCD(as reported
by 1/1/16)
Climate Adjustment
DRAFT
Adjusted
Conservation
Standard1
Los Angeles County Public Works Waterworks District 40 205.5 17 8.40 33% 4% 28%
Los Angeles Department of Water and Power 90.0 9 6.65 5% 0% 16%
Los Banos, City of 165.4 15 7.38 16% 3% 25%
Lynwood City of 86.3 3 5.02 -21% 0% 16%
Madera City of 157.3 12 6.86 8% 2% 26%
Madera County 328.1 12 6.86 8% 2% 34%
Mammoth Community Water District 102.9 14 7.38 16% 3% 17%
Manhattan Beach City of 103.2 1 0.00 -100% 0% 20%
Manteca City of 172.1 12 6.86 8% 2% 30%
Marin Municipal Water District 107.4 4 5.32 -16% 0% 20%
Marina Coast Water District 76.5 2 4.50 -29% 0% 12%
Martinez City of 95.5 8 6.35 0% 0% 20%
McKinleyville Community Service District 74.6 1 3.99 -37% n/a 4%
Menlo Park City of 88.6 6 5.84 -8% 0% 16%
Merced City of 298.8 12 6.86 8% 2% 34%
Mesa Water District 99.0 3 5.02 -21% 0% 20%
Mid-Peninsula Water District 101.4 6 5.84 -8% 0% 20%
Millbrae City of 89.2 2 4.50 -29% 0% 16%
Milpitas City of 72.3 8 6.35 0% 0% 12%
Mission Springs Water District 154.1 18 0.00 -100% 0% 28%
Modesto, City of 245.9 12 6.86 8% 2% 34%
Monrovia City of 154.6 9 6.65 5% 0% 28%
Monte Vista Water District 125.0 9 6.65 5% 0% 24%
Montebello Land and Water Company 80.5 6 5.84 -8% 0% 16%
Montecito Water District 197.4 3 5.02 -21% 0% 32%
Monterey Park City of 99.9 6 5.84 -8% 0% 20%
1 Based on REVISED R-GPCD and Climate Adjustment
2 Zone Map - http://wwwcimis.water.ca.gov/App_Themes/images/etozonemap.jpg
3 "n/a" if supplier conservation standard cannot drop below 8% or is in 4% tier Page 19 of 26
DRAFT Urban Water Supplier Conservation Standard for Extended Emergency Regulation Rulemaking - 2016
Adjustments to Supplier Conservation Standards
Last Updated January 25, 2016
Supplier Name
Supplier
CIMIS ETo
Zone2
Supplier
Average ETo
Jul-Sep (inches/month)
% Deviation
from Statewide
Average ETo
Jul-Sep(6.34 in/month)
Climate
Adjustment3
REVISED
Jul-Sep
2014
R-GPCD(as reported
by 1/1/16)
Climate Adjustment
DRAFT
Adjusted
Conservation
Standard1
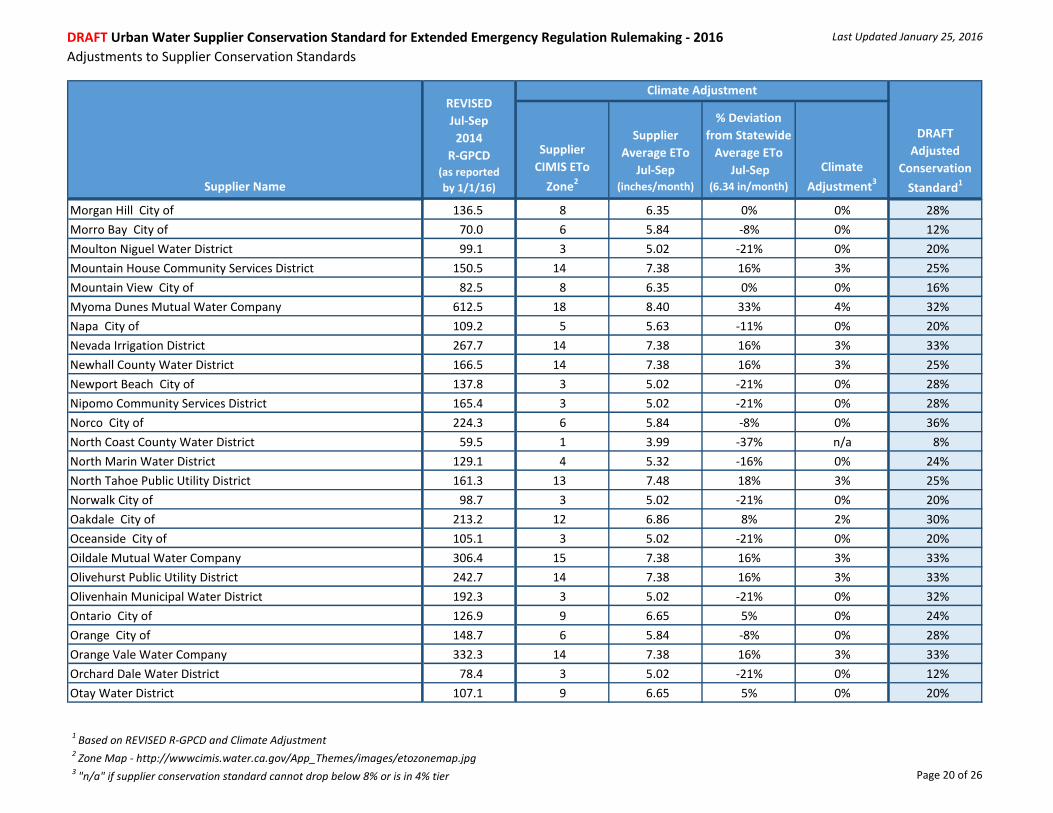
Morgan Hill City of 136.5 8 6.35 0% 0% 28%
Morro Bay City of 70.0 6 5.84 -8% 0% 12%
Moulton Niguel Water District 99.1 3 5.02 -21% 0% 20%
Mountain House Community Services District 150.5 14 7.38 16% 3% 25%
Mountain View City of 82.5 8 6.35 0% 0% 16%
Myoma Dunes Mutual Water Company 612.5 18 8.40 33% 4% 32%
Napa City of 109.2 5 5.63 -11% 0% 20%
Nevada Irrigation District 267.7 14 7.38 16% 3% 33%
Newhall County Water District 166.5 14 7.38 16% 3% 25%
Newport Beach City of 137.8 3 5.02 -21% 0% 28%
Nipomo Community Services District 165.4 3 5.02 -21% 0% 28%
Norco City of 224.3 6 5.84 -8% 0% 36%
North Coast County Water District 59.5 1 3.99 -37% n/a 8%
North Marin Water District 129.1 4 5.32 -16% 0% 24%
North Tahoe Public Utility District 161.3 13 7.48 18% 3% 25%
Norwalk City of 98.7 3 5.02 -21% 0% 20%
Oakdale City of 213.2 12 6.86 8% 2% 30%
Oceanside City of 105.1 3 5.02 -21% 0% 20%
Oildale Mutual Water Company 306.4 15 7.38 16% 3% 33%
Olivehurst Public Utility District 242.7 14 7.38 16% 3% 33%
Olivenhain Municipal Water District 192.3 3 5.02 -21% 0% 32%
Ontario City of 126.9 9 6.65 5% 0% 24%
Orange City of 148.7 6 5.84 -8% 0% 28%
Orange Vale Water Company 332.3 14 7.38 16% 3% 33%
Orchard Dale Water District 78.4 3 5.02 -21% 0% 12%
Otay Water District 107.1 9 6.65 5% 0% 20%
1 Based on REVISED R-GPCD and Climate Adjustment
2 Zone Map - http://wwwcimis.water.ca.gov/App_Themes/images/etozonemap.jpg
3 "n/a" if supplier conservation standard cannot drop below 8% or is in 4% tier Page 20 of 26

DRAFT Urban Water Supplier Conservation Standard for Extended Emergency Regulation Rulemaking - 2016
Adjustments to Supplier Conservation Standards
Last Updated January 25, 2016
Supplier Name
Supplier
CIMIS ETo
Zone2
Supplier
Average ETo
Jul-Sep (inches/month)
% Deviation
from Statewide
Average ETo
Jul-Sep(6.34 in/month)
Climate
Adjustment3
REVISED
Jul-Sep
2014
R-GPCD(as reported
by 1/1/16)
Climate Adjustment
DRAFT
Adjusted
Conservation
Standard1
Oxnard City of 66.6 3 5.02 -21% 0% 12%
Padre Dam Municipal Water District 109.4 9 6.65 5% 0% 20%
Palmdale Water District 187.2 17 8.40 33% 4% 28%
Palo Alto City of 116.8 8 6.35 0% 0% 24%
Paradise Irrigation District 240.8 13 7.48 18% 3% 33%
Paramount City of 67.0 3 5.02 -21% 0% 12%
Park Water Company 55.6 3 5.02 -21% n/a 8%
Pasadena City of 139.5 9 6.65 5% 0% 28%
Paso Robles City of 146.0 16 7.99 26% 4% 24%
Patterson City of 148.3 14 7.38 16% 3% 25%
Perris, City of 111.9 6 5.84 -8% 0% 24%
Petaluma City of 92.4 5 5.63 -11% 0% 16%
Phelan Pinon Hills Community Services District 181.6 17 8.40 33% 4% 28%
Pico Rivera City of 83.7 6 5.84 -8% 0% 16%
Pico Water District 119.0 6 5.84 -8% 0% 24%
Pinedale County Water District 146.0 12 6.86 8% 2% 26%
Pismo Beach City of 113.1 1 3.99 -37% 0% 24%
Pittsburg City of 100.3 8 6.35 0% 0% 20%
Placer County Water Agency 207.2 14 7.38 16% 3% 29%
Pleasanton City of 119.8 8 6.35 0% 0% 24%
Pomona City of 95.9 9 6.65 5% 0% 20%
Port Hueneme City of 63.5 3 5.02 -21% n/a 8%
Porterville City of 166.3 12 6.86 8% 2% 26%
Poway City of 201.7 9 6.65 5% 0% 32%
Quartz Hill Water District 327.0 17 8.40 33% 4% 32%
Rainbow Municipal Water District 243.0 6 5.84 -8% 0% 36%
1 Based on REVISED R-GPCD and Climate Adjustment
2 Zone Map - http://wwwcimis.water.ca.gov/App_Themes/images/etozonemap.jpg
3 "n/a" if supplier conservation standard cannot drop below 8% or is in 4% tier Page 21 of 26

DRAFT Urban Water Supplier Conservation Standard for Extended Emergency Regulation Rulemaking - 2016
Adjustments to Supplier Conservation Standards
Last Updated January 25, 2016
Supplier Name
Supplier
CIMIS ETo
Zone2
Supplier
Average ETo
Jul-Sep (inches/month)
% Deviation
from Statewide
Average ETo
Jul-Sep(6.34 in/month)
Climate
Adjustment3
REVISED
Jul-Sep
2014
R-GPCD(as reported
by 1/1/16)
Climate Adjustment
DRAFT
Adjusted
Conservation
Standard1
Ramona Municipal Water District 165.9 9 6.65 5% 0% 28%
Rancho California Water District 260.3 6 5.84 -8% 0% 36%
Red Bluff City of 294.5 14 7.38 16% 3% 33%
Redding City of 253.7 14 7.38 16% 3% 33%
Redlands City of 274.5 9 6.65 5% 0% 36%
Redwood City City of 63.4 6 5.84 -8% n/a 8%
Reedley City of 126.9 12 6.86 8% 2% 22%
Rialto City of 132.2 9 6.65 5% 0% 28%
Rincon Del Diablo Municipal Water District 179.2 6 5.84 -8% 0% 32%
Rio Linda - Elverta Community Water District 278.1 14 7.38 16% 3% 33%
Rio Vista, city of 260.9 14 7.38 16% 3% 33%
Ripon City of 257.2 12 6.86 8% 2% 34%
Riverbank City of 191.4 12 6.86 8% 2% 30%
Riverside City of 121.1 6 5.84 -8% 0% 24%
Riverside Highland Water Company 253.9 9 6.65 5% 0% 36%
Rohnert Park City of 81.0 5 5.63 -11% 0% 16%
Rosamond Community Service District 158.3 17 8.40 33% 4% 24%
Roseville City of 145.1 14 7.38 16% 3% 25%
Rowland Water District 99.3 6 5.84 -8% 0% 20%
Rubidoux Community Service District 158.0 6 5.84 -8% 0% 28%
Rubio Canyon Land and Water Association 220.8 9 6.65 5% 0% 36%
Sacramento City of 146.4 14 7.38 16% 3% 25%
Sacramento County Water Agency 161.5 14 7.38 16% 3% 25%
Sacramento Suburban Water District 181.9 14 7.38 16% 3% 29%
San Bernardino City of 131.1 9 6.65 5% 0% 28%
San Bernardino County Service Area 64 190.4 17 8.40 33% 4% 28%
1 Based on REVISED R-GPCD and Climate Adjustment
2 Zone Map - http://wwwcimis.water.ca.gov/App_Themes/images/etozonemap.jpg
3 "n/a" if supplier conservation standard cannot drop below 8% or is in 4% tier Page 22 of 26

DRAFT Urban Water Supplier Conservation Standard for Extended Emergency Regulation Rulemaking - 2016
Adjustments to Supplier Conservation Standards
Last Updated January 25, 2016
Supplier Name
Supplier
CIMIS ETo
Zone2
Supplier
Average ETo
Jul-Sep (inches/month)
% Deviation
from Statewide
Average ETo
Jul-Sep(6.34 in/month)
Climate
Adjustment3
REVISED
Jul-Sep
2014
R-GPCD(as reported
by 1/1/16)
Climate Adjustment
DRAFT
Adjusted
Conservation
Standard1
San Bernardino County Service Area 70J 139.9 14 7.38 16% 3% 25%
San Bruno City of 55.7 2 4.50 -29% n/a 8%
San Buenaventura City of 91.3 3 5.02 -21% 0% 16%
San Clemente City of 118.3 1 3.99 -37% 0% 24%
San Diego City of 82.0 6 5.84 -8% 0% 16%
San Dieguito Water District 148.3 1 3.99 -37% 0% 28%
San Fernando City of 120.3 9 6.65 5% 0% 24%
San Francisco Public Utilities Commission 45.4 2 4.50 -29% n/a 8%
San Gabriel County Water District 102.9 9 6.65 5% 0% 20%
San Gabriel Valley Fontana Water Company 142.9 9 6.65 5% 0% 28%
San Gabriel Valley Water Company 88.3 9 6.65 5% 0% 16%
San Jacinto City of 176.1 9 6.65 5% 0% 32%
San Jose City of 96.0 8 6.35 0% 0% 20%
San Jose Water Company 105.7 8 6.35 0% 0% 20%
San Juan Capistrano City of 133.3 3 5.02 -21% 0% 28%
San Juan Water District 499.4 14 7.38 16% 3% 33%
San Lorenzo Valley Water District 77.9 3 5.02 -21% 0% 12%
San Luis Obispo City of 69.9 6 5.84 -8% 0% 12%
Sanger City of 153.6 12 6.86 8% 2% 26%
Santa Ana City of 78.3 6 5.84 -8% 0% 12%
Santa Barbara City of 79.6 3 5.02 -21% 0% 12%
Santa Clara City of 88.3 8 6.35 0% 0% 16%
Santa Cruz City of 47.3 2 4.50 -29% n/a 8%
Santa Fe Irrigation District 604.6 3 5.02 -21% 0% 36%
Santa Fe Springs City of 89.9 3 5.02 -21% 0% 16%
Santa Margarita Water District 129.4 6 5.84 -8% 0% 24%
1 Based on REVISED R-GPCD and Climate Adjustment
2 Zone Map - http://wwwcimis.water.ca.gov/App_Themes/images/etozonemap.jpg
3 "n/a" if supplier conservation standard cannot drop below 8% or is in 4% tier Page 23 of 26

DRAFT Urban Water Supplier Conservation Standard for Extended Emergency Regulation Rulemaking - 2016
Adjustments to Supplier Conservation Standards
Last Updated January 25, 2016
Supplier Name
Supplier
CIMIS ETo
Zone2
Supplier
Average ETo
Jul-Sep (inches/month)
% Deviation
from Statewide
Average ETo
Jul-Sep(6.34 in/month)
Climate
Adjustment3
REVISED
Jul-Sep
2014
R-GPCD(as reported
by 1/1/16)
Climate Adjustment
DRAFT
Adjusted
Conservation
Standard1
Santa Maria City of 93.0 3 5.02 -21% 0% 16%
Santa Monica City of 99.2 1 3.99 -37% 0% 20%
Santa Paula City of 160.2 9 6.65 5% 0% 28%
Santa Rosa City of 86.7 5 5.63 -11% 0% 16%
Scotts Valley Water District 91.6 3 5.02 -21% 0% 16%
Seal Beach City of 76.9 2 4.50 -29% 0% 12%
Serrano Water District 539.0 6 5.84 -8% 0% 36%
Shafter City of 236.5 15 7.38 16% 3% 33%
Shasta Lake City of 140.2 14 7.38 16% 3% 25%
Sierra Madre City of 214.2 9 6.65 5% 0% 32%
Soledad, City of 116.7 6 5.84 -8% 0% 24%
Sonoma City of 142.5 8 6.35 0% 0% 28%
Soquel Creek Water District 64.8 2 4.50 -29% n/a 8%
South Coast Water District 121.7 1 3.99 -37% 0% 24%
South Feather Water and Power Agency 465.9 14 7.38 16% 3% 33%
South Gate City of 70.1 3 5.02 -21% 0% 12%
South Pasadena City of 131.0 9 6.65 5% 0% 28%
South Tahoe Public Utilities District 102.8 13 7.48 18% 3% 17%
Stockton City of 155.0 12 6.86 8% 2% 26%
Suburban Water Systems San Jose Hills 118.7 9 6.65 5% 0% 24%
Suburban Water Systems Whittier/La Mirada 141.1 3 5.02 -21% 0% 28%
Suisun-Solano Water Authority 99.7 8 6.35 0% 0% 20%
Sunny Slope Water Company 120.5 9 6.65 5% 0% 24%
Sunnyslope County Water District 144.6 10 6.76 7% 2% 26%
Sunnyvale City of 85.2 8 6.35 0% 0% 16%
Susanville City of 274.0 13 7.48 18% 3% 33%
1 Based on REVISED R-GPCD and Climate Adjustment
2 Zone Map - http://wwwcimis.water.ca.gov/App_Themes/images/etozonemap.jpg
3 "n/a" if supplier conservation standard cannot drop below 8% or is in 4% tier Page 24 of 26

DRAFT Urban Water Supplier Conservation Standard for Extended Emergency Regulation Rulemaking - 2016
Adjustments to Supplier Conservation Standards
Last Updated January 25, 2016
Supplier Name
Supplier
CIMIS ETo
Zone2
Supplier
Average ETo
Jul-Sep (inches/month)
% Deviation
from Statewide
Average ETo
Jul-Sep(6.34 in/month)
Climate
Adjustment3
REVISED
Jul-Sep
2014
R-GPCD(as reported
by 1/1/16)
Climate Adjustment
DRAFT
Adjusted
Conservation
Standard1
Sweetwater Authority 75.0 3 5.02 -21% 0% 12%
Sweetwater Springs Water District 80.7 4 5.32 -16% 0% 16%
Tahoe City Public Utilities District 100.9 13 7.48 18% 3% 17%
Tehachapi, City of 143.8 14 7.38 16% 3% 25%
Thousand Oaks City of 163.7 9 6.65 5% 0% 28%
Torrance City of 97.1 3 5.02 -21% 0% 20%
Trabuco Canyon Water District 158.0 6 5.84 -8% 0% 28%
Tracy City of 134.6 14 7.38 16% 3% 25%
Triunfo Sanitation District / Oak Park Water Service 195.7 9 6.65 5% 0% 32%
Truckee-Donner Public Utilities District 139.4 13 7.48 18% 3% 25%
Tulare, City of 214.8 12 6.86 8% 2% 30%
Tuolumne Utilities District 129.3 11 7.07 12% 3% 21%
Turlock City of 194.0 15 7.38 16% 3% 29%
Tustin City of 167.3 6 5.84 -8% 0% 28%
Twentynine Palms Water District 130.6 17 8.40 33% 4% 24%
Ukiah City of 108.6 8 6.35 0% 0% 20%
Upland City of 234.9 9 6.65 5% 0% 36%
Vacaville City of 185.7 14 7.38 16% 3% 29%
Valencia Water Company 127.0 14 7.38 16% 3% 21%
Vallecitos Water District 116.1 3 5.02 -21% 0% 24%
Vallejo City of 91.3 2 4.50 -29% 0% 16%
Valley Center Municipal Water District 291.2 9 6.65 5% 0% 36%
Valley County Water District 81.6 9 6.65 5% 0% 16%
Valley of the Moon Water District 106.5 8 6.35 0% 0% 20%
Valley Water Company 400.8 9 6.65 5% 0% 36%
Vaughn Water Company 507.0 15 7.38 16% 3% 33%
1 Based on REVISED R-GPCD and Climate Adjustment
2 Zone Map - http://wwwcimis.water.ca.gov/App_Themes/images/etozonemap.jpg
3 "n/a" if supplier conservation standard cannot drop below 8% or is in 4% tier Page 25 of 26

DRAFT Urban Water Supplier Conservation Standard for Extended Emergency Regulation Rulemaking - 2016
Adjustments to Supplier Conservation Standards
Last Updated January 25, 2016
Supplier Name
Supplier
CIMIS ETo
Zone2
Supplier
Average ETo
Jul-Sep (inches/month)
% Deviation
from Statewide
Average ETo
Jul-Sep(6.34 in/month)
Climate
Adjustment3
REVISED
Jul-Sep
2014
R-GPCD(as reported
by 1/1/16)
Climate Adjustment
DRAFT
Adjusted
Conservation
Standard1
Ventura County Waterworks District No 1 175.3 9 6.65 5% 0% 32%
Ventura County Waterworks District No. 8 156.1 9 6.65 5% 0% 28%
Vernon City of 55.3 3 5.02 -21% n/a 8%
Victorville Water District 155.4 17 8.40 33% 4% 24%
Vista Irrigation District 105.5 3 5.02 -21% 0% 20%
Walnut Valley Water District 146.4 9 6.65 5% 0% 28%
Wasco City of 231.1 15 7.38 16% 3% 33%
Watsonville City of 100.3 2 4.50 -29% 0% 20%
West Kern Water District 133.0 15 7.38 16% 3% 25%
West Sacramento City of 143.0 14 7.38 16% 3% 25%
West Valley Water District 212.3 9 6.65 5% 0% 32%
Westborough Water District 40.6 2 4.50 -29% n/a 8%
Western Municipal Water District of Riverside 188.8 6 5.84 -8% 0% 32%
Westminster City of 98.0 3 5.02 -21% 0% 20%
Whittier City of 104.2 6 5.84 -8% 0% 20%
Windsor, Town of 93.0 8 6.35 0% 0% 16%
Winton Water & Sanitary District 228.9 15 7.38 16% 3% 33%
Woodland City of 119.8 14 7.38 16% 3% 21%
Yorba Linda Water District 220.2 6 5.84 -8% 0% 36%
Yreka, City of 186.6 10 6.76 7% 2% 30%
Yuba City City of 188.2 14 7.38 16% 3% 29%
Yucaipa Valley Water District 265.0 9 6.65 5% 0% 36%
1 Based on REVISED R-GPCD and Climate Adjustment
2 Zone Map - http://wwwcimis.water.ca.gov/App_Themes/images/etozonemap.jpg
3 "n/a" if supplier conservation standard cannot drop below 8% or is in 4% tier Page 26 of 26