California Manufacturing Cost Annual 2006 Data · California Manufacturing Cost Annual 2006 Data...
40
California Manufacturing Cost Annual 2006 Data Compiled and Published in 2008
Transcript of California Manufacturing Cost Annual 2006 Data · California Manufacturing Cost Annual 2006 Data...
California
Manufacturing Cost Annual 2006 Data
Compiled and Published in 2008
California Department of Food and AgricultureA.G. Kawamura, Secretary
Dairy Marketing Branch1220 N Street, Sacramento, CA 95814-5621
(916) 341-5988 / www.cdfa.ca.gov/dairyEmail Address: [email protected]
C A L I F O R N I A
ManufacturingCost AnnualCompiled and Published in 2008
This publication was prepared in theDivision of Marketing Services, Dairy Marketing Branch, by:
Manufacturing Cost Unit Staff:Venetta Reed, Supervisor
Catherine EvansRaymond GrethJackie Juarez
Stephanie QianJoseph Reno
This publication would not be possible without the cooperation of the individuals and fi rms engaged in the production, manufacture, and
distribution of milk and dairy products.

California Manufacturing Cost Annual 3
Introduction ......................................................................................................................6Highlights of the Manufacturing Cost Studies..................................................................6 Labor was the Largest Cost Component....................................................................7Cheddar Cheese Study ...................................................................................................8 Overview ....................................................................................................................8 Characteristics of Cheddar Cheese Plants ..............................................................10Butter Study ...................................................................................................................17 Overview ..................................................................................................................17 Characteristics of Butter Plants ................................................................................19Nonfat Dry Milk Study ....................................................................................................25 Overview ..................................................................................................................25 Characteristics of Nonfat Dry Milk Plants .................................................................27Skim Whey Powder Study .............................................................................................33 Overview ..................................................................................................................33Condensed Skim and Cream Studies ...........................................................................37 Overview of Condensed Skim ..................................................................................37 Cream Overview ......................................................................................................38
List of Tables
Table 1. Processing Costs for Seven California Cheddar Cheese Plants ......................9Table 2. Cheddar Cheese Production Parameters from Cost Studies .........................10Table 3. Processing Costs for Seven California Butter Plants ......................................18Table 4. Processing Costs for Eight California Nonfat Dry Milk Plants .........................26Table 5. Processing Costs for Three California Skim Whey Powder Plants .................34
Figure 1. Comparison of Costs by Category for California Manufacturing Plants ..........7
For Cheddar Cheese Cost Study:Figure 2. Simplifi ed Product Flow in a Cheese Plant with By-Product Processing ......11Figure 3. Breakdown of Cheddar Cheese Processing Costs .......................................12Figure 4. Breakdown of Cheddar Cheese Packaging Sizes ........................................12Figure 5. Annual California Cheddar and Jack Cheese Production .............................13Figure 6. Cheddar Cheese Manufacturing Cost Per Pound .........................................13
List of Figures
Table of ContentsTable of Contents
4 California Manufacturing Cost Annual
For Cheddar Cheese Cost Study, Continued:Figure 7. Share of California Cheddar Cheese Production by Ownership Type .........13Figure 8. Cheddar Cheese Processing Labor Cost Per Pound ...................................14Figure 9. Cheddar Cheese Processing Non-Labor Cost Per Pound ...........................14Figure 10. Cheddar Cheese Labor Breakdown by Category in Cents Per Pound ........14Figure 11. Utility Cost Per Pound in Cheddar Cheese Plants .......................................15Figure 12. Repairs, Maintenance and Supplies Cost Per Pound in Cheddar Cheese Plants ...............................................................................15Figure 13. Comparison of Payroll Breakdown for Cheddar Cheese Plant Employees, Hourly and Salaried .........................................................16Figure 14. Cheese Processing Cost Comparison, 2004-2006 ......................................16
For Butter Cost Study:Figure 15. Simplifi ed Product Flow in a Butter Plant .....................................................19Figure 16. Breakdown of Butter Processing Costs ........................................................20Figure 17. Breakdown of Butter Packaging Sizes .........................................................20Figure 18. Annual California Butter Production .............................................................21Figure 19. Butter Manufacturing Cost Per Pound..........................................................21Figure 20. Share of California Butter Production by Ownership Type ...........................21Figure 21. Butter Processing Labor Cost Per Pound ....................................................22Figure 22. Butter Processing Non-Labor Cost Per Pound.............................................22Figure 23. Butter Labor Breakdown by Category in Cents Per Pound ..........................22Figure 24. Utility Cost Per Pound in Butter Plants .........................................................23Figure 25. Repairs, Maintenance, and Supplies Cost Per Pound in Butter Plants ........23Figure 26. Comparison of Payroll Breakdown for Butter Plant Employees ...................24Figure 27. Butter Processing Cost Comparison, 2004-2006 .........................................24
For Nonfat Dry Milk Cost Study:Figure 28. Simplifi ed Product Flow in a Nonfat Dry Milk Plant ......................................27Figure 29. Breakdown of Nonfat Dry Milk Processing Costs .........................................28Figure 30. Breakdown of Nonfat Dry Milk Packaging Sizes ..........................................28Figure 31. Annual California Nonfat Dry Milk Production ..............................................29Figure 32. Nonfat Dry Milk Manufacturing Cost Per Pound...........................................29Figure 33. Share of California Nonfat Dry Milk Production by Ownership Type ............29Figure 34. Nonfat Dry Milk Processing Labor Cost Per Pound .....................................30Figure 35. Nonfat Dry Milk Processing Non-Labor Cost Per Pound..............................30

California Manufacturing Cost Annual 5
We welcome your comments on this Manufacturing Cost Annual. Please send your comments and suggestions to:
Venetta Reed, Supervising Auditor Dairy Marketing Branch California Department of Food and Agriculture 1220 N Street Sacramento, CA 95814-5621
Phone: (916) 341-5991 Fax: (916) 341-6697 e-mail: [email protected]
For Nonfat Dry Milk Cost Study, Continued:
Figure 36. Nonfat Dry Milk Labor Breakdown by Category in Cents Per Pound ..........30Figure 37. Utility Cost Per Pound in Nonfat Dry Milk Plants .........................................31Figure 38. Repairs, Maintenance, and Supplies Cost Per Pound in Nonfat Dry Milk Plants .................................................................................31Figure 39. Weighted Average Breakdown of Dollars Spent Per Year on Energy .........31Figure 40. Comparison of Payroll Breakdown for Nonfat Dry Milk Plant Employees...................................................................................................32Figure 41. Nonfat Dry Milk Processing Cost Comparison, 2004-2006 .........................32
For Skim Whey Powder Studies:
Figure 42. Annual Skim Whey Powder Processing Costs ............................................35Figure 43. Weighted Average Breakdown of Dollars Spent Per Year on Energy .........35Figure 44. Share of California Skim Whey Powder Production by Ownership Type ....36Figure 45. Skim Whey Powder Labor Breakdown by Category ...................................36Figure 46. Comparison of Payroll Breakdown for Skim Whey Powder Plant Employees ..................................................................................................36
For Condensed Skim and Cream Studies:
Figure 47. Annual Condensed Skim Production ...........................................................37Figure 48. Comparison of Processing Costs for Condensed Skim ..............................37Figure 49. Breakdown of Condensed Skim Processing Costs .....................................38Figure 50. Annual Cream Production ...........................................................................39 Figure 51. Comparison of Processing Costs for Cream ...............................................39Figure 52. Breakdown of Cream Processing Costs......................................................39

6 California Manufacturing Cost Annual
IntroductionIntroduction
appropriate minimum prices for products categorized as Class 4a (butter and dried milk products) and Class 4b (cheese and dry whey products). To comply with the legislative decree, the Department has a direct need for gathering and summarizing information provided in the cost studies to formulate reasonable manufacturing cost (make) allowances through the public hearing process.
The Department maintains a Manufacturing Cost Unit that collects and summarizes cost data from California dairy manufacturing plants. Any plant that produces Class 4a or Class 4b products may be asked to participate in the cost studies. Information gathered in the studies provides an accurate sampling of California’s annual butter, nonfat dry milk (NFDM), skim whey powder, and Cheddar cheese production. Study participants typically account for over 90 percent of the products manufactured in California. Data on cream and condensed skim is collected concurrently from plants that participate. Plants that manufacture cream and condensed skim but do not manufacture butter, NFDM, skim whey powder or Cheddar cheese are not included in the study. As a result, data on cream and condensed skim is based on a much lower percentage of annual production.
The data from the cost studies has a practical signifi cance beyond the boundaries of California. They are the only studies in the U.S. which present the audited and detailed processing costs of butter, NFDM, skim whey powder and Cheddar cheese plants over a period of several years. The studies are conducted by professional auditors specializing in dairy accounting practices. The auditors review plant records on-site and work with plant management to collect data on all aspects of the operation. The auditors also determine allocations of plant expenditures for each product manufactured by the plant. For the plants in the study, the results can help to isolate the actual costs of manufacturing and give benchmark fi gures obtained from other California manufacturing plants. Consequently, although the Department has the legal authority to collect cost information from the various types of milk processing plants, most plants fi nd the study and resulting comparisons valuable and cooperate in the cost studies voluntarily.
Highlights of the Manufacturing Cost Studies
Each plant in the study gave access to cost data for a 12-month period January 2006 to De-cember 2006. The 2007 manufacturing cost annual includes data obtained from 7 butter plants, 8 NFDM plants, 3 skim whey powder plants, 7 Cheddar cheese plants, and 7 con-densed skim plants and 7 cream plants. This years’ annual report accounts for 95 percent of the butter, 95 percent of the NFDM, 73 percent of the skim whey powder, and 98 percent of the total Cheddar and Monterey Jack cheese produced in California. Since about half the plants process and sell bulk cream and /or condensed skim, data was also accumulated for these products.
T he California Food and Agricultural Code specifi es that the Department of Food and Agriculture (Department) must consider manufacturing costs in determining

California Manufacturing Cost Annual 7
Figure 1. Comparison of Costs by Category for California Manufacturing Plants
Labor Was the Largest Cost Component
The largest single category contributing to overall processing costs for most of the studies was labor (Figure 1). Labor was on average 36 percent of total butter processing costs, 22 percent of NFDM processing costs, 25 percent of Cheddar cheese processing costs, and 19 percent of skim whey powder processing cost. The dollar impact of other cost cat-egories varied by product type. Utility costs accounted for 29 percent of NFDM process-ing costs, 8 percent of butter processing costs, 17 percent of Cheddar cheese processing costs, and 24 percent of skim whey powder processing costs. Depreciation and lease expenses account for 8 percent of Cheddar cheese processing costs, 7 percent of butter processing costs, 8 percent of NFDM processing costs, and 16 percent of total skim whey powder processing costs. This publication is divided into sections identifi ed by product, e.g., Cheddar Cheese, Butter, NFDM, Skim Whey Powder, and includes an added section containing Condensed Skim and Cream processing information. Within each section a summary table is included to describe categorized processing costs, and bar charts identify the distribution of costs among the study plants. Pie charts are also utilized to detail the overall contribution of individual cost categories to the overall cost structure.
0.0%
10.0%
20.0%
30.0%
40.0%
50.0%
60.0%
70.0%
80.0%
90.0%
100.0%
CheddarCheese
Butter NFDM Skim WheyPowder
Processing Labor
Repairs, Maintenance& Plant Supplies
Depreciation, PropertyTaxes
Packaging
General &Administrative
Return on Investment
Utilities
Non-Dairy Ingredients
Other Expenses

8 California Manufacturing Cost Annual
January through December 2006, representing 98 percent of the Cheddar and Monterey Jack cheese processed in California that year. To avoid revealing plant specifi c information, each plant was assigned to one of two cost groups based on total processing costs. While calculations were derived from 40 lb. block Cheddar cheese products only, cheese plants typically manufacture other cheese products and a variety of by-products (Figure 2). The cost summary statistics displayed provide us a quantitative profi le of California’s Cheddar cheese production, including production statistics, processing costs per pound, and cheese vat information (Tables 1 and 2).
• Labor costs were the single largest expense contributing to the overall cost of production (Figure 1). On a weighted average, processing labor ranged from 4.0¢ per pound in the low cost group to 6.5¢ per pound in the high cost group. Processing Labor accounted for 25 percent of the total manufacturing cost.
• Processing non-labor costs include utilities, depreciation and property taxes, repairs and maintenance, and supplies expenses.
• General and Administrative (G & A) costs were on a weighted average 1.8¢ per pound and include all expenses incurred in the direction, control, and management of the company. Examples of G & A costs are administrative payroll costs, offi ce supplies, short-term interest, and headquarters fees.
• The ROI allowance is an opportunity cost and represents how much interest the company could have earned if its capital was not tied up in land, buildings and equipment. In other words, it is viewed as an alternative source of income had the company invested its capital elsewhere. A higher ROI cost suggests that either a plant is relatively new with little accumulated depreciation of its assets (high book value) or that it is an established plant with low production volume.
• Surprisingly, packaging costs for the low cost group were at 2.1¢ per pound, 27 percent higher than the high cost groups packaging cost of 1.7¢ per pound.
C ost studies were completed on seven cheese plants for 2006. The seven plants processed 826.8 million pounds of cheese during the 12-month period,
Cheese StudyCheese Study

California Manufacturing Cost Annual 9
Table 1. Processing Costs for Seven California Cheddar Cheese Plants
Categories Low CostGroup
High CostGroup
CURRENTWeightedAverage
Cost All Plants Jan-Dec 2006
PRIOR YEARWeightedAverage
Cost All Plants Jan-Dec 2005
ActualDifference
Current LessPrior Year
Number of Plants 3 4 7 7 7 7 --
Processing Labor $0.0403 $0.0648 $0.0391 $0.0907 $0.0499 $0.0498 $0.0001
Processing Non-Labor $0.0882 $0.0975 $0.0624 $0.1228 $0.0918 $0.0850 $0.0068
Packaging $0.0210 $0.0165 $0.0114 $0.0231 $0.0192 $0.0193 -$0.0001
Other Ingredients $0.0085 $0.0162 $0.0070 $0.0439 $0.0115 $0.0117 -$0.0002
General & Administrative $0.0206 $0.0145 $0.0080 $0.0239 $0.0182 $0.0174 $0.0008
Return on Investment $0.0076 $0.0091 $0.0034 $0.0131 $0.0082 $0.0082 $0.0000
Average Total Cost $0.1862 $0.2186 -- -- $0.1988 $0.1914 $0.0074
Volumn in Group (Lbs.) 503,547,827 323,272,371 -- -- 826,820,198 826,583,500 --
% Volume by Group 60.9% 39.1% -- -- 100.0% 100.0% --
CHEESE MANUFACTURING COSTSCURRENT Study Period: January through December 2006
With Comparison to the same time period PRIOR YEAR (2005)
Manufacturing cost data were collected and summarized from seven California cheese plants. The seven plants processed 826 million pounds of cheese during the 12-month study period, January through December 2006, representing over 97% of the Cheddar and Monterey Jack cheese processed in California.
The volume total includes both Cheddar and Monterey Jack cheeses, but the costs reflect only costs for 40 lb. blocks of Cheddar.
Three plants processed 500-lb. barrels or 640-lb. blocks. Packaging costs and packaging labor for 40-lb. blocks were substituted for these plants.
To obtain the weighted average, individual plant costs were weighted by their cheese processing volume relative to the total volume of cheese processed by all plants included in the cost study.
For all cheese: the weighted average yield was 12.24 lbs. of cheese per hundredweight of milk. The weighted average moisture was 37.03% and weighted average vat tests were 4.40% fat and 9.33% SNF.
For 40-lb. blocks: the weighted average yield was 12.62 lbs. of cheese per hundredweight of milk. The weighted average moisture was 38.08% and weighted average vat tests were 4.24% fat and 9.10% SNF.
For this study period, approximately 0% of the cheese was processed at a cost less than the current manufacturing cost allowance for cheese of $0.178 per pound.
Breakdown of Cheese Manufacturing Costs - January through December 2006
Range of Costs
Minimum Maximum
Dollars Per Pound of Cheese
Processing Labor: Labor costs associated with processing of product, including wages, payroll taxes and fringe benefits.Processing Non-Labor: Includes costs such as utilities, repairs and maintenance, laundry, supplies, depreciation, plant insurance, and rent.Packaging: Includes all non-reusable items used in the packaging of the product, such as boxes, bags, cartons, liners, tape, glue and stretch wrap.Other Ingredients: Includes salt, color, and rennet.General & Administrative: Includes expenses in the management of the company, such as: office supplies,short-term interest, dues and subscriptions, accounting fees, headquarter charges, office clerical wages and executive salaries.Return on Investment: Calculated by subtracting accumulated depreciation from the original cost of assts, with the remaining book value multiplied by Moody's "BAA" corporate bond index.

10 California Manufacturing Cost Annual
Table 2. Cheddar Cheese Production Parameters from Cost Studies1
1 Moisture, vat tests and yields refl ect levels achieved for Cheddar cheese only.
Cost Finished Vat Fat Vat SNF VatGroup Moisture % Test % Test % Yield (Lbs.)
Low 36.77% 4.78% 9.67% 13.04%
High 37.45% 3.80% 8.79% 11.00%
Wt'd Avg. 37.03% 4.40% 9.33% 12.24%
While the summary analyses of the cost studies that have been published historically have provided many insights into Cheddar cheese operations in California, they do not address some of the most basic features of the plants and how different costs compare among the plants in the study. In the following section, summary statistics provide an indication of how much variation exists among plants producing Cheddar cheese.
Throughout this section, column charts are used to show the distribution of the plants within a specifi ed category or the breakdown of costs. Charts provide us an indication of the variation existing among the plants and the relative impact that individual cost categories have upon production.
To obtain the weighted average, individual plant costs were weighted by their cheese processing volume relative to the total volume of cheese processed by all the plants included in the cost study.
Characteristics of Cheddar Cheese Plants

California Manufacturing Cost Annual 11
Figure 2. Simplifi ed Product Flow in a Cheese Plant with By-Product Processing

12 California Manufacturing Cost Annual
Figure 3. Breakdown of Cheddar Cheese Processing Costs
Figure 4. Breakdown of Cheddar Cheese Packaging Sizes
ProcessingLabor25%
PackagingExpense
10%
500 lb. Barrels
8%
640 lb. Blocks29%
40 lb. Blocks63%
Return OnInvestment
4%
Gen & AdminExpenses 9%
Misc. IngredientCosts 6%
Repairs, Maintenance & Plant Supplies
11%
Other10%
Utilities17%
Depreciation& Property Taxes 8%

California Manufacturing Cost Annual 13
Figure 5. Annual California Cheddar and Jack Cheese Production
Figure 7. Share of California Cheddar and Jack Cheese Production by Ownership Type and by Workforce Type
Average = 118 million poundsMedian = 84 million poundsAverage Low Cost Group = 168 million poundsAverage High Cost Group = 81 million pounds
• Generally speaking, the cost of manufacturing is typically lower for the large production plants.
Average = 20.3¢ per poundWt’d Average = 19.9¢ per poundMedian = 19.4¢ per poundAverage Low Cost Group = 18.6¢ per poundAverage High Cost Group = 21.9¢ per pound
• Manufacturing costs ranged from 18.2¢ per pound to 23.1¢ per pound.
• Three plants kept manufacturing costs under 19¢ per pound.
Num
ber o
f Pla
nts
Num
ber o
f Pla
nts
Proprietary64%
Cooperative36%
Cents per Pound of CheeseMillion Pounds of Cheese
0
1
2
3
4
5
<30.0 30.0-90.0 90.1-170.0 >170.00
1
2
3
4
5
<19.0 19.0-20.5 20.6-22.0 >22.0
Figure 6. Manufacturing Cost per Pound
Non-Union32%
Union68%
14 California Manufacturing Cost Annual
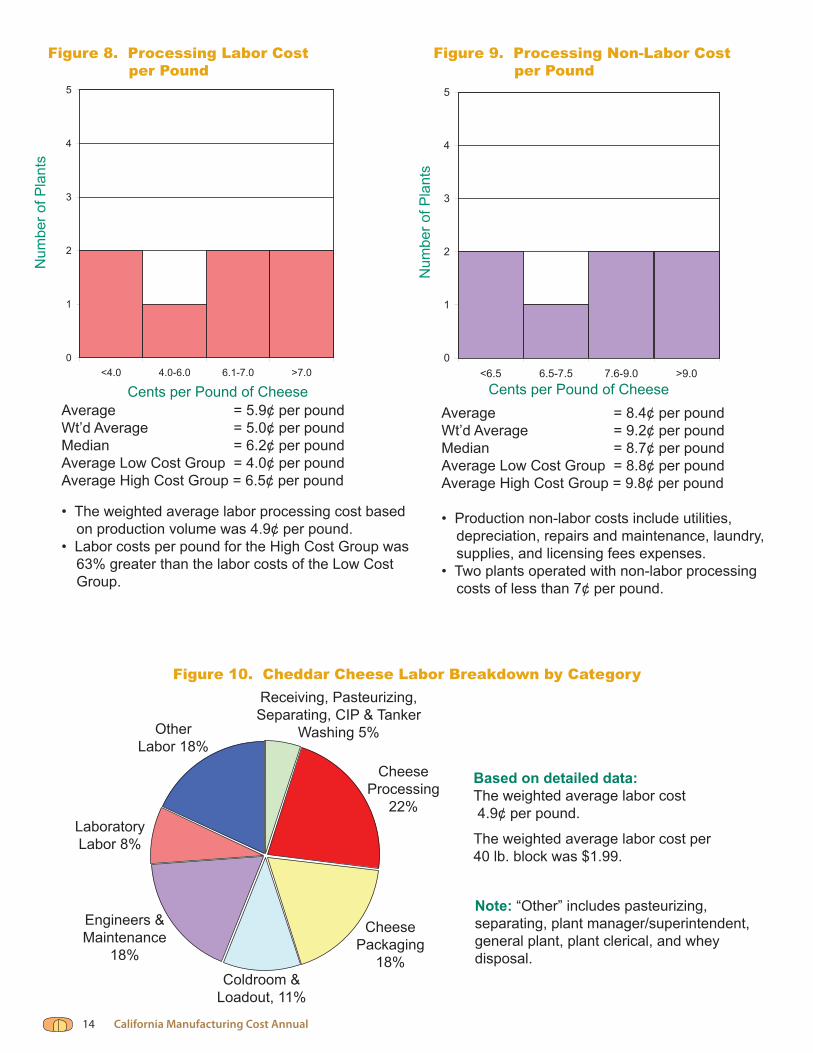
Figure 8. Processing Labor Cost per Pound
Figure 9. Processing Non-Labor Cost per Pound
Figure 10. Cheddar Cheese Labor Breakdown by Category
Average = 5.9¢ per poundWt’d Average = 5.0¢ per poundMedian = 6.2¢ per poundAverage Low Cost Group = 4.0¢ per poundAverage High Cost Group = 6.5¢ per pound
• The weighted average labor processing cost based on production volume was 4.9¢ per pound.
• Labor costs per pound for the High Cost Group was 63% greater than the labor costs of the Low Cost Group.
Average = 8.4¢ per poundWt’d Average = 9.2¢ per poundMedian = 8.7¢ per poundAverage Low Cost Group = 8.8¢ per poundAverage High Cost Group = 9.8¢ per pound
• Production non-labor costs include utilities, depreciation, repairs and maintenance, laundry, supplies, and licensing fees expenses.
• Two plants operated with non-labor processing costs of less than 7¢ per pound.
Based on detailed data:The weighted average labor cost 4.9¢ per pound.
The weighted average labor cost per 40 lb. block was $1.99.
Note: “Other” includes pasteurizing, separating, plant manager/superintendent, general plant, plant clerical, and whey disposal.
Num
ber o
f Pla
nts
Num
ber o
f Pla
nts
Coldroom & Loadout, 11%
LaboratoryLabor 8%
Receiving, Pasteurizing, Separating, CIP & Tanker
Washing 5%
Engineers &Maintenance
18%
OtherLabor 18%
CheesePackaging
18%
Cheese Processing
22%
Cents per Pound of Cheese Cents per Pound of Cheese
0
1
2
3
4
5
<6.5 6.5-7.5 7.6-9.0 >9.00
1
2
3
4
5
<4.0 4.0-6.0 6.1-7.0 >7.0

California Manufacturing Cost Annual 15
Figure 12. Repairs, Maintenance, and Supplies Cost per PoundFigure 11. Utility Cost per Pound
Num
ber o
f Pla
nts
Num
ber o
f Pla
nts
Average = 2.2¢ per poundWt’d Average = 2.3¢ per poundMedian = 1.5¢ per poundAverage Low Cost Group = 1.5¢ per poundAverage High Cost Group = 2.7¢ per pound
• Repairs and maintenance represented 52% and supplies 48% of this category cost.
• The weighted average repairs, maintenance, and supplies cost for cheese was 2.3¢ per pound.
Average = 3.1¢ per poundWt’d Average = 3.4¢ per poundMedian = 3.1¢ per poundAverage Low Cost Group = 3.3¢ per poundAverage High Cost Group = 2.9¢ per pound
• Utility costs ranged from 2.2¢ to 3.8¢ per pound.
• Natural gas charges represented 38% of the average utility cost while electricity represented 33%. Sewage, water, and whey disposal make up the remaining 29% of cost.
Cents per Pound of Cheese Cents per Pound of Cheese
0
1
2
3
4
5
<2.5 2.5-3.0 3.1-3.6 >3.6
0
1
2
3
4
5
<1.5 1.5-2.0 2.1 - 3.5 >3.5

Co
sts
in D
oll
ars
Pe
r P
ou
nd
of
Ch
ee
se
16 California Manufacturing Cost Annual
Figure 13: Comparison of Payroll Breakdown for Plant Employees, Hourly and Salaried
Figure 14. Cheese Processing Cost Comparison, 2004, 2005, 2006
Hourly Employees Salaried Employees
PayrollTaxes 11%
Wages69%
FringeBenefi ts
20%
FringeBenefi ts
15%
PayrollTaxes 10%
Wages75%
$0.00
$0.01
$0.02
$0.03
$0.04
$0.05
$0.06
$0.07
$0.08
$0.09
$0.10
ProcessingLabor
ProcessingNon-Labor
Packaging OtherIngredients
General &Administrative
Return onInvestment
Jan-Dec 2004 Jan-Dec 2005 Jan-Dec 2006
* Wages include vacation, sick leave, and holiday pay.* Payroll taxes includes FICA, FUTA, SUTA, and Workers Compensation.

California Manufacturing Cost Annual 17
2006 through December 2006, representing 95 percent of the butter processed in California. Statistics indicate the per pound costs for each of the manufacturing processes (Table 3). To avoid revealing plant-specifi c information, the seven plants were assigned to one of two groups according to total processing costs. Only costs for bulk butter (25 kg and 68 lb. boxes) were analyzed although most plants produce a variety of other size packaging (Figure 17).
• The “Processing Non-Labor” category includes costs such as utilities, repairs and maintenance, supplies, depreciation, and rent, with total costs ranging from 4.2¢ in the low cost group to 6.3¢ per pound in the high cost group.
• General and Administrative (G & A) costs were on average 1.6¢ per pound and include all expenses incurred in the direction, control, and management of the company. Examples of G & A costs are administrative payroll costs, offi ce supplies, short-term interest, and headquarters fees.
• The return on investment (ROI) allowance is calculated by subtracting accumulated depreciation from the original cost of fi xed assets. The remaining book value is multiplied by the Moody’s “BAA” corporate bond index. The amounts are then allocated to production employing the same methods used to allocate depreciation expense. In the butter studies, the total weighted average ROI cost accounts for a little over 5 percent of the total weighted average cost of production.
C ost studies were completed on seven butter plants for 2006. The seven plants processed 424.6 million pounds of butter during the 12-month period, January
Butter StudyButter Study

18 California Manufacturing Cost Annual
Table 3. Processing Costs for Seven California Butter Plants
Categories Low CostGroup
High CostGroup
CURRENTWeightedAverage
Cost All Plants Jan-Dec 2006
PRIOR YEARWeightedAverage
Cost All Plants Jan-Dec 2005
ActualDifference
Current LessPrior Year
Number of Plants 3 4 7 7 7 8 --
Processing Labor $0.0417 $0.0612 $0.0345 $0.1148 $0.0498 $0.0528 -$0.0030
Processing Non-Labor $0.0423 $0.0627 $0.0364 $0.0695 $0.0508 $0.0514 -$0.0006
Packaging $0.0103 $0.0116 $0.0095 $0.0122 $0.0108 $0.0104 $0.0004
Other Ingredients $0.0024 $0.0039 $0.0017 $0.0045 $0.0030 $0.0041 -$0.0011
General & Administrative $0.0134 $0.0193 $0.0059 $0.0239 $0.0159 $0.0147 $0.0012
Return on Investment $0.0064 $0.0079 $0.0018 $0.0096 $0.0070 $0.0074 -$0.0004
Average Total Cost $0.1165 $0.1666 -- -- $0.1373 $0.1408 -$0.0035
Volumn in Group (Lbs.) 247,655,028 176,965,541 -- -- 424,620,569 396,627,948 --
% Volume by Group 58.3% 41.7% -- -- 100.0% 100.0% --
BUTTER MANUFACTURING COSTSCURRENT Study Period: January through December 2006
With Comparison to the same time period PRIOR YEAR (2005)
Manufacturing cost data were collected and summarized from seven California butter plants. The seven plants processed 424.6 million pounds of butter during the 12-month study period, January through December 2006, representing 94.7% of the butter processed in California.
The volume total includes both bulk butter and cut butter, but the costs reflect only costs for bulk butter (25 kg and 68 lb. blocks).
To obtain the weighted average, individual plant costs were weighted by their butter processing volume relative to the total volume of butter processed by all plants included in the cost study.
For this study period, approximately 61% of the butter was processed at a cost less than the current manufacturing cost allowance for butter of $0.156 per pound.
Breakdown of Butter Manufacturing Costs - January through December 2006
Range of Costs
Minimum Maximum
Dollars Per Pound of Butter
Processing Labor: Labor costs associated with processing of product, including wages, payroll taxes and fringe benefits.
Return on Investment: Calculated by subtracting accumulated depreciation from the original cost of assts, with the remaining book value multiplied by Moody's "BAA" corporate bond index.
Processing Non-Labor: Includes costs such as utilities, repairs and maintenance, laundry, supplies, depreciation, plant insurance, and rent.Packaging: Includes all non-reusable items used in the packaging of the product, such as boxes, bags, cartons, liners, tape, glue and stretch wrap.Other Ingredients: Includes salt, color.General & Administrative: Includes expenses in the management of the company, such as: office supplies,short-term interest, dues and subscriptions, accounting fees, headquarter charges, office clerical wages and executive salaries.

California Manufacturing Cost Annual 19
Figure 15. Simplifi ed Flowchart of a Butter and Nonfat Dry Milk Plant
Characteristics of Butter Plants
In the following section, summary statistics provide a comparison of costs and indicate how much variation exists among the individual butter plants. Column charts are used to show the distribution of plants within a specifi ed category or the breakdown of costs by category. Graphs provide an indication of the variation existing among the plants and the relative impact of individual cost categories upon total manufacturing costs.
The “weighted average” cost takes into account the proportional relevance of pounds produced, and the “median” is the middle point at which half of the plants are above and half of the plants are below a given fi gure.

20 California Manufacturing Cost Annual
Figure 16. Breakdown of Butter Processing Costs
Figure 17. Breakdown of Butter Packaging Sizes and Types
Non-DairyIngredients
2%
Utilities 8%
Depreciation & Property Taxes 7%
General & Administrative
12%
Repairs, Maintenance & Plant Supplies
12%
Other Expenses
10%
Processing Labor 36%
Packaging 8%
Return on Investment 5%
Salted (1/4 lb) 27%
Other 4%
Sweet Bulk 12%
Sweet (1 lb) 9%
Salted (1 lb) 12%
Sweet (1/4 lb)
6%
Salted Bulk30%

California Manufacturing Cost Annual 21
Figure 19. Butter Manufacturing Cost per Pound
Figure 18. Annual California Butter Production
Figure 20. Share of California Butter Production by Ownership Type and by Workforce Type
Average = 61 million poundsMedian = 63 million poundsAverage Low Cost Group = 83 million poundsAverage High Cost Group = 44 million pounds
• The three largest producers combined production was 6.5 times that of the three smallest producers.
Average = 15.0¢ per poundWt’d Average = 13.7¢ per poundMedian = 15.3¢ per poundAverage Low Cost Group = 11.7¢ per poundAverage High Cost Group = 16.7¢ per pound
• When weighted against production, the plants in the Low Cost Group manufactured butter for less than 12¢ per pound.
Num
ber o
f Pla
nts
Num
ber o
f Pla
nts
Union85%
Non-Union15%Proprietary
8%
Cooperative92%
Million Pounds of Butter Cents per Pound of Butter
0
1
2
3
4
5
<25.0 25.0-35.0 35.1-120.0 >120.00
1
2
3
4
5
<14.0 14.0-16.0 16.1-25.0 >25.0

22 California Manufacturing Cost Annual
Figure 21. Processing Labor Cost per Pound
Figure 22. Processing Non-Labor Cost per Pound
Figure 23. Butter Labor Breakdown by Category
Average = 5.9¢ per poundWt’d Average = 5.0¢ per poundMedian = 5.8¢ per poundAverage Low Cost Group = 4.2¢ per poundAverage High Cost Group = 6.1¢ per pound
• All plants in the Low Cost Group kept labor costs to less than 4.3¢ per pound.
• The plant whose labor costs was the highest had labor costs more than three times that of the lowest cost plant.
Average = 5.6¢ per poundWt’d Average = 5.1¢ per poundMedian = 6.2¢ per poundAverage Low Cost Group = 4.2¢ per poundAverage High Cost Group = 6.3¢ per pound
• Non-labor costs included utilities, depreciation, repairs and maintenance, laundry, supplies, and licensing fees expenses.
Based on detailed data:Labor cost averaged 5.9¢ per poundLabor cost averaged $3.25 per 25 kg box
Num
ber o
f Pla
nts
Num
ber o
f Pla
nts
Coldroom & Loadout 6%
Laboratory 4%
Receiving & Tank Wash 5%
Engineers &Maintenance 8%
Other Processing
Labor 10%
Butter Churn37%
Butter Packaging
28%
Note: “Other” includes plant manager/superintendent, general plant, and plant clerical.
Cents per Pound of Butter Cents per Pound of Butter
0
1
2
3
4
5
<4.5 4.5-6.0 6.1-7.6.5 >6.50
1
2
3
4
5
<4.5 4.5-5.5 5.6-10.0 >10.0
Warehouse1% Separating & Pasteurizing 1%

California Manufacturing Cost Annual 23
Figure 24. Utility Cost per PoundN
umbe
r of P
lant
s
Num
ber o
f Pla
nts
Average = 1.4¢ per poundWt’d Average = 1.6¢ per poundMedian = 1.2¢ per poundAverage Low Cost Group = 1.1¢ per poundAverage High Cost Group = 1.7¢ per pound
• Repairs, maintenance, and supplies costs ranged from .07¢ to 2.6¢ per pound.
• Only two plants’ repairs, maintenance, and supplies costs exceeded 2.0¢ per pound.
Average = 1.6¢ per poundWt’d Average = 1.1¢ per poundMedian = 1.6¢ per poundAverage Low Cost Group = 1.1¢ per poundAverage High Cost Group = 1.9¢ per pound
• Most plants in the study kept utility costs under 1.7¢ per pound.
Cents per Pound of Butter Cents per Pound of Butter
Figure 25. Repairs, Maintenance, and Supplies Cost per PoundIncludes cost of natural gas, fuel oil, electricity,
and sewage
0
1
2
3
4
5
<1.0 1.0 - 1.5 1.6 - 2.0 >2.00
1
2
3
4
5
<1.0 1.0-1.5 1.6-2.0 >2.0

24 California Manufacturing Cost Annual
Figure 27. Butter Processing Cost Comparison, 2004, 2005, 2006
Figure 26: Comparison of Payroll Breakdown for Plant Employees and Salaried Employees
Hourly Employees Salaried EmployeesPayroll
Taxes 10%
Wages68%
FringeBenefi ts
22%
Wages75%
FringeBenefi ts
14%
PayrollTaxes 11%
$0.00
$0.01
$0.02
$0.03
$0.04
$0.05
$0.06
ProcessingLabor
ProcessingNon-Labor
Packaging OtherIngredients
General &Administrative
Return onInvestment
Jan-Dec 2004 Jan-Dec 2005 Jan-Dec 2006
Co
sts
in D
oll
ars
Pe
r P
ou
nd
of
Bu
tte
r
* Wages include vacation, sick leave, and holiday pay.* Payroll taxes includes FICA, FUTA, SUTA, and Workers Compensation.

California Manufacturing Cost Annual 25
plant size and per pound processing costs for the various categories (Table 4). To avoid revealing plant-specifi c information, the eight plants were assigned to one of two groups according to total processing cost. Only costs for bagged NFDM were analyzed although high-volume totes accounted for 22 percent of production (Figure 30).
• The data indicates that the lower cost NFDM plants in the state tended to be the larger plants. Specifi cally, the four low cost plants in the study produced 81 percent of the NFDM studied.
• Labor costs were signifi cant. Processing labor ranged from a weighted average of 3.4¢ per pound in the low cost group to an average of 4.6¢ per pound in the high cost group, a difference of 35 percent.
• Processing non-labor costs were larger than labor costs but included several different plant expenses, such as utilities, depreciation, repairs and maintenance, laundry, supplies, and plant insurance. The combined costs of which ranged from 9.3¢ per pound in the low cost group to 11.3¢ per pound in the high cost group.
• General and Administrative (G & A) costs were on average 1.1¢ per pound and include all expenses incurred in the direction, control, and management of the company. Examples of G & A costs are administrative payroll costs, offi ce supplies, short-term interest, and headquarters fees.
• The return on investment (ROI) allowance is calculated by subtracting accumulated depreciation from the original cost of fi xed assets. The remaining book value is multiplied by the Moody’s “BAA” corporate bond index. The amounts are then allocated to the products in the plant based on the same methods used to allocate depreciation expense. ROI costs for the eight NFDM plants were on average .0079¢ per pound.
• The low cost group’s packaging costs were 1.5¢ per pound. At 1.4¢ per pound, packaging costs were actually lower for the high cost group.
C ost studies were completed on eight nonfat dry milk (NFDM) plants for 2006. Plant cost summary statistics based on the study plants give an indication of
Nonfat Dry Milk StudyNonfat Dry Milk Study

26 California Manufacturing Cost Annual
Table 4. Processing Costs for Eight California Nonfat Dry Milk Plants
Categories Low CostGroup
Medium CostGroup
CURRENTWeightedAverage
Cost All Plants Jan-Dec 2006
PRIOR YEARWeightedAverage
Cost All Plants Jan-Dec 2005
ActualDifference
CurrentLess
Prior Year
Number of Plants 4 4 0 8 8 8 9 -1.0000
Processing Labor $0.0339 $0.0459 $0.0000 $0.0258 $0.0780 $0.0362 $0.0377 -$0.0015
Processing Non-Labor $0.0925 $0.1132 $0.0000 $0.0826 $0.2337 $0.0965 $0.0961 $0.0004
Packaging $0.0149 $0.0138 $0.0000 $0.0112 $0.0151 $0.0147 $0.0143 $0.0004
General & Administrative $0.0100 $0.0156 $0.0000 $0.0091 $0.0334 $0.0111 $0.0096 $0.0015
Return on Investment $0.0070 $0.0118 $0.0000 $0.0040 $0.0116 $0.0079 $0.0082 -$0.0003
Average Total Cost $0.1583 $0.2003 $0.0000 -- -- $0.1664 $0.1659 $0.0005
Volumn in Group (Lbs.) 433,519,945 102,850,525 0 -- -- 536,370,470 471,894,459 --
% Volume by Group 80.8% 19.2% 0.0% -- -- 100.0% 100.0% --
NONFAT POWDER MANUFACTURING COSTSCURRENT Study Period: January through December 2006
With Comparison to the same time period PRIOR YEAR (2005)
Manufacturing cost data were collected and summarized from eight California nonfat powder plants. The eight plants processed 536.3 million pounds of nonfat powder during the 12-month study period, January through December 2006, representing 87.47% of the nonfat powder processed in California.
The volume total includes all grades of nonfat powder packaged in any container size, but the costs reflect only costs for 25 kg and 50 lb. bags of nonfat powder.
To obtain the weighted average, individual plant costs were weighted by their nonfat powder processing volume relative to the total volume of nonfat powder processed by all plants included in the cost study.
For this study period, approximately 28% of the nonfat powder was processed at a cost less than the current manufacturing cost allowance for nonfat powder of $0.160 per pound.
Breakdown of Nonfat Powder Manufacturing Costs - January through December 2006
Range of Costs
Minimum Maximum
Dollars Per Pound of Nonfat Powder
Processing Labor: Labor costs associated with processing of product, including wages, payroll taxes and fringe benefits.Processing Non-Labor: Includes costs such as utilities, repairs and maintenance, laundry, supplies, depreciation, plant insurance, and rent.Packaging: Includes all non-reusable items used in the packaging of the product, such as boxes, bags, cartons, liners, tape, glue and stretch wrap.General & Administrative: Includes expenses in the management of the company, such as: office supplies,short-term interest, dues and subscriptions, accounting fees, headquarter charges, office clerical wages and executive salaries.Return on Investment: Calculated by subtracting accumulated depreciation from the original cost of assts, with the remaining book value multiplied by Moody's "BAA" corporate bond index.

California Manufacturing Cost Annual 27
Figure 28. Simplifi ed Flowchart of a Butter and Nonfat Dry Milk Plant
Throughout this section, column charts are used to show the distribution of plants within a specifi ed category or the breakdown of costs by category. The charts give an indication of the variation existing among the plants and the relative impact of individual cost categories upon production.
Summary statistics are provided to indicate how much variation exists among NFDM plants.
• To obtain the weighted average, individual plant costs were weighted by their NFDM processing volume relative to the total volume of NFDM processed by all the plants included in the cost study.
• The “median” is the midpoint in the data and indicates the point at which half of the plants are above and half the plants are below a given fi gure.
Characteristics of Nonfat Dry Milk Plants

28 California Manufacturing Cost Annual
ProcessingLabor22%
Other Misc(Non-Labor)
8%Packaging
9%
Multi-Wall Bags(25 kg & 50 lbs.)
78%
Totes(1,800-2,500 lbs.)
22%
Return OnInvestment
5%
Gen & AdminExpenses
7%
Figure 29. Breakdown of Nonfat Dry Milk Processing Costs
Figure 30. Breakdown of Nonfat Dry Milk Packaging Sizes
Utilities 29%
Depreciation & Property Taxes 7%
Repairs, Maintenance & Supplies
13%

California Manufacturing Cost Annual 29
Figure 32. NFDM Manufacturing Cost per Pound
Figure 31. Annual California Nonfat Dry Milk Production
Figure 33. Share of California Nonfat Dry Milk Production by Ownership Type and by Workforce Type
Average = 67 million poundsMedian = 45 million poundsAverage Low Cost Group = 108 million poundsAverage High Cost Group = 26 million pounds
• Together, two plants produced over 275 million pounds of NFDM, representing more than 50% of the total volume presented.
• The Low Cost Group produced more than four times the amount of NFDM than the High Cost Group.
Average = 20.4¢ per poundWt’d Average = 16.6¢ per poundMedian = 17.2¢ per poundAverage Low Cost Group = 15.8¢ per poundAverage High Cost Group = 20.0¢ per pound
• Four plants produced NFDM at or below the weighted average cost of 16.6¢ per pound.
• NFDM production costs ranged from slightly more than 15¢ to almost 37¢ per pound.
• Typically, high volume plants operated with lower costs.
Num
ber o
f Pla
nts
Num
ber o
f Pla
nts
Union89%
Non-Union11%
Proprietary 6%
Cooperative94%
Cents per Pound of NFDMMillion Pounds of NFDM
0
1
2
3
4
5
<14.0 14.0-30.0 30.1-80.0 >80.00
1
2
3
4
5
<16.0 16.0-20.0 20.1-30.0 >30.0

30 California Manufacturing Cost Annual
Figure 34. NFDM Processing Labor Cost per Pound
Figure 35. NFDM Processing Non-Labor Cost per Pound
Figure 36. Nonfat Dry Milk Labor Breakdown by Category
Average = 4.9¢ per poundWt’d Average = 3.6¢ per poundMedian = 3.7¢ per poundAverage Low Cost Group = 3.4¢ per poundAverage High Cost Group = 4.6¢ per pound
• Only two of eight plants had labor costs over 6¢ per pound, while fi ve of the eight plants managed to keep labor costs under 4¢ per pound.
Average = 11.8¢ per poundWt’d Average = 9.6¢ per poundMedian = 10.1¢ per poundAverage Low Cost Group = 9.3¢ per poundAverage High Cost Group = 11.3¢ per pound
• The variation in processing non-labor costs was great.
• Costs ranged from less than 9¢ to more than 23¢ per pound.
Based on detailed data:Labor cost averaged 4.9¢ per poundLabor cost averaged $2.69 per 25 kg bag
Note: “Other” includes plant manager/superintendent, general plant, plant clerical, and fi eld men.
Num
ber o
f Pla
nts
Num
ber o
f Pla
nts
Warehouse& Loadout
9%
Laboratory 7%
Receiving, Pasteurizing, Separating, & CIP 9%
Engineers &Maintenance
14%
Other 23%
Dryer12%
Bagger 19%
Cents per Pound of NFDM Cents per Pound of NFDM
Evaporator7%
0
1
2
3
4
5
<3.0 3.0-5.0 5.1-8.0 >8.00
1
2
3
4
5
<9.0 9.0-10.0 10.1-12.0 >12.0

California Manufacturing Cost Annual 31
Figure 37. Utility Cost per PoundN
umbe
r of P
lant
s
Num
ber o
f Pla
nts
Average = 2.3¢ per poundWt’d Average = 2.2¢ per poundMedian = 2.2¢ per poundAverage Low Cost Group = 1.9¢ per poundAverage High Cost Group = 2.7¢ per pound
• Four plants had repairs and maintenance costs at or less than 2.0¢ per pound.
Average = 6.5¢ per poundWt’d Average = 4.9¢ per poundMedian = 5.1¢ per poundAverage Low Cost Group = 4.8¢ per poundAverage High Cost Group = 8.1¢ per pound
• The operation of the dryers and evaporators add signifi cantly to the utility cost of power production.
• Natural gas costs account for 54% to 74% of total utility costs.
• Most of the plants kept utility costs between 4¢ and 6¢ per pound.
Cents per Pound of NFDM Cents per Pound of NFDM
Includes cost of natural gas, fuel oil, electricity and sewage
Natural Gas 62%
Electricity 38%
Figure 39. Weighted Average Breakdown of Dollars Spent per Year on Natural Gas and Electricity in NFDM Plants
Figure 38. Repairs, Maintenance, and Supplies Cost per Pound
0
1
2
3
4
5
<4.0 4.0-5.0 5.1-8.0 >8.00
1
2
3
4
5
<1.4 1.4-2.0 2.1-2.9 >2.9

32 California Manufacturing Cost Annual
Figure 41. NFDM Processing Cost Comparison, 2004, 2005, 2006
Figure 40: Comparison of Payroll Breakdown for Plant Employees and Salaried Employees
Hourly Employees Salaried Employees
PayrollTaxes 10%
Wages67%
FringeBenefi ts
14%
PayrollTaxes 11%
Wages75%
FringeBenefi ts
23%
$0.00
$0.01
$0.02
$0.03
$0.04
$0.05
$0.06
$0.07
$0.08
$0.09
$0.10
Processing Labor Processing Non-Labor
Packaging General &Administrative
Return onInvestment
Jan-Dec 2004 Jan-Dec 2005 Jan-Dec 2006
Co
sts
in D
oll
ars
Pe
r P
ou
nd
of
NF
DM
* Wages include vacation, sick leave, and holiday pay.* Payroll taxes includes FICA, FUTA, SUTA, and Workers Compensation.

California Manufacturing Cost Annual 33
Manufacturing cost data was collected and summarized from three California skim whey powder plants. The three plants processed 84.9 million pounds during the 12 month study
period January through December 2006, representing 73 percent of the total skim whey powder processed in the state. Plant cost summary statistics based on the study plants give an indication of plant size and per pound processing costs for various categories (Table 5).
• As with nonfat dry milk powder, the combined utilities usage costs of producing skim whey powder exceeds that of any other single cost, including labor.
• The weighted average utilities cost was 7.4¢ per pound, which works out to be 28 percent higher than the cost of processing labor: 5.8¢ per pound.
• Combined utilities costs include natural gas, electricity, and water/sewage expense.
• The plant(s) that incurred the lowest costs in the study produced the largest percentage of skim whey powder.
• Packaging costs based on container sizes of 20 kg, 25 kg, and 50 lb bags were on average 1.5¢ per pound.
• The return on investment (ROI) allowance is calculated by subtracting accumulated depreciation from the original cost of fi xed assets. The remaining book value is multiplied by the Moody’s “BAA” corporate bond index. The amounts are then allocated to the products in the plant based on the same methods used to allocate the depreciation expense.
Throughout this section, tables, charts, and graphs are used to present the impact of individual cost categories upon production or to display distribution.
Skim Whey Powder StudySkim Whey Powder Study

34 California Manufacturing Cost Annual
Table 5. Processing Costs for Three California Skim Whey Powder Plants
Categories Cost Group
CURRENTWeightedAverage
Cost All Plants Jan-Dec 2006
PRIOR YEARWeighted Average Cost All Plants Jan-
Dec 2005
ActualDifference
Current LessPrior Year
Number of Plants 3 3 3 3 3 --
Processing Labor $0.0580 $0.0447 $0.0901 $0.0580 $0.0562 $0.0018
Processing Non-Labor $0.1943 $0.1448 $0.5293 $0.1943 $0.1735 $0.0208
Packaging $0.0150 $0.0105 $0.0227 $0.0150 $0.0132 $0.0018
General & Administrative $0.0020 $0.0012 $0.0025 $0.0020 $0.0029 -$0.0009
Return on Investment $0.0406 $0.0324 $0.0896 $0.0406 $0.0393 $0.0013
Average Total Cost $0.3099 -- -- $0.3099 $0.2851 $0.0248
Volumn in Group (Lbs.) 84,898,909 -- -- 84,898,909 97,953,043 --
% Volume by Group 100.0% -- -- 100.0% 100.0% --
Processing Non-Labor: Includes costs such as utilities, repairs and maintenance, laundry, supplies, depreciation, plant insurance, and rent.Packaging: Includes all non-reusable items used in the packaging of the product, such as boxes, bags, cartons, liners, tape, glue and stretch wrap.General & Administrative: Includes expenses in the management of the company, such as: office supplies,short-term interest, dues and subscriptions, accounting fees, headquarter charges, office clerical wages and executive salaries.Return on Investment: Calculated by subtracting accumulated depreciation from the original cost of assts, with the remaining book value multiplied by Moody's "BAA" corporate bond index.
Breakdown of Skim Whey Powder Manufacturing Costs - January through December 2006
Range of Costs
Minimum Maximum
Dollars Per Pound of Skim Whey Powder
Processing Labor: All labor costs associated with processing of product.
Manufacturing cost data were collected and summarized from three California skim whey powder plants. The three plants processed 84.89 million pounds of skim whey powder during the 12-month study period, January through December 2006, representing 79% of the skim whey powder processed in California.
The volume total includes skim whey powder packaged in container sizes of 25 kg and 50 lb. bags.To obtain the weighted average, individual plant costs were weighted by their skim whey powder processing
volume relative to the total volume of skim whey powder processed by all plants included in the cost study.For this study period, one of the three plants processed skim whey powder at costs lower than the current
manufacturing cost allowance for skim whey powder of $0.267 per pound.
SKIM WHEY POWDER MANUFACTURING COSTSCURRENT Study Period: January through December 2006
With Comparison to the same time period PRIOR YEAR (2005)

California Manufacturing Cost Annual 35
ProcessingLabor19%
Other Misc(Non-Labor)
13%Packaging
5%
Natural Gas41%Electricity
49%
Return OnInvestment
13%
Gen & AdminExpenses 1%
Figure 42. Breakdown of Skim Whey Powder Processing Costs
Figure 43. Weighted Average Breakdown of Dollars Spent per Yearon Natural Gas and Electricity in Skim Whey Powder Plants
Utilities 24%
Depreciation & Property Taxes 16% Repairs,
Maintenance & Supplies
9%• Utility costs are comprised of electricity, gas, and water/sewage costs.• Electricity charges represented 48% of the utility costs while natural gas represented 41%.
Water, sewage, and whey disposal account for the remaining 11% of cost.
Water, Sewage, Whey Dispoal
11%

36 California Manufacturing Cost Annual
Figure 44. Share of California Skim Whey Powder Production by Ownership Type and by Workforce Type
Union93%
Non-Union7%
Proprietary60%
Cooperative40%
Figure 45. Skim Whey Powder Labor Breakdown by Category
Based on detailed data:Labor cost averaged 6.6¢ per poundLabor cost averaged $2.94 per 25 kg bagLabor cost averaged $3.97 per 20 kg bagBased on overall production, loadout, bagging, and warehousing costs account for 16% of the total labor costs.
Note: “Other” includes plant manager/superintendent, general plant, plant clerical, and fi eld men.
Laboratory 7%
Receiving, Pasteurizing, Separating, & CIP 4%
Engineers &Maintenance 12%
Other 26%
Dryer 17%
Loadout &Bagging 16%
Evaporator 14%
Figure 46: Comparison of Payroll Breakdown for Plant Employees and Salaried Employees
Hourly Employees Salaried EmployeesPayroll
Taxes 10%
Wages68%
FringeBenefi ts
17%
PayrollTaxes 8%
Wages75%
FringeBenefi ts
22%
* Wages include vacation, sick leave, and holiday pay.* Payroll taxes includes FICA, FUTA, SUTA, and Workers Compensation.

California Manufacturing Cost Annual 37
Figure 47. Annual Condensed Skim Production
Num
ber o
f Pla
nts
Average = 128 million poundsMedian = 39 million poundsAverage Low Cost Group = 201 million poundsAverage High Cost Group = 71 million pounds
Million Pounds of Condensed Skim
Figure 48. Comparison of Processing Costs for Condensed Skim
Processing non-labor includes utilities, depreciation, repairs and maintenance, laundry, supplies, and plant insurance
Low ratio = 20% Labor 80% Non-Labor
High ratio = 42% Labor 58% Non-Labor
Condensed Skim OverviewCost studies were completed on seven condensed skim plants for the year 2006. The plants com-bined production totaled 893 million pounds.
• The seven plants processed an average of 128 million pounds of condensed skim in 2006; however, this is somewhat misleading because of the tremendous disparity in actual processing volume between the plants. Two of the seven plants alone were responsible for more than 75 percent of the total volume produced!
M
ProcessingNon-Labor
69%
ProcessingLabor31%
ost of the costs allocated to condensed skim, cream, and other bulk dairy products come from indirect labor and indirect non-labor plant costs. There are very little, if any, direct plant
costs allocated to bulk fl uid products, thus the derived costs per pound of condensed skim and cream are not as precise compared to the derived costs per pound of packaged products such as butter, NFDM, and cheese whose plant costs are largely composed of direct costs.
In order not to reveal individual plant information, only non specifi c information is included in the fol-lowing sections.
0
1
2
3
4
5
<20.0 20.0-35.0 35.1-100.0 >100.0
• As a group, the three plants with the lowest overall manufacturing costs produced nearly three times the amount of condensed skim as the group of three with the highest costs.
• Non-labor processing costs for condensed skim production ranged from 1.4 times to as much as 4 times the cost of production labor.
• Non-labor processing costs include plant expenses of utilities, depreciation, repairs and maintenance, laundry, supplies, and insurance.
Condensed Skim and Cream StudyCondensed Skim and Cream Study

38 California Manufacturing Cost Annual
Figure 49. Breakdown of Condensed Skim Processing Costs
ProcessingLabor 24%
ProcessingNon-Labor
64%
Return OnInvestment
5%Gen & AdminExpenses
7%
Cream Overview
Cost studies were completed on seven cream plants for the year 2006.
• Plants processed an average of 36 million pounds of cream for the year. Surprisingly, the volume of cream production varied little between the groups of plants with the lowest and highest overall manufacturing costs.
• The weighted average cost per pound of manufacturing cream was 5.0¢ per pound.
• The weighted average cost per pound of manufacturing condensed skim was 2.9¢ per pound.

California Manufacturing Cost Annual 39
Figure 50. Annual Cream ProductionN
umbe
r of P
lant
s
Average = 36 million poundsMedian = 40 million poundsAverage Low Cost Group = 36 million poundsAverage High Cost Group = 35 million pounds
Million Pounds of Cream
Figure 51. Comparison of Processing Costs for Cream
Figure 52. Breakdown of Cream Processing Costs
ProcessingLabor33%
ProcessingNon-Labor
49%
Return OnInvestment
5%Gen & AdminExpenses
13%
Processing non-labor includes utilities, depreciation, repairs and maintenance, laundry, supplies, and plant insurance
Low ratio = 37% Labor 63% Non-Labor
High ratio = 58% Labor 42% Non-Labor
ProcessingNon-Labor
60%
ProcessingLabor40%
0
1
2
3
4
5
<20.0 20.0-40.0 40.1-55.0 >55.0
• Surprisingly, the volume of cream production varied little between the gruops of three plants with the highest and lowest overall manufacturing costs.

Manufacturing Cost UnitDairy Marketing BranchCalifornia Department of Food and Agriculture1220 N StreetSacramento, CA 95814-5621