California Infant/Toddler Early Learning and Care Needs ...
46
California Infant/Toddler Early Learning and Care Needs Assessment: A Policy Brief Prepared for: The California Early Learning Quality Improvement System Advisory Committee Prepared by: Jennifer Anthony, Research Analyst Susan Muenchow, Principal Research Analyst American Institutes for Research 2800 Campus Drive, Suite 200 San Mateo, CA 94403 June 2010
Transcript of California Infant/Toddler Early Learning and Care Needs ...

California Infant/Toddler Early Learning and Care
Needs Assessment:
A Policy Brief
Prepared for: The California Early Learning Quality Improvement System Advisory Committee
Prepared by:
Jennifer Anthony, Research Analyst Susan Muenchow, Principal Research Analyst
American Institutes for Research 2800 Campus Drive, Suite 200
San Mateo, CA 94403 June 2010


INTRODUCTION ..................................................................................................................................................... 1
Key Research Questions ....................................................................................................................................... 1 Assessment Challenges ........................................................................................................................................ 1 Data Sources for Supply/Enrollment .................................................................................................................... 2
UTILIZATION OF EARLY LEARNING AND CARE PROGRAMS FOR INFANTS AND TODDLERS ..................................... 4
Non-Parental Arrangements, Nationally .............................................................................................................. 4 Non-parental Arrangements in California ............................................................................................................ 7 Home Visiting Programs ..................................................................................................................................... 10 Paid Family Leave ............................................................................................................................................... 13
QUALITY OF NON-PARENTAL, OUT-OF-HOME ARRANGEMENTS FOR INFANTS AND TODDLERS ........................... 15
Concerns about Quality of Infant/Toddler Care ................................................................................................. 16 Parents as Assessors of Quality .......................................................................................................................... 17 State Variations in Regulation of License-Exempt Infant/Toddler Care ............................................................. 17 Infant/Toddler Care in California ....................................................................................................................... 20 Child Care Initiatives to Improve Quality ............................................................................................................ 20 Equity in Access to Early Learning and Care Arrangements ............................................................................... 22 The Cost of Child Care ........................................................................................................................................ 23 Economically Disadvantaged Infants and Toddlers............................................................................................ 24 Access to Child Care by Race and Ethnicity ........................................................................................................ 27
POSSIBLE IMPLICATIONS ...................................................................................................................................... 28
Implementation of Quality Rating Scale ............................................................................................................ 28 Monitoring and Incentives ................................................................................................................................. 28 Home Visiting Expansion .................................................................................................................................... 28 Publicizing Paid Family Leave ............................................................................................................................. 29 Addressing Data Gaps ........................................................................................................................................ 30
REFERENCES ......................................................................................................................................................... 31
APPENDIX A: THE CALIFORNIA DEPARTMENT OF EDUCATION’S CHILD CARE AND DEVELOPMENT PROGRAMS .. 37
APPENDIX B: LOW-INCOME INFANTS AND TODDLERS SERVED IN PUBLICLY-SUPPORTED PROGRAMS ................ 39


1
Introduction
Key Research Questions On behalf of the California Early Learning Quality Improvement System (CAEL QIS) Advisory Committee, the American Institutes for Research (AIR), as a partner in the California Comprehensive Center (CA CC) at WestEd, has assessed the utilization and quality of, and access to, early learning and care arrangements for infants and toddlers in California. Building on the study design used for RAND’s ―California Preschool Study‖ (Karoly et al., 2008), AIR adapted the following questions to focus on the adequacy and efficiency of child development and early learning programs for infants and toddlers:
1. Utilization: What is the distribution of parental and non-parental early care and education (ECE) arrangements for California’s children from birth to age 3? What proportion of children attend center-based programs, participate in other types of child care arrangements in home-based settings, or participate in home-visiting programs?
2. Quality: What is the distribution of the quality of these arrangements across California for children birth to age 3? What proportion of children are in lower- versus higher-quality settings?
3. Equity: How does utilization and quality vary with the characteristics of the family? How do the different ECE arrangements represent families’ choices based on available ECE arrangements and parental leave options?
Assessment Challenges There are several challenges to assessing the quality and adequacy of early learning services for children in California. First, because various agencies maintain enrollment data on licensed and publicly funded non-parental care services for infants and toddlers, these data are not available in one central location. Also, given the lack of unique child identifiers, it is difficult to estimate how many children are being served by more than one program, which may result in inflated estimates of the number of children served. Similarly, information on the number of infants and toddlers served by a variety of home visiting programs is even more scattered, in part because many of the programs are locally or privately funded. Furthermore, data on enrollment in publicly funded, license-exempt settings is often not disaggregated by age cohort, and data on enrollment in privately funded exempt settings is extremely limited. Second, early care and education researchers, practitioners, and policymakers use different definitions of the infant/toddler age cohort. While some data-keepers define the infant/toddler cohort as birth to two-year-olds (i.e., 0 to 24 months), others include birth through two-year-olds (i.e., 0 to 36 months) in this cohort. Since AIR has conducted a prior needs assessment on early learning
2
and care services for three- and four-year-old children in the state of California,1 for the purposes of this report, we define the infant/toddler cohort as birth through two-year-olds (0 to 36 months). Finally, the research base on the quality and adequacy of early learning services for infants and toddlers in California is less extensive than that for preschool children. The most recent evaluation of a broad sample of infant/toddler programs in California was conducted as a part of the ―Cost, Quality and Child Outcomes Study‖ in 1995 (Helburn et al., 1995). In recent years, with support from the David and Lucile Packard Foundation and other sources, there have been several efforts to expand the knowledge base regarding services for preschool children. For example, the RAND ―California Preschool Study‖ provides a comprehensive statewide analysis of the promise of preschool for narrowing the achievement gap, describes the system of publicly funded programs for preschool age children, and analyzes the nature and quality of early care and education for children age three and four in California (Karoly et al., 2008). Also with support from the Packard Foundation, AIR (2010) has developed a county-by-county analysis down to the zip code level of the extent to which three- and four-year-olds are currently enrolled in licensed programs, with a special focus on children living in neighborhoods with a high percentage of children in poverty and low-achieving schools. The purpose of this policy brief is to improve the knowledge base on the utilization, quality, and access to early learning and care services for infants and toddlers in California. Unlike the RAND Preschool Study, this assessment is based on analyses of extant data aggregated by AIR, as well as other available research. This summary of what is known about services for infants and toddlers in California is designed to inform the CAEL QIS Committee’s work in developing a plan to improve early learning and care for children from birth to age five.
Data Sources for Supply/Enrollment AIR’s analysis is informed by capacity and enrollment data from the following sources: 1. The California Department of Education (CDE) provided enrollment data disaggregated by age
cohort and the zip code of the mother’s residence as of October 2008.
2. The National Head Start Association provided Early Head Start enrollment disaggregated by age group and the zip code of programs in its Program Information Reports.
3. The Department of Social Services (DSS) includes 2008 CalWORKs Stage 1 enrollment data by county and state on its website.
4. The California Child Care Resource & Referral Network (CCR&R) provided data on center-based slots by zip code for children in the infant/toddler and preschool cohorts, and the number of licensed family child care homes by zip code (2008).
1With support from the David and Lucile Packard Foundation, AIR conducted an assessment of preschool supply and demand in the state of California, which included the estimated enrollment in existing licensed center-based programs by program setting, including State Preschool, General Child Care, Head Start, and other center-based programs. The assessment represented the first collection and analysis of supply and demand data specifically on preschoolers down to the zip code level, the smallest unit for which both supply and demand data were available. (Anthony et al, 2009).

3
AIR aggregated the data from these various sources to produce a comprehensive, statewide analysis of supply and demand for this age cohort. Appendix B includes a more detailed analysis (disaggregated by county) of supply in different types of settings as it relates to income.

4
Utilization of Early Learning and Care Programs for Infants and Toddlers
In this policy brief, we define ―early learning and care‖ programs broadly. While we begin with an analysis of non-parental arrangements, early learning and care programs for infants and toddlers also include home visiting and paid parental leave, which assist families in caring for their young children at home.
Non-Parental Arrangements, Nationally Nationally, the use of non-parental care for children birth to five varies by the age of the child. For example, use of non-parental care on a regular basis is much less frequent for two-year-olds than for four-year-olds. According to a follow-up report (Mulligan et al., 2006) on 14,000 children born in 2001-02 who participated in the Early Childhood Longitudinal-B Study (ECLS-B),2 at two years of age, slightly more than half of the children (51 percent) had no regular non-parental arrangement. In contrast, at four years of age, only 20 percent of the children had no regular early care and education arrangement (Chernoff et al., 2007). Among those children in non-parental care, the type of settings used also varies by the age of the child. For example, 49 percent of the ECLS-B two-year-olds and 80 percent of the four-year-olds were in some sort of regular early care and education arrangement. However, of these children, a far lower proportion of two-year-olds (16 percent) as compared to four-year-olds (45 percent) were in a center-based (non-Head Start) setting. The toddlers were much more likely than their preschool counterparts to be in home-based arrangements. While 34 percent of the two-year-olds had home-based care3 provided by either relatives (19 percent) or non-relatives (15 percent), only 24 percent of the four-year-olds were in a home-based relative care setting (13 percent) or a home-based non-relative care setting (8 percent).
2 The birth cohort of the Early Childhood Longitudinal Study (ECLS-B) presents data on children’s health, development, care, and education during the formative years from birth through kindergarten entry. The ECLS-B is a longitudinal study that includes a nationally representative sample of 14,000 children, born in 2001, who represent diverse socioeconomic and racial/ethnic backgrounds. The same children have been followed from birth through the time they enter kindergarten. Researchers collected information about the children when they were approximately 9 months old (2001-02), two years old (2003-04), and four years old/preschool age (i.e., a year away from kindergarten, 2005-06). Furthermore, in the fall of 2006, researchers collected data from all participating sample children, approximately 75 percent of whom were in kindergarten or higher grades. In the fall of 2007, researchers collected data from the remaining 25 percent of participating sample children who had not yet entered kindergarten or higher grades in the previous collection, as well as children who were repeating kindergarten in the 2007-08 school year. 3 Home-based care refers to that provided in either the child’s home or in the home of the caregiver.

5
Center-based care is the exception even for infants and toddlers whose mothers are in the labor force, according to the ECLS-B studies. As shown in Figure 1, the study found that among the children whose mothers were in the labor force full time, only 27 percent of these two-year-olds were enrolled in center-based arrangements, as compared to 58 percent of four-year-olds. In other words, more than half of the mothers who worked full time enrolled their four-year-olds in centers, whereas less than a third of mothers of two-year-olds who worked full time utilized center-based care for their children. Figure 1. Use of Regular, Center-Based Arrangements by Age of Child and Mother’s Work Status
Source for two-year-old data: Mulligan, G.M. and Flanagan, K.D. (2006). Age 2: Findings from the 2-Year-Old Follow-up of the Early Childhood Longitudinal Study, Birth Cohort (ECLS-B) (NCES 2006-043). U.S. Department of Education. Washington, DC: National Center for Education Statistics. Source for four-year-old data: Jacobson Chernoff, J., Flanagan, K. D., McPhee, C., and Park, J. (2007). Preschool: First Findings from the Preschool Follow-up of the Early Childhood Longitudinal Study, Birth Cohort (ECLS-B) (NCES 2008-025). National Center for Education Statistics, Institute of Education Sciences, U.S. Department of Education. Washington, DC.

6
More toddlers than preschoolers are served in non-relative, home-based arrangements. The ECLS-B study found the differences between age groups were most striking among children whose mothers worked full time: only 13 percent of four-year-olds were in non-relative home-based arrangements, while more than a quarter of two-year-olds were cared for in these settings. Figure 2. Use of Non-relative, Home-Based Arrangements by Age of Child and Mother’s Work Status
Source for two-year-old data: Mulligan, G.M. and Flanagan, K.D. (2006). Age 2: Findings from the 2-Year-Old Follow-up of the Early Childhood Longitudinal Study, Birth Cohort (ECLS-B) (NCES 2006-043). U.S. Department of Education. Washington, DC: National Center for Education Statistics. Source for four-year-old data: Jacobson Chernoff, J., Flanagan, K. D., McPhee, C., and Park, J. (2007). Preschool: First Findings from the Preschool Follow-up of the Early Childhood Longitudinal Study, Birth Cohort (ECLS-B) (NCES 2008-025). National Center for Education Statistics, Institute of Education Sciences, U.S. Department of Education. Washington, DC.

7
Even among those children whose mothers work full time, only a minority of families use center-based care. Among families who work full time and have two-year-olds, most parents either arrange their work schedules so that the other parent can care for the child, or they use informal care arrangements with relatives, friends, or neighbors. Figure 3 shows the percentage distribution of two-year-olds in the ECLS-B study whose mothers worked full time who received some form of regular non-parental care, as of 2003-04. Nearly a third (30 percent) of infants and toddlers whose mothers worked full time were cared for by relatives, and more than a quarter (26 percent) were cared for by people other than relatives. On a nationwide basis, less than a third (27 percent) of the two-year-olds whose mothers worked full time were enrolled in center-based care.
Figure 3. Child Care Arrangements for Two-Year-Olds of Mothers Who Work Full Time
Source: Mulligan, G.M. and Flanagan, K.D. (2006). Age 2: Findings from the 2-Year-Old Follow-up of the Early Childhood Longitudinal Study, Birth Cohort (ECLS-B) (NCES 2006-043). U.S. Department of Education. Washington, DC: National Center for Education Statistics.
Non-parental Arrangements in California As is the case nationally, utilization of non-parental care in California varies by the age of the child, and the utilization pattern is quite different for infants and toddlers than for preschool children. Based on a household phone survey conducted as part of the RAND study (Karoly et al., 2009) in 2007, nearly 80 percent of four-year-old children in California had one or more regular non-parental early child care and education arrangements—the same percentage in this age group found in the ECLS-B study to be in non-parental care. Two-thirds of the four-year-olds in California, according to the RAND study, were in a center-based arrangement.

8
In contrast, according to the 2007 California Health Interview Survey (CHIS),4 the nation’s largest state health survey, only 42 percent of two-year-olds had some regular, non-parental care for 10 hours per week. That is, according to the CHIS, even fewer two-year-olds in California (42 percent) have some regular non-parental care than the 51 percent in this age group found in the ECLS-B study to have such arrangements nationally. As might be expected, the percentages in non-parental care in California were lower for one-year-olds (38 percent) and children less than one year of age (25 percent). Statewide, most infants and toddlers were exclusively in home or informal arrangements, according to AIR’s needs assessment. As shown in Figure 4, 88 percent of California’s estimated 1.7 million infants and toddlers5 were in parental and/or family, friend, or neighbor care in 2008. According to data from the California Child Care Resource and Referral (CCR&R) Network (2008), a much smaller percentage (4 percent) of infants and toddlers than preschoolers (35 percent) had access to some type of licensed, center-based program. Only about 18 percent of the infants and toddlers (approximately 13,000 of 73,000) served in licensed centers were in programs not contracted by CDE or Early Head Start. In other words, most of the center-based care for this age group consisted of publicly contracted programs.
4 The CHIS, which is conducted every two years on a wide range of health topics, provides information on the health and health care needs of California’s population. CHIS 2007 surveyed more than 51,000 adults, more than 13,000 teens and children and more than 53,000 households, with oversampling of Los Angeles and San Diego Counties. 5 AIR estimated the population of infants and toddlers by using the number of births reported by the California Department of Public Health in 2006 through 2008. An estimated 1.7 million birth to three-year-olds lived in California as of 2008.

9
The supply of center-based care in California for all age groups as a proportion of the total licensed supply is somewhat lower (65 percent) than that for the nation as a whole (71 percent), according to the National Association for Child Care Resource and Referral Agencies (NACCRA). At the same time, according to NACCRA, licensed family child care homes represent a larger proportion of the total supply of child care arrangements – 35 percent of licensed child care slots in California, as compared to 18 percent nationally. Figure 4. Child Care Arrangements for Infants and Toddlers in California, 2008
*Of the children (note: all ages) in CDE-administered programs in 2008, 19 percent were in license-exempt care. In other words, as many as a fifth of the arrangements in other CDE-funded settings were license-exempt, home-based settings. Note: In 2008, approximately 66 percent of the 76,000 birth to 13-year-old children in settings supported by CalWORKs Stage 1 were estimated to be in license-exempt care. CalWORKs Stage 1 arrangements therefore represent less than 1 percent of the children in family, friend and neighbor care.
10
Publicly Supported Infant/Toddler Arrangements
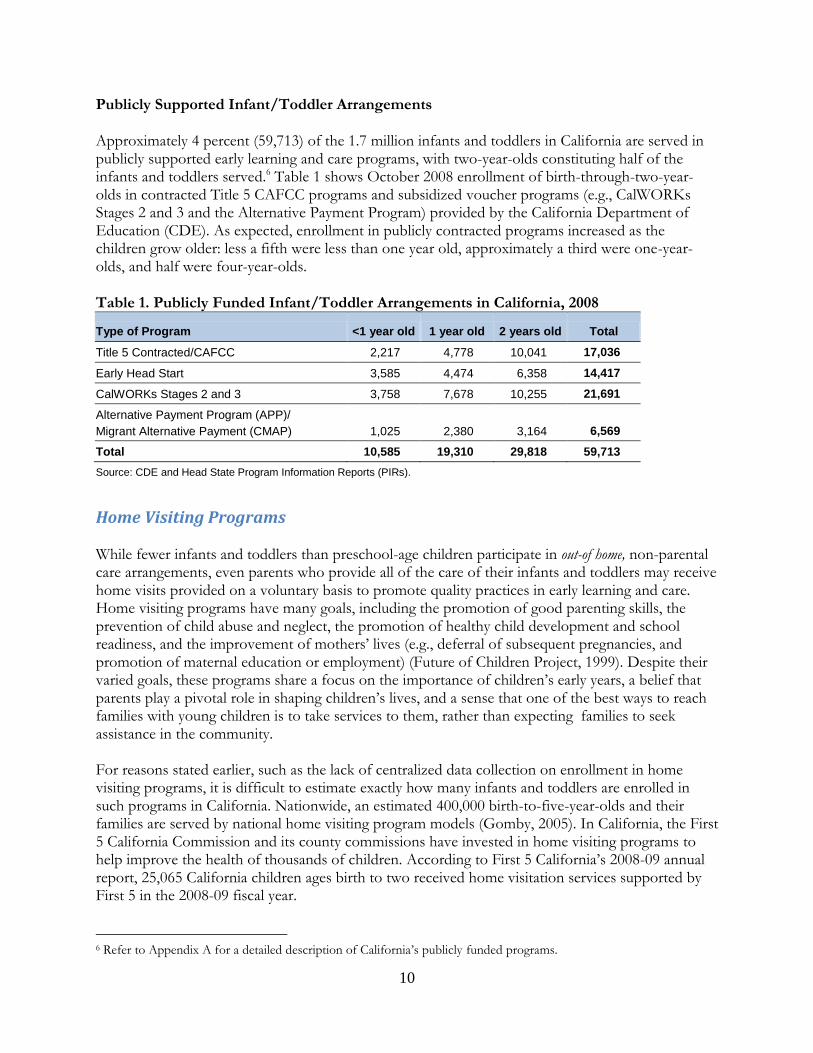
Approximately 4 percent (59,713) of the 1.7 million infants and toddlers in California are served in publicly supported early learning and care programs, with two-year-olds constituting half of the infants and toddlers served.6 Table 1 shows October 2008 enrollment of birth-through-two-year-olds in contracted Title 5 CAFCC programs and subsidized voucher programs (e.g., CalWORKs Stages 2 and 3 and the Alternative Payment Program) provided by the California Department of Education (CDE). As expected, enrollment in publicly contracted programs increased as the children grow older: less a fifth were less than one year old, approximately a third were one-year-olds, and half were four-year-olds.
Table 1. Publicly Funded Infant/Toddler Arrangements in California, 2008
Type of Program <1 year old 1 year old 2 years old Total
Title 5 Contracted/CAFCC 2,217 4,778 10,041 17,036
Early Head Start 3,585 4,474 6,358 14,417
CalWORKs Stages 2 and 3 3,758 7,678 10,255 21,691
Alternative Payment Program (APP)/
Migrant Alternative Payment (CMAP) 1,025 2,380 3,164 6,569
Total 10,585 19,310 29,818 59,713
Source: CDE and Head State Program Information Reports (PIRs).
Home Visiting Programs While fewer infants and toddlers than preschool-age children participate in out-of home, non-parental care arrangements, even parents who provide all of the care of their infants and toddlers may receive home visits provided on a voluntary basis to promote quality practices in early learning and care. Home visiting programs have many goals, including the promotion of good parenting skills, the prevention of child abuse and neglect, the promotion of healthy child development and school readiness, and the improvement of mothers’ lives (e.g., deferral of subsequent pregnancies, and promotion of maternal education or employment) (Future of Children Project, 1999). Despite their varied goals, these programs share a focus on the importance of children’s early years, a belief that parents play a pivotal role in shaping children’s lives, and a sense that one of the best ways to reach families with young children is to take services to them, rather than expecting families to seek assistance in the community. For reasons stated earlier, such as the lack of centralized data collection on enrollment in home visiting programs, it is difficult to estimate exactly how many infants and toddlers are enrolled in such programs in California. Nationwide, an estimated 400,000 birth-to-five-year-olds and their families are served by national home visiting program models (Gomby, 2005). In California, the First 5 California Commission and its county commissions have invested in home visiting programs to help improve the health of thousands of children. According to First 5 California’s 2008-09 annual report, 25,065 California children ages birth to two received home visitation services supported by First 5 in the 2008-09 fiscal year.
6 Refer to Appendix A for a detailed description of California’s publicly funded programs.

11
National Program Models
Many of California’s young children receive home visiting services each year through programs affiliated with national sponsoring organizations. While one such program exclusively targets preschoolers,7 the programs listed below concentrate some or all of their efforts on infants and toddlers:
1. Parents as Teachers (PAT). PAT Educators make monthly visits to families’ homes to teach parenting practices and enhance parents’ knowledge of early childhood development. California has 100 PAT programs that serve children from the prenatal period to five years old.
2. Healthy Families America (HFA). HFA ―is a national program model designed to help expectant and new parents get their children off to a healthy start. Families participate voluntarily in the program and receive home visiting and referrals from trained staff‖ (Healthy Families America, 2010). HFA served approximately 485 families and their children in California in 2009, and the majority of the children served were prenatal to three years old.
3. Parent-Child Home Program (PCHP). PCHP is an early childhood literacy and school readiness program (PCHP website, 2010). Typically, families participate in the two-year program when their child is two and three years old; however, a child can enter the program as young as 16 months and some sites serve families with children up to four years old. PCHP served a total of approximately 800 families in its seven California locations8 in 2009.
4. Nurse-Family Partnership (NFP). NFP’s registered nurses make home visits to give low-income, first-time mothers the support they need to have a healthy pregnancy, provide responsible and competent care for their children, and become more economically self-sufficient (NFP website, 2010). NFP provides services from pregnancy until the child turns two years old. As of 2010, NFP was located in 12 sites implemented by county public health departments in 11 California counties.9
5. Even Start. According to the U.S. Department of Education’s website (2010), this federal program ―offers grants to support local family literacy projects that integrate early childhood education, adult literacy (adult basic and secondary-level education and instruction for English language learners), parenting education, and interactive parent and child literacy activities for low-income families with parents who are eligible for services under the Adult Education and Family Literacy Act and their children from birth through age 7.‖ California has 57 Even Start projects totaling $7.1 million in grants.
Community-Based Models
Many more of California’s infants and toddlers are served in community-based home visiting programs, such as Welcome Home Baby, a home visiting program for first-time parents with newborn babies who live in Contra Costa County (Welcome Home Baby website, 2010). Welcome
7 Home Instruction for Parents of Preschool Youngsters (HIPPY) focuses on 3-, 4-, and 5-year-old children, and its services include home visits in which role models introduce developmentally appropriate educational materials and group meetings to teach such skills as how to access community and/or school resources. 8 Three sites in Stockton (San Joaquin County) and one site in Berkeley (Alameda County), Los Angeles (Los Angeles County), Modesto (Stanislaus County), and Santa Ana (Orange County). 9 Fresno, Humboldt, Kern, Los Angeles, Orange, Riverside, Sacramento, San Diego, San Luis Obispo, Solano, and Tulare.

12
Home Baby serves about 1,300 families annually and is funded, in part, by First 5 Contra Costa County. Welcome Every Baby Newborn Home Visiting Program (WEB) is another community-based model located in Santa Barbara County. WEB is a universal newborn home visiting program based on the Touchpoints model (WEB website, 2010). The program provides a series of home visits and calls from a nurse and infant specialist from birth until the child is 10 months old. The goals of the visits are to help families adapt to the birth of a newborn by supporting breastfeeding as needed, assessing the health status of the baby and mother postpartum, screening the mother for postpartum depression, providing guidance on the baby's growth, development, and behavior, assessing the baby's developmental progress (and making referrals in the event of developmental delays), and offering resources according to family concerns, priorities, and needs. WEB provides about 10,000 home visits per year throughout the county. Child Care Programs with a Home Visiting Component
Other child care programs also have a home visiting component, although this is not the primary method for delivery of their interventions and services. One example is Early Head Start, a federally funded community-based program for pregnant women and low-income families with infants and toddlers. Forty-one percent of the 14,417 birth-to-three-year-olds served in California’s Early Head Start program are estimated to be in a home-based model, based on nationwide estimates.10 Another such program is Part C Early Intervention, which was created under the Individuals with Disabilities Education Act (IDEA). This program provides services to infants and toddlers (from birth through age two) who have developmental disabilities and delays, have diagnosed conditions highly likely to lead to delays, or are at risk for delays. According to the National Center for Children in Poverty (Johnson, 2009), as of 2006, more than 85 percent of Part C Early Intervention services for enrolled children were delivered at home. A System of Care
Home visiting programs appear most beneficial for families in greatest need or where parents perceive children to be at risk (Gomby, 2005). While the programs can be expensive, the benefits, especially in certain populations, can greatly outweigh the costs. So, for example, while the cost per family in the Nurse-Family Partnership Program in 2005 was $7,271, the benefit for high-risk families was estimated to be $41,419, versus $9,151 for low-risk families. Some researchers argue that home visiting programs alone are not sufficient, but that these programs can be an ―effective component of a system of care‖ (Daro, 2009) that includes the following: early access to basic health and reproductive care, a broad risk assessment completed during pregnancy or birth, a system of home visitation services for families that need additional assistance, and linkages to child care and early education packages. In summary, while it is not possible to pinpoint the number of infants and toddlers whose families are participating in home visiting programs, we do know that at least 25,000 children birth to age two receive home visits supported by First 5 California, that nearly 6,000 children birth to three receive home visits through Early Head Start, and that many more receive home visits conducted by
10 Estimate from 2008 Head Start Program Information Report, as cited in CLASP (2009).

13
one of several nationally sponsored programs, such as Parents as Teachers and the Nurse-Family Partnership.
Paid Family Leave While not traditionally considered an early learning and care program, California’s Paid Family Leave (PFL) program provides an important support to families in caring for their new or newly adopted babies. Unlike publicly subsidized non-parental care, which is limited to families below a certain income threshold, most working parents in California, regardless of income, are eligible for PFL. Since 2004, California has offered PFL, or part-paid leave, for ―bonding‖ with a new or newly adopted child or to care for an ill family member. The program is an expansion of California’s State Disability Insurance (SDI) plan and funded entirely by a payroll tax on employees.
The SDI plan also includes the Disability Insurance (DI) program,11 which offers six to eight weeks of wage replacement at 55 percent of weekly earnings for leave related to pregnancy and recovery from childbirth, while PFL offers up to six weeks of part-paid leave to both parents for purposes of bonding with a new or newly adopted child. Together, if the mother claims the DI benefits and if both parents claim the maximum PFL benefits, they can qualify for up to 20 weeks of part-paid leave for purposes of childbirth recovery and bonding with a new baby. Meanwhile, families may be eligible for additional job-protected, unpaid leave through other state legislation. Claims for bonding with a new baby represent a majority of PFL claims (Employment Development Department, 2009), and the claims are increasing. For example, in 2008, there were 30 paid leave claims in California for every 100 births in California, an increase from 23 per 100 births in 2004 (Employment Development Department, 2010). However, many families still do not know about the program. According to the UCLA California Family Leave Research Project (Milkman, 2008), as of the summer of 2007, only 28 percent of Californians were aware of the program. Summary
The utilization of early learning and care arrangements in California for infants and toddlers follows a much different pattern than that for preschool-age children. According to AIR’s analysis of extant data, only about 12 percent (approximately 209,000) of the state’s 1.7 million infants and toddlers are in some type of formal out-of-home, non-parental early learning and care arrangement, including licensed center- or family-child care. Use of center-based arrangements for infant and toddlers is even less frequent in California than in the nation as a whole. Of those infants and toddlers who are in center-based programs in the state, a majority (82 percent) are in Early Head Start or CDE-contracted programs. If we expand the term ―early learning and care arrangement‖ to include informal care by family, friends, and neighbors, then, according to the California Health Interview Survey, approximately 42 percent of two-year-olds, 38 percent of one-year-olds, and 25 percent of children below age one are in some type of formal or informal arrangement for at least 10 hours a week.
11 According to California’s Employment Development Department website (2010), State Disability Insurance (SDI) refers to a partial wage-replacement insurance plan that includes two programs: Disability Insurance (DI) and Paid Family Leave (PFL).

14
In addition, it appears that as many as 40,000 infants’ and toddlers’ families in California receive home visits as part of a formal program, but it is unclear how many of the children receiving home visits are also enrolled in either formal or informal non-parental out-of-home care arrangements. Finally, about one-third of the parents of the 550,000 infants born each year in California receive a period of publicly supported part-paid leave from work to focus on bonding to their newborn or newly adopted children.

15
Quality of Non-Parental, Out-of-Home Arrangements for Infants and Toddlers
High quality infant and toddler child care has been linked with positive child outcomes. For example, the Syracuse Family Development Research Project found several long-term positive effects of high quality infant-toddler care. Study participants, all of whom were from programs serving low-income, low-education, single-parent families, were reported to decrease juvenile delinquency rates and to lead to less severe delinquency during adolescence, as compared to children in a control group (Lally, Mangione, & Honig, 1988). In a follow-up study of infants from at-risk families who attended a high quality early care program in the Abecedarian Project (Ramey et al., 2000), researchers found that at age 21, twice as many program graduates were still in school and had fewer children than did members of the control group. But while quality infant and toddler programs have been found to benefit disadvantaged children, and quality preschool has been found to benefit three- and four-year-olds of all income groups (Gormley, 2005), the impact of non-parental, out-of-home arrangements on infants and toddlers is less clear. For example, a federally funded study that has tracked more than 1,300 children in nine states (including California) since 1991 found that at age 15, those who had received higher-quality child care were less likely to report engaging in problem behaviors such as arguing, being mean to others, and getting into fights (Vandell et al, 2010). But the effects of center-based child care are potentially affected by the number of hours in care. For example, this same study found that more hours of non-relative child care were associated with greater impulsivity and risk-taking at age 15 (Vandell et al., 2010). Like researchers and policymakers, parents are also divided on their beliefs about center-based care for infants and toddlers. While parents seem to think a quality preschool program for three- and four-year-olds supports school readiness, they do not tend to believe that formal, out-of-home programs are needed to promote infants’ child’s development (Hart, 2002). While attending at least a part-day center- or school-based program for the purpose of promoting school readiness has become the norm for preschool children, the infant/toddler population is less likely to be enrolled in center-based programs. Even among working parents, the use of informal arrangements or family child care is more prevalent than center-based care. Given the lack of clarity in the existing research on the impact of infant child care, many experts advocate for a balanced perspective, arguing that that the focus should be on the quality, not the setting, of the arrangement. According to Shonkoff and Phillips in Neurons to Neighborhoods (2000), ―Beneficial outcomes for children in child care are associated with settings that provide both nurturance and support for early learning and language development.‖ As Ronald Lally (forthcoming) argues, ―Rather than debating when and where [infants and toddlers] should receive care, much more attention needs to be given to the issues of appropriate practice, and appropriate policies wherever care takes place.‖ Unfortunately, despite the fact that research has linked quality infant/toddler child care with better outcomes, high quality arrangements for this age group are often lacking and difficult to find. According to the Child Care Resource and Referral Network (2009), 53 percent of the families

16
calling child care resource and referral agencies are looking for care for infants and two-year-olds, which suggests that quality early learning and care in any setting for this age group is difficult to find. This inability to find quality care is especially the case for populations who stand to benefit the most, such as children at risk due to low parental education, poverty, maternal depression, or high levels of conflict. Finally, less is known about the quality of child care settings for this age cohort than about programs for preschoolers. Many of the country’s infants and toddlers are served in unlicensed settings that are not monitored on a regular basis, and therefore little is known about the quality of care provided. To address these issues, current child care initiatives and training opportunities throughout the state aim to enhance the quality of care in a variety of settings.
Concerns about Quality of Infant/Toddler Care Quality of Center-Based Infant/Toddler Care Nationwide
The most comprehensive assessment of the quality of center-based care for infants and toddlers is the Cost, Quality, and Child Outcomes in Child Care Centers study (Helburn, 1995). This study observed 401 centers in four states – California, Colorado, Connecticut, and North Carolina. The centers, which included about 100 in Los Angeles, served infants, toddlers, and/or preschool age children in the spring of 1993.
Based on observer assessments using the Infant Toddler Environmental Rating Scale (ITERS),12 the study found that across the four states, only 25 percent of infant classrooms and 31 percent of toddler classrooms met the ―good‖ benchmark on the ITERS. Child care at most centers was poor to mediocre, with almost half of the infant and toddler rooms providing poor quality care. Forty percent of the infant-toddler rooms were observed to endanger children’s health and safety.
On average, teachers of infants and toddlers had less experience and less education than preschool teachers, and this difference was reflected in lower scores in infant/toddler classrooms than in preschool classrooms. For example, the combined score on the dimension of Developmentally Appropriate Practices and Appropriate Caregiving13 was 3.1 for the infant/toddler rooms, as compared to a score of 4 for rooms serving preschool age children on these same dimensions on the Early Childhood Environment Rating Scale (ECERS).
12 The original ITERS was an adaptation of the Early Childhood Environment Rating Scale, but with unique content developed for infant and toddler group care. The scale consisted of 35 items for the assessment of the quality of center-based child care for children up to 30 months of age. These 35 items were organized under seven categories: Furnishings and Display for Children, Personal Care Routines, Listening and Talking, Learning Activities, Interaction, Program Structure, and Adult Needs. Each item was presented as a 7-point scale, with descriptors for 1 (inadequate), 3 (minimal), 5 (good), and 7 (excellent). Inadequate referred to care that did not meet custodial care needs, minimal described care that met custodial and to some small degree basic developmental needs, good described the basic dimensions of developmental care, and excellent described high-quality, personalized care. The inadequate (1) and minimal (3) ratings usually focused on provision of basic materials and on health and safety precautions. The good (5) and excellent (7) ratings required positive interaction, planning, and personalized care, as well as good materials. The Infant/Toddler Environment Rating Scale-Revised Edition (ITERS-R) is a revision of the original Infant/Toddler Environment Rating Scale. 13 Factor analysis was used to group the items into dimensions for purposes of comparison between the ECERS and ITERS scales. For example, Appropriate Caregiving included items related to adult-child interactions, supervision, and discipline, and Developmentally Appropriate Practices included items related to scheduling, materials, and activities.

17
Quality of Home-Based Infant/Toddler Care
Concern about the quality of infant and toddler child care is not limited to center-based arrangements. The Study of Children in Family Child Care and Relative Care (Galinsky et al., 1994), which observed providers from California and two other states, found that the quality of home-based infant and toddler care was also lacking. Using the Family Child Care Environment Rating Scale (FCCERS), observers found that 35 percent of the children were in poor quality care, 56 percent were in adequate care, and only 9 percent were in high quality care. Furthermore, researchers found that children from low income families were in substantially lower quality care.
Parents as Assessors of Quality Parents value high quality child care, but they may not always be the most objective assessors of quality. In the Cost, Quality, and Child Outcomes Study (Helburn, 1995), parents used the ECERS/ITERS assessments to observe classrooms, and ended up ranking centers nearly twice as high as did trained assessors on Health (6.20 vs. 3.16), Safety (6.04 vs. 3.58), and Staff-Child Interactions (6.27 vs. 3.96). This finding highlights a need for monitored care and for trained, objective observers to use such instruments as the ITERS.
State Variations in Regulation of License-Exempt Infant/Toddler Care Research has shown the link between quality of care and positive child outcomes, and the need for objective assessment and regulation. Yet many child care settings across the nation are minimally regulated, and therefore little is known about the care provided.14 For example, the federal Child Care and Development Fund (CCDF) program subsidizes many license-exempt care settings for low income families, families receiving temporary public assistance, and those transitioning from public assistance in obtaining child care so they can work or attend training or education opportunities. There are multiple reasons why families may choose license-exempt child care provided by friends, families, and neighbors (FFN). This type of setting often accommodates non-standard work hours and is conveniently located. Research (Susman-Stillman, 2005) has found that parents frequently report that they ―know and trust‖ their families, friends, and neighbors, and feel that their children will be safe and receive more attention. A family might also choose FFN care because they value an ethnic match between their child and the person who cares for their child, as this facilitates sharing of cultural practices, values, and knowledge (Susman-Stillman & Banghart, 2008). Finally, license-exempt care often keeps income in the family. In California, license-exempt providers who provide publicly subsidized care receive virtually the same reimbursement as do licensed family child care providers, thereby removing any financial incentive for exempt providers to seek licensure.
Federal law allows states considerable flexibility in determining how or whether they will regulate exempt care providers who receive CCDF-funded reimbursements for their services. According to the National Child Care Information and Technical Assistance Center (NCCIC, 2008), the scope of requirements for license-exempt family child care (FCC) providers subsidized by CCDF varies substantially by state. For example, Oklahoma does not subsidize exempt care; the state limits the use of CCDF funds to licensed arrangements.
14 As of 2008, approximately one-fifth (21 percent) of children ages birth to 13 who receive CCDF subsidies nationwide were in legally unregulated care in home-based settings (Child Care Bureau, 2008). This percentage varies greatly by state.

18
With respect to background checks, at one end of the continuum is Tennessee, which does not require any background checks for license-exempt providers receiving public funds. California only requires a child abuse check and fingerprinting, in addition to a Criminal History Record check for caregivers who are not related to the children in their care; relatives are not required to have background checks (U.S. General Accounting Office, 2000). In Hawaii, child abuse record checks and criminal history record checks are required for all providers who receive subsidy payments. In Illinois, child abuse and neglect record checks are required for all license-exempt providers, including relative providers and all those age 13 years and older living in homes where care is provided, and these checks are repeated every two years. Figure 5. Monitoring of Subsidized Exempt Care – Background Checks Safety checks of building and physical premises of license-exempt FCC providers subsidized by CCDF also vary by state (NCCIC, 2008). California’s exempt providers are only required to do self-certification, while in some states, such as Nebraska, the provider is paid an initial site visit within 45 days of registration, followed by periodic visits every 36 months. Home visits in other states are much more frequent. In Nevada, for example, exempt programs have an initial site visit with 45 days of registration, followed by periodic visits every six months.
No Background Background Background Background
Checks Checks for All Checks for Checks for All,
(e.g., Tennessee) but Relatives All Who Every 2 Years
(e.g., California) Receive Subsidies (e.g., Illinois)
(e.g., Hawaii)

19
Figure 6. Monitoring of Subsidized Exempt Care – Building and Physical Premises Safety
States also have adopted varying health and safety training requirements for CCDF-funded, license-exempt FCC providers (NCCIC, 2008). In California, health and safety training is only required for exempt providers of programs operated by public or private schools. In some states, such as New York and Oregon, only providers who complete training are eligible to receive enhanced rates. Figure 7. Monitoring of Subsidized Exempt Care – Health and Safety Training

20
Infant/Toddler Care in California Programs Held to Higher Standards in California Staff-child ratio requirements and teacher education qualifications for Title 5/General Child Care and Early Head Start programs exceed the basic state licensing requirements. The programs are also monitored regularly, and therefore much more is known about the quality of these programs. However, based on AIR’s analysis of extant data, of the estimated 209,582 infants and toddlers enrolled in licensed centers or family child care homes in 2008,15 only approximately 29,752, or 14 percent, are enrolled in either Title 5 center-based programs (7 percent) or Early Head Start programs (7 percent).16 Publicly Supported License-Exempt Care Many of the children in California’s publicly supported programs are in license-exempt care.17 According to CDE (April 2008), of the 347,111 children (across all age groups) in CDE-administered settings in April 2008, 19 percent were in license-exempt care.
In some of California’s publicly funded programs, the majority of the children are in license-exempt settings. For example, according to the Department of Social Services (DSS, October 2009), of the 76,000 birth to 13-year-old children in DSS-administered CalWORKs Stage 1, 66 percent were in license-exempt care.
Child Care Initiatives to Improve Quality In an effort to enhance the quality of child care for all age groups of children, several California programs and initiatives offer training opportunities for early learning and care providers. Quality improvement initiatives funded by CDE include the California Preschool Instructional Network, which provides networking opportunities for preschool administrators and training on relevant CDE publications; the California Early Childhood Mentor Program, which is located at community colleges and supports the retention of experienced early learning and care professionals to serve as mentors to students becoming new teachers and directors; and the Child Development Training Consortium, also located at community colleges, which helps students with tuition costs, permit fees, and professional growth advisors as the students progress through a professional pathway. Here we focus on the two largest initiatives; one affects providers serving all age groups of children, and the other focuses exclusively on providers working with infants and toddlers. The California Child Care Resource and Referral (CCR&R) Network administers various programs intended to enhance the quality of home-based care for all age groups, from infants and toddlers through school-age children. The Child Care Initiative Project (CCIP) works through local CCR&R agencies to recruit, train, and retain licensed family child care providers. In 2007-08 (CCR&R website, 2009), more than 2,200 licensed family child care providers attended CCIP trainings, and
15 Estimates based on capacity data provided by the CCR&R. 16 Note: According to CLASP (2009), Early Head Start may be delivered through different program models. The most common model is center-based (about 50 percent), followed by home-based (about 41 percent). 17 The lack of disaggregated data by age cohort makes it difficult to determine exact percentages of infants and toddlers in publicly-supported exempt care.

21
the project created more than 5,500 new licensed family child care slots. The CCR&R’s California Exempt Care Training project (CECT), also known as Growing, Learning, Caring (GLC), has provided training to license-exempt providers since 2005. In 2007-08, more than 5,200 license-exempt providers attended trainings. The Program for Infant Toddler Care (PITC), administered by WestEd, strives to improve the quality of child care for children birth to age three through several venues. The program is a professional development strategy designed to improve the quality of child care programs and enhance the social-emotional, cognitive, linguistic, and perceptual and motor development of infants and toddlers. PITC delivers infant/toddler training to administrators, caregivers/providers, and college faculty through a variety of venues (e.g., institutes, graduate events, conferences, outreach, and community-based and on-site training of caregivers/providers) to build capacity in California. Beginning this year, PITC also provides academies for college faculty and program administrators on CDE’s new infant/toddler learning and development system, which includes up-to-date research and evidence based program guidelines, learning and development foundations, and a curriculum framework. Program staff collaborate with five community colleges that have PITC demonstration programs where visitors can observe high quality infant/toddler care. PITC also has a Regional Support Network (RSN), with Regional Coordinators and local certified PITC Infant/Toddler Specialists who conduct training, mentoring, coaching, and reflective action planning throughout California to support continuous improvement over time.
PITC’s Partners for Quality RSN has reached a wide audience. PITC, according to its 2008-09 year-end report (PITC, 2009), provided training, mentoring, and coaching to approximately 3,602 infant caregivers in the 2008-09 program year. Of these teachers, 55 percent were center-based providers, 30 percent were family child care providers (including license-exempt), and 15 percent of the providers were unspecified. Because each caregiver trained has the opportunity to impact the quality of care for at least four infants or toddlers in the caregiver’s care, as many as 14,408 infants and toddlers were potentially affected by PQ services between July 2008 and July 2009.
There is some evidence that PITC has had a positive impact on the quality of care. Figure 8 provides the findings of a study conducted in 22 infant/toddler care programs that participated in Plan I and Plan II PITC Partners for Quality training and technical assistance. The study found statistically significant improvements in the quality of care after training, as measured by scores on the ITERS and ECERS.

22
Figure 8. Results from Program for Infant Toddler Care (PITC) Training, Sacramento County, 2002-05
Source: Program for Infant Toddler Care. Preparing the Way for California’s Infants and Toddlers: the Program for Infant/Toddler Care 2008-09 Year-End Report to the California Department of Education. WestEd Center for Child and Family Studies.
In addition, the Institute of Education Sciences (IES) Regional Educational Laboratory Program is currently conducting a five-year evaluation of the effects of the PITC on child outcomes and provider-child interactions. The study aims to estimate the program’s impacts by comparing outcomes for intervention programs and the children enrolled in these programs against outcomes for control counterparts. The sample consists of approximately 1,000 children in 92 childcare centers and 159 family child care homes in both California and southern Arizona.18 The results of the study are expected to be available in early 2011.
Equity in Access to Early Learning and Care Arrangements Having analyzed the patterns of utilization and the quality of early learning and care arrangements for infants and toddlers generally, we now turn to the question of how the utilization and quality vary with the characteristics of the family and the extent to which variations in utilization patterns reflect family choice. In short, do differences in the use of non-parental arrangements reflect parental preferences, or reflect inequities in access to such arrangements? As discussed earlier, the use of child care arrangements for infants and toddlers, especially out-of-home arrangements, often differs from those for preschool age children. For example, while families may seek information and support in caring for their infants and toddlers, they are less apt to seek extensive periods of out-of-home arrangements for this age group. Center care is the exception both nationally and in California, and even for families with a single parent or two working parents. Furthermore, some families have concerns about the impact of long durations of group care for infants, especially the youngest children, in anything but the highest quality programs.
18
The majority of the facilities are in California (61 percent of the centers and 65 percent of the family child care homes).

23
Analyzing issues of equity in access to early learning and care arrangements is complicated by the
fact that limited data are available on the distribution of enrollment across types of child care programs. For example, comprehensive data are not available on the proportion of infants and toddlers in licensed versus exempt voucher arrangements funded by CDE and DSS, and even less data are available on exempt care arrangements used by families not receiving public subsidies. Detailed information on the number of children served by home visiting programs by neighborhood is also not readily available, and data on claims for California’s Paid Family Leave programs are not available down to the zip code level. With those limitations in mind, AIR focused on analyzing the supply of licensed child care settings and enrollment in publicly contracted programs by zip code, and hence is able to draw some preliminary conclusions about several factors, including the high cost of child care, employment status, and cultural differences, that may affect a family’s choice of early learning and care arrangements.
The Cost of Child Care
Child care can be cost prohibitive for many families in California. In 2008, according to an analysis by the Center for Law and Social Policy (CLASP) of American Community Survey data (2009), 20 percent of California’s children under age 6 lived in families with incomes under the federal poverty level (as compared to 21 percent nationwide). Data from the 2007 American Community Survey (U.S. Census) show that the cost of full-time center-based care for an infant was 15 percent of the median income for married-couple families with children under 18, and 42 percent of the median income for single parent (female-headed) families with children under 18. A joint report (2009) by the CCR&R and NACCRRA noted that the average annual fees paid for full-time center-based care for an infant were $11,58019 (versus a low of $4,560 in Mississippi and a high of $15,895 in Massachusetts), and $7,937 for full-time care in a family child care home. And, as shown in Table 2, the cost of infant care is markedly higher than the cost of child care for preschoolers. Table 2. Average Child Care Costs for Full-Time Care, 2007
Age and Setting California Nationwide
Infant, Center $11,580 $4,560-$15,895
Four-year-old, Center $8,234 $4,056-$11,678
Infant, Family Child Care Home $7,937 $3,582-$10,324
Four-year-old, Family Child Care Home $7,180 $3,380-$9,805
Source: State CCR&R Network and derived from CRR&R data. Some states reported on their state’s latest market rate study. In 2009 Child Care in the State of California.
The parents of very young children often are just entering the workforce and therefore are not earning high salaries. For example, in 2001, 25 percent of families with children under six years of age earned less than $25,000 a year (Children’s Defense Fund, 2003). Given that a 2000 study
19 The average annual price for an infant in center-based care, at $11,580, was more than double the average price of college tuition, at just $5,346. $11,580 is nearly 66 percent of 2008 Federal Poverty Levels for a family of three (NACCRA, 2009).

24
(Schulman, 2000) found that the average cost of center care for a 12-month-old infant exceeded $6,000 in more than half of the urban areas surveyed (26 out of 47), the cost of adequate child care is beyond the reach of low-income families unless assistance is provided.20 California also has a high cost of living. According to a report by the National Association for Child Care Resource and Referral Agencies (NACCRRA, 2009), based upon the cost of infant care as a percentage of a two-parent family income, California ranked fifth among the ten least affordable states for infant care in 2008.21 Child care constituted 14.7 percent of a median two-parent family income, and 42.5 percent of a median single parent family income. Finally, affordability depends, in part, on the county in California in which a family lives. According to the National Center for Children in Poverty (2009a), in Sacramento County, a two-parent family with both parents working full time would need to make $47,674 a year, or 278 percent of the federal poverty level, to be able to afford center-based child care for a one-year-old. In Los Angeles County, this same family would need to make $54,214 a year, or 316 percent of the federal poverty level. And in San Francisco, the family would need to make $60,214 a year, or 351 percent of the federal poverty level.22
Economically Disadvantaged Infants and Toddlers
Given the especially high cost of center-based care in California, and especially of such arrangements for infants and toddlers, perhaps it is no surprise that center-based care is relatively less available, while family child care homes are relatively more available, in the state than in the nation as a whole. However, when considering issues of equity in access to choice of arrangements, the picture is more complicated. As indicated above, a majority of the children in the center-based programs in California are actually disadvantaged children who received publicly subsidized care. In corroboration with this finding, our own zip code level analysis of the availability of formal arrangements in early learning and care for infants and toddlers found that zip codes with greater percentages of low-income children are more likely to have greater percentages of children enrolled in publicly supported programs. At the same time, we also found that overall, licensed arrangements, including both centers and family child care homes, are relatively more prevalent in zip codes in neighborhoods with higher as opposed to lower incomes. This finding suggests that, unless they have access to publicly subsidized programs, families in low-income neighborhoods have less access to formal arrangements than do families with higher incomes.
Enrollment
Only 12 percent of California’s total infant and toddler population are enrolled in licensed centers or family child care homes. As indicated above, economically disadvantaged children actually represent a majority of the infants and toddlers in center-based programs in California. Nevertheless, only a
20Children’s Defense Fund calculations based on data from the U.S. Census Bureau, Current Population Survey Annual Demographic Supplement, Detailed Income Tables, ―Table FINC-03. Presence of Related Children Under 18 Years Old—All Families, by Total Money Income in 2001, Type of Family Work Experience in 2001, Race and Hispanic Origin of Reference Person.‖ 21 New York was most expensive, at an average annual price of $13,630 for full-time infant care, followed by Massachusetts, Minnesota, Colorado, and California. 22 According to CLASP’s calculations of American Consumer Data (2009), in 2008, 43.1 percent of children under age 6 lived in families with incomes under 200 percent of the federal poverty level (as compared to 43.5 percent nationwide.
25
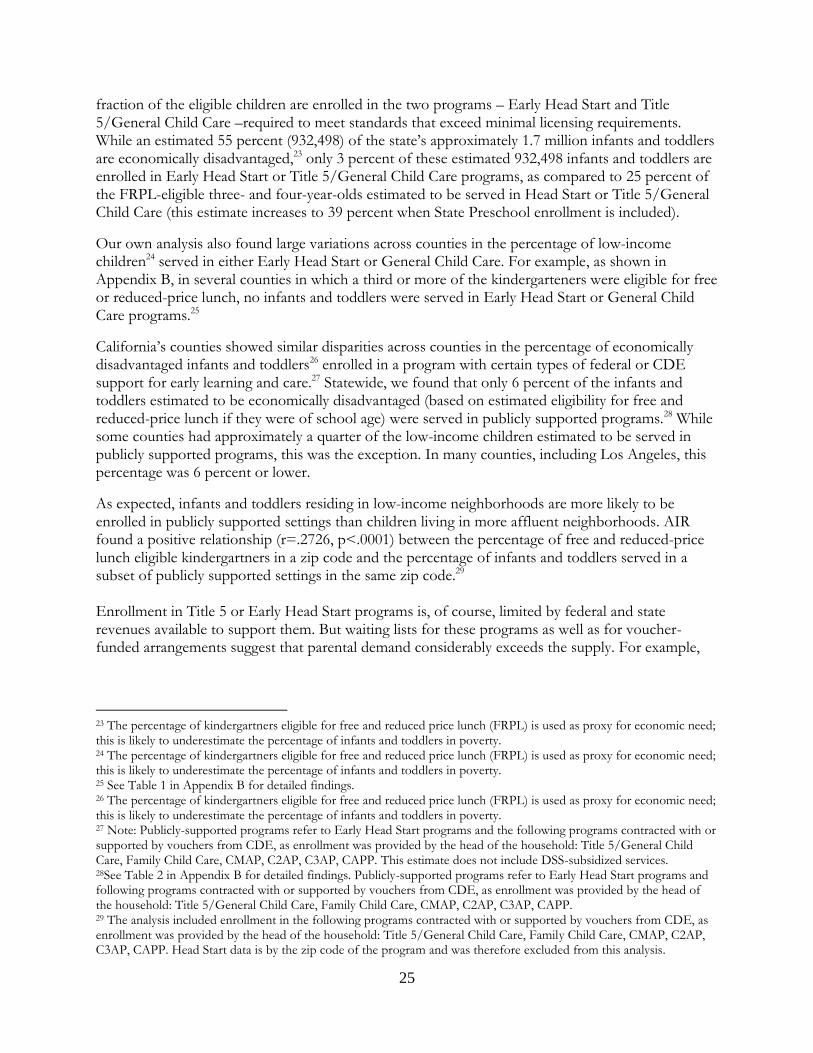
fraction of the eligible children are enrolled in the two programs – Early Head Start and Title 5/General Child Care –required to meet standards that exceed minimal licensing requirements. While an estimated 55 percent (932,498) of the state’s approximately 1.7 million infants and toddlers are economically disadvantaged,23 only 3 percent of these estimated 932,498 infants and toddlers are enrolled in Early Head Start or Title 5/General Child Care programs, as compared to 25 percent of the FRPL-eligible three- and four-year-olds estimated to be served in Head Start or Title 5/General Child Care (this estimate increases to 39 percent when State Preschool enrollment is included).
Our own analysis also found large variations across counties in the percentage of low-income children24 served in either Early Head Start or General Child Care. For example, as shown in Appendix B, in several counties in which a third or more of the kindergarteners were eligible for free or reduced-price lunch, no infants and toddlers were served in Early Head Start or General Child Care programs.25
California’s counties showed similar disparities across counties in the percentage of economically disadvantaged infants and toddlers26 enrolled in a program with certain types of federal or CDE support for early learning and care.27 Statewide, we found that only 6 percent of the infants and toddlers estimated to be economically disadvantaged (based on estimated eligibility for free and reduced-price lunch if they were of school age) were served in publicly supported programs.28 While some counties had approximately a quarter of the low-income children estimated to be served in publicly supported programs, this was the exception. In many counties, including Los Angeles, this percentage was 6 percent or lower.
As expected, infants and toddlers residing in low-income neighborhoods are more likely to be enrolled in publicly supported settings than children living in more affluent neighborhoods. AIR found a positive relationship (r=.2726, p<.0001) between the percentage of free and reduced-price lunch eligible kindergartners in a zip code and the percentage of infants and toddlers served in a subset of publicly supported settings in the same zip code.29 Enrollment in Title 5 or Early Head Start programs is, of course, limited by federal and state revenues available to support them. But waiting lists for these programs as well as for voucher-funded arrangements suggest that parental demand considerably exceeds the supply. For example,
23 The percentage of kindergartners eligible for free and reduced price lunch (FRPL) is used as proxy for economic need; this is likely to underestimate the percentage of infants and toddlers in poverty. 24 The percentage of kindergartners eligible for free and reduced price lunch (FRPL) is used as proxy for economic need; this is likely to underestimate the percentage of infants and toddlers in poverty. 25 See Table 1 in Appendix B for detailed findings. 26 The percentage of kindergartners eligible for free and reduced price lunch (FRPL) is used as proxy for economic need; this is likely to underestimate the percentage of infants and toddlers in poverty. 27 Note: Publicly-supported programs refer to Early Head Start programs and the following programs contracted with or supported by vouchers from CDE, as enrollment was provided by the head of the household: Title 5/General Child Care, Family Child Care, CMAP, C2AP, C3AP, CAPP. This estimate does not include DSS-subsidized services. 28See Table 2 in Appendix B for detailed findings. Publicly-supported programs refer to Early Head Start programs and following programs contracted with or supported by vouchers from CDE, as enrollment was provided by the head of the household: Title 5/General Child Care, Family Child Care, CMAP, C2AP, C3AP, CAPP. 29 The analysis included enrollment in the following programs contracted with or supported by vouchers from CDE, as enrollment was provided by the head of the household: Title 5/General Child Care, Family Child Care, CMAP, C2AP, C3AP, CAPP. Head Start data is by the zip code of the program and was therefore excluded from this analysis.

26
according to the California Head Start Association (January 2009), approximately 300,000 infants and toddlers were waiting for Early Head Start services as of 2009.30 Availability of Licensed Programs In contrast, while Early Head Start programs and state-contracted General Child Care programs tend to be located in low-income neighborhoods, other types of privately operated, licensed infant/toddler arrangements are less likely to be available. Examining zip code level data from the CCR&R, which provides information on the location of licensed child care centers and family child care homes throughout the state, we found a negative relationship between the percentage of free and reduced-price lunch eligible kindergartners in a zip code, and the availability of any sort of licensed child care center or FCCH program (r=-.0733, p<.05) in the same zip code. In other words, licensed programs were less likely to be in areas of greater economic need. This finding is in keeping with other research. For example, a study of 100 counties nationwide found clear inequalities associated with county wealth and demographic features in the availability of preschools and child care centers (Fuller, 1996). Although our data are insufficient to determine the reasons for the lower availability of licensed centers and family child care homes in low-income neighborhoods, we can offer some hypotheses. First, the high cost of infant care is likely a major factor. Unless families qualify for Early Head Start or some other form of subsidized child care, they cannot afford to use licensed programs because they cannot afford to pay the full cost of infant or toddler care. Hence, even if families would prefer some form of licensed care, they may be unable to afford it. Providers, unless they are under state contract or can rely on a steady stream of voucher payments, may be in turn reluctant to establish programs in low-income neighborhoods. Alternatively, low-income families may have more irregular work hours than parents in more affluent neighborhoods, and hence may find unlicensed arrangements are more flexible in accommodating their non-traditional work schedules.
30 According to the California Child Care Resource and Referral Network (2009), California only has licensed slots for 27 percent of children ages birth to thirteen with parents in the labor force.

27
Access to Child Care by Race and Ethnicity Access to child care in California also appears to be unevenly distributed by race and ethnicity. As shown in Table 3, Latinos constituted the majority of children (52 percent) born in California in 2008; according to the National Center for Children in Poverty (2009b), 62 percent of young Latino children under age 6 are in low-income families. Similarly, 56 percent of young black children are in low-income families, while less than a quarter of young white and Asian children are low income. Table 3. Births by Ethnicity, 2008
Ethnicity Births, 2008 Percentage of Total, 2008
Hispanic 287,323 52.1%
White 146,309 26.5%
Asian 35,355 6.4%
Black 29,428 5.3%
Filipino 14,491 2.6%
Southeast Asian 14,062 2.5%
Two or More Races 10,792 2.0%
Other 9,294 1.7%
Hawaiian/Pacific Islander 2,481 0.4%
American Indian 2,032 0.4%
Total Births, 2008 551,567 100.0%
Source: California Department of Public Health (DPH) Birth Profiles by Zip Code, 2008
However, while Latino children represent a majority of young children in the state, according to the CHIS 2007, of those families who reported that their birth-to-two-year-old children had regular, non-parental child care31 for 10 or more hours per week, 54 percent were white, followed by 19 percent Latino, 12 percent Asian, 7 percent other, 6 percent African American, and 2 percent American Indian or Alaskan Native. Shortages of licensed programs are especially acute in neighborhoods with a high percentage of Latino children. As Espinosa (2008) concluded, Latino children ―attend out-of-home center-based programs at lower rates because of financial constraints and lack of access… and often cannot find affordable programs in their neighborhoods.‖
31 According to the CHIS, this refers to any arrangement in which someone other than parents, a legal guardian, or stepparents take care of a child.

28
Possible Implications
The findings of this needs assessment have several implications for future work and policy direction related to the early care and education of infants and toddlers.
Implementation of Quality Rating Scale According to Lally (forthcoming), appropriate practice and policies, not the setting, are the most important factors in determining the quality of child care for infants and toddlers. But information on the nature of those practices and policies is sorely lacking for this especially vulnerable age group. As noted above, parents want quality care for their children, but are not skilled in identifying it. Hence, the Cost, Quality and Child Outcome study (Helburn, 1995) recommended rating programs based on ECERS and ITERS scores to help families identify quality settings. Establishing a QRS could be an extremely useful consumer protection tool, with the family as the purchaser of services and the ultimate ―consumer‖ defined as the infant or toddler in care.
Monitoring and Incentives California has fewer monitoring requirements than many states for publicly funded license-exempt providers. For the sake of accountability, California might look to states with more stringent requirements. For example, California might consider offering a lower rate for subsidized exempt care than for licensed family care, thereby providing an incentive for exempt providers to meet the requirements for licensure. At a minimum, as in Oregon and New York, California could require providers, in order to qualify for an enhanced rate, to participate in training and to agree to be visited by an inspector. We advance these suggestions in the midst of a state budget crisis in California, where the frequency of required inspections even of licensed facilities has been reduced to once every five years and where further reductions in the capacity of licensing staff to monitor facilities may be on the horizon. Also, our proposal that the state consider offering differential payments to licensed family child care as opposed to exempt providers is being advanced in a highly charged climate where the governor has proposed cuts to CalWORKs and to General Child Care programs.
Home Visiting Expansion The federal expansion of home visiting programs will also affect infant/toddler child care. On March 23, 2010, President Obama signed the Patient Protection and Affordable Care Act into law. This legislation includes a provision that establishes a home visiting grant program administered by the Health Resources and Services Administration in the Department of Health and Human Services (DHHS), and is designed to support states in the provision of evidence-based home visitation services.

29
The home visitation program will help address the fact that high-risk families often have fewer resources in their neighborhoods.32 The program will provide matching grants to states and territories for home visits to high-risk families and pregnant women. The initiative will provide $1.5 billion dollars in guaranteed funding for home visitation over a period of 5 years. Starting at $100 million in the 2010 fiscal year, funding for the program will increase annually, to $400 million in the 2014 fiscal year (National Center for Parents as Teachers, 2010). The home visitation program will also promote the expansion of more in-depth needs assessments of infant/toddler child care. As a condition of receiving the funds, states must submit a needs assessment to DHHS no later than six months after enactment (September 2010). This needs assessment would include a detailed analysis of home visiting services in the state, the number and characteristics of the families being served, how these services are meeting the needs of families, and service delivery gaps. These data have the potential to greatly influence policy. Although impressive, the $1.5 billion needs to be split among 50 states over a period of 5 years. California should consider innovative ways to make the most of the funding. For example, research suggests that California might benefit from pursuing opportunities to link home visiting programs to publicly-funded FFN arrangements (CLASP, 2009). This additional support has the potential to promote healthy child development, school readiness, and family functioning, and to help foster lifelong nurturing and positive relationships between FFN providers and the children in their care.
Publicizing Paid Family Leave
Paid leave provides families with an invaluable benefit—the chance to spend more time with their newborns. However, many expectant and new parents are not aware of their eligibility for Paid Family Leave. Research has found that awareness of the program increased from 2003, before its enactment, to 2005, the program’s first full year, but leveled off between 2005 and 2007 (Milkman, 2008; Milkman and Applebaum, 2004). In the summer of 2007, of the California adults surveyed, 69 percent were aware of the State Disability Insurance and 55 percent were aware of the federal Family and Medical Leave Act, but only 28 percent were aware of California’s new Paid Family Leave. Furthermore, 18 months after it took effect, knowledge of California’s paid family leave program was low, with only 18 percent of working parents with chronically ill children having heard of it (Schuster et al., 2008). The parental leave provisions may have been better publicized than other portions of the law. Physicians and hospitals, as with child care resource and referral agencies in California, routinely inform expectant and new parents about the program, according to Lilian Miwa Maher, Paid Family Leave outreach coordinator for the Legal Aid Society-Employment Law Center in San Francisco, but there is still a lot of confusion among both employers and employees about how to apply for the benefits.
Publicity about the benefit needs to be expanded. The Employment Development Department has only had the resources to conduct one publicity campaign about the program, in 2005, but given the
32 High risk families are defined as families who have the following characteristics: living in communities of need as identified in the statewide needs assessment; low-income; pregnant women under the age of 21; a history of child abuse or neglect; a history of substance abuse or need substance abuse treatment; tobacco users in the home; low family or student academic achievement; children with developmental delays or disabilities; or currently or formerly in Armed Forces.

30
percentage of the public that was unaware of the support as of 2007, and the potential support to families, additional efforts are warranted.
Addressing Data Gaps Data gaps and the lack of a central repository of information limit the current assessment of the supply and demand of infant/toddler child care. Various agencies were quite generous and responsive in their provision of data to help inform this assessment; however, a central repository of information would facilitate future efforts. Furthermore, some data, such as the number of children served by home visiting programs by zip code, are not readily available. A unique child identifier would greatly inform a needs assessment of this age cohort. First, the use of a child identifier would allow linking across data sets and thereby provide more accurate and comprehensive data. For example, this would allow researchers to identify the extent to which children are served in more than one setting and whether high quality programs affect child outcomes in elementary school. Second, to get an accurate count of which children are being served, enrollment data for all publicly subsidized programs should be collected by the zip code of the child’s residence, age cohort, and type of program (e.g., licensed, voucher, and exempt care). Finally, a current study of the supply and quality of infant/toddler child care is needed. The last comprehensive study of infant/toddler programs was conducted in 1995 (Helburn). The child care field would benefit from an updated study of infant/toddler arrangements that used the Infant Toddler Environmental Rating Scale (ITERS) and the Family Child Care Environmental Rating Scale (FCCERS) assessments in a sample of infant/toddler centers and licensed and exempt home-based providers to determine quality. For example, the above-mentioned RAND study of preschool programs included resources sufficient to allow site visits including assessments using ECERS and the Classroom Learning Assessment Scoring System (CLASS) in 251 centers. But given the far different landscape of infant/toddler care as opposed to preschool care, an infant/toddler study should also include licensed family child care homes and exempt home-based care settings. This study could be further informed by a parent survey regarding infant/toddler arrangements.

31
References
American Institutes for Research. (2010). County data and maps. Retrieved April 16, 2010, from: http://www.earlylearningsystems.org/county-data-maps
Anthony, J. J., Manship, K., Liu, C., & Muenchow, S. (2009). Preschool supply and demand in the state of
California: An assessment of preschool enrollment in publicly contracted and privately operated preschool programs. San Mateo, CA.
California Child Care Resource and Referral (CCR&R) Network. (2009). 2009 California child care
portfolio. San Francisco, CA: Author. California Child Care Resource and Referral (CCR&R) Network (2008). 2008 capacity data. San
Francisco, CA: Author California Department of Education. (2008, April). Number of children enrolled in programs administered by
the Child Development Division by program type and setting type. Curriculum and Instruction Branch, Child Development Division. Sacramento, CA: Author;
California Department of Public Health (DPH). (2008). California birth profiles by zip code, 2008.
Retrieved September 26, 2009, from: http://www.cdph.ca.gov/data/statistics/Pages/BirthProfilesbyZIPCode.aspx
California Department of Social Services (June 2009). Licensing of facilities for children: Monthly statistical
report. Sacramento, CA: Author. California Department of Social Services. (October 2009). Child care quarterly update. Sacramento, CA:
Author. California Department of Social Services (October 2008). Licensing of facilities for children: Monthly
statistical report. Sacramento, CA: Author. California Head Start Association. (January 2009). Head Start in California: Facts and figures.
Sacramento, CA: Author. Capizzano, J., Adams, G., & Sonenstein, F. (2000). Child care arrangements for children under five:
Variation across states. New Federalism: National Survey of America’s Families, Series B (No. B-7). Washington, DC: The Urban Institute.
Center for Research on Women. (2004). The cost and quality of full-day year-round early care and education in
Massachusetts: Infant and toddler classrooms. Administration for Children and Families and the Massachusetts Department of Education.
Chernoff, J. J., McPhee, C., & Park, J. (2007). Preschool: First findings from the third follow-up of the Early
Childhood Longitudinal Study, Birth Cohort (ECLS-B).

32
Child Care Bureau. FFY2007 CCDF Data Tables (Preliminary Estimates) Table 6, 2008. Retrieved May 12, 2010, from: http://www.acf.hhs.gov/programs/ccb/data/index.htm.
Children’s Defense Fund. (2003). Infants and toddlers are particularly vulnerable: Good child care and early
education can play a vital role in their development. Retrieved May 12, 2010, from: http://ferret.bls.census.gov/macro/032002/faminc/toc.htm.
Clarke-Stewart, K. A., Vandell, D. L., Burchinal, M., O'Brien, M., & McCartney, K. (2002). Do
regulable features of child-care homes affect children’s development? Early Childhood Research Quarterly, 17(1), 52-86.
CLASP. (2009). Extending home visiting to kinship caregivers and family, friend, and neighbor caregivers.
Washington, DC: Author.
CLASP. (2009). DataFinder. http://www.clasp.org/data. Accessed April 1, 2010.
Collins, J., Layzer, I., Kreader, J. L., Werner, A., and Glantz, F. B. (November 2000). National Study of Child Care for Low-Income Families: State and community substudy report. Cambridge, MA: Abt Associates, Inc.
Daro, D. (2009). Embedding home visitation programs within a system of early childhood services. Chicago: Chapin Hall at the University of Chicago.
Department of Health and Human Services Administration for Children and Families. (2010). 2010
budget: Payments to states for home visitation. Author: Washington, DC. Ehrle, J., Adams, G., & Tout, K. (2001). Who’s caring for our youngest children? Child care patterns of infants
and toddlers. Washington, DC: Urban Institute. Employment Development Department (EDD, State of California). (2009). State disability insurance
statistical information: Paid family leave program statistics. Sacramento, CA: Author. Employment Development Department (EDD, State of California). (2010). Overview—disability.
http://www.edd.ca.gov/Disability/. Accessed May 21, 2010. Employment Development Department (EDD, State of California). (2010). National vital statistics
reports. Retrieved May 10, 2010, from: http://www.edd.ca.gov/About_EDD/Quick_Statistics.htm.
Espinosa, L. (2008). Challenging common myths about young English language learners. New York:
Foundation for Child Development. Family Violence Prevention Fund. (2010). Realizing the promise of home visitation: Addressing domestic
violence and child maltreatment. San Francisco, CA: Author. Fight Crime: Invest In Kids California. (2001). California’s child care crisis: A crime prevention tragedy.
Oakland, CA: Author.

33
First 5 California. (2009). First 5 California 2008-09 annual report. Sacramento, CA: Author. First 5 California. (2008). First 5 California 2007-08 annual report. Sacramento, CA: Author. First 5 Contra Costa County. (2010). Home visiting programs. Retrieved April 15, 2010, from:
http://www.firstfivecc.org/index.php?page=home-visiting Fram, M. S., & Kim, J. (2008). Race/ethnicity and the start of child care: A multi-level analysis of
factors influencing first child care experiences. Early Childhood Research Quarterly, (23)4, 575-590.
Fuller, B., & Liang, X. (1996). Market failure? Estimating inequality in preschool availability. Educational Evaluation and Policy Analysis, (18)1, 31-49.
Galinsky, E., Howes, C., Kontos, S., & Shinn, M. (1994). The study of children in family child care and
relative care: Highlights of findings. New York: Families and Work Institute. Gomby, D. S. (2005). Home visitation in 2005: Outcomes for children and parents. Invest in Kids working
paper No. 7. Retrieved May 11, 2010, from: www.ced.org/projects/kids.shtm Gomby, D. S. (2000). Promise and limitations of home visitation. Journal of the
American Medical Association, 284(11), 1430-1431.
Gomby, D.S., Culross, P.L., & Behrman, R.E. (1999). Home visiting: Recent program evaluations. The Future of Children (9)1.
Gormley, W., & Phillips, D. (February 2005). The effects of universal pre-K in Oklahoma: Research
highlights and policy implications. Policy Studies Journal. 65-82. Hart, P. D. (2002). A statewide survey of attitudes toward early education. Washington, DC: Peter D. Hart
Research Associates, Inc. Healthy Families America. (2010). Healthy Families America overview. Retrieved April 15, 2010, from:
http://www.healthyfamiliesamerica.org/about_us/index.shtml Helburn, S. W. (2005). Cost, quality, and child outcomes in child care centers. Technical report. Denver
Department of Economics Center for Research in Economic and Social Policy, University of Colorado at Denver.
Hoffman, E., & Perrin, T. C. (2009). Extending home visiting to kinship caregivers and family, friend, and
neighbor caregivers. Washington, DC: CLASP. Jacobson Chernoff, J., Flanagan, K. D., McPhee, C., & Park, J. (2007). Preschool: First findings from the
preschool follow-up of the Early Childhood Longitudinal Study, Birth Cohort (ECLS-B) (NCES 2008-025). Washington, DC: National Center for Education Statistics, Institute of Education Sciences, U.S. Department of Education.
Johnson, K. (2009). State-Based Home Visiting: Strengthening Programs through State Leadership. New York,
NY: National Center for Children in Poverty.

34
Karoly, L. A. (2009). Preschool adequacy and efficiency: Issues, policy options, and recommendations. Santa
Monica, CA: RAND. Karoly, L. A., Ghosh-Dastidar, B., Zellman, G. L., Perlman, M., & Fernyhough, L. (2008). The nature
and quality of early care and education for preschool-age children in California. Santa Monica, CA: RAND. Karoly, L. A., Kilburn, M. R., & Cannon, J. S. (2005). Early childhood interventions: Proven results, future
promise. Santa Monica, CA: RAND. Lally, J. R., Mangione, P. L., & Honig, A. S. (1988). The Syracuse University Family Development
Research Program: Long-range impact of an early intervention with low-income children and their families. In D. Powell (Ed.), Parent education as early childhood intervention: Emerging directions in theory, research, and practice. (pp. 79-104). Norwood, NJ: Ablex.
Lally, R. (forthcoming). The link between consistent caring interactions with babies, early brain
development, & school readiness. In E. Zigler, W. Gilliam, & W. Barnett. (Eds.), Current debates and issues in prekindergarten education. Baltimore, MD: Brookes Publishing.
Milkman, R. (2008). New data on paid family leave. UCLA California Family Leave Research Project.
Mulligan, G. M., and Flanagan, K. D. (2006). Age 2: Findings from the 2-year-old follow-up of the Early Childhood Longitudinal Study, Birth Cohort (ECLS-B) (NCES 2006-043). Washington, DC: National Center for Education Statistics.
National Association of Child Care Resource & Referral Agencies and California Child Care Resource and Referral Network. (2009). 2009 child care in the State of California. Retrieved May 12, 2010, from: www.naccrra.org/randd/data/docs/CA.pdf
National Association of Child Care Resource & Referral Agencies (NACCRRA). (2009). Parents and the high price of child care: 2009 update. Arlington, VA: Author.
National Association for Family Child Care. Retrieved August 12, 2009, from: http://www.nafcc.org/accreditation/about_accreditation.asp
National Center for Children in Poverty. (2009a). Basic needs budget calculator. Retrieved April 1, 2010, from: http://www.nccp.org/tools/frs/budget.php
National Center for Children in Poverty. (2009b). State profiles. Retrieved April 1, 2010, from: http://www.nccp.org/profiles/demographics.html.
National Center for Parents as Teachers. (2010). Summary of maternal, infant and early childhood home visiting program enacted as part of the Patient Protection and Affordable Care Act (P.L. 111-148). St. Louis, Missouri: Author.
National Child Care Information and Technical Assistance Center (NCCIC). (2008).
Health and safety requirements for license-exempt FCC homes paid with CCDF funds. Fairfax, VA: Author.

35
National Institute of Child Health and Human Development Early Child Care Research Network.
(2003). Does amount of time spent in child care predict socioemotional adjustment during the transition to kindergarten? Child Development, 74, 976-1005.
National Research Council. (2000). From neurons to neighborhoods: The science of early childhood development. Washington, DC: National Academy Press.
NICHD Early Child Care Research Network. (2002). Early child care and children’s development prior to school entry: Results from the NICHD study of early child care. American Educational Research Journal, 39, 133-164.
Nurse-Family Partnership. (2010). Retrieved April 2, 2010, from: http://www.nursefamilypartnership.org/locations/California
Parent-Child Home Program. (2010). Retrieved April 15, 2010, from: http://www.parent-
child.org/aboutus/index.html. Paulsell, D., Cohen, J., Stieglitz, A., Lurie-Hurvitz, E., Fenichel, E., & Kisker, E. (2002). Partnerships
for quality: Improving infant-toddler child care for low-income families. Washington, DC: Zero to Three and Mathematica Policy Research, Inc.
Program for Infant Toddler Care. (2009). Preparing the way for California’s infants and toddlers: The program for infant/toddler care 2008-09 year-end report to the California Department of Education. WestEd Center for Child and Family Studies.
Ramey, C. T., Campbell, F. A., Burchinal, M., Skinner, M. L., Garner, D. M., & Ramey, S. L. (2000). Persistent effects of early childhood education on high-risk children and their mothers. Applied Developmental Science, 4(1), 2-14.
Susman-Stillman, A. (2005). Current directions in family, friend, and neighbor care: An interim report. University of Minnesota, Center for Early Education and Development.
Susman-Stillman, A., & Banghart, P. (2008). Demographics of family, friend, and neighbor child care
in the United States: Literature review. Child Care and Early Education Research Connections. Retrieved May 12, 2010, from: http://www.childcareresearch.org/childcare/resources/14338?q=demographics+of+family%2C+friend+
Urban Institute and Child Trends. (1997). National survey of America's families (NSAF). Ann Arbor, MI: Inter-university Consortium for Political and Social Research [distributor].
U.S. Census Bureau. (2008). Poverty and median income estimates – Small Area Estimates Branch. Retrieved November 11, 2009, from: http://www.census.gov/did/www/saipe/data/statecounty/data/2007.html

36
U.S. Census Bureau, CPS (2007). Annual social and economic supplement. Retrieved May 12, 2010, from: http://pubdb3.census.gov/macro/032008/pov/new46_185200_07.htm and http://pubdb3.census.gov/macro/032008/pov/new46_185200_03.htm
U.S. Department of Education. (2010). Retrieved from the Internet on 4/15/2010 at:
http://www2.ed.gov/programs/evenstartformula/index.html U.S. Department of Health and Human Services. (2009). Receipt of public assistance and determining
eligibility for Head Start. Retrieved November 11, 2009, from: http://eclkc.ohs.acf.hhs.gov/hslc/Program%20Design%20and%20Management/Head%20Start%20Requirements/PIs/1999/resour_pri_00605_021506.html
U.S. General Accounting Office. (2000). State efforts to enforce safety and health requirements. Washington, DC: GAO/HEHS-00-28. Vandell, D. L., Belsky, J., Burchinal, M., Steinberg, L., Vandergrift, N., & NICHD Early Child Care
Research Network (2010). Do effects of early child care extend to age 15 years? Results from the NICHD study of early child care and youth development. Irvine, CA: University of California.
Welcome Every Baby Newborn Home Visiting Program. (2010). Retrieved April 15, 2010, from:
http://www.welcomeverybaby.org/ Whitebook, M., Sakai, L., Gerber, E., & Howes, C. (2001). Then and now: Changes in child care staffing,
1994-2000 technical report. Washington, DC: Center for the Childcare Workforce.

37
Appendix A: The California Department of Education’s Child Care and Development Programs The following descriptions are excerpted from the California Department of Education’s website (http://www.cde.ca.gov/sp/cd/op/cdprograms.asp).
General Child Care and Development
General child care and development programs are state and federally funded programs that use centers and family child care home networks operated or administered by either public or private agencies and local educational agencies. These agencies provide child development services for children from birth through 12 years of age and older children with exceptional needs. These programs provide an educational component that is developmentally, culturally, and linguistically appropriate for the children served. The programs also provide meals and snacks to children, parent education, referrals to health and social services for families, and staff development opportunities to employees.
Migrant Child Care and Development
Migrant child care and development programs serve the children of agricultural workers while their parents are at work. The centers are open for varying lengths of time during the year, depending largely on the harvest activities in the area. In addition to these center-based programs, the budget for fiscal year 2007-08 continues to provide for the Migrant Alternative Payment Network Program that allows eligibility and funding for services that follow migrant families as they move from place to place to find work in the Central Valley.
California State Preschool Program
Chapter 308, Statutes of 2008 Assembly Bill 2759, created the California State Preschool program. This program consolidated the funding for State Preschool, Prekindergarten and Family Literacy, and General Child Care center-based programs serving eligible three- and four-year-old children to create the California State Preschool Program, the largest state-funded preschool program in the nation. The program provides both part-day and full-day services that provides a core class curriculum that is developmentally, culturally, and linguistically appropriate for the children served. The program also provides meals and snacks to children, parent education, referrals to health and social services for families, and staff development opportunities to employees. The program is administered through local educational agencies, colleges, community-action agencies, and private nonprofit agencies.
Severely Handicapped Program
The severely handicapped programs located in the San Francisco Bay Area provide care and supervision, age and developmentally appropriate activities, therapy, youth guidance, and parental counseling to eligible children and young adults from birth to 21 years of age. Recipients of these

38
services must have an individualized education plan (IEP) or an individualized family service plan (IFSP) issued through special education programs.
Alternative Payment Program
Alternative payment programs (APPs), funded with state and federal funds, offer an array of child care arrangements for parents, such as in-home care, family child care, and center-based care. The APP helps families arrange child care services and makes payment for those services directly to the child care provider selected by the family. The APP is intended to increase parental choice and accommodate the individual needs of the family.
CalWORKs Child Care
Recipients of the California Work Opportunity and Responsibility to Kids (CalWORKs) grant program are required to engage in work or work preparation activities. CalWORKs programs provide an array of welfare-to-work services. Child care is provided with state and federal funds in three stages. Stage 1 is administered by the California Department of Social Services through county welfare departments (CWDs). Stage 1 begins when a participant enters the CalWORKs grant program and engages in activities pursuant to a welfare-to-work plan developed by the CWD for each family. The CWDs refer families to resource and referral agencies to assist them in finding child care providers. Some CWDs pay those providers directly for the services performed. Many CWDs have a sub-contract with APPs to pay for the child development services. Stage 2 is administered by CDE through its APPs. CalWORKs families are transferred into Stage 2 when the CWD deems the family to be stable. Participation in Stage 1 and/or Stage 2 is limited to two years after the family stops receiving a CalWORKs grant. In addition to the services that CDE provides, small portions of the services in Stage 2 are administered by the California community colleges through its centers or an AP delivery system for the benefit of students. Stage 3 is also administered by CDE through its APPs. A family can move to this stage when it has exhausted its two-year limit in Stage 1 and/or Stage 2 (referred to as timing out), and for as long as the family remains otherwise eligible for child care programs.

39
Appendix B: Low-income Infants and Toddlers Served in Publicly-Supported Programs Table 1. Percentage of FRPL-eligible Infants and Toddlers Served in Early Head Start or General Child Care/Title 5 Programs
County
Estimated Total of Infants
and Toddlers
Number of Infants
and Toddlers Served in
Early Head Start*
Total of Infants
and Toddlers Served in General
Child Care
Total of Infants and
Toddlers Served in
Early Head Start or General
Child Care*
Percent of Infants and
Toddlers Who Are FRPL-
Eligible
Percentage of FRPL-Eligible
Infants and Toddlers Served
in Early Head Start or General
Child Care*
Modoc 157 126 11 137 62% ~100%
Calaveras 1,103 109 3 112 36% 28%
San Luis Obispo 8,356 854 81 935 42% 27%
El Dorado 5,619 200 125 325 24% 24%
Yuba 3,903 444 23 467 60% 20%
Humboldt 4,765 224 171 395 50% 17%
Siskiyou 1,266 100 12 112 51% 17%
Colusa 1,134 111 17 128 72% 16%
Glenn 1,351 99 28 127 66% 14%
Marin 8,192 128 143 271 24% 14%
Lake 2,117 104 40 144 65% 11%
Shasta 6,562 288 90 378 50% 11%
Santa Cruz 11,161 475 104 579 53% 10%
Mendocino 3,357 85 94 179 59% 9%
Inyo 670 0 29 29 52% 8%
Stanislaus 26,065 995 242 1,237 58% 8%
Imperial 9,416 340 158 498 76% 7%
Lassen 780 0 24 24 43% 7%
Placer 11,843 161 14 175 22% 7%
Madera 7,723 181 32 213 48% 6%
Napa 5,067 85 74 159 51% 6%
San Joaquin 34,216 633 558 1,191 56% 6%
Tuolumne 1,412 3 31 34 40% 6%
Alameda 63,430 640 707 1,347 42% 5%
Contra Costa 39,940 299 463 762 38% 5%
Kings 8,103 112 103 215 56% 5%
Yolo 7,815 122 66 188 46% 5%
Plumas 473 0 5 5 27% 4%
Sacramento 65,221 822 548 1,370 56% 4%
San Benito 2,559 0 59 59 52% 4%
San Francisco 26,678 186 526 712 63% 4%
San Mateo 27,358 164 255 419 37% 4%

40
County
Estimated Total of Infants
and Toddlers
Number of Infants
and Toddlers Served in
Early Head Start*
Total of Infants
and Toddlers Served in General
Child Care
Total of Infants and
Toddlers Served in
Early Head Start or General
Child Care*
Percent of Infants and
Toddlers Who Are FRPL-
Eligible
Percentage of FRPL-Eligible
Infants and Toddlers Served
in Early Head Start or General
Child Care*
Santa Barbara 18,645 185 204 389 58% 4%
Tulare 25,155 333 332 665 72% 4%
Butte 7,612 0 118 118 52% 3%
Del Norte 997 2 17 19 63% 3%
Fresno 50,783 474 566 1,040 67% 3%
Kern 45,403 398 550 948 64% 3%
Nevada 2,515 0 14 14 22% 3%
San Diego 142,113 1,423 775 2,198 48% 3%
Sonoma 17,242 52 96 148 28% 3%
Los Angeles 457,707 2,206 5,015 7,221 66% 2%
Monterey 22,005 110 238 348 73% 2%
Riverside 100,550 228 636 864 55% 2%
Santa Clara 82,749 219 599 818 41% 2%
Solano 17,179 0 110 110 38% 2%
Sutter 4,512 0 44 44 53% 2%
Ventura 36,500 205 57 262 47% 2%
Merced 13,717 8 76 84 70% 1%
Orange 130,277 173 592 765 47% 1%
San Bernardino 103,062 0 557 557 61% 1%
Alpine 36 0 0 0 55% 0%
Amador 841 0 0 0 35% 0%
Mariposa 432 0 0 0 43% 0%
Mono 490 0 0 0 53% 0%
Sierra 27 0 0 0 42% 0%
Tehama 2,239 0 2 2 63% 0%
Trinity 305 0 0 0 61% 0%
STATEWIDE 1,680,905 14,106 15,434 29,540 55% 3% *Note: Early Head Start data is by the zip code of the program; therefore, this table may underestimate enrollment in counties with children who are served by an Early Head Start program in an adjacent county.

41
Table 2. Percentage of FRPL-Eligible Infants and Toddlers Served in Publicly Supported Programs
County
Estimated Total of Infants and Toddlers
Estimated Total of Infants and
Toddlers Served in Publicly-Supported
Programs*
Estimated Percentage of
Infants and Toddlers Served in Publicly-Supported
Programs*
Estimated Percentage of FRPL-Eligible
Infants and Toddlers Served in Publicly-Supported
Programs*
Modoc 157 166 106% ~100%
Plumas 473 75 16% 58%
San Luis Obispo 8,356 1,314 16% 38%
Calaveras 1,103 143 13% 36%
El Dorado 5,619 422 8% 31%
Siskiyou 1,266 191 15% 30%
Nevada 2,515 145 6% 26%
Sierra 27 3 11% 26%
Humboldt 4,765 586 12% 25%
Trinity 305 44 14% 24%
Yuba 3,903 532 14% 23%
Lassen 780 73 9% 22%
Glenn 1,351 188 14% 21%
Alpine 36 4 11% 20%
Colusa 1,134 157 14% 19%
Shasta 6,562 634 10% 19%
Marin 8,192 344 4% 18%
Lake 2,117 233 11% 17%
Inyo 670 57 9% 16%
Mendocino 3,357 288 9% 15%
Placer 11,843 373 3% 14%
Tuolumne 1,412 82 6% 14%
Amador 841 37 4% 13%
Imperial 9,416 849 9% 12%
Santa Cruz 11,161 729 7% 12%
Stanislaus 26,065 1,777 7% 12%
Butte 7,612 446 6% 11%
Madera 7,723 412 5% 11%
Mariposa 432 21 5% 11%
San Joaquin 34,216 2,067 6% 11%
Sonoma 17,242 524 3% 11%
Yolo 7,815 400 5% 11%
Contra Costa 39,940 1,557 4% 10%
Tehama 2,239 134 6% 10%
Alameda 63,430 2,296 4% 9%
Kings 8,103 391 5% 9%
Napa 5,067 237 5% 9%
Sacramento 65,221 3,413 5% 9%
Solano 17,179 496 3% 8%

42
County
Estimated Total of Infants and Toddlers
Estimated Total of Infants and
Toddlers Served in Publicly-Supported
Programs*
Estimated Percentage of
Infants and Toddlers Served in Publicly-Supported
Programs*
Estimated Percentage of FRPL-Eligible
Infants and Toddlers Served in Publicly-Supported
Programs*
Del Norte 997 47 5% 7%
Fresno 50,783 2,301 5% 7%
Kern 45,403 2,063 5% 7%
San Benito 2,559 87 3% 7%
San Mateo 27,358 675 2% 7%
Santa Clara 82,749 2,335 3% 7%
Tulare 25,155 1,225 5% 7%
San Diego 142,113 4,076 3% 6%
San Francisco 26,678 1,074 4% 6%
Santa Barbara 18,645 623 3% 6%
Sutter 4,512 141 3% 6%
Los Angeles 457,707 15,454 3% 5%
Merced 13,717 493 4% 5%
Mono 490 12 2% 5%
Monterey 22,005 872 4% 5%
Ventura 36,500 858 2% 5%
Riverside 100,550 2,229 2% 4%
Orange 130,277 1,755 1% 3%
San Bernardino 103,062 1,445 1% 2%
STATEWIDE 1,680,905 59,605 4% 6% *Note: Publicly-supported programs refer to Early Head Start programs and the following programs contracted with or supported by vouchers from CDE: Title 5/General Child Care, Family Child Care, CMAP, C2AP, C3AP, and CAPP.