
California Health Care Employment Outlook: 2010-20 Richard Holden Regional Commissioner U.S. Bureau...
78
California Health Care Employment Outlook: 2010-20 Richard Holden Regional Commissioner U.S. Bureau of Labor Statistics CHWA/CHPC Meeting September 6, 2012
-
Upload
charles-owen -
Category
Documents
-
view
213 -
download
0
Transcript of California Health Care Employment Outlook: 2010-20 Richard Holden Regional Commissioner U.S. Bureau...

California Health Care Employment Outlook:
2010-20
Richard HoldenRegional Commissioner
U.S. Bureau of Labor StatisticsCHWA/CHPC MeetingSeptember 6, 2012

Employment Projections Background
10-year projections made every 2 years
2010-20 projections cover over 700 occupations and 300 industries
Projections are used to produce the Occupational Outlook Handbook—which has been published since 1949
2

Other Uses of Employment Projections
Data
Career counselors and students making career choice decisions
Mid-career jobseekers looking to switch occupations
Education and training officials to make decisions on policy, funding, and program offerings
Researchers interested in how the economy is changing
3

Employment Projections Process
Labor ForceTotal and by
age, sex, race and ethnicity
Aggregate EconomyGDP, total
employment, and major demand
categoriesOccupation
al Employmen
t
Job openings due to growth & replacement
needs
Industry Final Demand
Sales to consumers, businesses,
government, and foreigners
Industry Employment
Labor productivity, average weekly hours, wage &
salary employment
Industry OutputUse and Make Relationships,
Total Requirements Tables
Population
Labor force participation rate trends
Demographics Fiscal policy
Foreign economies Energy prices Monetary policy
Staffing patterns
Staffing pattern ratio analyses
Staff expertise
Replacement rates
Economic censuses
Annual economic surveys
Other data sources
Industry output
Sector wage rates
Technological change
Input-Output Tables
4

Population and Labor Force
5
Millions of persons
2000
2000
2010
2010
Projected 2020
Projected 2020
Population Data Source: U.S. Census Bureau
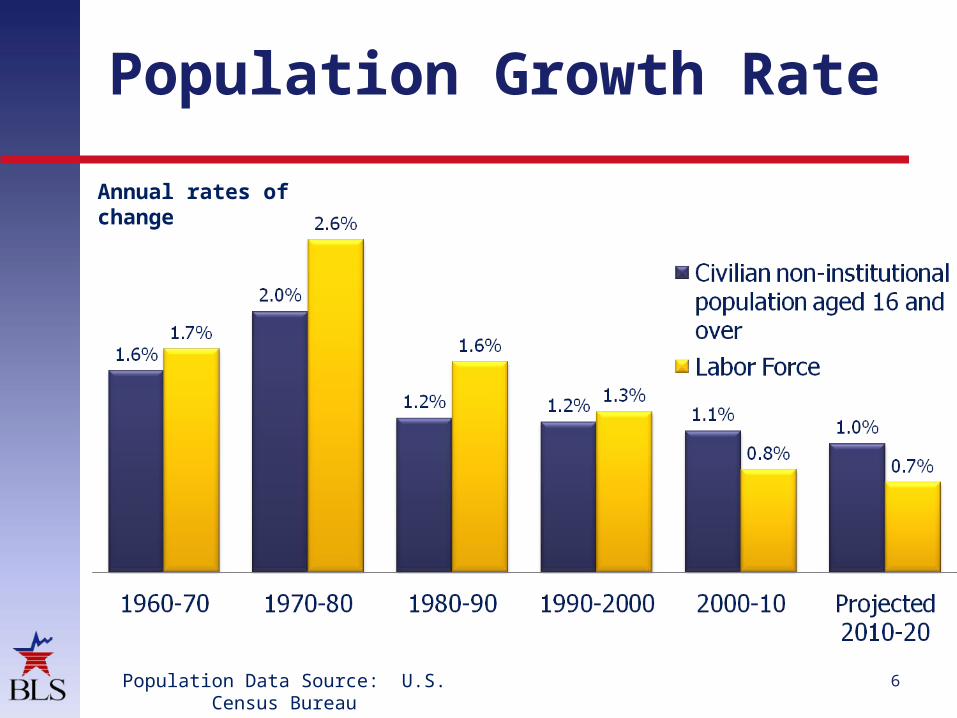
Population Growth Rate
6
Annual rates of change
Population Data Source: U.S. Census Bureau
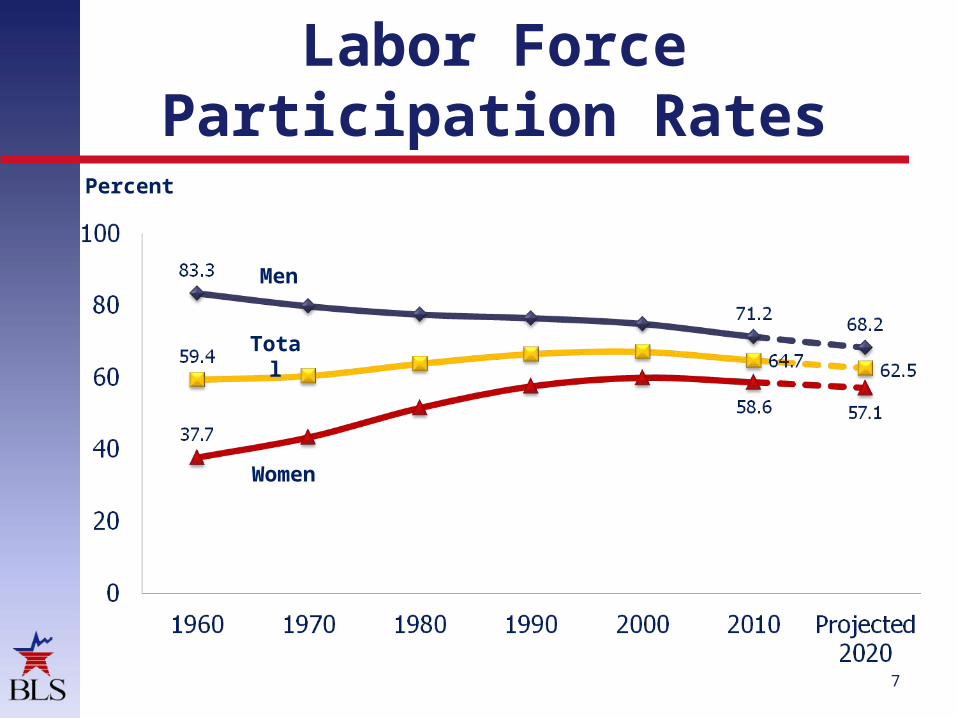
Labor Force Participation Rates
7
Percent
Total
Men
Women
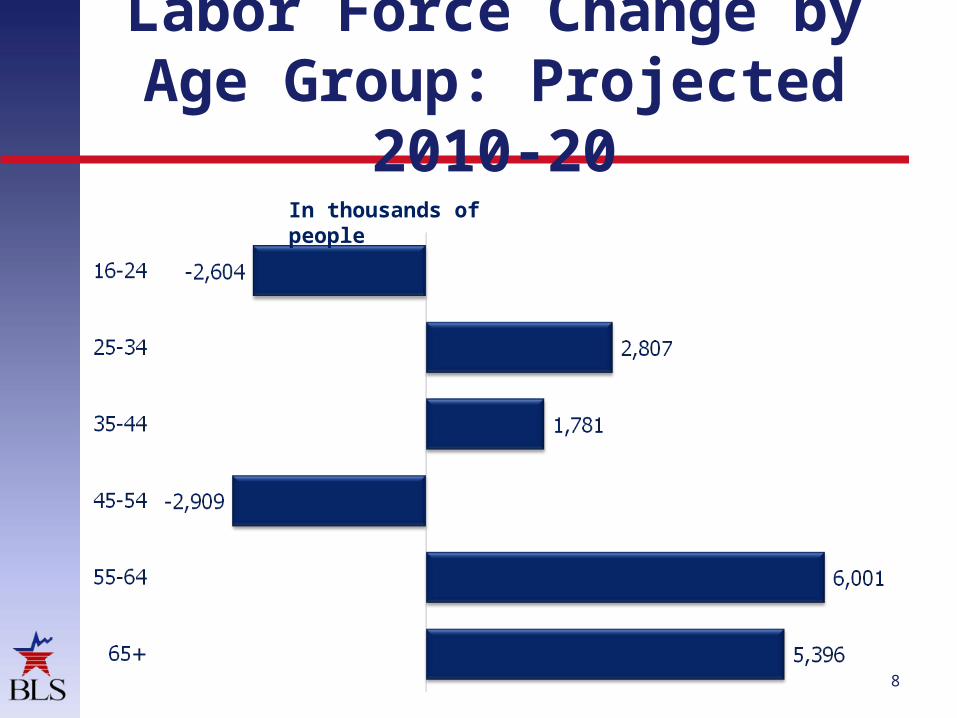
Labor Force Change by Age Group: Projected
2010-20
8
In thousands of people

9
Labor Force Growth by Race and Ethnicity
Change in millions, projected 2010-20

Unemployment Rate
10

Inflation Rate
11
Annual rate of change
Historic Data Source: U.S. Bureau of Economic Analysis

Housing Starts: 1960 to 2010 and Projected
2020
12
(Thousands of units)
Historic Data Source: U.S. Census Bureau
Recession year
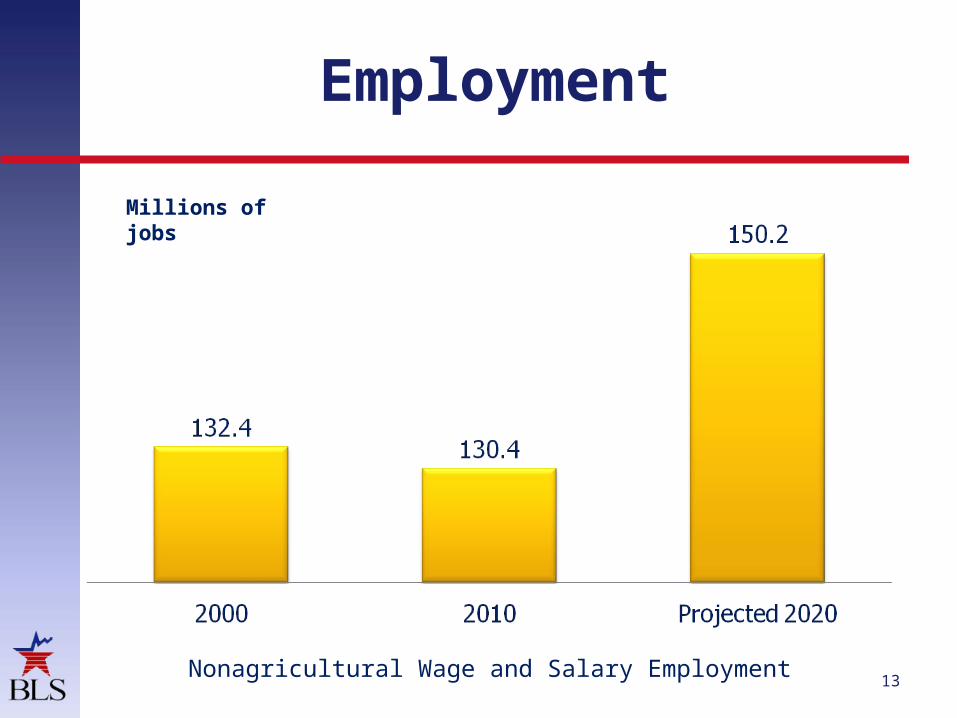
Employment
13
Millions of jobs
Nonagricultural Wage and Salary Employment

The “Lost” Decade
14
In 2000, total of 132.4 million jobs 2000-2010 Projection: 152 million
total jobs in 2010 2000-2010 Actual: 130.4 million
jobs in 2010 2020 Projected Employment: 150.2
million

Employment by Industry Sector: 2010
15
Thousands of wage and salary jobs
Service providing
Goods producing
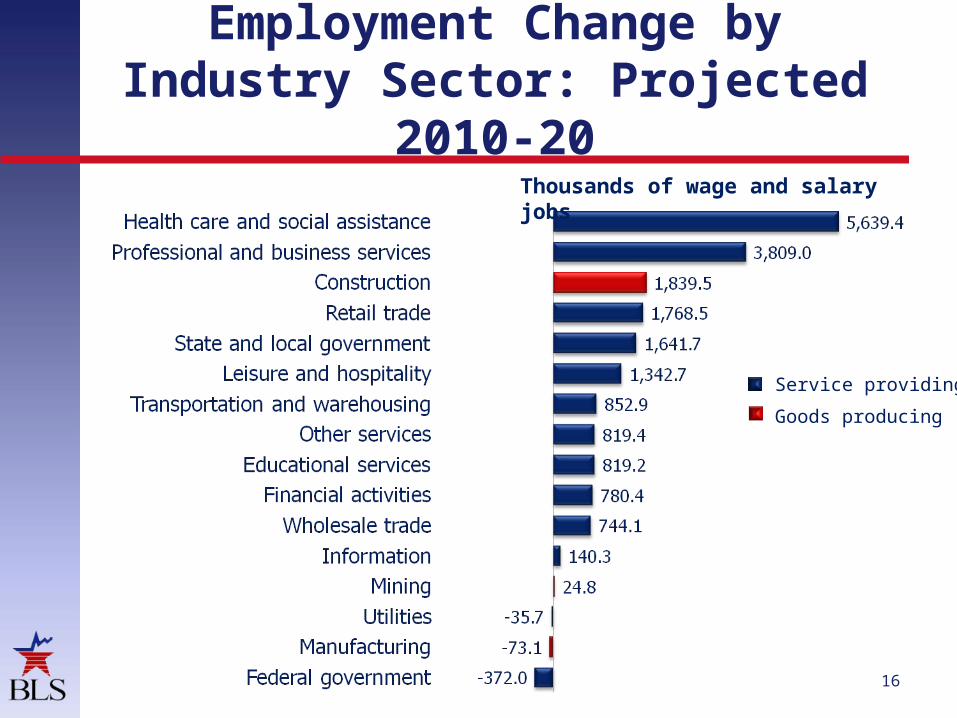
Employment Change by Industry Sector: Projected
2010-20
16
Thousands of wage and salary jobs
Service providing
Goods producing

Percent Change in Employment by Industry Sector: Projected
2010-20
17
Annual rate of change for wage and salary employment
Service providingGoods producing
Total nonagricultural wage and
salary growth=
1.4%

Employment Change by Major Occupational
Group
18
Thousands of jobs, projected 2010-20
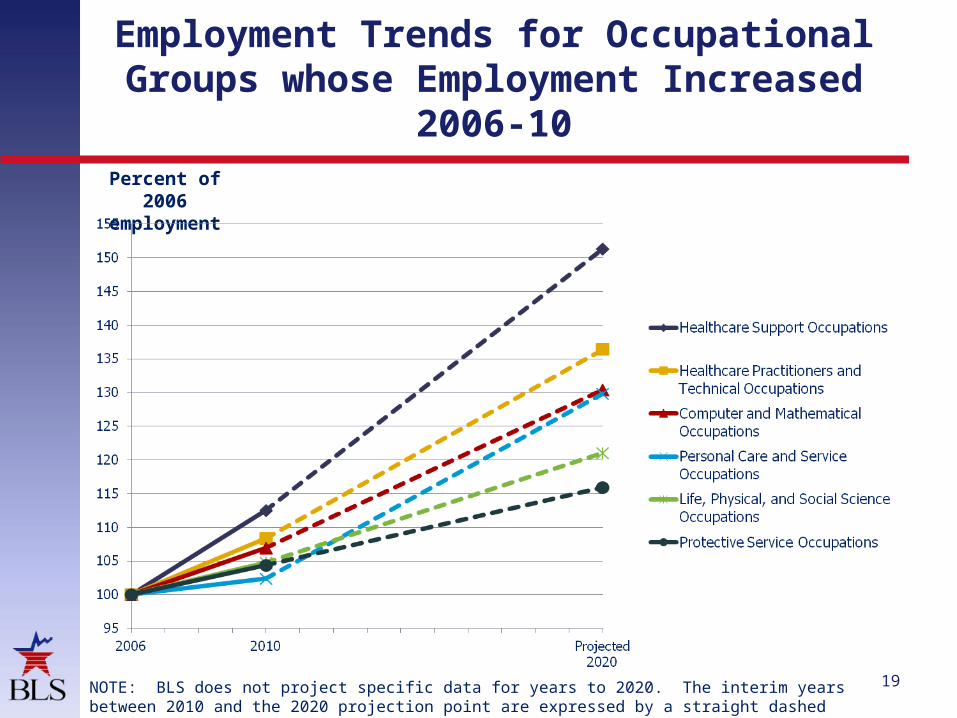
Employment Trends for Occupational Groups whose Employment Increased
2006-10
19
Percent of 2006
employment
NOTE: BLS does not project specific data for years to 2020. The interim years between 2010 and the 2020 projection point are expressed by a straight dashed line only.
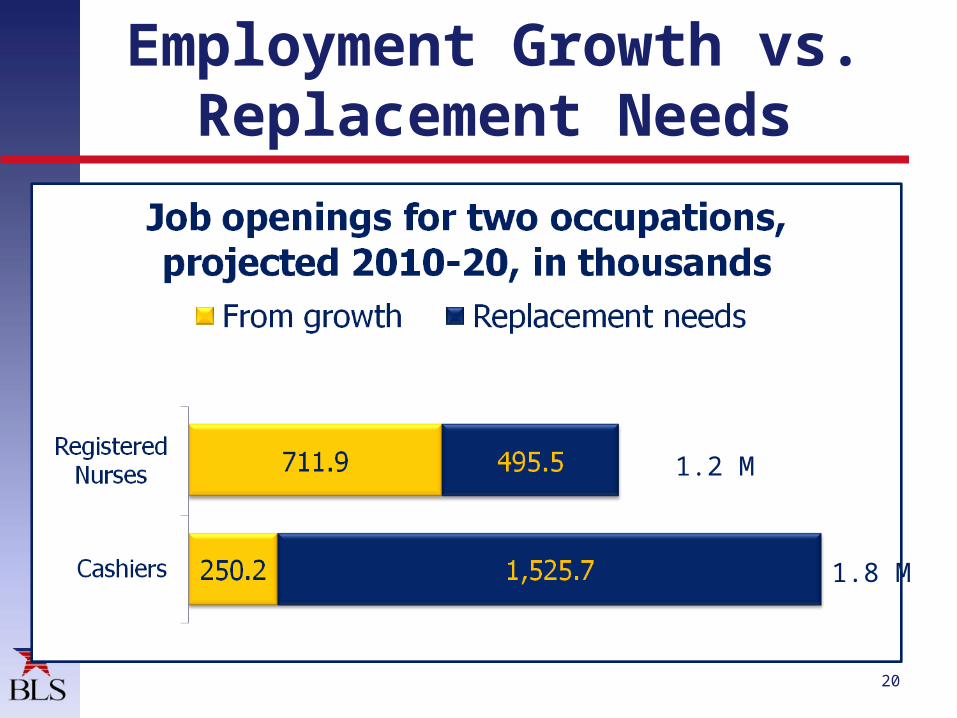
Employment Growth vs. Replacement Needs
20
1.8 M
1.2 M

Job Openings by Major Occupational Group
21
Thousands of job openings, projected 2010-20

Job Openings by Major Occupational Group
22
Thousands of job openings, projected 2010-20
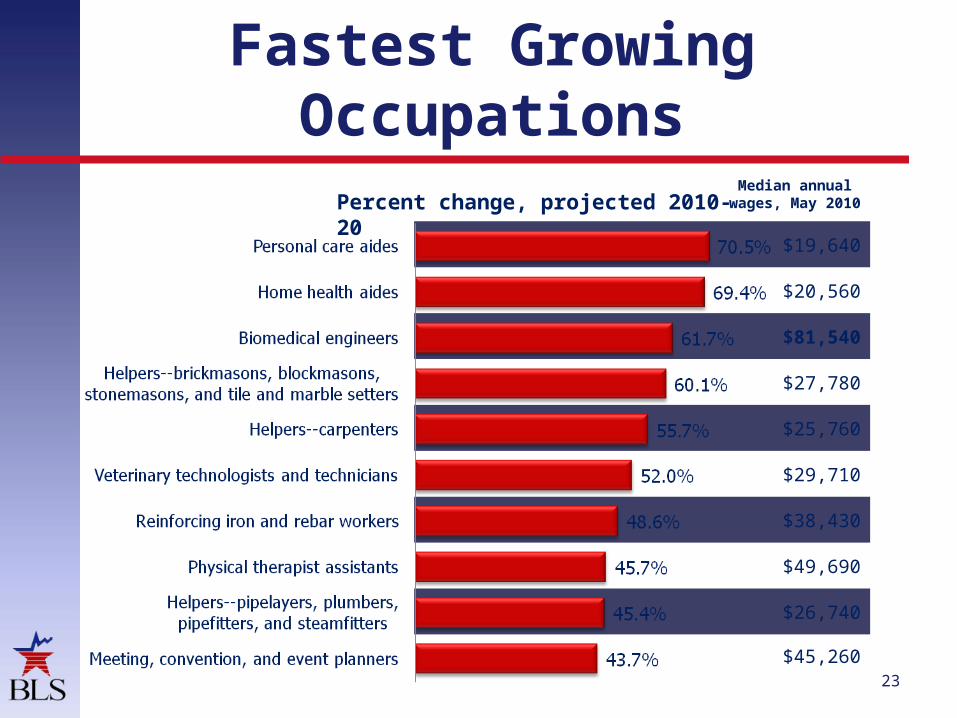
Fastest Growing Occupations
23
Percent change, projected 2010-20
Median annual wages, May 2010
$19,640
$20,560
$81,540
$27,780
$25,760
$29,710
$38,430
$49,690
$26,740
$45,260
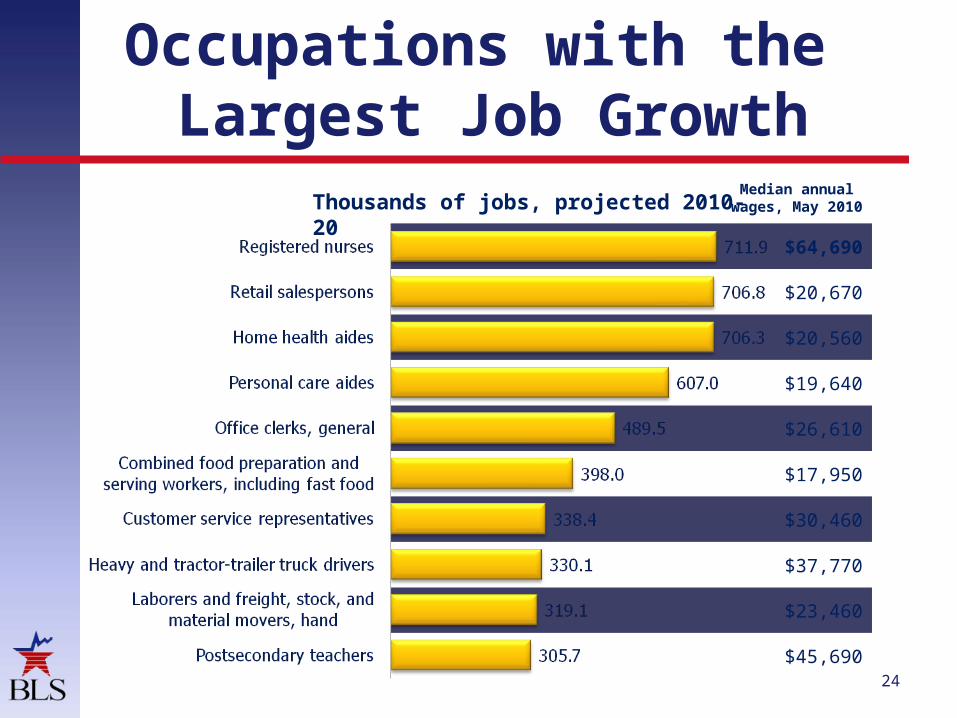
Median annual wages, May 2010
$64,690
$20,670
$20,560
$19,640
$26,610
$17,950
$30,460
$37,770
$23,460
$45,690
Thousands of jobs, projected 2010-20
Occupations with the Largest Job Growth
24
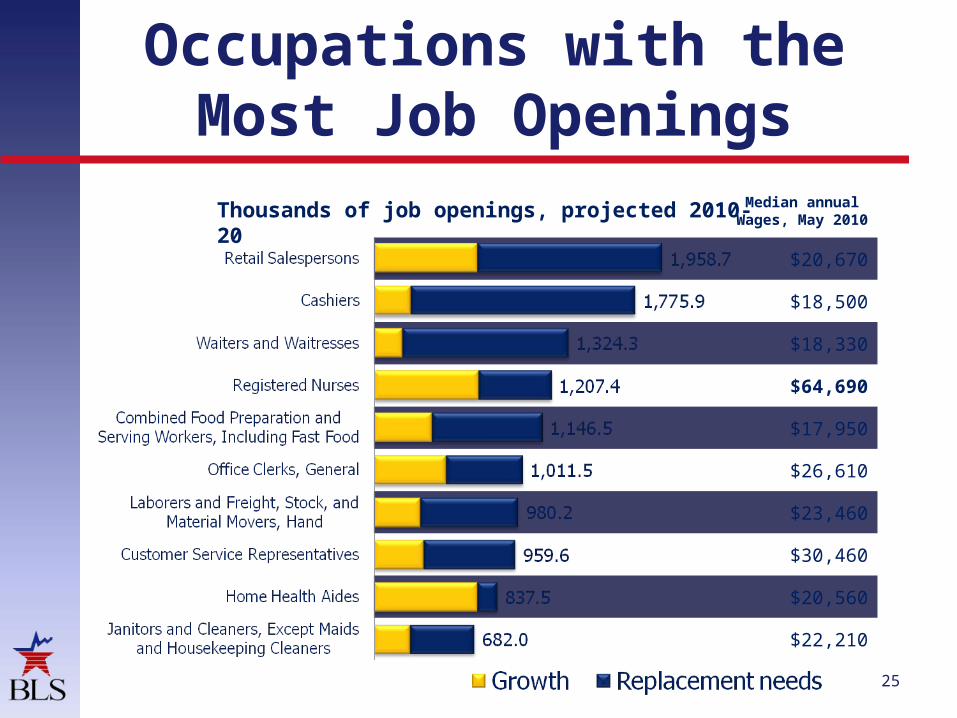
Occupations with the Most Job Openings
25
Thousands of job openings, projected 2010-20
Median annual Wages, May 2010
$20,670
$18,500
$18,330
$64,690
$17,950
$26,610
$23,460
$30,460
$20,560
$22,210

Percent Change in Employment by Typical Entry-level Education
Category
26
Percent change, projected 2010-20Average, all occupations =
14.3%
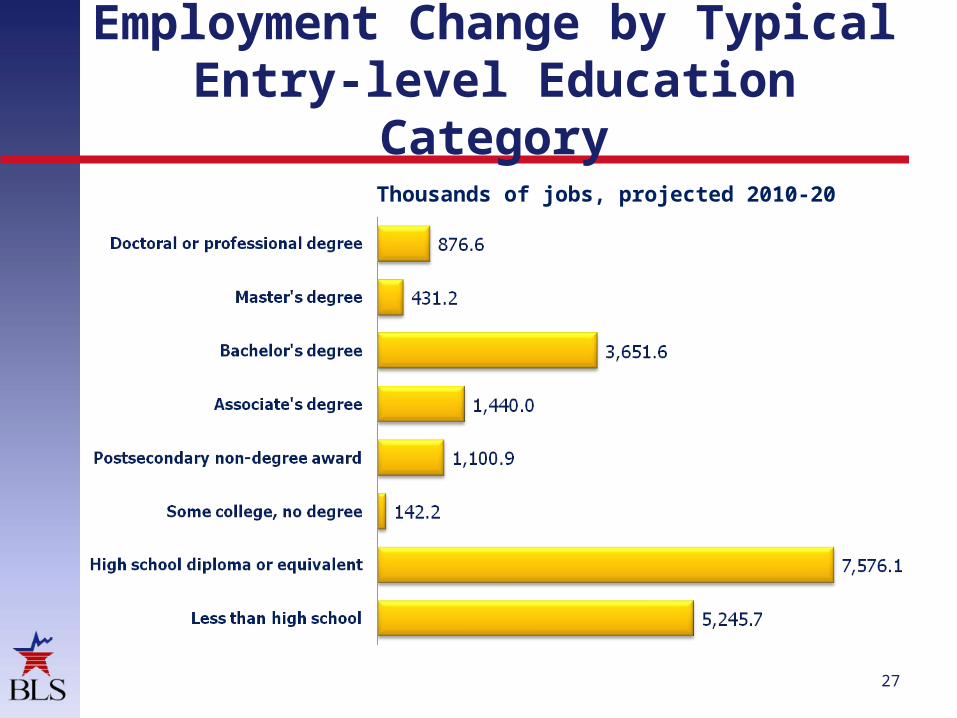
Employment Change by Typical Entry-level Education
Category
27
Thousands of jobs, projected 2010-20

W TMedian annual
wages, May 2010
N N $62,050
N I/R ≥$166,400
N N $76,310
N N $112,760
N N $111,570
N N $53,380
N N $47,230
N I/R $38,150
N N $32,350
N N $72,320
Thousands of jobs, projected 2010-20
Graduate Degree Occupations with the Largest Job Growth
28

W TMedian annual
wages, May 2010
N N $64,690
N N $24,010
N N $40,380
N N $25,700
N N $22,760
N N $33,470
N L $42,530
5+ N $83,860
1-5
N $94,400
N N $30,360
Thousands of jobs, projected 2010-20
Associate’s Degree or Postsecondary Non-degree Award Occupations with the
Largest Job Growth
29
W TMedian annual
wages, May 2010
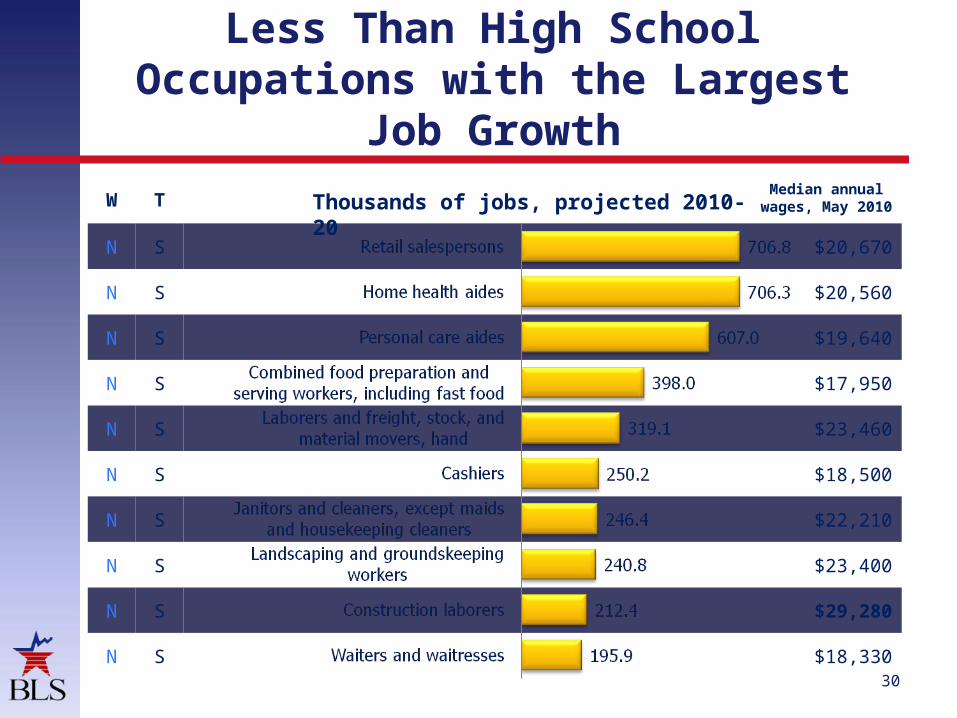
N S $20,670
N S $20,560
N S $19,640
N S $17,950
N S $23,460
N S $18,500
N S $22,210
N S $23,400
N S $29,280
N S $18,330
Thousands of jobs, projected 2010-20
Less Than High School Occupations with the Largest Job
Growth
30

U.S. HEALTH CARE OVERVIEW
31
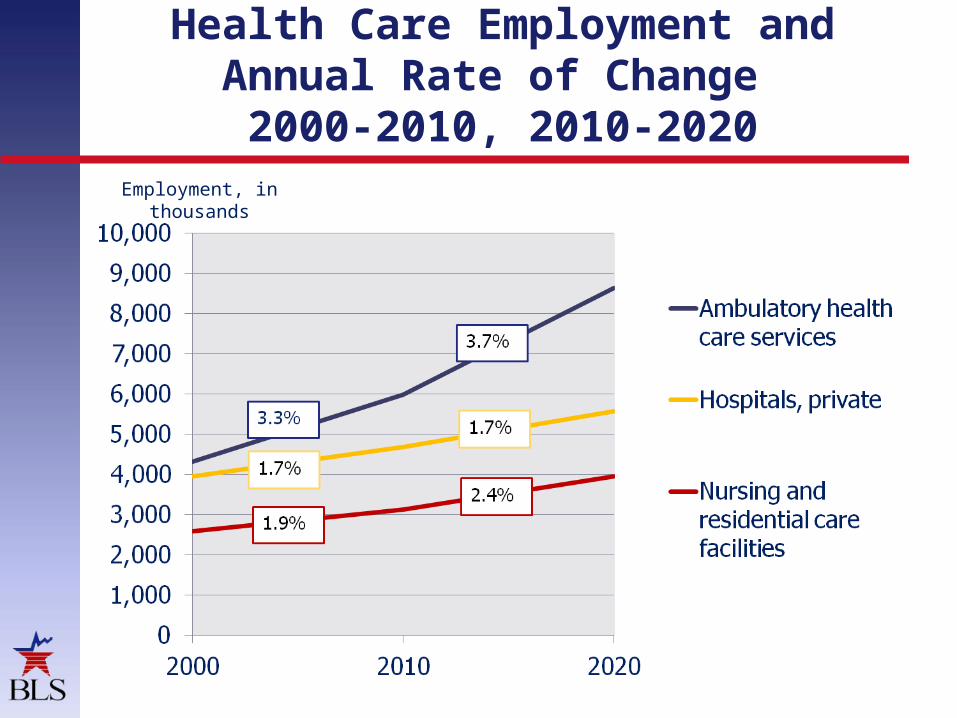
Health Care Employment and Annual Rate of Change 2000-2010, 2010-2020
32
Employment, in thousands
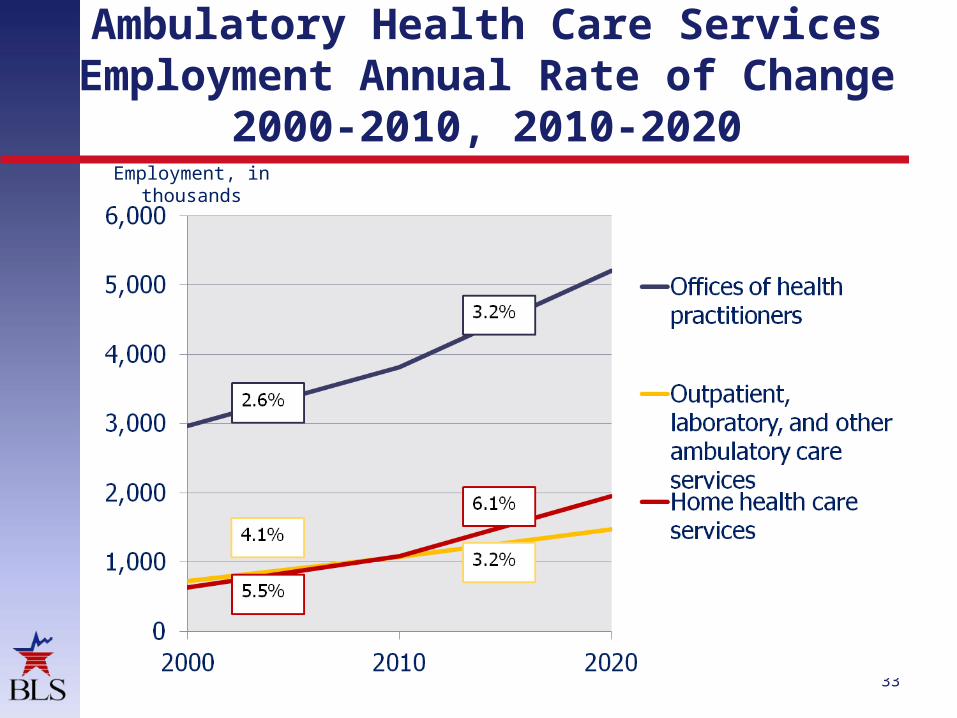
Ambulatory Health Care Services Employment Annual Rate of
Change 2000-2010, 2010-2020
33
Employment, in thousands
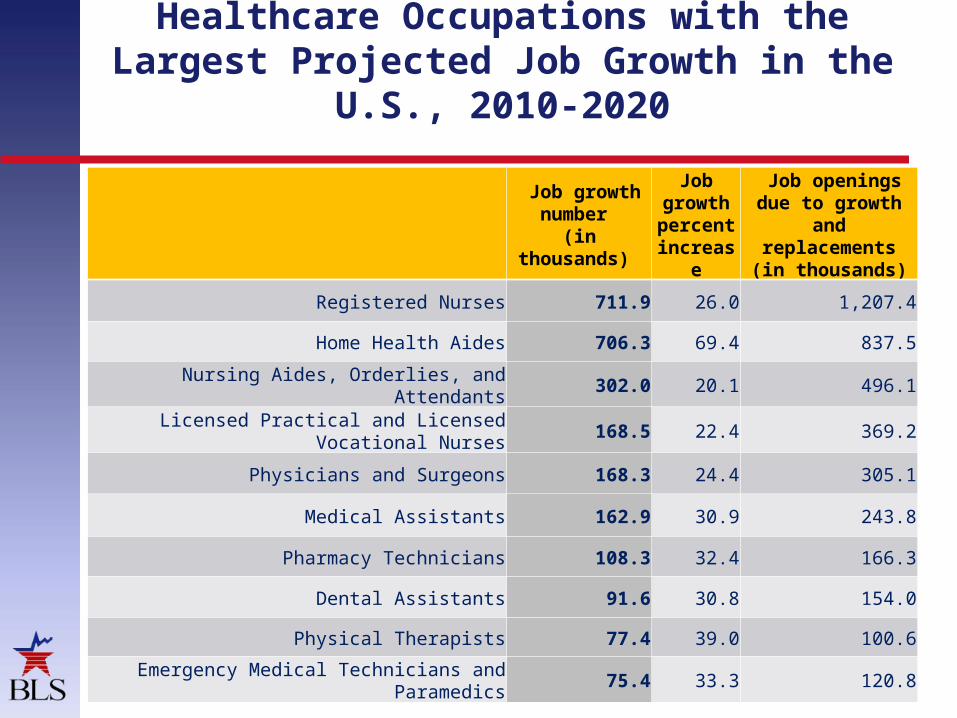
Healthcare Occupations with the Largest Projected Job Growth in the
U.S., 2010-2020
34
Job growth number
(in thousands)
Job growth percent increas
e
Job openings due to growth
and replacements (in thousands)
Registered Nurses 711.9 26.0 1,207.4
Home Health Aides 706.3 69.4 837.5
Nursing Aides, Orderlies, and Attendants 302.0 20.1 496.1
Licensed Practical and Licensed Vocational Nurses
168.5 22.4 369.2
Physicians and Surgeons 168.3 24.4 305.1
Medical Assistants 162.9 30.9 243.8
Pharmacy Technicians 108.3 32.4 166.3
Dental Assistants 91.6 30.8 154.0
Physical Therapists 77.4 39.0 100.6
Emergency Medical Technicians and Paramedics
75.4 33.3 120.8

Healthcare Occupations with the Fastest Projected Job Growth in the
U.S., 2010-2020
35
Job growth number
(in thousands)
Job growth percent increas
e
Job openings due to growth
and replacements (in
thousands)
Home Health Aides 706.3 69.4 837.5
Veterinary Technologists and Technicians 41.7 52.0 55.7
Physical Therapist Assistants 30.8 45.7 41.2
Diagnostic Medical Sonographers 23.4 43.5 31.7
Occupational Therapy Assistants 12.3 43.3 16.8
Physical Therapist Aides 20.3 43.1 27.6
Physical Therapists 77.4 39.0 100.6
Dental Hygienists 68.5 37.7 104.9
Audiologists 4.8 36.8 5.6
Veterinarians 22.0 35.9 34.2
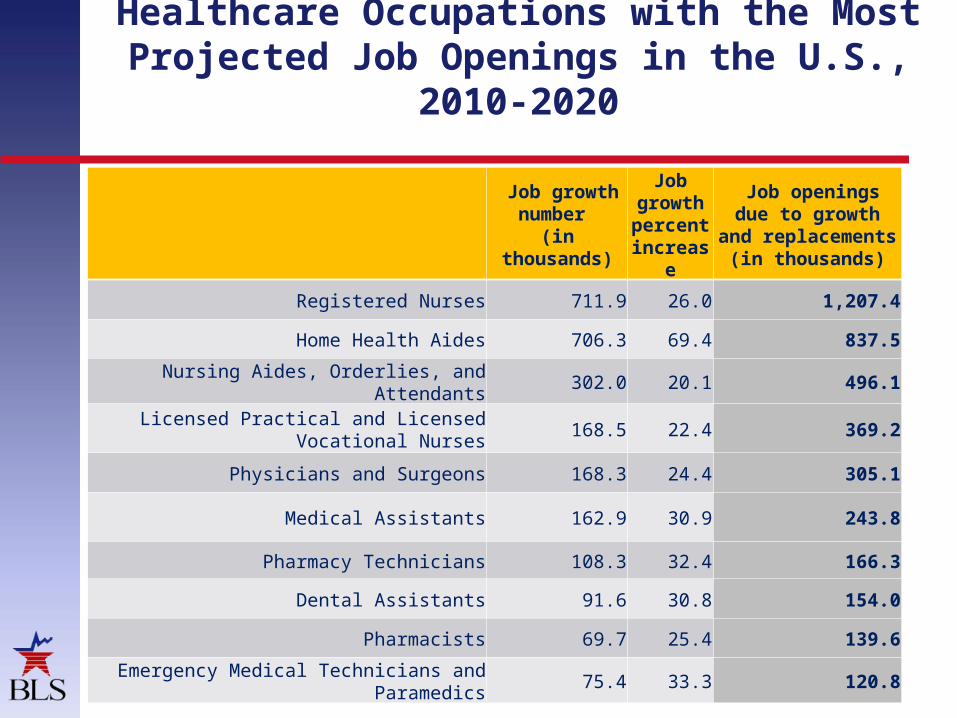
Healthcare Occupations with the Most Projected Job Openings in the U.S., 2010-
2020
36
Job growth number
(in thousands)
Job growth percent increas
e
Job openings due to growth
and replacements (in
thousands)
Registered Nurses 711.9 26.0 1,207.4
Home Health Aides 706.3 69.4 837.5
Nursing Aides, Orderlies, and Attendants 302.0 20.1 496.1
Licensed Practical and Licensed Vocational Nurses
168.5 22.4 369.2
Physicians and Surgeons 168.3 24.4 305.1
Medical Assistants 162.9 30.9 243.8
Pharmacy Technicians 108.3 32.4 166.3
Dental Assistants 91.6 30.8 154.0
Pharmacists 69.7 25.4 139.6
Emergency Medical Technicians and Paramedics
75.4 33.3 120.8

Employment in Hospitals by Detailed Occupation
(includes Private, State, and Local Government Hospitals – May 2011)
37
Detailed Occupation EmploymentPercent of
total employment
Annual mean
wage (May 2011)
All Occupations 5,648,820 100.00% $55,180
Registered Nurses 1,642,900 29.08% $69,880 Nursing Aides, Orderlies, and
Attendants410,690 7.27% $27,220
Licensed Practical and Licensed Vocational Nurses
153,450 2.72% $41,170
Medical Secretaries 137,830 2.44% $32,490
Radiologic Technologists and Technicians
133,750 2.37% $56,910
Maids and Housekeeping Cleaners 119,320 2.11% $23,590
Medical and Health Services Managers
119,020 2.11% $101,920
Office Clerks, General 100,080 1.77% $30,730
Medical and Clinical Laboratory Technologists
98,750 1.75% $58,650
May 2011 Occupational Employment Statistics
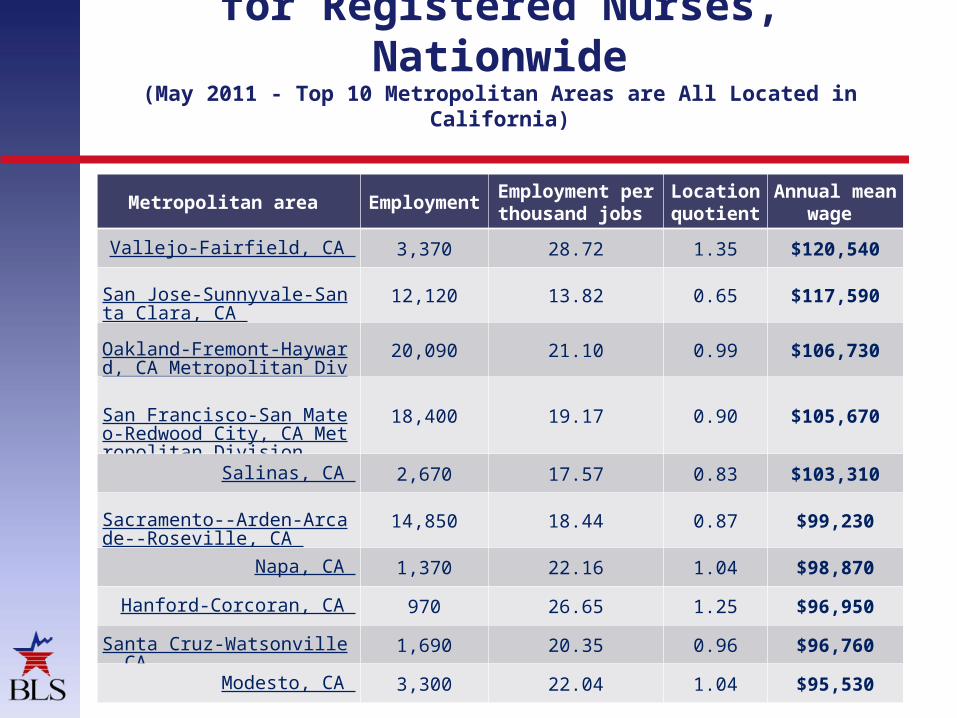
Top Paying Metropolitan Areas for Registered Nurses,
Nationwide(May 2011 - Top 10 Metropolitan Areas are All Located in
California)
38
Metropolitan area Employme
nt
Employment per thousand
jobs
Location quotient
Annual mean wage
Vallejo-Fairfield, CA 3,370 28.72 1.35 $120,540
San Jose-Sunnyvale-Santa Clara, CA
12,120 13.82 0.65 $117,590
Oakland-Fremont-Hayward, CA Metropolitan Division
20,090 21.10 0.99 $106,730
San Francisco-San Mateo-Redwood City, CA Metropolitan Division
18,400 19.17 0.90 $105,670
Salinas, CA 2,670 17.57 0.83 $103,310
Sacramento--Arden-Arcade--Roseville, CA
14,850 18.44 0.87 $99,230
Napa, CA 1,370 22.16 1.04 $98,870
Hanford-Corcoran, CA 970 26.65 1.25 $96,950
Santa Cruz-Watsonville, CA
1,690 20.35 0.96 $96,760
Modesto, CA 3,300 22.04 1.04 $95,530

Employed Persons by Detailed Industry, Sex, Race, and
Hispanic or Latino Ethnicity
39
IndustryTotal
Employed (in thousands)
Percent of Total Employed
WomenBlack or African
AmericanAsian
Hispanic or Latino
Total, all industries, 16 years and over
139,869 46.9 10.8 4.9 14.5
Health care and Social Assistance Sector
18,902 78.5 16.0 5.5 11.1
Hospitals 6,315 75.8 15.3 7.2 8.7
Health services, except hospitals
9,367 78.1 15.9 5.1 11.2

CALIFORNIA POPULATION AND LABOR FORCE
OVERVIEW
40

Labor Force Share by Sex
41
2010

Labor Force Share by Race
42
2010
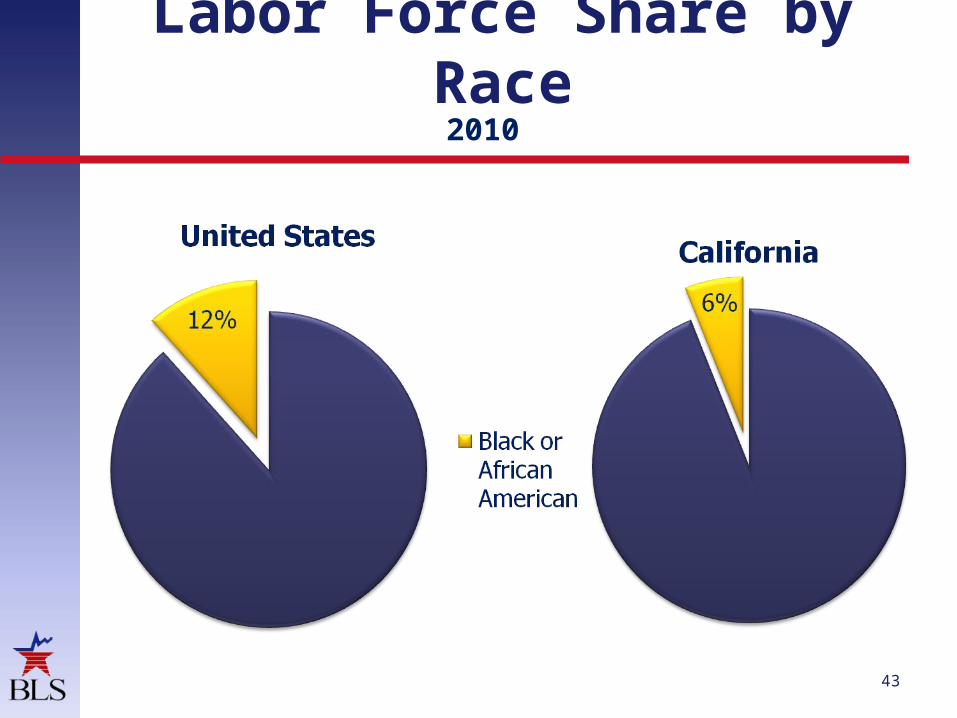
Labor Force Share by Race
43
2010

Labor Force Share by Race
44
2010

Labor Force Share by Ethnicity
45
2010

46
47

California Counties with the Largest Population Growth,
2010-2050
48
Bubble size represents 2010
population

CALIFORNIA HEALTH CARE INDUSTRY PROJECTIONS
49
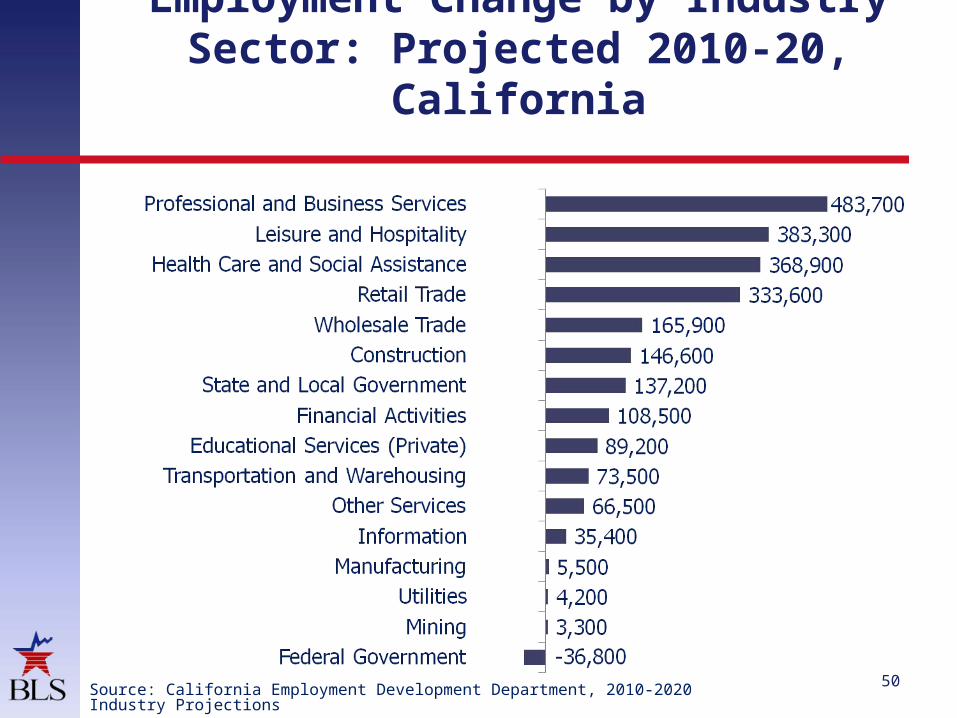
Employment Change by Industry Sector: Projected 2010-20,
California
50Source: California Employment Development Department, 2010-2020 Industry Projections
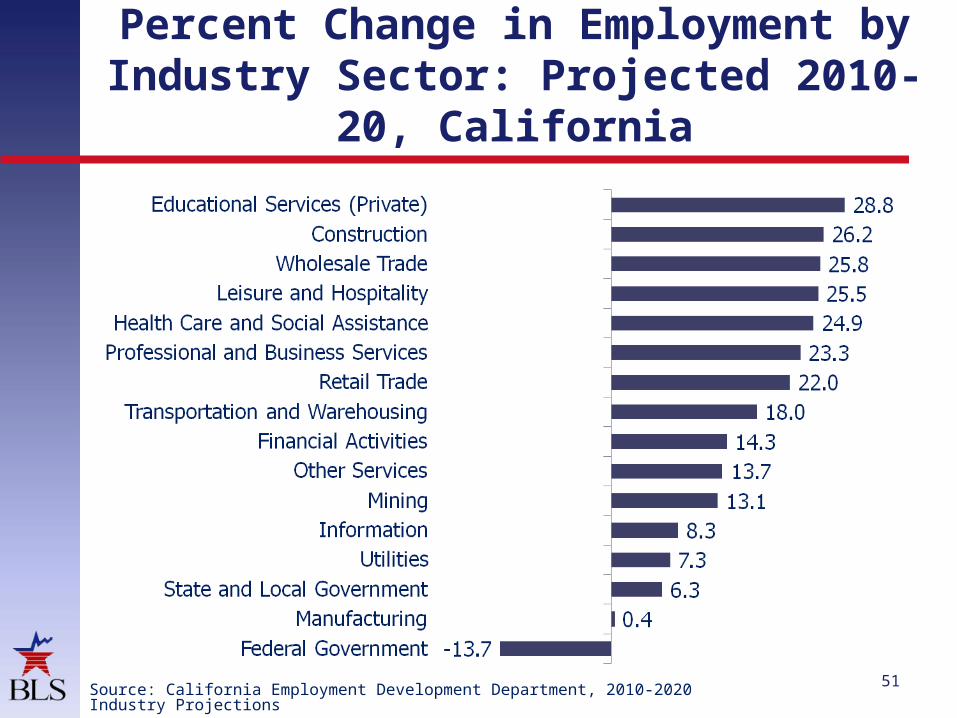
Percent Change in Employment by Industry Sector: Projected 2010-20,
California
51Source: California Employment Development Department, 2010-2020 Industry Projections
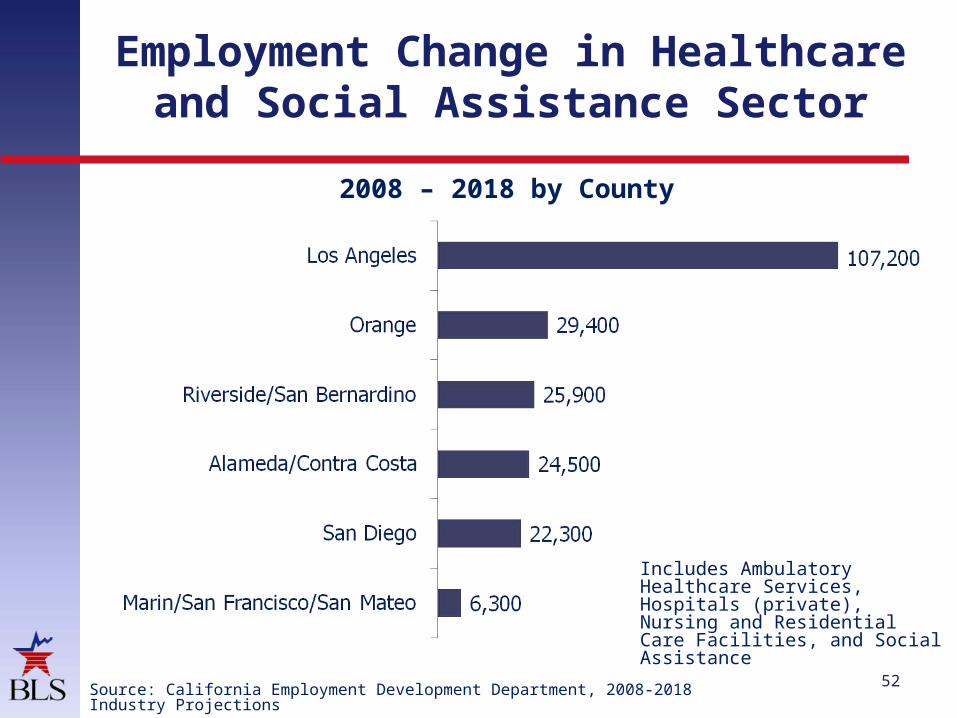
Employment Change in Healthcare and Social Assistance Sector
52
2008 – 2018 by County
Includes Ambulatory Healthcare Services, Hospitals (private), Nursing and Residential Care Facilities, and Social Assistance
Source: California Employment Development Department, 2008-2018 Industry Projections
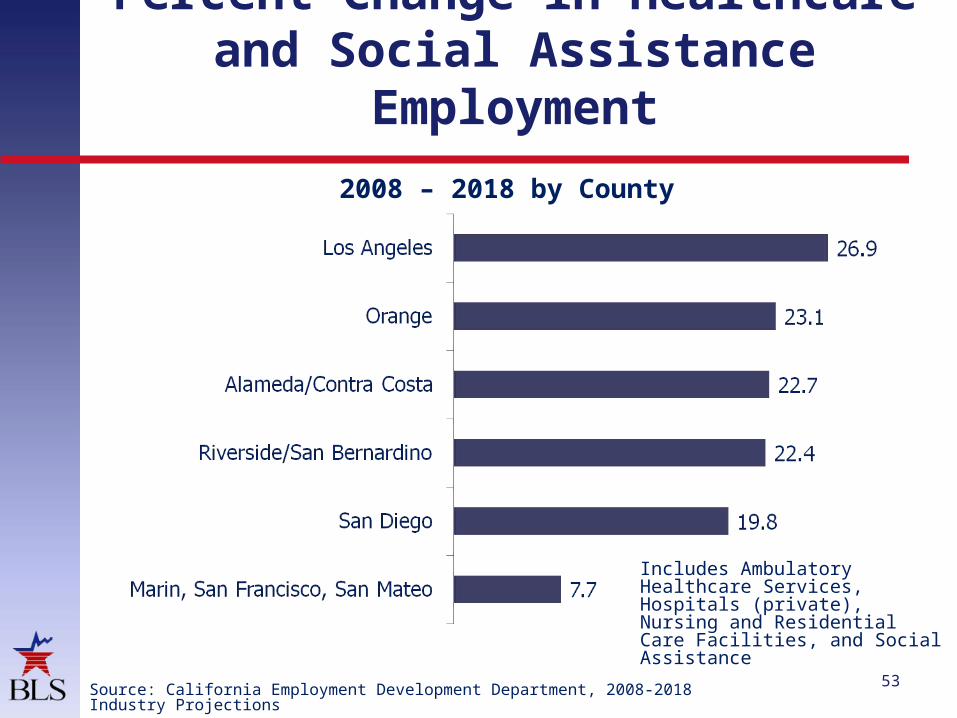
Percent Change in Healthcare and Social Assistance
Employment
53
2008 – 2018 by County
Includes Ambulatory Healthcare Services, Hospitals (private), Nursing and Residential Care Facilities, and Social Assistance
Source: California Employment Development Department, 2008-2018 Industry Projections
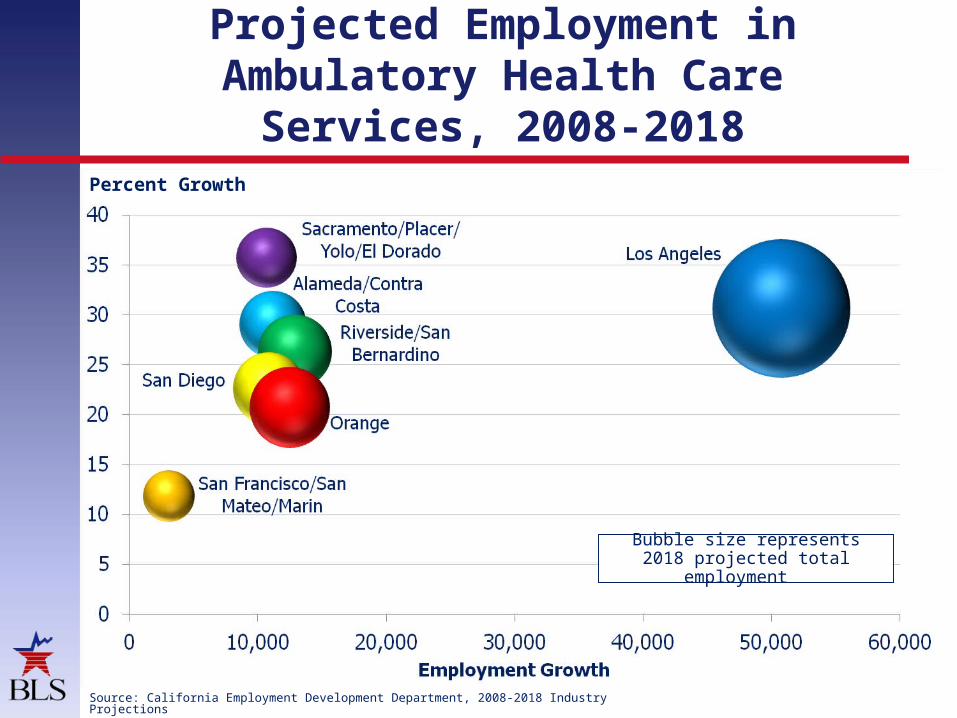
Projected Employment in Ambulatory Health Care
Services, 2008-2018
54
Percent Growth
Source: California Employment Development Department, 2008-2018 Industry Projections
Bubble size represents 2018 projected total employment
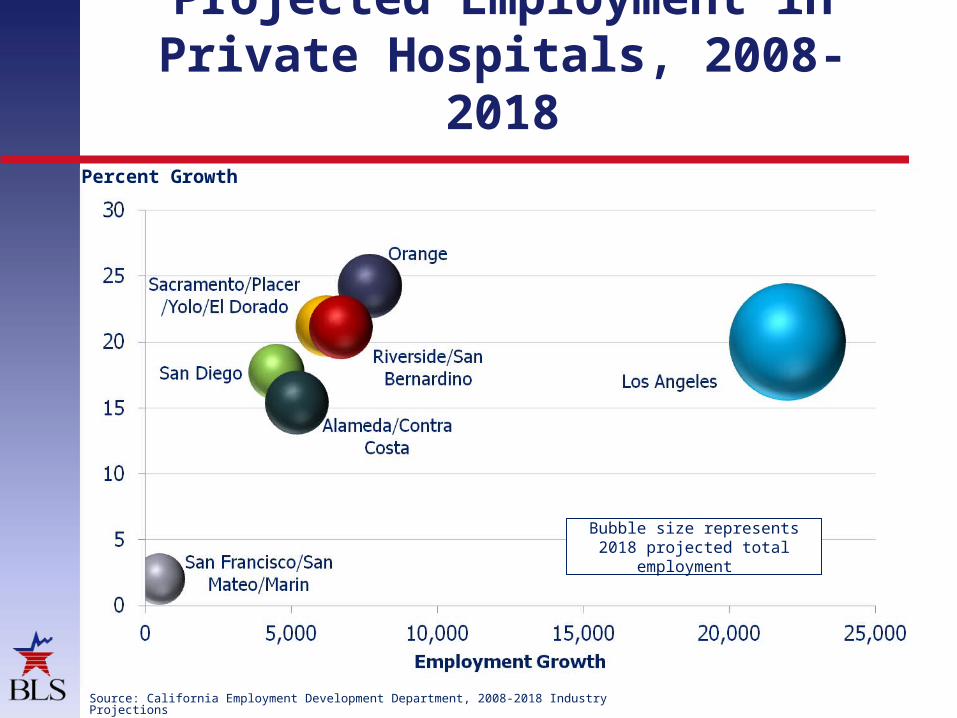
Projected Employment in Private Hospitals, 2008-2018
55Source: California Employment Development Department, 2008-2018 Industry Projections
Percent Growth
Bubble size represents 2018 projected total employment

Projected Employment in Nursing and Residential Care
Facilities, 2008-2018
56Source: California Employment Development Department, 2008-2018 Industry Projections
Percent Growth
Bubble size represents 2018 projected total employment

CALIFORNIA HEALTH CARE OCCUPATIONAL PROJECTIONS
57
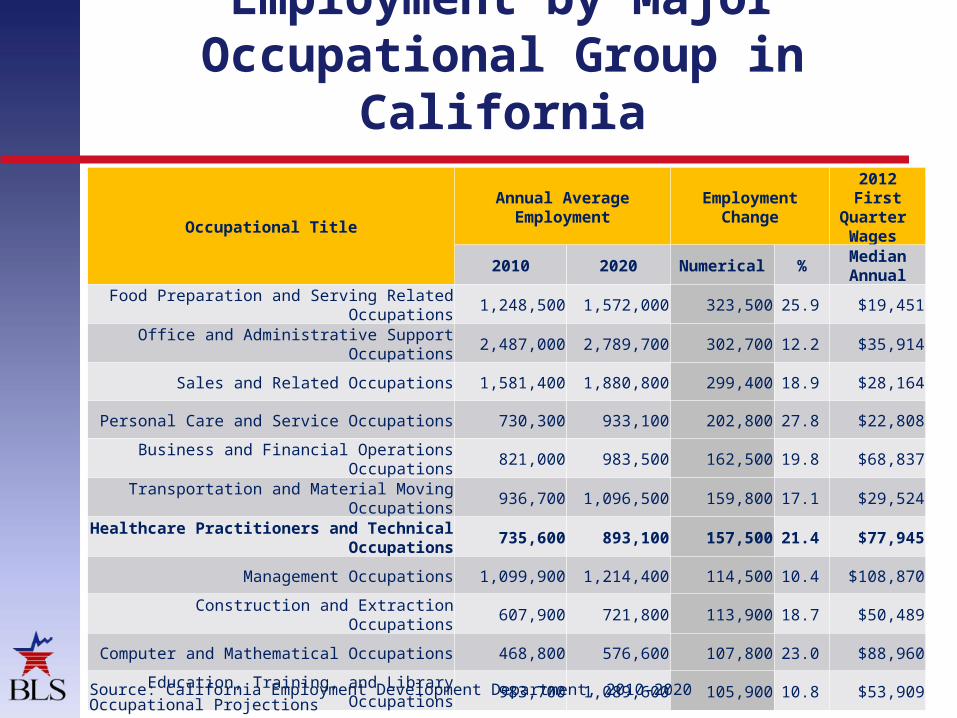
Employment by Major Occupational Group in
California
58
Occupational Title
Annual Average Employment
Employment Change
2012 First Quarter Wages
2010 2020 Numerical %Median Annual
Food Preparation and Serving Related Occupations
1,248,500 1,572,000 323,500 25.9 $19,451
Office and Administrative Support Occupations
2,487,000 2,789,700 302,700 12.2 $35,914
Sales and Related Occupations 1,581,400 1,880,800 299,400 18.9 $28,164
Personal Care and Service Occupations 730,300 933,100 202,800 27.8 $22,808
Business and Financial Operations Occupations
821,000 983,500 162,500 19.8 $68,837
Transportation and Material Moving Occupations
936,700 1,096,500 159,800 17.1 $29,524
Healthcare Practitioners and Technical Occupations
735,600 893,100 157,500 21.4 $77,945
Management Occupations 1,099,900 1,214,400 114,500 10.4 $108,870
Construction and Extraction Occupations 607,900 721,800 113,900 18.7 $50,489
Computer and Mathematical Occupations 468,800 576,600 107,800 23.0 $88,960
Education, Training, and Library Occupations 983,700 1,089,600 105,900 10.8 $53,909
Source: California Employment Development Department, 2010-2020 Occupational Projections
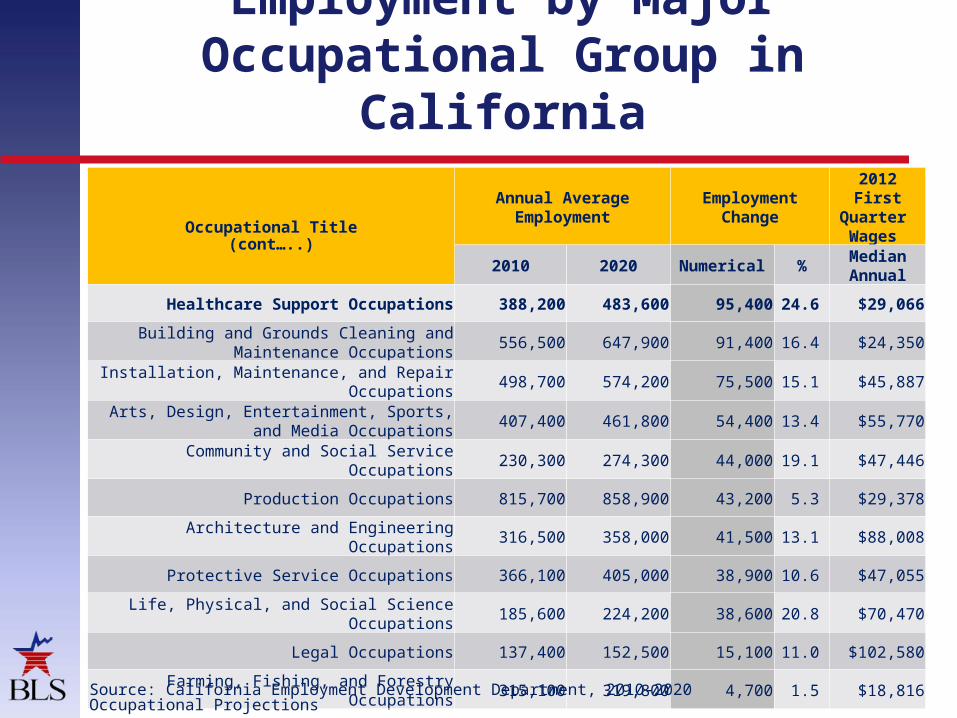
Employment by Major Occupational Group in
California
59
Occupational Title
Annual Average Employment
Employment Change
2012 First Quarter Wages
2010 2020 Numerical %Median Annual
Healthcare Support Occupations 388,200 483,600 95,400 24.6 $29,066
Building and Grounds Cleaning and Maintenance Occupations
556,500 647,900 91,400 16.4 $24,350
Installation, Maintenance, and Repair Occupations
498,700 574,200 75,500 15.1 $45,887
Arts, Design, Entertainment, Sports, and Media Occupations
407,400 461,800 54,400 13.4 $55,770
Community and Social Service Occupations 230,300 274,300 44,000 19.1 $47,446
Production Occupations 815,700 858,900 43,200 5.3 $29,378
Architecture and Engineering Occupations 316,500 358,000 41,500 13.1 $88,008
Protective Service Occupations 366,100 405,000 38,900 10.6 $47,055
Life, Physical, and Social Science Occupations
185,600 224,200 38,600 20.8 $70,470
Legal Occupations 137,400 152,500 15,100 11.0 $102,580
Farming, Fishing, and Forestry Occupations 315,100 319,800 4,700 1.5 $18,816
(cont…..)
Source: California Employment Development Department, 2010-2020 Occupational Projections
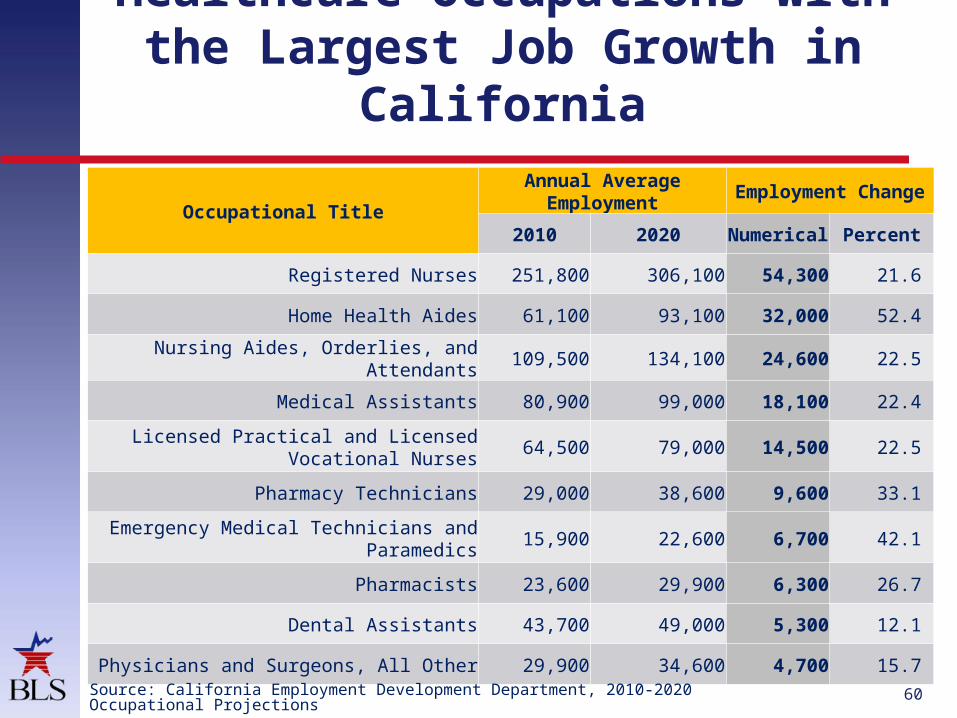
Healthcare Occupations with the Largest Job Growth in
California
60
Occupational Title
Annual Average Employment
Employment Change
2010 2020Numerica
lPercent
Registered Nurses 251,800 306,100 54,300 21.6
Home Health Aides 61,100 93,100 32,000 52.4
Nursing Aides, Orderlies, and Attendants 109,500 134,100 24,600 22.5
Medical Assistants 80,900 99,000 18,100 22.4
Licensed Practical and Licensed Vocational Nurses
64,500 79,000 14,500 22.5
Pharmacy Technicians 29,000 38,600 9,600 33.1
Emergency Medical Technicians and Paramedics
15,900 22,600 6,700 42.1
Pharmacists 23,600 29,900 6,300 26.7
Dental Assistants 43,700 49,000 5,300 12.1
Physicians and Surgeons, All Other 29,900 34,600 4,700 15.7
Source: California Employment Development Department, 2010-2020 Occupational Projections
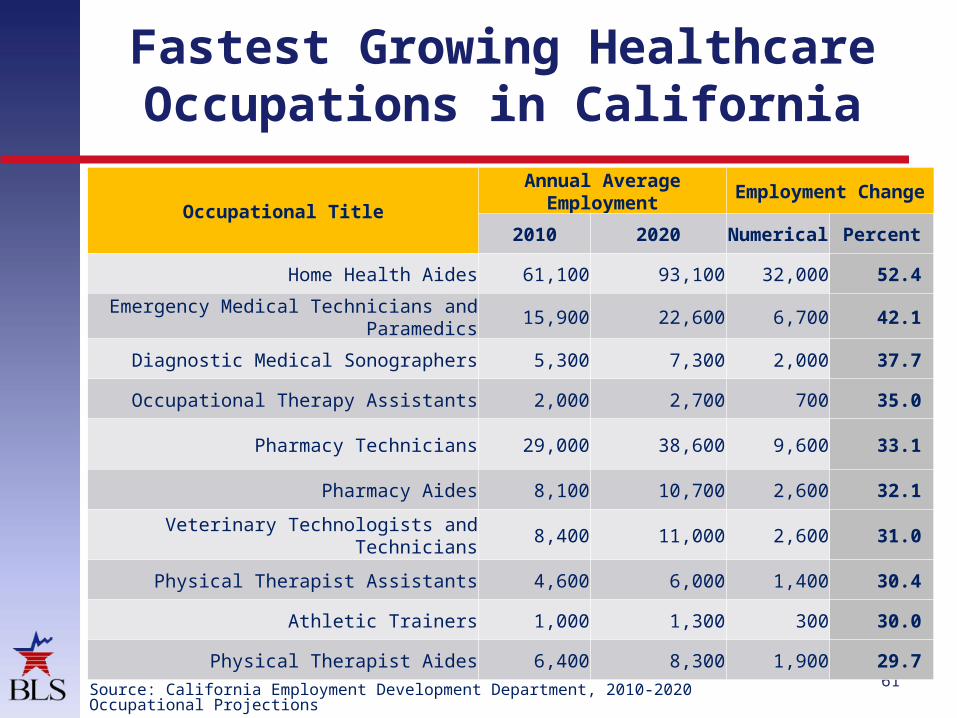
Fastest Growing Healthcare Occupations in California
61
Occupational Title
Annual Average Employment
Employment Change
2010 2020Numerica
lPercent
Home Health Aides 61,100 93,100 32,000 52.4
Emergency Medical Technicians and Paramedics
15,900 22,600 6,700 42.1
Diagnostic Medical Sonographers 5,300 7,300 2,000 37.7
Occupational Therapy Assistants 2,000 2,700 700 35.0
Pharmacy Technicians 29,000 38,600 9,600 33.1
Pharmacy Aides 8,100 10,700 2,600 32.1
Veterinary Technologists and Technicians
8,400 11,000 2,600 31.0
Physical Therapist Assistants 4,600 6,000 1,400 30.4
Athletic Trainers 1,000 1,300 300 30.0
Physical Therapist Aides 6,400 8,300 1,900 29.7
Source: California Employment Development Department, 2010-2020 Occupational Projections

Average Annual Job Openings (Growth + Replacement Needs)
California Healthcare Occupations
62
Occupational Title
Average AnnualJob Openings
New Jobs Replacement Needs
Total Jobs
Registered Nurses 5,420 4,560 9,980
Home Health Aides 3,200 790 3,990
Nursing Aides, Orderlies, and Attendants 2,470 1,410 3,880
Licensed Practical and Licensed Vocational Nurses
1,450 1,720 3,170
Medical Assistants 1,810 1,240 3,050
Pharmacy Technicians 960 500 1,460
Dental Assistants 530 920 1,450
Pharmacists 630 600 1,230
Physicians and Surgeons, All Other 470 590 1,060
Emergency Medical Technicians and Paramedics
670 320 990
Source: California Employment Development Department, 2010-2020 Occupational Projections

Top Average Annual Job Openings for Healthcare and Social Service
Occupations
63
Los Angeles County
Average AnnualJob Openings
2010-1st Quarter Wages
New JobsReplacement
NeedsTotal Jobs per Year
Median Annual
Registered Nurses 1,820 1,079 2,899 $80,890
Licensed Practical and Licensed Vocational Nurses
580 628 1,208 $48,007
Nursing Aides, Orderlies, and Attendants 877 321 1,198 $24,275
Medical Assistants 634 242 876 $28,940
Home Health Aides 560 125 685 $21,130
Dental Assistants 263 210 473 $29,523
Pharmacy Technicians 181 161 342 $35,499
Physicians and Surgeons, All Other 118 129 247 N/A
Pharmacists 103 138 241 $120,616
Healthcare Support Workers, All Other 141 75 216 $32,324
Source: California Employment Development Department, 2008-2018 Occupational Projections

Top Average Annual Job Openings for Healthcare and Social Service
Occupations
64
Riverside/San Bernardino Counties
Average AnnualJob Openings
2010-1st Quarter Wages
New JobsReplacement
NeedsTotal Jobs per Year
Median Annual
Registered Nurses 518 373 891 $76,486
Licensed Practical and Licensed Vocational Nurses
122 187 309 $43,502
Nursing Aides, Orderlies, and Attendants 187 91 278 $24,475
Medical Assistants 192 76 268 $26,101
Dental Assistants 97 79 176 $30,013
Home Health Aides 133 37 170 $21,024
Pharmacy Technicians 77 76 153 $34,754
Emergency Medical Technicians and Paramedics
49 38 87 $32,123
Pharmacists 28 44 72 $121,830
Physicians and Surgeons, All Other 35 34 69 N/A
Source: California Employment Development Department, 2008-2018 Occupational Projections

Top Average Annual Job Openings for Healthcare and Social Service
Occupations
65
Marin/San Francisco/San Mateo Counties
Average AnnualJob Openings
2010-1st Quarter Wages
New JobsReplacement
NeedsTotal Jobs per Year
Median Annual
Registered Nurses 181 266 447 $101,345
Licensed Practical and Licensed Vocational Nurses
18 101 119 $58,255
Home Health Aides 66 30 96 $23,281
Nursing Aides, Orderlies, and Attendants 28 63 91 $33,368
Medical Assistants 52 37 89 $39,056
Dental Assistants 37 50 87 $40,344
Pharmacy Technicians 43 42 85 $41,504
Massage Therapists 42 43 85 $28,486
Pharmacists 17 31 48 $124,787
Dental Hygienists 16 24 40 $112,881
Source: California Employment Development Department, 2008-2018 Occupational Projections
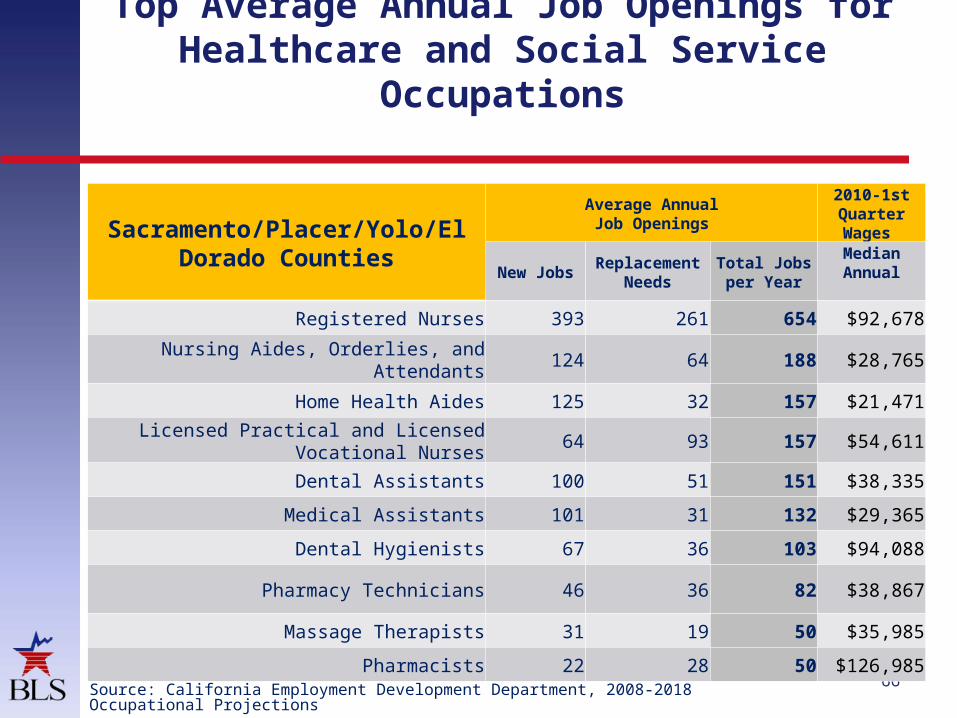
Top Average Annual Job Openings for Healthcare and Social Service
Occupations
66
Sacramento/Placer/Yolo/El Dorado Counties
Average AnnualJob Openings
2010-1st Quarter Wages
New JobsReplacement
NeedsTotal Jobs per Year
Median Annual
Registered Nurses 393 261 654 $92,678
Nursing Aides, Orderlies, and Attendants 124 64 188 $28,765
Home Health Aides 125 32 157 $21,471
Licensed Practical and Licensed Vocational Nurses
64 93 157 $54,611
Dental Assistants 100 51 151 $38,335
Medical Assistants 101 31 132 $29,365
Dental Hygienists 67 36 103 $94,088
Pharmacy Technicians 46 36 82 $38,867
Massage Therapists 31 19 50 $35,985
Pharmacists 22 28 50 $126,985Source: California Employment Development Department, 2008-2018 Occupational Projections

Top Average Annual Job Openings for Healthcare and Social Service
Occupations
67
San Diego County
Average AnnualJob Openings
2010-1st Quarter Wages
New JobsReplacement
NeedsTotal Jobs per Year
Median Annual
Registered Nurses 452 374 826 $80,734
Licensed Practical and Licensed Vocational Nurses
94 159 253 $47,797
Medical Assistants 170 75 245 $30,303
Nursing Aides, Orderlies, and Attendants 160 85 245 $24,250
Home Health Aides 152 40 192 $21,607
Dental Assistants 93 72 165 $36,143
Pharmacy Technicians 71 64 135 $37,262
Physicians and Surgeons, All Other 47 54 101 N/A
Pharmacists 33 48 81 $120,859
Dental Hygienists 37 30 67 $93,723
Source: California Employment Development Department, 2008-2018 Occupational Projections

Top Average Annual Job Openings for Healthcare and Social Service
Occupations
68
Orange County
Average AnnualJob Openings
2010-1st Quarter Wages
New JobsReplacement
NeedsTotal Jobs per Year
Median Annual
Registered Nurses
500 365 865 $77,209
Nursing Aides, Orderlies, and Attendants
232 83 315 $26,371
Home Health Aides
246 52 298 $23,605
Licensed Practical and Licensed Vocational Nurses
123 170 293 $51,053
Medical Assistants
184 84 268 $31,572
Dental Assistants
112 92 204 $32,566
Pharmacy Technicians
75 65 140 $35,432
Veterinary Technologists and Technicians
54 37 91 $31,102
Physicians and Surgeons, All Other
38 41 79 N/A
Pharmacists
33 44 77 $118,547
Source: California Employment Development Department, 2008-2018 Occupational Projections
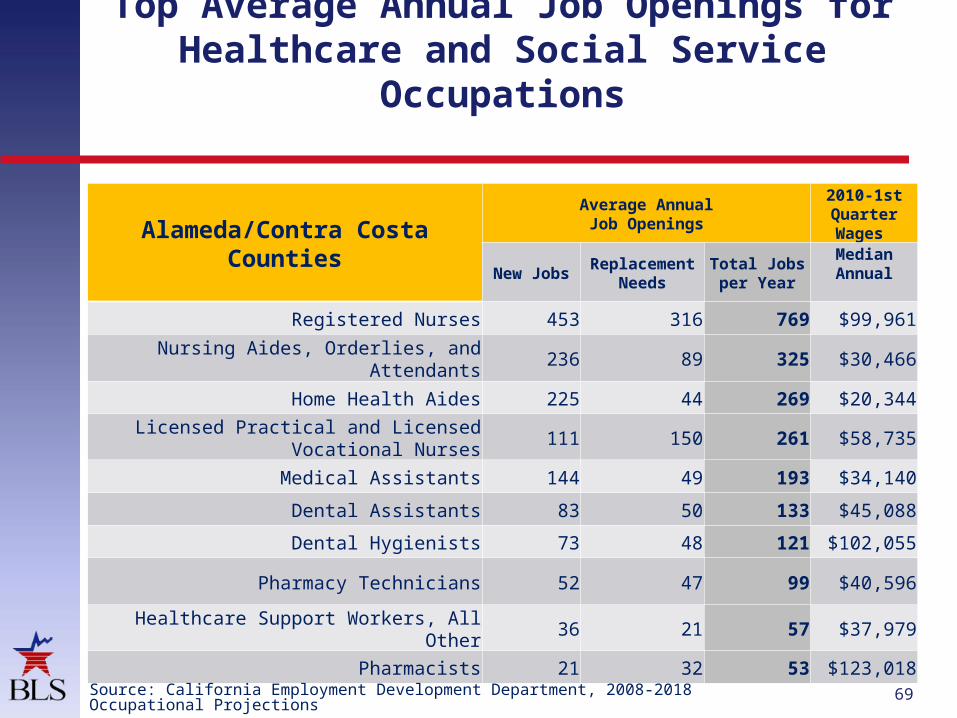
Top Average Annual Job Openings for Healthcare and Social Service
Occupations
69
Alameda/Contra Costa Counties
Average AnnualJob Openings
2010-1st Quarter Wages
New JobsReplacement
NeedsTotal Jobs per Year
Median Annual
Registered Nurses 453 316 769 $99,961
Nursing Aides, Orderlies, and Attendants 236 89 325 $30,466
Home Health Aides 225 44 269 $20,344
Licensed Practical and Licensed Vocational Nurses
111 150 261 $58,735
Medical Assistants 144 49 193 $34,140
Dental Assistants 83 50 133 $45,088
Dental Hygienists 73 48 121 $102,055
Pharmacy Technicians 52 47 99 $40,596
Healthcare Support Workers, All Other 36 21 57 $37,979
Pharmacists 21 32 53 $123,018
Source: California Employment Development Department, 2008-2018 Occupational Projections

Contact Information
U.S. Bureau of Labor StatisticsWestern Information Office
www.bls.gov/ro9415-625-2270

Employment Outlook: 2010-20
Resources for Additional Information
71

Occupational Outlook Handbook
72
www.bls.gov/ooh

Occupational Outlook Quarterly
73
www.bls.gov/ooq
To subscribe: http://www.bls.gov/opub/ooq/subscrib.htm

Employment Projections Program
74
www.bls.gov/emp

January 2012Monthly Labor Review
75
Overview of projections to 2020
The U.S. economy to 2020: recovery in uncertain times
Labor force projections to 2020: a more slowly growing workforce
Industry employment and output projections to 2020
Occupational employment projections to 2020

Useful Employment Projections Sites
76
Technical documentation of Employment Projections Program methods and data
http://www.bls.gov/emp/ep_tech_documentation.htm
Other Employment Projections Program publications, including five Monthly Labor Review articles
http://www.bls.gov/emp/publications.htm
Frequently asked questions
http://www.bls.gov/emp/ep_faq_001.htm

State and Local Area Projections
77
BLS prepares projections only for the nation as a whole
Projections of industry and occupational employment are prepared by each state, using input from the BLS national projections
State projections data, and links to each state’s projections site, are available
http://www.projectionscentral.com/

Projections Evaluation
Last performed for 1996-2006 projections
Comparisons were difficult due to classification changes
BLS projections outperformed naïve models
Direction of employment change was generally correct
78