
California Community Colleges Student Success 2014 Scorecard 2014 Scorecard College of the Desert...
25
California Community Colleges Student Success 2014 Scorecard College of the Desert Board of Trustee Presentation Dec. 19, 2014
-
Upload
henry-bridges -
Category
Documents
-
view
217 -
download
3
Transcript of California Community Colleges Student Success 2014 Scorecard 2014 Scorecard College of the Desert...
California Community Colleges
Student Success 2014 Scorecard
College of the DesertBoard of Trustee Presentation
Dec. 19, 2014
Per the Education Code, Section 84754.5(d):
“As a condition of receiving specified funds in the annual Budget Act, each community college district board of trustees shall annually review and adopt its contribution to the segment wide annual report as part of a regularly scheduled and noticed public meeting at which public comment shall be invited.”
Scorecard Interaction with the Board of Trustees
Review 2014 Scorecard
Address Questions and
Comments from
The Board of Trustees
Reference All Metrics in the Scorecard
Data Sources• MIS (College Data)• System-wide Data• Data available to the CCC
Chancellor’s Office
Outcomes based on cohorts• Followed for 6 years• 2014 Scorecard = 2007-08
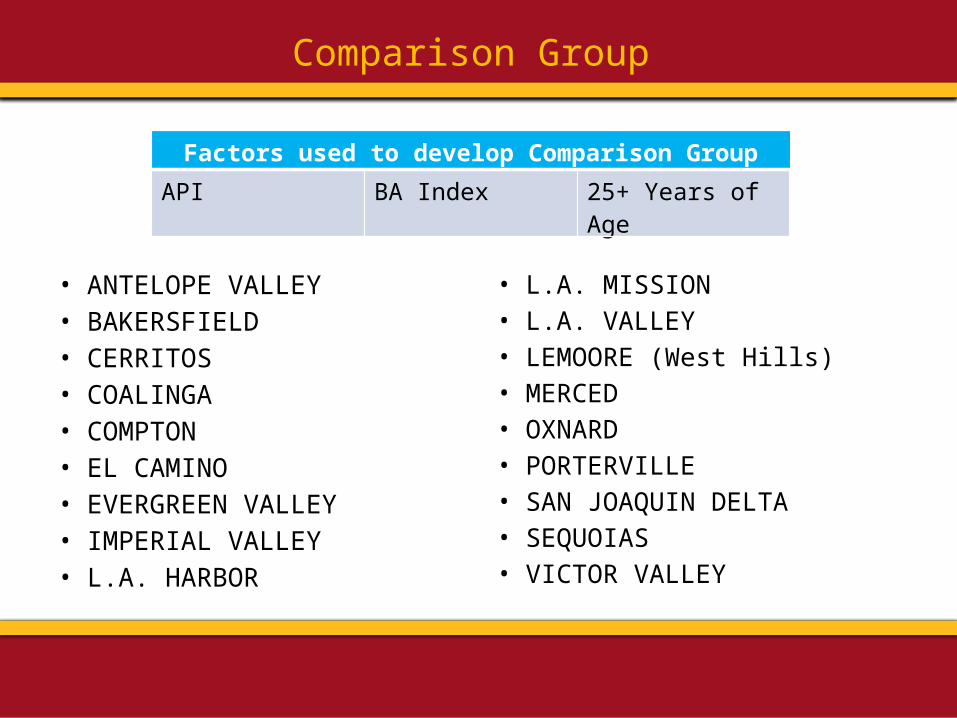
• ANTELOPE VALLEY • BAKERSFIELD • CERRITOS • COALINGA • COMPTON • EL CAMINO • EVERGREEN VALLEY • IMPERIAL VALLEY • L.A. HARBOR
• L.A. MISSION • L.A. VALLEY • LEMOORE (West Hills)• MERCED • OXNARD • PORTERVILLE • SAN JOAQUIN DELTA • SEQUOIAS • VICTOR VALLEY
Comparison Group
Factors used to develop Comparison Group
API BA Index 25+ Years of Age
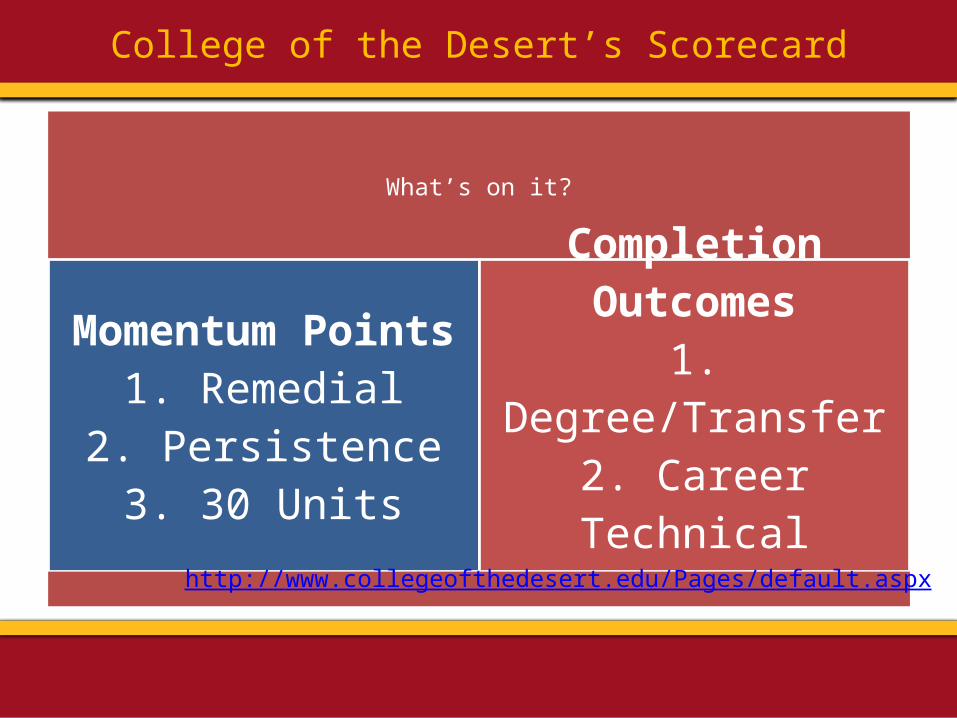
College of the Desert’s Scorecard
What’s on it?
Momentum Points1. Remedial
2. Persistence3. 30 Units
Completion Outcomes1. Degree/Transfer2. Career Technical
Education
http://www.collegeofthedesert.edu/Pages/default.aspx
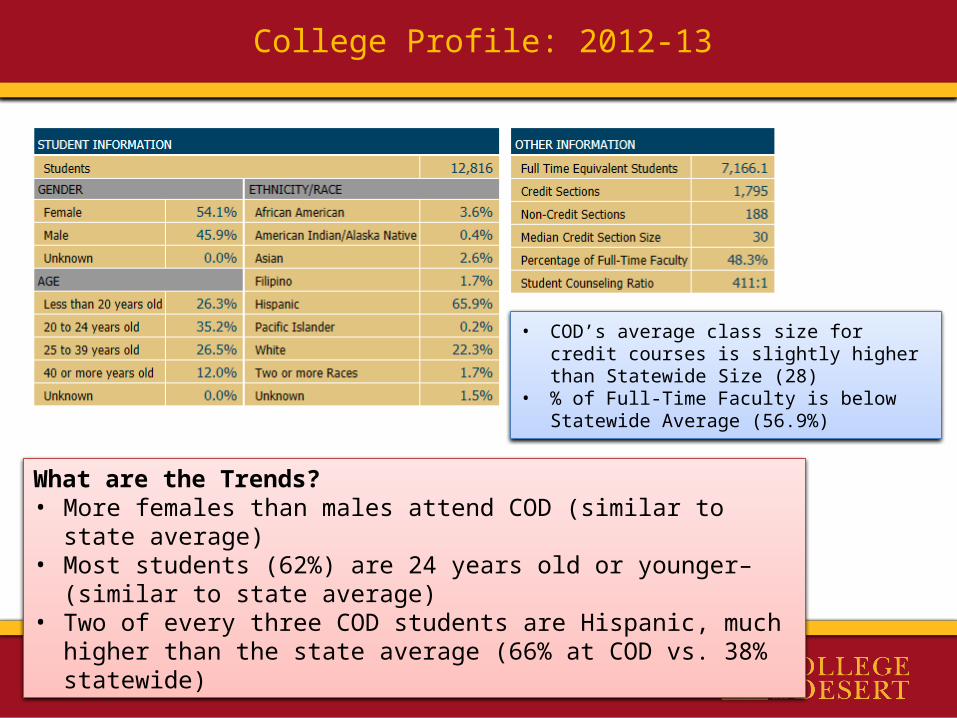
College Profile: 2012-13
What are the Trends?• More females than males attend COD (similar to state average)• Most students (62%) are 24 years old or younger– (similar to state average)• Two of every three COD students are Hispanic, much higher than the state
average (66% at COD vs. 38% statewide)
• COD’s average class size for credit courses is slightly higher than Statewide Size (28)
• % of Full-Time Faculty is below Statewide Average (56.9%)
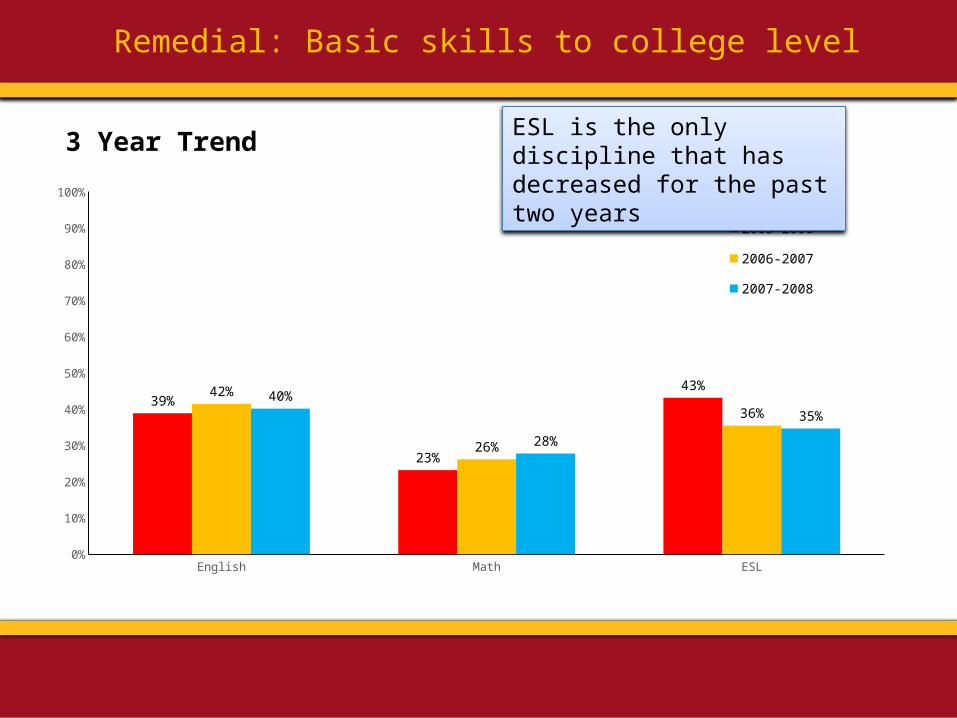
Remedial: Basic skills to college level
English Math ESL0%
10%
20%
30%
40%
50%
60%
70%
80%
90%
100%
39%
23%
43%42%
26%
36%40%
28%
35%
2005-2006 2006-2007
2007-2008
3 Year Trend ESL is the only discipline that has decreased for the past two years
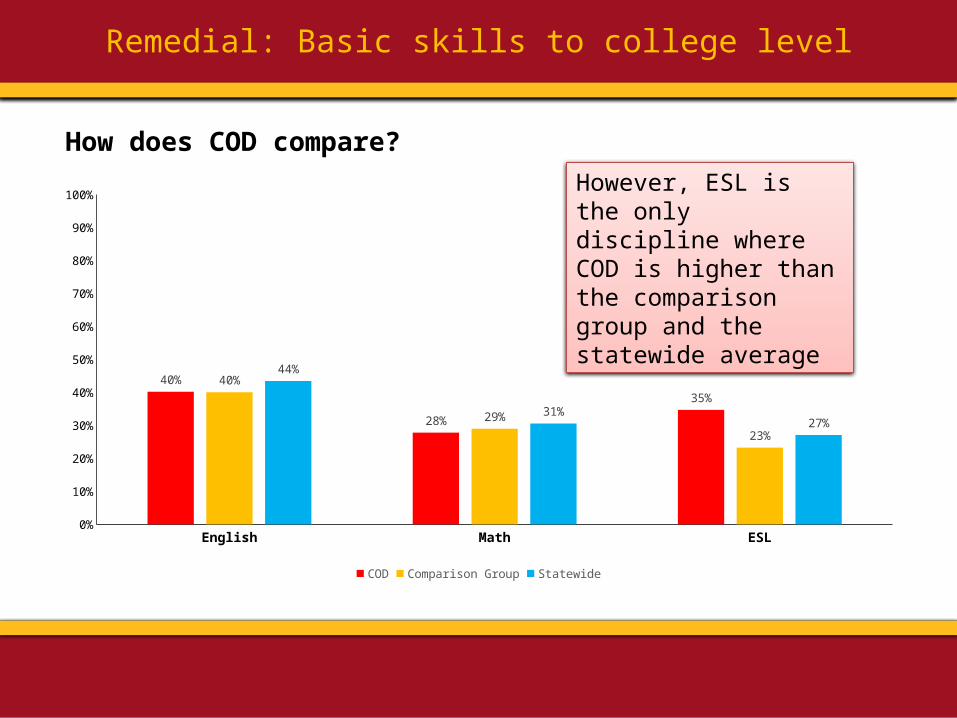
Remedial: Basic skills to college level
How does COD compare?
English Math ESL0%
10%
20%
30%
40%
50%
60%
70%
80%
90%
100%
40%
28%
35%
40%
29%
23%
44%
31%27%
COD Comparison Group Statewide
However, ESL is the only discipline where COD is higher than the comparison group and the statewide average

Remedial: Basic skills to college level
Students under 20 are most likely to complete college level English and Math – students 20-24 are most likely to complete college level ESL, with under 20 coming in a close 2nd
Females perform at higher % than males in Math, English and ESL
Asians are most likely to complete the college level course of the basic skills discipline into which they enrolled
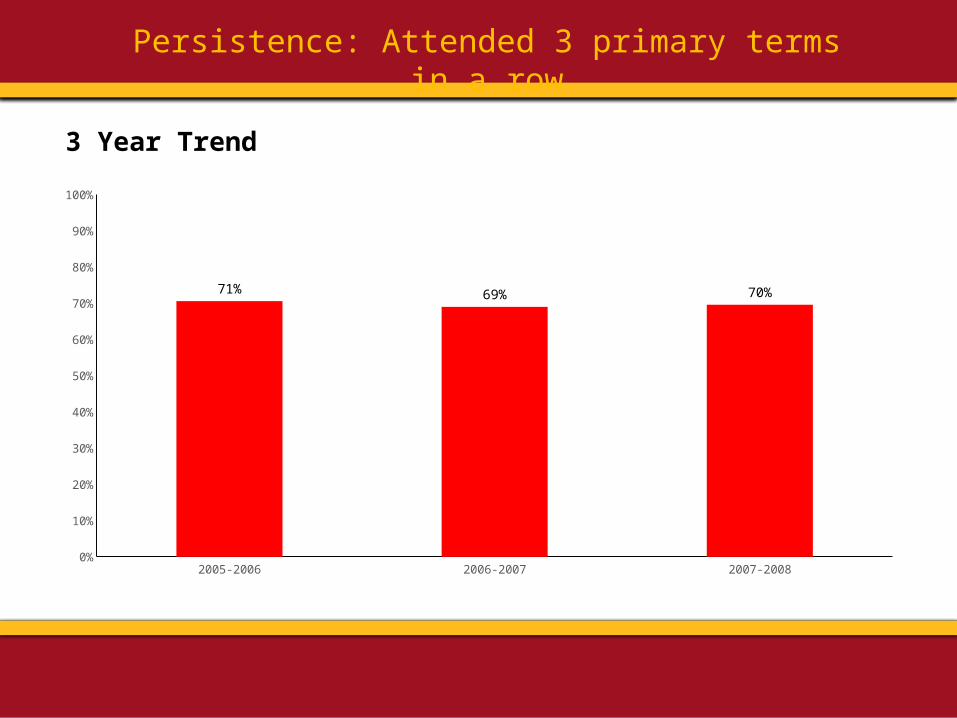
Persistence: Attended 3 primary terms in a row
3 Year Trend
2005-2006 2006-2007 2007-20080%
10%
20%
30%
40%
50%
60%
70%
80%
90%
100%
71% 69% 70%
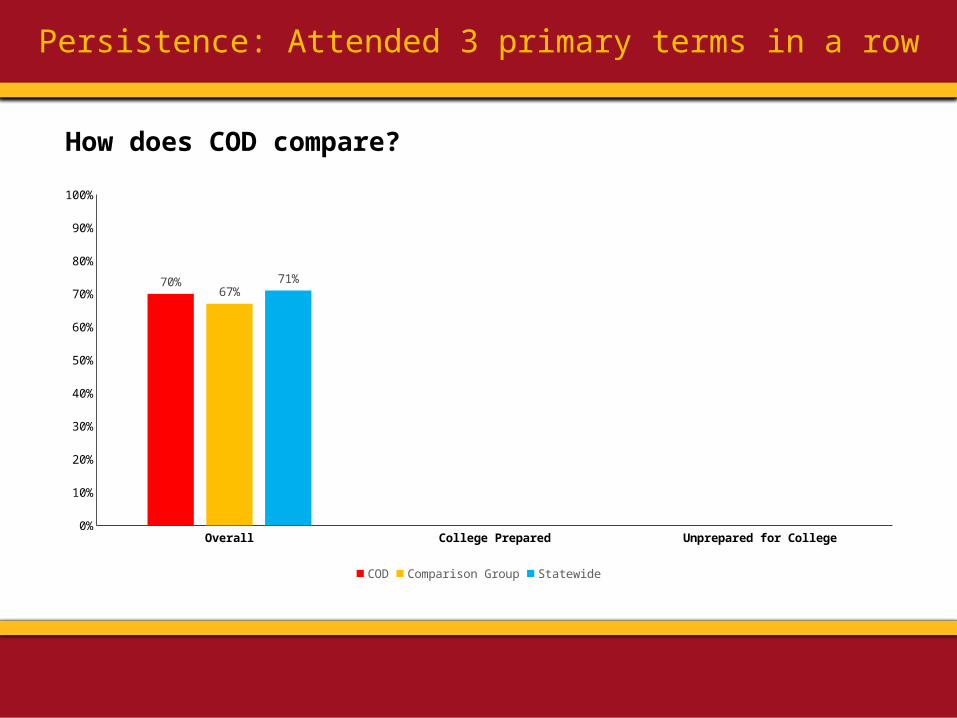
Persistence: Attended 3 primary terms in a row
How does COD compare?
ESL is the only category in which COD is higher than the comparison group and the statewide average
Overall College Prepared Unprepared for College0%
10%
20%
30%
40%
50%
60%
70%
80%
90%
100%
70%67%
71%
COD Comparison Group Statewide
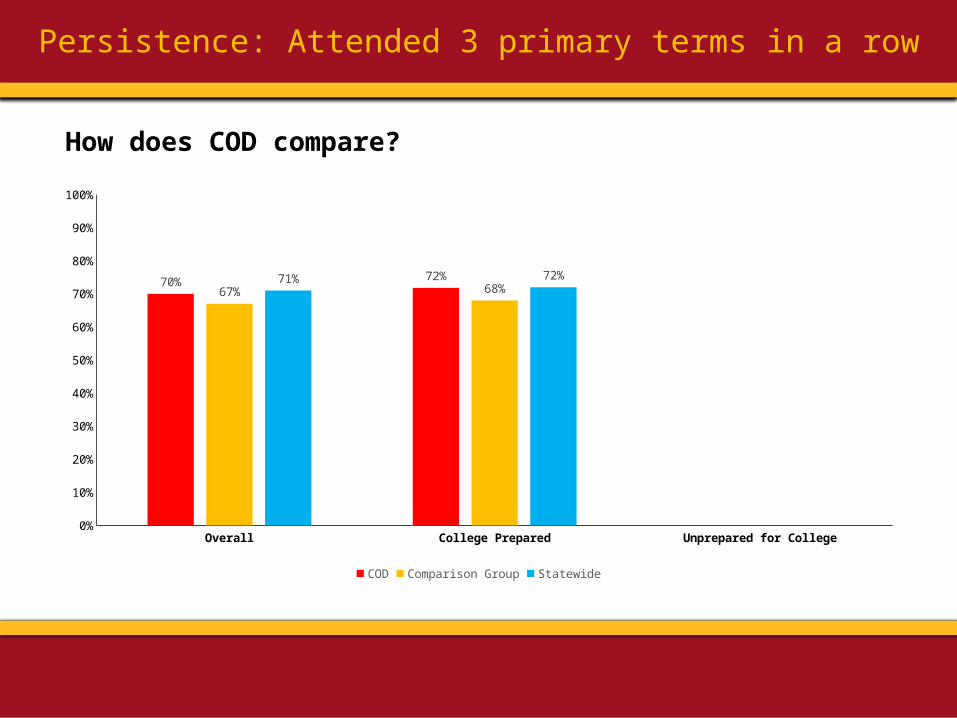
Persistence: Attended 3 primary terms in a row
How does COD compare?
ESL is the only category in which COD is higher than the comparison group and the statewide average
Overall College Prepared Unprepared for College0%
10%
20%
30%
40%
50%
60%
70%
80%
90%
100%
70% 72%67% 68%
71% 72%
COD Comparison Group Statewide
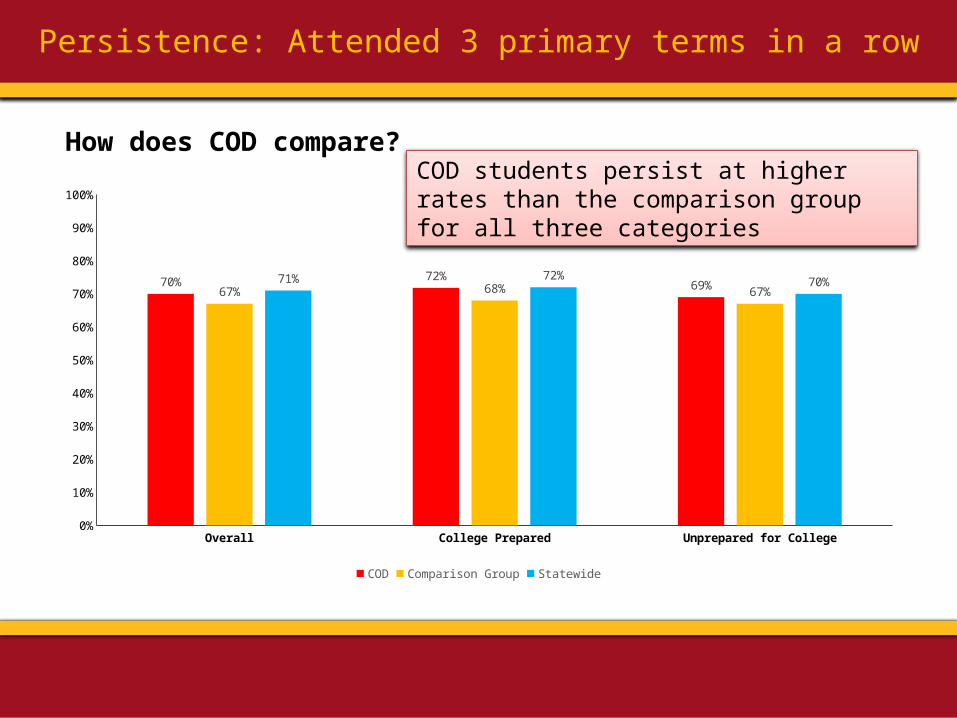
Persistence: Attended 3 primary terms in a row
How does COD compare?
ESL is the only category in which COD is higher than the comparison group and the statewide average
Overall College Prepared Unprepared for College0%
10%
20%
30%
40%
50%
60%
70%
80%
90%
100%
70% 72%69%67% 68% 67%
71% 72% 70%
COD Comparison Group Statewide
COD students persist at higher rates than the comparison group for all three categories

Persistence: attended 3 terms in a rowYounger (under 20) and older (40+) students persist at higher rates than other age groups
Asian students have the highest persistence rate of any other ethnic group
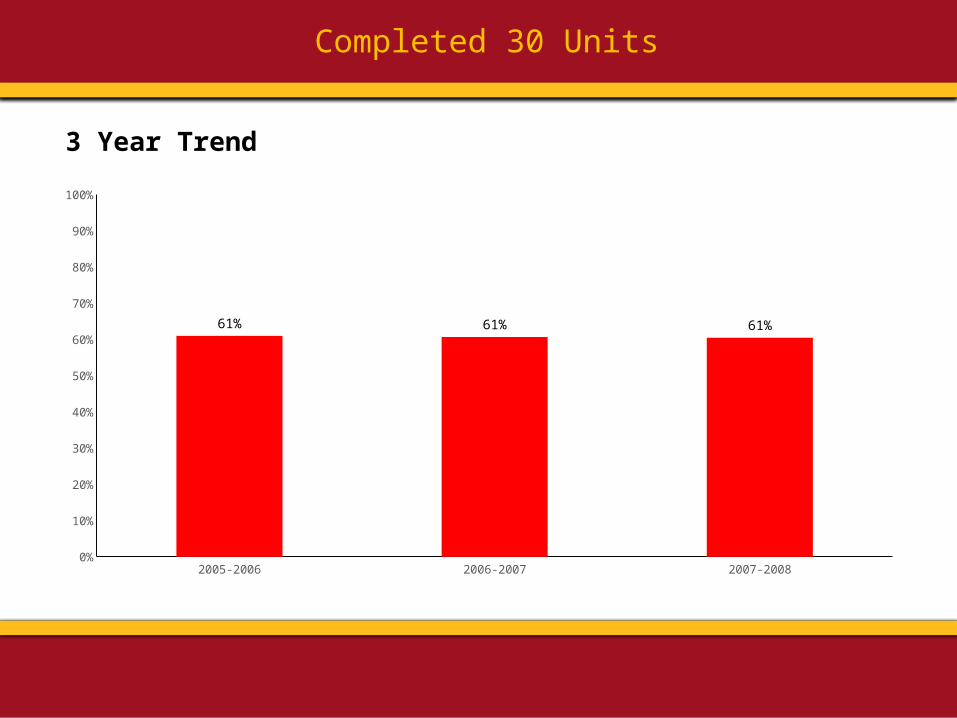
Completed 30 Units
3 Year Trend
2005-2006 2006-2007 2007-20080%
10%
20%
30%
40%
50%
60%
70%
80%
90%
100%
61% 61% 61%

Completed 30 Units
How does COD compare?
ESL is the only category in which COD is higher than the comparison group and the statewide average
College Prepared Unprepared for College Overall 0%
10%
20%
30%
40%
50%
60%
70%
80%
90%
100%
63%60% 61%
68%63% 64%
70%65% 67%
COD Comparison Group Statewide
COD students completed 30 units at lower rates than the comparison group and the statewide for all three categories
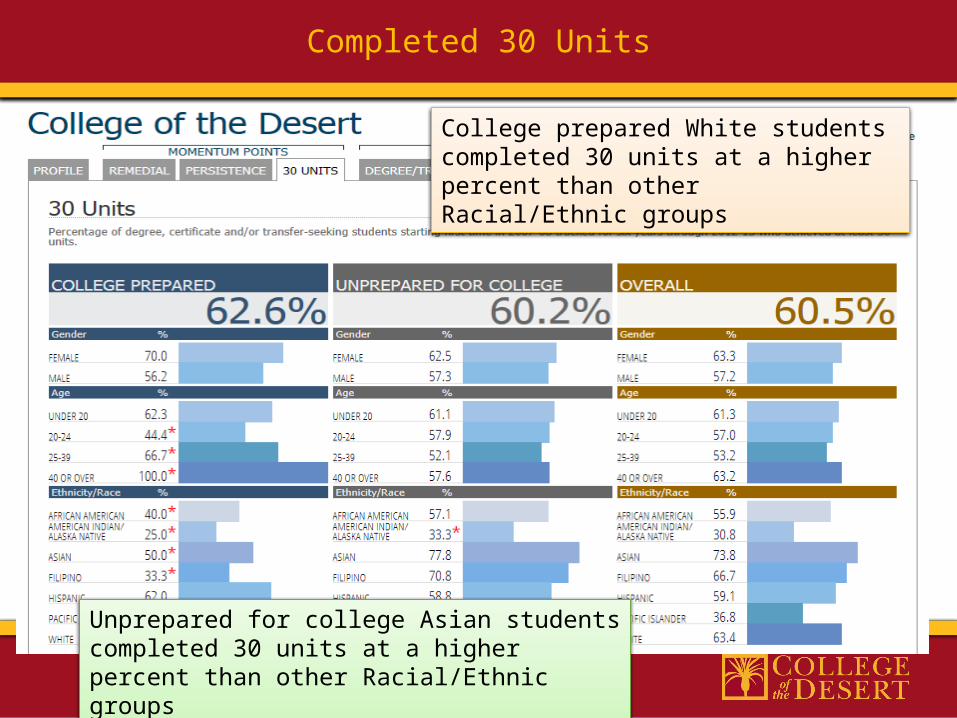
Unprepared for college Asian students completed 30 units at a higher percent than other Racial/Ethnic groups
College prepared White students completed 30 units at a higher percent than other Racial/Ethnic groups
Completed 30 Units
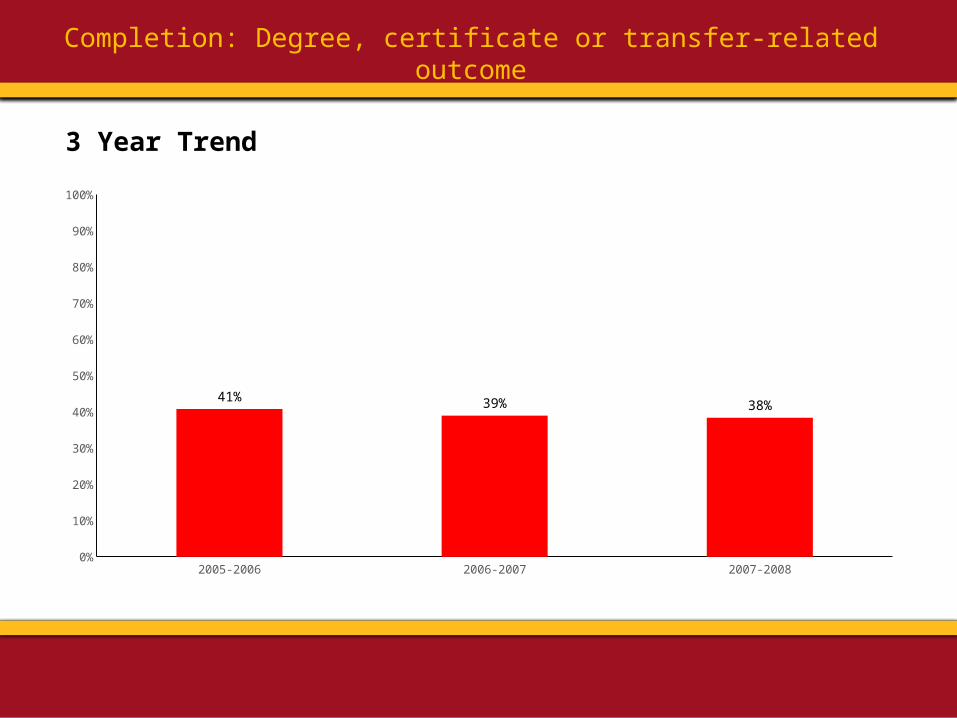
Completion: Degree, certificate or transfer-related outcome
3 Year Trend
2005-2006 2006-2007 2007-20080%
10%
20%
30%
40%
50%
60%
70%
80%
90%
100%
41% 39% 38%

How does COD compare?
ESL is the only category in which COD is higher than the comparison group and the statewide average
College Prepared Unprepared for College Overall 0%
10%
20%
30%
40%
50%
60%
70%
80%
90%
100%
62%
35%38%
69%
37%
43%
70%
41%
48%
COD Comparison Group Statewide
COD students completed at lower rates than the comparison group and the statewide for all three categories
Completion: Degree, certificate or transfer-related outcome
Your text here
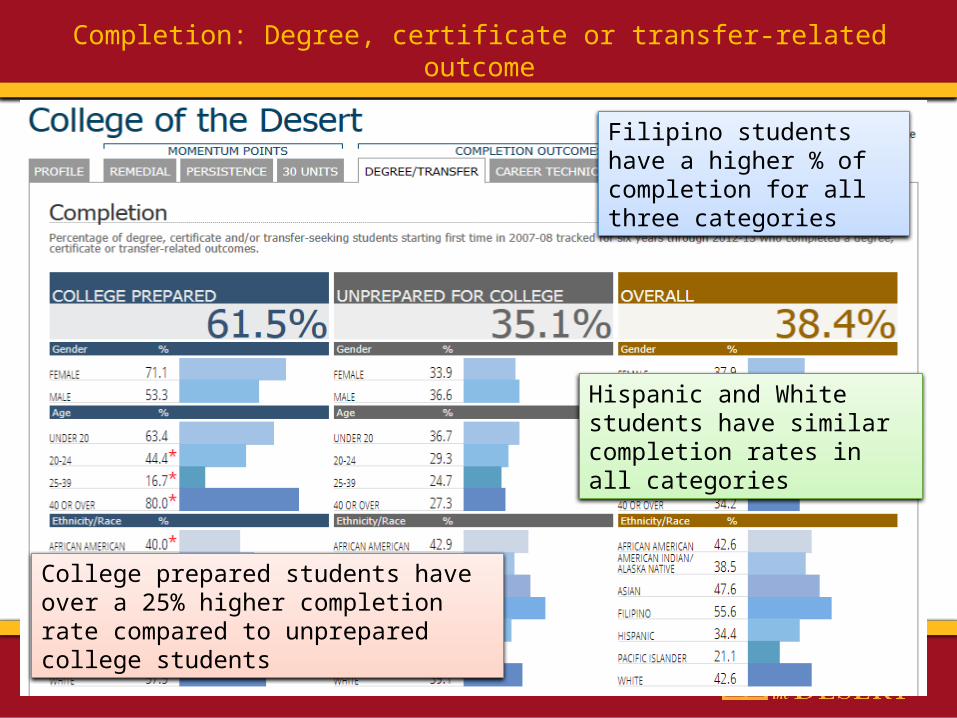
Completion: Degree, certificate or transfer-related outcome
College prepared students have over a 25% higher completion rate compared to unprepared college students
Hispanic and White students have similar completion rates in all categories
Filipino students have a higher % of completion for all three categories
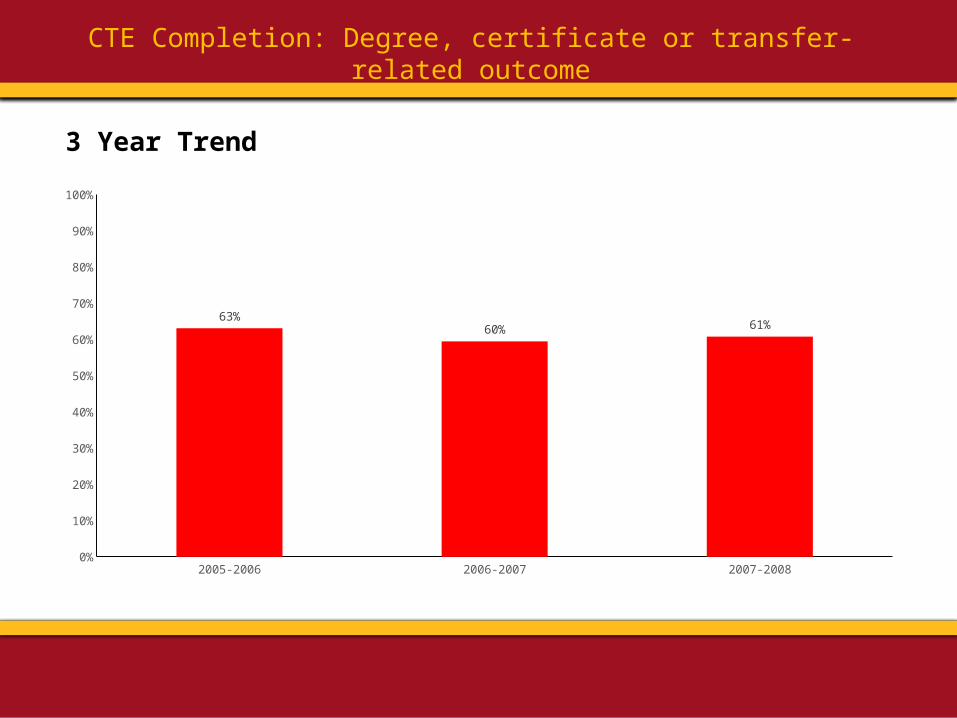
CTE Completion: Degree, certificate or transfer-related outcome
3 Year Trend
2005-2006 2006-2007 2007-20080%
10%
20%
30%
40%
50%
60%
70%
80%
90%
100%
63%60% 61%
How does COD compare?
ESL is the only category in which COD is higher than the comparison group and the statewide average
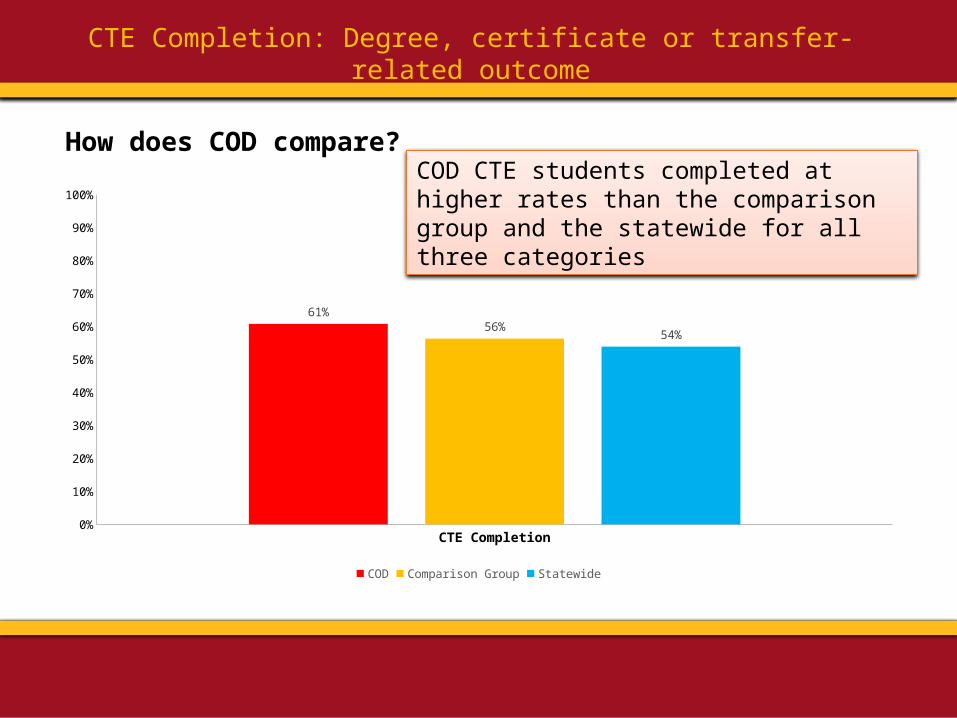
CTE Completion: Degree, certificate or transfer-related outcome
CTE Completion0%
10%
20%
30%
40%
50%
60%
70%
80%
90%
100%
61%56%
54%
COD Comparison Group Statewide
COD CTE students completed at higher rates than the comparison group and the statewide for all three categories
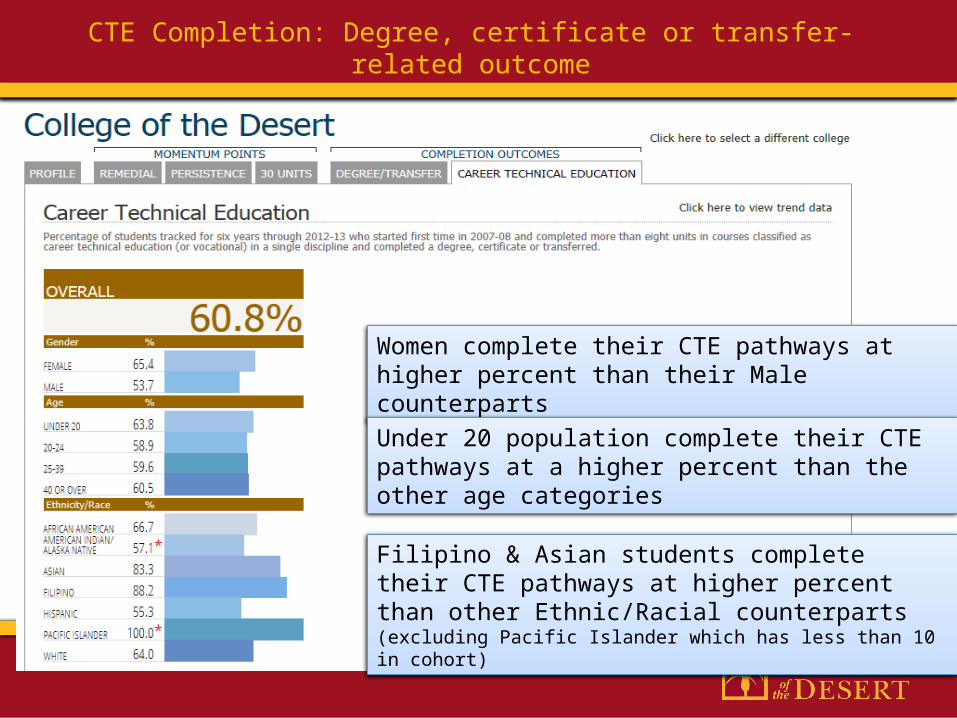
Women complete their CTE pathways at higher percent than their Male counterparts
CTE Completion: Degree, certificate or transfer-related outcome
Under 20 population complete their CTE pathways at a higher percent than the other age categories
Filipino & Asian students complete their CTE pathways at higher percent than other Ethnic/Racial counterparts (excluding Pacific Islander which has less than 10 in cohort)

Dr. Daniel MartinezDirector, Institutional ResearchEmail: [email protected]
Extension: 7212
THANK YOU!
QUESTIONS OR COMMENTS