CALIFORNIAdoingwhatmatters.cccco.edu/Portals/6/docs/California Energy...CALIFORNIA ENERGY EFFICIENCY...
53
CALIFORNIA ENERGY EFFICIENCY SECTOR ALIGNMENT AN ANALYSIS OF KEY OCCUPATIONS & EDUCATION PROGRAMS SUPPORTING ENERGY EFFICIENCY INDUSTRIES February 2012
Transcript of CALIFORNIAdoingwhatmatters.cccco.edu/Portals/6/docs/California Energy...CALIFORNIA ENERGY EFFICIENCY...

CALIFORNIA ENERGY EFFICIENCY SECTOR ALIGNMENT A N A N A LY S I S O F K E Y O CC U PAT I O N S
& E D U C AT I O N P R O G R A M S S U P P O R T I N G
E N E R G Y E F F I C I E N C Y I N D U S T R I E S
February 2012

i CALiFORNiA ENERGY EFFiCiENCY SECTOR ALiGNMENT
EXECUTIVE SUMMARY
This report aims to provide a current data-driven picture of the relevant industries, occupations, and educational programs in the 19-county Pacific Gas & Electric (pg&e) service area. This information is a valuable tool to help ensure that the region’s key in-dustries have access to the right types of workers, and that these workers have received the right education/training and consequently the right skills to contribute to the economy. The information was developed to help pg&e and key stakeholder partners assess and improve preparedness of the region’s energy efficiency workforce, with particular emphasis on services and products that will improve the energy efficiency of the commercial sector.
Industries
Thirteen industries were selected by Workforce Incu-bator to make up the Energy Efficiency sector in this analysis. As a whole, the 13 industries are projected to grow 7%, an additional 8,908 jobs, by 2016. In com-parison, the same 13 industries across all of California are expected to grow 5.1%, while all industries in the state are projected to grow 5.7%. Of the group of key industries, engineering services is by far the strongest. It is the region’s largest source of jobs in the Energy Efficiency sector, contributing 36% of the 135,779 jobs in these industries. It will also
create almost half of the sector’s projected job growth. In addition, engineering services dominates the other industries in the group with over $5 billion in exports in 2011. This is almost four times the amount of exports as the nearest industry and 65% of the overall total exports for the entire group of industries. The key industries in this analysis generally require a skilled workforce. The three industries with the high-est percentage of skilled workers in their workforce were architectural services, nonresidential electrical contractors, and nonresidential plumbing and hvac contractors. Engineering services also requires a large number of skilled workers. Overall, the characteristics of the 13 industries in the pg&e service area mirror the trend found in the 13 industries statewide. The industries tend to be larger, with regard to job numbers, in the counties border-ing the south side of the San Francisco Bay. The four counties of San Francisco, Alameda, Contra Costa, and Santa Clara comprise 51% of all the jobs in these industries in the pg&e service area.
Educational Programs
In order to have a strong workforce a region should have the proper educational structure in place to pro-
Table A: Sector Industries
NAICS CODE DESCRIPTION
236210 Industrial Building Construction
236220 Commercial and Institutional Building Construction
238212 Nonresidential electrical contractors
238222 Nonresidential plumbing and HVAC contractors
333411 Air Purification Equipment Manufacturing
333412 Industrial and Commercial Fan & Blower Mfg.
333414 Heating Equipment (except Warm Air Furnaces) Mfg.
333415Air-Conditioning and Warm Air Heating Equipment and Commercial and Industrial Refrigeration Equip-ment Manufacturing
335314 Relay and Industrial Control Manufacturing
541310 Architectural Services
541330 Engineering Services
541340 Drafting Services
541350 Building Inspection Services

AN ANALYSiS OF KEY OCCUPATiONS & EDUCATiON PROGRAMS SUPPORTiNG ENERGY EFFiCiENCY iNDUSTRiES ii
vide the necessary training for workers to succeed. Table B displays the shortages and surpluses of gradu-ates in each educational program area in the 19-county pg&e service area. These include the whole spectrum of program completions, from short-term certificates up to graduate education. Most differences are under 4% of the total job numbers in those occupations, in-dicating that large shortages or surpluses of graduates
do not currently exist in the region. Within the region, graduates tend to come from a handful of counties: Santa Clara, Alameda, San Fran-cisco, Sacramento, and Yolo. Demand also tends to be centered in those counties, with the exception of Yolo County, reflecting the need for workers in the Silicon Valley area and the state capital. Graduates for several key occupations come from
Table B: Shortages and Surpluses in the PG&E Service Area
PROGRAM AREA TOTAL JOBSTOTAL NEW
GROWTHMEDIAN
HOURLY WAGETOTAL ANNUAL
OPENINGS TOTAL GRADS GAP/ SURPLUS
Sales & Marketing 222,171 (5,358) $29.51 8,206 797 (7,409)
Computer Science 234,423 19,732 $44.06 9,948 2,789 (7,159)
Administrative Services 261,693 (11,034) $20.61 6,363 782 (5,581)
Accounting and Finance 149,811 7,174 $33.16 5,846 1,520 (4,326)
Public Relations/ Advertising 25,097 1,602 $30.03 1,154 226 (928)
General Construction 57,531 (8,253) $25.25 1,150 306 (844)
Human Resources 27,053 834 $35.81 1,119 452 (667)
Industrial Mechanics 11,247 (600) $22.34 515 0 (515)
Carpentry 32,700 (14,505) $26.52 607 130 (477)
Electronics Repair Technician 23,017 (4,554) $21.34 622 150 (472)
Machinists 13,570 (2,295) $17.93 448 119 (329)
Plumbing 12,302 (3,107) $27.71 353 63 (290)
Quality Control 9,708 (1,185) $16.56 221 2 (219)
Electricians 19,255 (4,776) $28.23 668 520 (148)
Environmental Health Engineering 3,785 63 $45.14 148 18 (130)
Electrical Engineering Technicians 8,325 (1,268) $25.34 237 149 (88)
Electromechanical Technology 3,897 (403) $21.60 118 45 (73)
Civil Engineering Technology 2,502 (96) $30.32 79 37 (42)
Environmental Engineering Tech. 754 16 $24.52 28 0 (28)
Industrial Engineering 14,384 (212) $39.68 561 547 (14)
Aerospace Engineering Technology 242 (5) $28.94 10 0 (10)
Mechanical Engineering Technology 898 (66) $26.41 29 75 46
Urban Development 3,369 (14) $38.42 99 180 81
Architecture 9,186 (1,248) $29.14 273 375 102
General Engineering 4,694 (27) $45.04 163 340 177
Interior Design 3,783 (331) $19.12 188 470 282
Mechanical Engineering 18,851 (2,545) $44.03 648 1,018 370
Civil Engineering 19,548 (812) $45.21 565 1,040 475
Electrical Engineering 24,407 (2,369) $50.41 766 1,453 687
Energy/ HVAC Technology 8,553 (1,366) $25.59 200 1,347 1,147
Business Management 338,130 11,584 $35.21 13,757 15,053 1,296
TOTAL 1,564,884 (25,426) $32.10 55,088 30,003 (25,085)

i i i CALiFORNiA ENERGY EFFiCiENCY SECTOR ALiGNMENT
these educational hubs. For example, architectural graduates come mainly from Alameda County and UC Berkeley, with job openings centered in the South Bay area. Thirteen of the region’s 19 counties have zero graduates in civil engineering. Sacramento County is the largest source of carpentry graduates in the region, while 15 of the 19 counties have no graduates in the carpentry trade. Only four counties produced graduates in plumbing in 2010, with Alameda County making up half of the supply numbers. Finally, Alameda and Santa Clara Counties supply 90% of the electrician graduates. These examples highlight the fact that much of the region’s training needs are not being met locally, but depend on a handful of key programs at educational hubs in the region. While it is definitely an asset to have such strong educational centers, such a centralized system could potentially limit access to workers in more rural areas who want to enhance their training. Those pursuing a four-year degree may be willing to relocate, but for workers interested in maintaining their current position while earning an advanced certificate, having to commute to a program three counties away may be too difficult. It could be useful to consult with industry leaders as to whether they see this as an issue. Most of the occupational groups in this analysis have experienced job losses in the last five years, likely in large part due to the recent recession. Those that have grown are mostly in the business realm: business management, accounting and finance, public relations and advertising, and human resources. Computer sci-ence has had the largest job growth since 2006. Supply has not been able to keep pace with growth, leaving a shortage of over 7,000 workers in the region each year. Half the annual openings are located in Santa Clara County, the heart of Silicon Valley. Overall, the region’s educational centers are generally meeting the needs of regional employers for trained workers. If any problem areas do exist, they are slight shortages of graduates in computer science and accounting and finance.
Occupations
Development of the Energy Efficiency sector will be driven in large part by a strong supply of talented workers. The employees needed to sustain this sector come from a variety of fields—from construction and
installation to sales and public relations. The cutting-edge and highly technical nature of this sector requires employees with both business and scientific backgrounds. This report analyzes 67 occupations which are organized into 10 categories. From 2006 to 2011, six of these skill groups suffered a net decline in employment in the pg&e service area across all industries. This should not be a source of alarm, however, as the growth rate of the Energy Efficiency sector over the next five years is expected to rebound well. In total, there are projected to be 2,699 annual open-ings in the Energy Efficiency sector for
critical Energy Efficiency occupations. This includes a blend of hands-on jobs (such as those in construction) and white-color jobs (such as those in engineering and building design). Additionally, most of this job loss occurred in industries outside of the Energy Efficiency sector, so some of the workers who
Figure A: Distribution of Jobs in Energy Efficient Occupations in the Energy Efficiency Sector by Skill Group
Construction
Engineering
Building Design
Energy Assessment
Technician & Installation Workers
Operations & Supply Chain
Sales, Marketing, Program Mgmt.
Finance & Acconting
Information Technology
Human Resources & Training
44%
23%
11%
5%
9%
4%
1%
1%
0%
T H E AV E R AG E WAG E O F
C R I T I C A L J O B S
I N T H E E N E R G Y
E F F I C I E N C Y
S E C TO R I S 40%
M O R E T H A N
A L L OT H E R
O CC U PAT I O N S
I N G E N E R A L
Note: This does not include non-Energy Efficiency occupations, which make up roughly 40% of the jobs in the 13 Energy Efficient industries in the PG&E service region.

AN ANALYSiS OF KEY OCCUPATiONS & EDUCATiON PROGRAMS SUPPORTiNG ENERGY EFFiCiENCY iNDUSTRiES iv
are still unemployed as a result of the recession could be targeted for recruitment into the Energy Efficiency sector. Furthermore, the aver-age wage of critical jobs in the Energy Ef-ficiency sector is 40% more than all other occupations in general. This indicates that there is strong potential to draw workers in from lower-paying occupations. Figure A illustrates the breakdown of the key occupations within the Energy Efficiency Sector. Construction and Engi-neering make up the lion’s share of the key occupations’ employment in the Energy Efficiency sector (44% and 26%, respec-tively). The greatest job growth in the sec-tor in coming years will be predominately for engineers, high-level managers, and certain types of skilled craftsmen, such as plumbers and carpenters. Table C shows the top 20 Energy Efficiency occupa-
tions within the 13 Energy Efficiency industries. One of the challenges facing the energy
Efficiency sector in coming years will be filling the void left by retiring workers from the baby-boomer generation. Within the region, it is estimated that more than half the workers in the critical Energy Ef-ficiency occupations are 54 or older. The proportions are quite a bit higher among management and maintenance positions. Another issue is the predominance of men in these occupations. Of all employees in the critical Energy Efficiency occupa-tions, 71% are male, which means that a large portion of the nation’s workforce—
women—is potentially underutilized by businesses in these industries. Regional gender trends in these occupations parallel the national energy ef-ficiency ratios.
Table C: In-Sector Employment for Top 20 Occupations
SOC CODE DESCRIPTION
2011 INDUSTRY
JOBS
ANNUAL OPENINGS
IN INDUSTRY
% OF ENERGY EFFICIENCY
SECTOR% OF
OCCUPATION SKILL CATEGORY
17-2051 Civil engineers 9,289 316 7% 52% Engineering
47-2111 Electricians 10,601 294 8% 46% Construction
17-1011 Architects, except landscape and naval 7,162 215 5% 76% Design
47-2152 Plumbers, pipefitters, and steamfitters 5,985 132 4% 35% Construction
11-9199 Managers, all other 2,375 109 2% 2% Operations
47-1011 First-line supervisors/managers of construc-tion trades and extraction workers 4,920 94 4% 18% Construction
47-2031 Carpenters 6,800 82 5% 13% Construction
11-1021 General and operations managers 2,521 81 2% 3% Energy Assessment
11-9021 Construction managers 4,067 73 3% 17% Energy Assessment
17-2199 Engineers, all other 2,297 64 2% 17% Engineering
17-2141 Mechanical engineers 1,881 60 1% 22% Engineering
49-9021 Heating, air conditioning, and refrigeration mechanics & installers 1,982 59 1% 27% Tech & Install
11-9041 Engineering managers 2,277 59 2% 16% Engineering
47-4011 Construction and building inspectors 1,581 46 1% 33% Construction
47-2211 Sheet metal workers 1,721 45 1% 31% Tech & Install
13-1051 Cost estimators 1,785 42 1% 19% Construction
17-2071 Electrical engineers 1,489 42 1% 17% Engineering
11-9021 Construction managers 4,067 41 3% 17% Construction
13-2011 Accountants and auditors 893 32 1% 1% Finance
13-1199 Business operation specialists, all other 853 29 1% 1% Energy Assessment
M O R E T H A N H A L F T H E
W O R K E R S I N
T H E C R I T I C A L
E N E R G Y
E F F I C I E N C Y
O CC U PAT I O N S
A R E 54
O R O L D E R

v CALiFORNiA ENERGY EFFiCiENCY SECTOR ALiGNMENT
Within the Energy Efficiency sector are many op-portunities to develop and advance the current work-force. Entry and mid-level positions, such as customer service representatives, team assemblers, and mainte-nance and repair workers, are a tremendous source of prospective talent that already exists in house. Op-portunities for advancement within the maintenance and installation skill group are also abundant. For instance, mid-level maintenance workers can move from earning an average of $19 per hour to an average of $32 by increasing their management skills and their knowledge of production and processing. If the Energy Efficiency sector seeks to recruit from other industries, the best option is usually to draw workers with the same occupational classification. Multiple industries provide possibilities for recruiting. Four of the most compatible industries are in the real estate sector, with more than 71,000 compatible jobs available in categories such as sales, operations, and finance. Many residential contracting industries are still reeling from the housing bust, and are projected to continue their struggle over the next five years. This could be a key source of construction workers for the energy efficiency industry. The same could be true of agricultural workers. Computer operators and postmasters and mail superintendents could also become entry-level workers for the operations skills group. And the insurance industry hosts numerous occupations that could be transferred into the sales, marketing, and program management skills group, including insurance underwriters and brokerage clerks.
Conclusion
The industries in the Energy Efficiency sector have a positive economic outlook in the next five years. As these industries look to grow, they can look to significant educational centers to provide them with well-trained young workers. They can also provide training to raw talent in house or pursue lower-paid or dislocated workers from other industries that have laid off more employees in the recent recession. Utiliz-ing these staffing and educational resources will assist these industries in strong economic growth.

AN ANALYSiS OF KEY OCCUPATiONS & EDUCATiON PROGRAMS SUPPORTiNG ENERGY EFFiCiENCY iNDUSTRiES vi
i Executive Summary
1 Introduction
2 Chapter 1: Industry Analysis
6 Chapter 2: Educational Gap Analysis
11 Chapter 3: Occupation Analysis
26 Appendix A: Industry Metric Definitions
28 Appendix B: Further Methodology for Educational Gap Analysis
29 Appendix C: Data Sources
31 Appendix D: Detailed Occupation Data
CONTENTS
About EMSI
emsi provides economic data, analysis, and consulting services to workforce, education, and economic develop-ment professionals throughout the nation. Since 1995, emsi has delivered high-quality, cost-effective services that promote economic growth, institutional change, and intelligent use of human, physical, and financial resources. emsi gathers and harmonizes data from nearly 90 state and federal sources, creating a comprehensive and current database that is unsurpassed for its breadth and detail. Industry, workforce, and demographic data are available at the state, county, and zip code levels. By combining dozens of data sources, emsi can fill gaps in individual sources, such as those due to suppressions and missing proprietors, yielding a composite database that exploits the strengths of each source. The emsi database is updated quarterly with the latest information from the Current Employment Statistics database.

1 CALiFORNiA ENERGY EFFiCiENCY SECTOR ALiGNMENT
INTRODUCTION
Pacific Gas & Electric (pg&e) is focused on improv-ing the energy efficiency of commercial buildings in its 19-county service area. A key part of making such an initiative successful is understanding how well equipped the local labor market is in meeting the current and near-term projected demand of regional energy sector employers. pg&e has chosen 13 specific industries which it believes to have the greatest impact on the overall outcome of its efforts to improve effi-ciency. The workforce analysis undertaken here aims to provide a current data-driven picture of the relevant industries, occupations, and educational programs in order to assist pg&e in ensuring that the region’s resources are aligned so that its key industries have ac-cess to qualified workers, and that these workers have received appropriate education/training and therefore have the right skills to contribute to the region’s energy efficiency sector. The analysis begins with an assessment of the key trends in the Energy Efficiency industry sector in the 19-county pg&e service area. It weighs the strengths and weaknesses of industries, using factors such as size, exports, growth (past and projected), and the comparative advantage of the industries in the region. Next, the analysis examines the key occupations within those industries. This involves consideration of the number of jobs, wages, and the amount of educa-tion/training/experience required for job candidates. It also determines the knowledge, skills, and abilities (KSAs) that are most important to those occupations,
as well as career pathway opportunities between key occupations. The analysis then compares the key oc-cupations to the number of relevant graduates from local educational institutions, in order to determine whether the educational structure of the region is in place to support the occupational needs of the Energy Efficiency sector.

AN ANALYSiS OF KEY OCCUPATiONS & EDUCATiON PROGRAMS SUPPORTiNG ENERGY EFFiCiENCY iNDUSTRiES 2
C H A P T E R 1 :
INDUSTRY ANALYSIS
Introduction
Data offer valuable insights into the successes and struggles of industries in today’s economy. This chapter examines both the historical and the projected perfor-mance of the region’s industries. The analysis looks at a number of characteristics of each industry: size and growth; projected growth; competitive effects; export orientation; average wage; and workforce skills. These are described in depth in Appendix A. Each of these metrics provides a different perspec-tive of industry performance for 13 six-digit industry codes, as classified by North American Industry Clas-sification System (naics) categories, which make up the Energy Efficiency sector in this report.
Jobs
Of the group of key energy efficiency industries, en-gineering services is the largest source of jobs in the region. It contributes 48,222 jobs, which is nearly 36% of the 135,779 jobs provided by the 13 industries. It has twice the number of jobs as the second largest indus-try, commercial and institutional building construction, and is projected to continue to have strong growth in
the next five years. All the top producers lost jobs due to the economic downturn and the plunge in the commercial building real estate market. These 13 industries in particular lost a total of 16,835 jobs in the 19-county region, and 44,953 across the state as a whole. The trends of loss and growth in this region are similar in the rest of the state. As a whole, the Energy Efficiency sector industries are projected to grow by 7%, or 8,908 jobs, by 2016. The top five industries will create 9,532 jobs, while the bottom eight will lose 624 jobs. Engineering services will create almost half of the new jobs. The second highest new job creation occurs in the nonresidential plumbing and hvac contractors industry. These two performers will create 74% of all new jobs for this group of 13 industries in the region.
Regional CompetitivenessGrowth can be broken down into three component causes. The “national growth effect” is growth that can be attributed to the overall growth of the entire U.S. economy; the “industrial mix effect” is growth that can be attributed to positive trends in the specific industry
Table 1.1: Sector Industries
NAICS CODE DESCRIPTION
236210 Industrial Building Construction
236220 Commercial and Institutional Building Construction
238212 Nonresidential electrical contractors
238222 Nonresidential plumbing and HVAC contractors
333411 Air Purification Equipment Manufacturing
333412 Industrial and Commercial Fan and Blower Manu-facturing
333414 Heating Equipment (except Warm Air Furnaces) Manufacturing
333415Air-Conditioning and Warm Air Heating Equipment and Commercial and Industrial Refrigeration Equip-ment Manufacturing
335314 Relay and Industrial Control Manufacturing
541310 Architectural Services
541330 Engineering Services
541340 Drafting Services
541350 Building Inspection Services
3 CALiFORNiA ENERGY EFFiCiENCY SECTOR ALiGNMENT
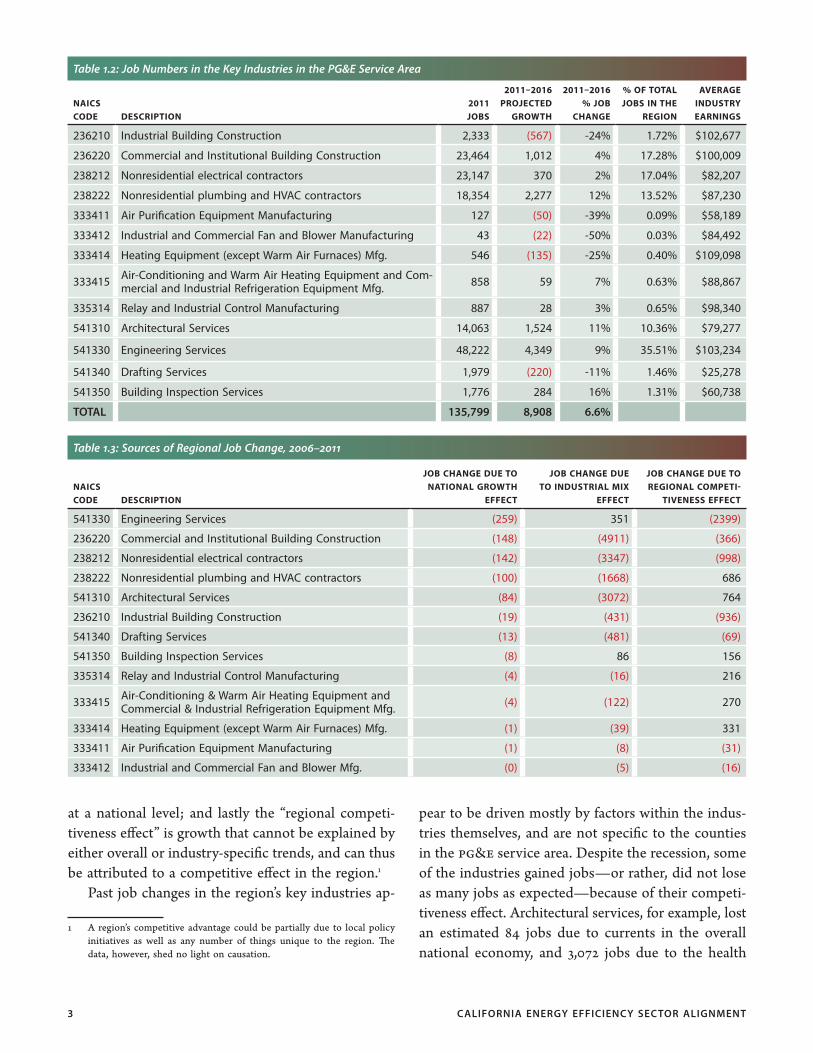
at a national level; and lastly the “regional competi-tiveness effect” is growth that cannot be explained by either overall or industry-specific trends, and can thus be attributed to a competitive effect in the region.1 Past job changes in the region’s key industries ap-
1 A region’s competitive advantage could be partially due to local policy initiatives as well as any number of things unique to the region. The data, however, shed no light on causation.
pear to be driven mostly by factors within the indus-tries themselves, and are not specific to the counties in the pg&e service area. Despite the recession, some of the industries gained jobs—or rather, did not lose as many jobs as expected—because of their competi-tiveness effect. Architectural services, for example, lost an estimated 84 jobs due to currents in the overall national economy, and 3,072 jobs due to the health
Table 1.2: Job Numbers in the Key Industries in the PG&E Service Area
NAICS CODE DESCRIPTION
2011 JOBS
2011–2016 PROJECTED
GROWTH
2011–2016 % JOB
CHANGE
% OF TOTAL JOBS IN THE
REGION
AVERAGE INDUSTRY EARNINGS
236210 Industrial Building Construction 2,333 (567) -24% 1.72% $102,677
236220 Commercial and Institutional Building Construction 23,464 1,012 4% 17.28% $100,009
238212 Nonresidential electrical contractors 23,147 370 2% 17.04% $82,207
238222 Nonresidential plumbing and HVAC contractors 18,354 2,277 12% 13.52% $87,230
333411 Air Purification Equipment Manufacturing 127 (50) -39% 0.09% $58,189
333412 Industrial and Commercial Fan and Blower Manufacturing 43 (22) -50% 0.03% $84,492
333414 Heating Equipment (except Warm Air Furnaces) Mfg. 546 (135) -25% 0.40% $109,098
333415 Air-Conditioning and Warm Air Heating Equipment and Com-mercial and Industrial Refrigeration Equipment Mfg. 858 59 7% 0.63% $88,867
335314 Relay and Industrial Control Manufacturing 887 28 3% 0.65% $98,340
541310 Architectural Services 14,063 1,524 11% 10.36% $79,277
541330 Engineering Services 48,222 4,349 9% 35.51% $103,234
541340 Drafting Services 1,979 (220) -11% 1.46% $25,278
541350 Building Inspection Services 1,776 284 16% 1.31% $60,738
TOTAL 135,799 8,908 6.6%
Table 1.3: Sources of Regional Job Change, 2006–2011
NAICS CODE DESCRIPTION
JOB CHANGE DUE TO NATIONAL GROWTH
EFFECT
JOB CHANGE DUE TO INDUSTRIAL MIX
EFFECT
JOB CHANGE DUE TO REGIONAL COMPETI-
TIVENESS EFFECT
541330 Engineering Services (259) 351 (2399)
236220 Commercial and Institutional Building Construction (148) (4911) (366)
238212 Nonresidential electrical contractors (142) (3347) (998)
238222 Nonresidential plumbing and HVAC contractors (100) (1668) 686
541310 Architectural Services (84) (3072) 764
236210 Industrial Building Construction (19) (431) (936)
541340 Drafting Services (13) (481) (69)
541350 Building Inspection Services (8) 86 156
335314 Relay and Industrial Control Manufacturing (4) (16) 216
333415 Air-Conditioning & Warm Air Heating Equipment and Commercial & Industrial Refrigeration Equipment Mfg. (4) (122) 270
333414 Heating Equipment (except Warm Air Furnaces) Mfg. (1) (39) 331
333411 Air Purification Equipment Manufacturing (1) (8) (31)
333412 Industrial and Commercial Fan and Blower Mfg. (0) (5) (16)

AN ANALYSiS OF KEY OCCUPATiONS & EDUCATiON PROGRAMS SUPPORTiNG ENERGY EFFiCiENCY iNDUSTRiES 4
of the architectural service industry as a whole. But because of its local strength, the region was able to keep 764 jobs that would have been lost as a result of the other two forces.
ExportsAn export-based economy enriches regions by bringing in outside wealth to stimulate growth. In the pg&e service area, engineering services dominates the other industries in the group with over $5 billion in ex-ports—almost four times the amount as the nearest industry, and 65% of the total exports. The second largest industry is architectural services. Together, these top two industries account for over 80% of all exports. Their strong exports bring new resources into the region and increase the region’s economic growth.
Skilled WorkersThe key industries reviewed in this analysis gener-ally require a skilled workforce.2 The three industries with the highest percentage of skilled workers in their workforce were architectural services, nonresidential electrical contractors, and nonresidential plumbing and hvac contractors. These three industries provide 41% of the jobs across the region. Engineering services has only the seventh-highest percentage of skilled work-ers, but as it is the largest overall source of jobs in the group of key industries, its need for skilled workers is almost equal to that of the top three. The majority of jobs in these industries require well-trained workers.
Variations Across Counties From an industry perspective, pg&e’s service region is very indicative of the state. The characteristics of the 13 industries in the 19-county region matched closely with that of the 13 industries statewide. However, variations do exist. In most individual counties as well as the pg&e service region, engineering services is the strongest performing industry. It contributes the most jobs (49%), has the highest industry average wage ($36.68 per hour), and the largest volume of exports. The only 2 Skilled workers are defined as those in occupations that O*NET places
in Job Zone 3 or higher. The job zones, levels 1–5, rate the level of skills required to complete the tasks common to the occupation.
Table 1.4: Exports by Industry
NAICS CODE DESCRIPTION
EXPORTS (K)
541330 Engineering Services $5,533,687
541310 Architectural Services $1,389,242
236220 Commercial and Institutional Building Construction $460,682
238212 Nonresidential electrical contractors $340,164
238222 Nonresidential plumbing and HVAC contractors $290,605
541350 Building Inspection Services $153,695
333415Air-Conditioning & Warm Air Heating Equipment and Commercial & Industrial Refrigeration Equipment Mfg.
$102,532
333414 Heating Equipment (except Warm Air Furnaces) Manufacturing $84,414
335314 Relay and Industrial Control Mfg. $73,700
541340 Drafting Services $70,257
236210 Industrial Building Construction $47,413
333411 Air Purification Equipment Mfg. $5,850
333412 Industrial and Commercial Fan and Blower Manufacturing $2,933
Table 1.5: Percentage of Skilled Workers Employed in Industries
NAICS CODE DESCRIPTION
2011 JOBS
% SKILLED WORKERS IN
INDUSTRY
541310 Architectural Services 14,063 75%
238212 Nonresidential electrical contractors 23,147 73%
238222 Nonresidential plumbing and HVAC contractors 18,354 62%
236220 Commercial and Institutional Building Construction 23,464 53%
236210 Industrial Building Construc-tion 2,333 53%
541340 Drafting Services 1,979 49%
541350 Building Inspection Services 1,776 48%
541330 Engineering Services 48,222 47%
335314 Relay and Industrial Control Manufacturing 887 21%
333411 Air Purification Equipment Manufacturing 127 15%
333414 Heating Equipment (except Warm Air Furnaces) Mfg. 546 15%
333415
Air-Conditioning & Warm Air Heating Equipment and Commercial & Industrial Re-frigeration Equipment Mfg.
858 15%
333412 Industrial and Commercial Fan and Blower Mfg. 43 14%

5 CALiFORNiA ENERGY EFFiCiENCY SECTOR ALiGNMENT
county where engineering services is not an extremely large component of the industries’ regional effects was El Dorado County. Overall, the industries contribute 135,799 jobs to the region’s economy. More than 95% of jobs are found in five industries—engineering services, commercial and institutional building construction, nonresidential electrical contractors, nonresidential plumbing and hvac contractors, and architectural services. As il-lustrated in Table 1.6, four of the 19 counties produce the majority of the jobs and seven counties produce over 75% of the jobs. Across all 19 counties, the growth in building in-spection services is expected to be 13%. In Contra Costa and San Francisco, however, job growth in this industry is expected to be 24% and 42%, respectively, roughly two and three times the region’s projected percentage growth. From a job growth standpoint, Kern County stands out, as it gained jobs in the sector between 2006 and
2011, and also has a projected job growth increase of 25%. Half of that job growth in Kern County will oc-cur in engineering services. Sacramento, Alameda, and Santa Clara Counties are also projected to add over 1,000 jobs in these industries over the next five years. Only Alameda, Santa Clara, Sacramento, and Kern Counties are expected to overcome the job losses from the recent economic downturn by 2016. Yolo, Solano, and Marin Counties are all projected to experience additional jobs losses from 2011 to 2016.
Figure 1.1: Employment and Projections – Top 5 Industries
INDUSTRY EMPLOYMENT
INDUSTRY EMPLOYMENT PROJECTION
N
Table 1.6: Job Growth by County
COUNTY 2011 JOBS06–11 JOB
CHANGE11–16 JOB
CHANGE
Alameda 19,814 (352) 1,559
Contra Costa 11,208 (514) 383
El Dorado 2,222 (507) 306
Fresno 5,229 (1,325) 572
Kern 7,418 384 1,828
Marin 2,647 (437) (293)
Merced 588 (192) 81
Napa 1,224 (353) 248
Placer 3,750 (1,182) 342
Sacramento 15,111 (772) 1,681
San Francisco 15,526 (3,868) 244
San Joaquin 2,646 (1,542) 213
San Mateo 8,275 (1,032) (341)
Santa Clara 26,728 (915) 1,015
Santa Cruz 1,955 (305) 146
Solano 2,235 (895) (53)
Sonoma 4,685 (818) 558
Stanislaus 2,887 (907) 428
Yolo 1,649 (1,302) (11)
TOTAL 135,799 (16,385) 8,905

AN ANALYSiS OF KEY OCCUPATiONS & EDUCATiON PROGRAMS SUPPORTiNG ENERGY EFFiCiENCY iNDUSTRiES 6
C H A P T E R 2 :
EDUCATIONAL GAP ANALYSIS
In order to have a strong workforce a region should have the proper educational structure in place to pro-vide the necessary training for workers to succeed. A gap analysis highlights the areas where the educational system is either producing too many or too few trained graduates for the staffing needs of local employers. The two main metrics used in the production of an educational gap analysis are average annual job open-ings and 2010 program completers. These are used to represent occupational demand and workforce supply. “Annual openings” refer to the number of job openings that will be available to workers in the geographic area within a one-year time period. The measure includes the projected numbers of new and replacement jobs in an occupation. New jobs are entirely new positions that will become available due to economic growth, and replacement jobs are positions that become available due to events such as retirement, firings, out-migration, and other events. “Program completers,” or graduates, refer to the number of individuals within the geographic area who completed programs that train workers to enter the occupational group being analyzed. Since average annual openings and 2010 completers are used as representative measurements of supply and demand, the difference between the two metrics represents the anticipated training gap or surplus of workers for each program. The key figure labeled “Gap/Surplus” is either a deficit or an oversupply of trained workers. A shortage of trained workers shows up as a negative number, indicating that the number of
completers produced in the latest academic year is not sufficient to meet the needs of the regional economy. Further information on methodology can be found in Appendix B. There are, however, additional issues to keep in mind when examining the data. California has a vast, multi-level education system which serves the entire state. The University of California system in particular draws students from across the nation and around the world, as does Stanford University. It is highly likely that not all graduates stay within the region, the state, or even the nation. Consequently, surpluses within a county or even the pg&e service area may be smaller than they appear, while shortages could be larger than the data indicate. A second issue has the opposite effect. Due to the recent recession, California has a larger-than-usual number of people looking for work, and these unem-ployed workers compete for the annual openings in their field along with new graduates. Where there is a surplus, the unemployed will make that surplus even larger, while where there is a shortage they will help to fill the gap. While the data are not available to quantify these effects, they are still important considerations to keep in mind. A third issue that arises is that of apprenticeships. The graduate numbers in this analysis come from the U.S. Department of Education’s Integrated Postsecond-ary Education Data System, which does not include formal apprenticeship programs. However, data pro-vided by the U.S. Department of Labor3 show that this does not have an overly large impact on California. The largest apprenticeship programs in the state in 2010 were for electricians (1,015) and plumbers (286). Table 2.1 displays the shortages and surpluses in each program area in the 19-county pg&e service area. Most differences are under 4% of the total job numbers in those occupations, indicating that large shortages and surpluses do not currently exist. Within the region, graduates tend to come from a handful of counties: Santa Clara (Stanford Univer-sity, San Jose State University), Alameda (UC Berke-ley), San Francisco (UC San Francisco, San Francisco
3 Registered Apprenticeship Partners Information Management Data System (RAPIDS), 2010.

7 CALiFORNiA ENERGY EFFiCiENCY SECTOR ALiGNMENT
State), Sacramento (25 institutions), and Yolo (UC Davis). Demand also tends to be centered in those counties, reflecting the need for workers in the Silicon Valley area and the state capital. Some of the largest shortages in the region appear to exist in the sales and marketing and administrative service program areas. However, in these cases the data may not accurately reflect what is happening on the
ground. Demand may be being met by outside sources. In sales and marketing, the data show that not even 10% of the annual openings are filled by graduates in relevant educational programs. This suggests that graduates in other majors may be meeting employers’ demand. A similar issue may be present in administra-tive services, or these jobs may be taken by workers with no higher education, as many positions require
Table 2.1: Shortages and Surpluses in the PG&E Service Area
PROGRAM AREA TOTAL JOBSTOTAL NEW
GROWTH
MEDIAN HOURLY
WAGETOTAL
OPENINGSTOTAL
GRADSGAP/
SURPLUS
Sales & Marketing 222,171 (5,358) $29.51 8,206 797 (7,409)
Computer Science 234,423 19,732 $44.06 9,948 2,789 (7,159)
Administrative Services 261,693 (11,034) $20.61 6,363 782 (5,581)
Accounting and Finance 149,811 7,174 $33.16 5,846 1,520 (4,326)
Public Relations/ Advertising 25,097 1,602 $30.03 1,154 226 (928)
General Construction 57,531 (8,253) $25.25 1,150 306 (844)
Human Resources 27,053 834 $35.81 1,119 452 (667)
Industrial Mechanics 11,247 (600) $22.34 515 0 (515)
Carpentry 32,700 (14,505) $26.52 607 130 (477)
Electronics Repair Technician 23,017 (4,554) $21.34 622 150 (472)
Machinists 13,570 (2,295) $17.93 448 119 (329)
Plumbing 12,302 (3,107) $27.71 353 63 (290)
Quality Control 9,708 (1,185) $16.56 221 2 (219)
Electricians 19,255 (4,776) $28.23 668 520 (148)
Environmental Health Engineering 3,785 63 $45.14 148 18 (130)
Electrical Engineering Technicians 8,325 (1,268) $25.34 237 149 (88)
Electromechanical Technology 3,897 (403) $21.60 118 45 (73)
Civil Engineering Technology 2,502 (96) $30.32 79 37 (42)
Environmental Engineering Technology 754 16 $24.52 28 0 (28)
Industrial Engineering 14,384 (212) $39.68 561 547 (14)
Aerospace Engineering Technology 242 (5) $28.94 10 0 (10)
Mechanical Engineering Technology 898 (66) $26.41 29 75 46
Urban Development 3,369 (14) $38.42 99 180 81
Architecture 9,186 (1,248) $29.14 273 375 102
General Engineering 4,694 (27) $45.04 163 340 177
Interior Design 3,783 (331) $19.12 188 470 282
Mechanical Engineering 18,851 (2,545) $44.03 648 1,018 370
Civil Engineering 19,548 (812) $45.21 565 1,040 475
Electrical Engineering 24,407 (2,369) $50.41 766 1,453 687
Energy/ HVAC Technology 8,553 (1,366) $25.59 200 1,347 1,147
Business Management 338,130 11,584 $35.21 13,757 15,053 1,296
TOTAL 1,564,884 (25,426) $32.10 55,088 30,003 (25,085)

AN ANALYSiS OF KEY OCCUPATiONS & EDUCATiON PROGRAMS SUPPORTiNG ENERGY EFFiCiENCY iNDUSTRiES 8
only short-term on-the-job training. Consequently, the shortages in these occupations are most likely not as severe as the data could imply at first glance. As Illustrated in Figure 2.1, the region’s architecture graduates come mainly from Alameda County and UC Berkeley. Job openings are centered in the South Bay area, in San Francisco, Santa Clara, and Alameda Counties. Demand in the remaining counties is mostly met by the supply of graduates. Most of the occupational groups in this analysis have experienced job losses in the last five years, likely in large part due to the recent recession. Those that have grown are mostly in the business realm: business management, accounting and finance, public relations and advertising, and human resources. Business man-agement has the largest job numbers, annual open-ings, number of graduates, and surplus in the region, indicating that supply has more than kept up with growth in demand. Accounting and finance, on the
other hand, has a shortage of over 4,000 graduates a year, leaving every county looking for workers. The public relations and advertising and human resources program areas have smaller shortages, but depend on a few programs to supply the region. San Jose State University is the main source of graduates in public relations and advertising, while San Francisco and Fresno Counties supply 88% of the region’s human resources graduates. Figure 2.2 displays the supply and demand for car-penters in the pg&e Service area. Sacramento County is the largest source of graduates in the region. Fifteen of the 19 counties have no graduates, meaning that training needs are not being met locally. Consequently, most counties show a slight shortage, with the region as a whole coming up 477 carpenters short each year. This is about 1.5% of the carpentry workforce in the region. The supply and demand for civil engineers in the region is detailed in Figure 2.3. The supply for this oc-
Figure 2.1: Architect – Annual Job Openings and Supply of Graduates
Figure 2.2: Carpenter – Annual Job Openings and Supply of Graduates
ARCHITECT DEMAND
CARPENTER DEMAND
ARCHITECT SUPPLY
CARPENTER SUPPLY
N N

9 CALiFORNiA ENERGY EFFiCiENCY SECTOR ALiGNMENT
cupation is driven by educational centers in Alameda, Santa Clara, and Yolo counties. Thirteen of the region’s counties have zero graduates. A slight surplus of electrical engineering graduates exists in the region. Santa Clara and Alameda Counties are the main souce of these graduates and also have the highest number of job openings. Electrical engineers are the highest-paid occupation in the region in this analysis, earning on average $50.41 an hour. The region also has a surplus of graduates in hvac technology. Fresno County appears to be the main educational center for this occupation, supplying 41% of the graduates. Another 25% come from Alameda County. While Santa Clara County still boasts the highest number of annual openings, in general coun-ties do not have a large number of positions available. This occupation can include those who install and maintain solar panels, though electricians can fill that task as well.
Figure 2.4 illustrates the supply and demand for electricians in the pg&e service area. Alameda and Santa Clara Counties supply 90% of the graduates in this occupation. While the region shows a very small shortage, the addition of some of the state’s 1,015 ap-prenticeships in this occupation would most likely create a slight surplus of qualified workers. The region’s supply and demand for plumbers is displayed in Figure 2.5. A very slight shortage exists across the 19 counties. The largest demand comes from San Mateo County, followed by the usual Alameda and Santa Clara Counties. Only four counties produced graduates in 2010, with Alameda County making up half of the supply numbers. The state also had 238 ap-prentices in plumbing, which would narrow the gap further. Overall, the region’s educational centers are gen-erally meeting the needs of regional employers for trained workers. If any problem areas do exist, they
Figure 2.3: Civil Engineering – Annual Job Openings and Supply of Graduates
Figure 2.4: Electrician – Annual Job Openings and Supply of Graduates
CIVIL ENGINEERING DEMAND
ELECTRICIAN DEMAND
CIVIL ENGINEERING SUPPLY
ELECTRICIAN SUPPLY
N N

AN ANALYSiS OF KEY OCCUPATiONS & EDUCATiON PROGRAMS SUPPORTiNG ENERGY EFFiCiENCY iNDUSTRiES 10
are slight shortages of graduates in computer science and accounting and finance. However, the fact of the matter is that much of the region’s training needs are not being met locally, but depend on a handful of key programs at educational hubs in the region. While it is an asset to have such strong educational centers, such a centralized system could potentially limit access to workers in more rural areas who want to enhance their training. Those pursuing a four-year degree may be willing to relocate, but for workers interested in maintaining their current position while earning an advanced certificate, having to commute to a program three counties away may be too difficult. Considering that roughly 30% of those employed in the key occupations in the Energy Efficiency sector in the pg&e service area have two-year degrees, it may be useful to investigate whether this centralized system is fully serving occupations that require associate and certificate-level training.
Figure 2.5: Architect – Annual Job Openings and Supply of Graduates
ARCHITECT DEMAND
ARCHITECT SUPPLY
N

11 CALiFORNiA ENERGY EFFiCiENCY SECTOR ALiGNMENT
C H A P T E R 3 : OCCUPATION
ANALYSIS
Development of the Energy Efficiency sector will be driven not only by demand and regional competitive advantages but also by a strong supply of talented workers. The employees needed to sustain this sector come from a variety of fields—from construction and installation to sales and public relations. The cutting-
edge and highly technical nature of this sector requires more employees with business and scientific back-grounds than workers in the traditional energy sector. This chapter focuses on the occupations that are critical to the Energy Efficiency sector. This list of 67 occupations was developed by Workforce Incubator for pg&e, and is organized into 10 categories according to each occupation’s type of business and the main duties of its workers. Specific goals in this chapter are to (1) quantify the critical Energy Efficiency workers in the pg&e service area, including those working in energy and those working in other industries; (2) report employment changes among these occupations over the past five years, and project employment over the next five years; (3) indicate which special knowledge, skills, and abilities the critical Energy Efficiency work-ers need; (4) display potential career pathways within the Energy Efficiency sector; and (5) explore career transition opportunities from declining occupations and industries into the Energy Efficiency Sector.
Table 3.1: Summary of Critical Energy Efficiency Skill Groups Across All Industries
CATEGORY 2006 JOBS 2011 JOBS 2016 JOBS06–’11
CHANGE06–’11 % CHANGE
11–’16 CHANGE
11–’16 % CHANGE
PROJECTED ANNUAL
OPENINGS
CURRENT HOURLY
EARNINGS
Energy Assessment 253,236 250,590 266,429 (2,646) (1%) 15,839 6% 8,746 $37.39
Technician & Installation Workers 212,616 187,701 189,163 (24,915) (12%) 1,462 1% 4,756 $20.91
Sales, Marketing, Program Mgt. 191,358 179,860 190,715 (11,498) (6%) 10,855 6% 7,068 $31.10
Construction 208,897 157,820 164,649 (51,077) (24%) 6,829 4% 4,246 $28.96
Operations & Supply Chain 128,204 137,054 148,253 8,850 7% 11,199 8% 5,808 $24.78
Engineering 100,657 96,415 99,085 (4,242) (4%) 2,670 3% 3,116 $48.57
Finance & Accounting 82,127 91,318 101,188 9,191 11% 9,870 11% 3,547 $28.38
Information Technology 65,065 69,866 78,240 4,801 7% 8,374 12% 3,168 $32.21
Building Design 21,388 19,757 21,160 (1,631) (8%) 1,403 7% 734 $27.53
Human Resources & Training 8,404 8,768 9,627 364 4% 859 10% 396 $33.82
Total 1,241,671 1,174,062 1,242,028 (67,609) (5%) 67,966 6% 41,092 $31.04
Note: Grand total does not equal the sum of all rows because some occupations are present in multiple categories

AN ANALYSiS OF KEY OCCUPATiONS & EDUCATiON PROGRAMS SUPPORTiNG ENERGY EFFiCiENCY iNDUSTRiES 12
Energy Efficient Occupational Employment Across All IndustriesThis section focuses on the overall employment of these occupations across all 1,019 naics codes, while the following section focuses on the employment for these occupations just within the 13 naics codes that compose the Energy Efficiency sector in this analysis. Starting with the overall employment data for these key occupations across all 1,019 naics codes first pro-vides an overview of how these occupations have fared recently, and how they are projected to change, outside of the energy efficiency context. This is important because some occupations may be declining on the whole, but increasing within the energy industry, or vice versa. These macro-level changes may indicate career transition options from industries or occupa-
tions that are declining into areas that are growing. A summary that includes recent employment change, projected employment, projected annual open-ings and current annual earnings in all industries for the Energy Efficiency occupation groups is shown in Table 3.1. Detailed data for each occupational group are shown in Appendix D. There are several points to note about these data. First, six of the 10 skill groups experienced a net de-cline in employment between 2006 and 2011. In total more than 67,000 jobs, or 5%, were lost in these cat-egories. Those workers who are still unemployed as a result of the recession may be targeted for recruitment into the Energy Efficiency sector. Second, the average wages of critical jobs in the Energy Efficiency sector industries are 40% higher than in the same occupations
Figure 3.1: Energy Efficiency
Employment Change 2006–2011
Figure 3.2: Energy Efficiency Employment Change 2011–2016

13 CALiFORNiA ENERGY EFFiCiENCY SECTOR ALiGNMENT
in other industries. This indicates that there is strong potential to draw workers in from lower-paying oc-cupations. Third, the meager overall projected growth rates within several key skill groups, such as construc-tion (4%) and engineering (3%), mean that there will be many skilled workers from these categories who may be available to work in other industries.
County-by-County Occupational AnalysisTable 3.2 and the following maps display how employ-ment among all of the critical Energy Efficiency oc-cupations has changed in each of the region’s counties between 2006 and 2011, as well as how it is projected to change between 2011 and 2016. Figure 3.1 and Table 3.2 highlight the counties that are likely to have the high-est number of people looking for work in these fields. The recession took its toll on Energy Efficiency oc-cupations within the region, with some counties more
heavily affected than others. Three of the counties with the largest population—Alameda, Sacramento and Contra Costa—all lost significant amounts of workers. Conversely, Santa Clara, the most populous county in the region, contracted by only 1% among criti-cal Energy Efficiency occupations. Looking forward, however, projections are optimistic for most counties within the area, particularly for the Bay Area counties. Occupational growth of the top engineering oc-cupations is projected to occur predominately in Sac-ramento and Kern Counties, whereas Santa Clara County is anticipated to lose a small fraction of its current large supply of engineers. Employment for architects, which declined sharply during the reces-sion, is projected to increase within nearly all counties in the region. The changes in these occupations are illustrated in Figures 3.3 and 3.4.
Table 3.2: Total Energy Efficiency Employment and Employment Change by County
COUNTY NAME 2006 JOBS 2011 JOBS 2016 JOBS06–’11
CHANGE06–’11 % CHANGE
11–’16 CHANGE
11–’16 % CHANGE
Alameda 171,068 157,912 165,857 (13,156) (8%) 7,945 5%
Contra Costa 87,945 79,464 83,118 (8,481) (10%) 3,654 5%
El Dorado 16,006 14,533 16,431 (1,473) (9%) 1,898 13%
Fresno 55,846 50,389 53,575 (5,457) (10%) 3,186 6%
Kern 45,412 45,153 49,433 (259) (1%) 4,280 9%
Marin 30,058 29,096 31,106 (962) (3%) 2,010 7%
Merced 10,016 9,003 9,650 (1,013) (10%) 647 7%
Napa 13,566 12,309 13,518 (1,257) (9%) 1,209 10%
Placer 32,294 28,031 31,077 (4,263) (13%) 3,046 11%
Sacramento 134,423 121,059 128,504 (13,364) (10%) 7,445 6%
San Francisco 120,580 124,627 132,860 4,047 3% 8,233 7%
San Joaquin 35,623 31,348 33,329 (4,275) (12%) 1,981 6%
San Mateo 87,069 85,442 90,528 (1,627) (2%) 5,086 6%
Santa Clara 260,853 257,894 266,073 (2,959) (1%) 8,179 3%
Santa Cruz 21,261 19,918 20,718 (1,343) (6%) 800 4%
Solano 26,058 22,387 25,430 (3,671) (14%) 3,043 14%
Sonoma 46,355 43,161 45,523 (3,194) (7%) 2,362 5%
Stanislaus 28,089 24,507 26,070 (3,582) (13%) 1,563 6%
Yolo 19,150 17,829 19,230 (1,321) (7%) 1,401 8%
Total 1241671 1174062 1242028 (67,609) (5%) 67,966 6%

AN ANALYSiS OF KEY OCCUPATiONS & EDUCATiON PROGRAMS SUPPORTiNG ENERGY EFFiCiENCY iNDUSTRiES 14
Occupational Employment within the Energy Efficiency Sector
The previous section provided an outline of how em-ployment is changing for the critical Energy Efficiency occupations in all industries across the region. This section focuses on the employment opportunities for the critical occupations just within the 13 industries in the Energy Efficiency sector. Examining employment just within the sector can provide guidance by showing which occupational types make up the largest propor-tion of jobs in the Energy Efficiency sector, revealing the “niche” positions that could be harder to staff, and indicating the number of annual openings expected to be available in each skill category and occupation within the sector. In addition, it highlights the number of workers from the same occupational classifications who are currently working in other industries but
Figure 3.3: County-by-County Employment & Projections for Top 5 Engineering Occupations
Figure 3.4: County-by-County Employment & Projections for Architects
ENGINEERING 5-YEAR EMPLOYMENT PROJECTION
ARCHITECT 5-YEAR EMPLOYMENT PROJECTION
N N
ENGINEERING 2001 EMPLOYMENT
ARCHITECT 2001 EMPLOYMENT
Table 3.3: Energy Efficiency Occupations within the Energy Efficiency Sector by Skill Category
CATEGORY
2011 INDUSTRY
JOBS
ANNUAL OPENINGS IN
INDUSTRY
% OF TOTAL KEY OCCUPATIONS
IN INDUSTRY
Construction 35,858 1,010 44%
Engineering 18,969 607 23%
Building Design 8,447 269 10%
Energy Assessment 3,942 136 5%
Technician & Instal-lation Workers 7,632 204 9%
Operations & Sup-ply Chain 3,239 140 4%
Sales, Marketing, Program Mgt. 1,152 42 1%
Finance & Acctg. 936 34 1%
Information Tech. 844 37 1%
Human Resources & Training 55 3 0%
Grand Total 81,074 2,699 n/a
Note: Grand total does not equal the sum of all rows because some occupations are present in multiple categories

15 CALiFORNiA ENERGY EFFiCiENCY SECTOR ALiGNMENT
who could be targeted for positions in the Energy Efficiency sector. Two categories featured throughout this section require a bit more explanation. “Percentage of en-ergy efficiency sector” shows the proportion of total employment within the sector that is attributable to each skill category. For example, per Table 3.4, civil engineering makes up 7% of the jobs in the Energy Efficiency sector. This measurement is helpful for de-termining the occupations that make up the largest share of the sector. The “percentage of occupation” category shows the proportion of jobs within that occupation code that are staffed within the energy efficiency sector. Therefore, 23% of all construction jobs are found in the Energy Efficiency industries. This measurement is helpful for determining how saturated each occupation is within the Energy Efficiency sector. Some soc codes with relatively low employment can have a very high percentage of occupation, indicating that this occupation is particularly unique to the sector.
As Illustrated in Figure 3.5, construction and en-gineering make up the lion’s share of the key occupa-tions’ employment in the Energy Efficiency sector
Figure 3.5: Distribution of Jobs in the Energy Efficient Occupations in the Energy Efficiency Sector by Skill Group
Construction
Engineering
Building Design
Energy Assessment
Technician & Installation Workers
Operations & Supply Chain
Sales, Marketing, Program Mgmt.
Finance & Acconting
Information Technology
Human Resources & Training
44%
23%
11%
5%
9%
4%
1%
1%
0%
Note: This chart displays the breakdown of the 67 key occupations in the Energy Efficiency sector only. The industries do contain occupations outside of those in this analysis, which account for roughly 40% of the jobs in the sector overall.
Table 3.4: In-Sector Employment for Top 20 Occupations
SOC CODE DESCRIPTION
2011 INDUSTRY
JOBS
ANNUAL OPENINGS
IN INDUSTRY
% OF ENERGY EFFICIENCY
SECTOR% OF OC-
CUPATION SKILL CATEGORY
17-2051 Civil engineers 9,289 316 7% 52% Engineering
47-2111 Electricians 10,601 294 8% 46% Construction
17-1011 Architects, except landscape and naval 7,162 215 5% 76% Design
47-2152 Plumbers, pipefitters, and steamfitters 5,985 132 4% 35% Construction
11-9199 Managers, all other 2,375 109 2% 2% Operations
47-1011 First-line supervisors/managers of construc-tion trades and extraction workers 4,920 94 4% 18% Construction
47-2031 Carpenters 6,800 82 5% 13% Construction
11-1021 General and operations managers 2,521 81 2% 3% Energy Assessment
11-9021 Construction managers 4,067 73 3% 17% Energy Assessment
17-2199 Engineers, all other 2,297 64 2% 17% Engineering
17-2141 Mechanical engineers 1,881 60 1% 22% Engineering
49-9021 Heating, air conditioning, and refrigeration mechanics and installers 1,982 59 1% 27% Tech & Install
11-9041 Engineering managers 2,277 59 2% 16% Engineering
47-4011 Construction and building inspectors 1,581 46 1% 33% Construction
47-2211 Sheet metal workers 1,721 45 1% 31% Tech & Install
13-1051 Cost estimators 1,785 42 1% 19% Construction
17-2071 Electrical engineers 1,489 42 1% 17% Engineering
11-9021 Construction managers 4,067 41 3% 17% Construction
13-2011 Accountants and auditors 893 32 1% 1% Finance
13-1199 Business operation specialists, all other 853 29 1% 1% Energy Assessment

AN ANALYSiS OF KEY OCCUPATiONS & EDUCATiON PROGRAMS SUPPORTiNG ENERGY EFFiCiENCY iNDUSTRiES 16
(44% and 23%, respectively). These occupations are also widely employed across all industries, which means there are vast opportunities to recruit trained workers from businesses outside the Energy Efficiency sector. In total, there are projected to be 2,699 annual openings in the Energy Efficiency sector for critical Energy Efficiency occupations. This includes a blend of hands-on jobs (such as those in construction) and white-color jobs (such as those in engineering and building design). A high proportion of building design workers are employed within the Energy Efficiency sector (43%). Developing talent for these high in-sector positions will depend more on postsecondary education and training within the Energy Efficiency sector than on drawing workers from other industries. Skill categories such as information technology and human resources and training, on the other hand, are far more prevalent in other industries, which means the potential for recruitment from less thriving industries is strong. Table 3.4 shows that the greatest talent needs for the sector in coming years will be predominately for engineers, high-level managers, and skilled crafts-men such as plumbers and electricians.
Demographic Characteristics of Key Occupations in the Energy Efficiency SectorThis section highlights some of the educational and demographic characteristics of workers in the En-ergy Efficiency sector. It will discuss key issues facing the critical occupations in aggregate, as well as some unique to a few of the particular occupations. Detailed data on each occupation are contained in Appendix D. One of the greatest challenges of the energy in-dustry in coming years will be filling the void left by workers from the baby-boomer generation who are soon to retire. In total, more than half of workers in the critical Energy Efficiency occupations are 54 or older. The proportions are higher among management and maintenance positions. A second workforce issue is that the energy indus-try is predominately composed of men. Among the critical Energy Efficiency occupations, 71% of workers are male. This means that a large portion of the nation’s workforce is potentially underutilized by businesses
Figure 3.6: Distribution of Critical Energy Efficiency Workers by Age Group (thousands)
14–18
19–21
22–24
25–34
35–44
45–54
55–64
65–99
4
10
23
227
313
339
200
58
.3%
.9%
2.0%
19.3%
26.6%
28.9%
17.0%
4.9%
Table 3.5: Top Five Occupations with Highest Proportion of Workers Under 45
SOC TITLE% UNDER
45NUMBER
UNDER 45
43-4051 Customer service representa-tives 69% 44,679
13-1199 Business operation specialists, all other 52% 35,880
47-2031 Carpenters 62% 31,520
15-1081 Network systems and data communications analysts 77% 19,892
15-1041 Computer support specialists 65% 16,955
Table 3.6: Top Five Occupations with Highest Proportion of Workers Over 45
SOC TITLE% OVER
45NUMBER OVER 45
11-9199 Managers, all other 63% 59,914
11-1021 General and operations managers 54% 46,899
13-1111 Management analysts 65% 45,207
13-2011 Accountants and auditors 54% 37,281
49-9042 Maintenance and repair workers, general 59% 27,274
Figure 3.7: Distribution of Critical Energy Efficiency Workers by Gender
29%
71%
Female
Male

17 CALiFORNiA ENERGY EFFiCiENCY SECTOR ALiGNMENT
in these industries. Some occupations in the group buck these trends by having a have a relatively young workforce, such as carpenters. Others have a higher proportion of women than men, such as business operation specialists. Middle-skill jobs compose a large component of the employment opportunities in the Energy Efficiency sector. Roughly 30% of all jobs in this group require an associate’s degree, which is drastically higher than the national average of 9%. However, there are also many
jobs in the Energy Efficiency sector that do not require college education. This could provide an opportunity for many workers who do not have college degrees to start at entry-level positions but work their way up to higher paying positions.
Critical Knowledge, Skills, and Abilities for Energy Efficiency Occupations
Determining the key knowledge, skills, and abilities (KSAs) for an occupational group is an essential step in developing a successful pipeline of talent. These data can help pinpoint the KSAs most critical to each type of skill group so that businesses in the Energy Efficiency sector can (1) locate and recruit workers with such skills; (2) identify areas of focus when businesses are training employees for new positions; and (3) narrow their search for recruits to only those workers who are most compatible with the critical occupations. emsi used the o*net database to identify key competencies that are in demand in the critical en-ergy efficiency occupations. The o*net database is a source of occupational data and information developed by the U.S. Department of Labor’s Employment and Training Administration. The system provides both qualitative and quantitative descriptions of over 800 occupation classifications. Based on real-world data, the information is collected through ongoing surveys of an occupation’s worker population and occupation experts. As previously mentioned, the occupations have been classified according to skill groups. Bunching the occupations in this way allowed emsi to analyze the groups according to average group scores and percentile rankings. Two groups—construction and sales, marketing & program management—have been further sub-divided into two groups, according to the knowledge, skills, and ability profiles of those occupa-tions. Table 3.9 shows the KSAs that are most critical to each of the skill groups. The tables include both the
Figure 3.8: Distribution of Workers by Highest Level of Educational Attainment
Table 3.7: Top Five Occupations with Highest Proportion of Females
SOC TITLE
NUMBER OF FEMALE
WORKERS
% OF FEMALE
WORKERS
13-1199 Business operation special-ists, all other 43,351 62%
43-4051 Customer service represen-tatives 43,012 67%
13-2011 Accountants and auditors 41,309 60%
51-2022 Electrical and electronic equipment assemblers 5,483 54%
13-1073 Training and development specialists 5,291 70%
Table 3.8: Top Five Occupations with Highest Proportion of Males
SOC TITLE
NUMBER OF MALE
WORKERS
% OF MALE
WORKERS
11-9199 Managers, all other 68,931 72%
11-1021 General and operations managers 61,647 71%
47-2031 Carpenters 50,041 99%
13-1111 Management analysts 43,713 62%
49-9042 Maintenance and repair workers, general 43,451 94%
Less than high school diploma
High school diploma or equivalent
Some college, no degree
Associate’s degree
Bachelor’s degree
Master’s degree
21%
21%
9%
30%
11%
2%

AN ANALYSiS OF KEY OCCUPATiONS & EDUCATiON PROGRAMS SUPPORTiNG ENERGY EFFiCiENCY iNDUSTRiES 18
group average and the group average percentile rank-ing. Although o*net is a great source for quantifying KSAs, the numbers attached to each competency can at times seem abstract. It is difficult, for instance, to determine what a worker with a score of 90 in sales & marketing does more effectively than a worker with a score of 80. The group average percentile, on the other hand, simply shows the percentage of occupa-tions that scores equal to or lower than the group average. For instance, the engineering group has a 95 in engineering & technology, which means that they are more knowledgeable about such topics than 95% of all other types of occupations.4 More detailed data
4 This is different than saying that they are more knowledgeable than 95% of all workers. Since engineering makes up a relatively small proportion of the national workforce, they are probably in a higher percentile in terms of total workers.
are available in Appendix D. While engineering & technology and design are key knowledge areas for all construction occupations, they are more important for management construction occupations than building construction occupations. In fact, for the management construction group, workers are more knowledgeable in engineering & technology and design than 90% of all other types of occupations. But for the building construction group, installation figures much more prominently. In the engineering group, design and mathematics are the key knowledge areas (aside from engineering and technology), while computers & electronics are also at the top of the list. The occupations in this group also rank high in the systems analysis skill area as compared to all other occupations (in the 90th per-centile) and systems evaluation (80th percentile). For
Table 3.9: Top KSAs by Skill Group
SKILL GROUP KNOWLEDGEGROUP
AVG.
GROUP AVG. PER-
CENTILE SKILLSGROUP
AVG.
GROUP AVG. PER-
CENTILE ABILITIESGROUP
AVG.
GROUP AVG. PER-
CENTILE
Construction (Building)
BUILDING AND CONSTRUCTION 67 95 INSTALLATION 58 80
GROSS BODY EQUILIBRIUM 42 95
Construction (Management)
BUILDING AND CONSTRUCTION 73 99
SYSTEMS ANALYSIS 44 <70 NUMBER FACILITY 46 <70
EngineeringENGINEERING &
TECHNOLOGY 84 95SYSTEMS
ANALYSIS 60 90MATHEMATICAL
REASONING 58 90
Building Design DESIGN 79 95COMPLEX PROB-
LEM SOLVING 69 75 ORIGINALITY 61 90
Energy Assessment
ADMINISTRATION & MANAGEMENT 64 90
SYSTEMS EVALU-ATION 58 80
MATHEMATICAL REASONING 49 75
Technician & Installation
MECHANICAL 64 80 INSTALLATION 54 70 FINGER DEXTERITY 49 <70
Operations & Supply Chains
ECONOMICS AND ACCOUNTING 48 90
MGT. OF FINAN-CIAL RESOURCES 51 70
MATHEMATICAL REASONING 47 70
Sales, Market-ing, Program Mgt. (Admin.)
SALES AND MARKETING 78 99 NEGOTIATION 59 75
SPEECH RECOGNITION 58 85
Sales, Market-ing, Program Mgt. (Clerical)
CUSTOMER AND PERSONAL
SERVICE79 80
SERVICE ORIENTATION 61 <70
SPEECH RECOGNITION 62 95
Finance & Accounting
ECONOMICS AND ACCOUNTING 76 99
MANAGEMENT OF FINANCIAL
RESOURCES71 95 NUMBER FACILITY 63 95
Information Technology
TELE- COMMUNICATIONS 61 99 PROGRAMMING 47 95
INFORMATION ORDERING 56 75
Human Resources & Training
EDUCATION AND TRAINING 91 95
SYSTEMS EVALUATION 54 75 MEMORIZATION 45 80

19 CALiFORNiA ENERGY EFFiCiENCY SECTOR ALiGNMENT
the building design group, complex problem solving and originality are the top skill and ability areas. These occupations are also more knowledgeable in fine arts than 80% of all types of occupations. Administration & management, building & con-struction, and clerical knowledge are key KSAs for occupations in the energy assessment group. These workers also rank high in systems evaluation/analysis and management of financial resources. The most important knowledge areas for the tech-nician and installation group are mechanical and en-gineering and technology. Workers in this group are more skilled in repairing than 75% of all types of oc-cupations. For workers in the operations and supply chain group, the economics & accounting knowledge area figures prominently as compared to all other types of occupations (in the 90th percentile), while mathemat-ics is a key knowledge area for the occupation group itself.
Occupational TransitionsEnsuring sustainable growth for the Energy Efficiency sector requires finding talented workers to fill job openings. The career pathways strategy has succeeded for workforce developers and businesses that wish
to retain their best workers and encourage upward mobility within the industry sector and/or company. With this strategy the sector focuses on increasing the KSAs of its existing workers, rather than finding new employees outside the industry. The searching and retraining involved in outside recruitment can cost a company both time and money, whereas ensuring that employees are involved in a career pathway approach potentially reduces both types of costs. In this report, KSA data are displayed in radar charts, which display the top 15 KSAs for each group of oc-cupations. Knowledge competencies occupy the up-per right-hand areas of the radar chart, while skills are found in the lower right portion, and abilities on the left-hand portion. The shaded areas in the center indicate specific levels of competencies. Competen-cies are considered “intermediate” at a level measured between 25 and 50. Measurements greater than 50 are considered “advanced” competencies. Not all occupations from the group are contained in each radar chart. This is because not all of the criti-cal Energy Efficiency occupations have an apparent career pathway. This could be because the occupation is normally associated with a postsecondary program that trains precisely for that occupation, or it could be because the occupations that form the career pathway
Installation, Maintenance, and Repair Workers
Machinery Mechanics
Maintenance and Repair Workers
Managers of Mechanics, Inst.
MechanicalEngineering & Technology
Design
Mathematics
Education & Training
Equipment Maintenance
Installation
TroubleshootingRepairing
Operation Monitoring
Oral Comprehension
Visualization
Extent Flexibility
Information Ordering
Oral Expression 100
80
60
40
20
The top KSAs are detailed around
the edge.
The inner blue circle indicates a “Basic” level, the green ring an “Intermediate” level, the outer
ring an “Advanced” level
Each occupation has its own line connecting the points of the levels required for each KSA.
The light gray, dark gray & white sections group the top five knowledges, skills, and abilities, respectively.
Figure 3.9: EXAMPLE Radar Chart for Manufacturing Maintenance Specialists

AN ANALYSiS OF KEY OCCUPATiONS & EDUCATiON PROGRAMS SUPPORTiNG ENERGY EFFiCiENCY iNDUSTRiES 20
were not among the 67 selected for this analysis. Those that do display an apparent career pathway are high-lighted here via a radar chart and a table with labor market data pertaining to those occupations. Career pathway opportunities are apparent when a number of factors come together in just the right way. First, the occupations must share a similarity in required KSAs. Yet there should also be a noticeable disparity in certain competencies, which indicates that workers at the beginning of the pathway must increase their aptitude in certain categories in order to move forward on that career path. Second, the associated labor market data must indicate that the worker would
be advancing in earnings and educational/training level.5 Within the Energy Efficiency sector, multiple op-portunities exist to develop and advance the current workforce. Entry and mid-level positions (such as customer service representatives, team assemblers, and maintenance and repair workers) are a tremen-dous source for cultivating talent that already exists in-house.
5 In some cases the proceeding step on a career pathway does not offer both higher average earnings and a greater average educational level. Since the data are based on averages, they do not always ideally portray the advancing nature of the pathways.
Figure 3.10: Career Pathway Option for Customer Service and Sales Workers
Table 3.10: Labor Market Data for Customer Service and Sales Workers
43-4051 41-4012 11-2022
DATA CATEGORYCUSTOMER SERVICE
REPRESENTATIVES
SALES REPRESENTATIVES, WHOLESALE AND MFG.,
EXCEPT TECHNICAL AND SCIENTIFIC PRODUCTS SALES MANAGERS
In-Sector Annual Openings 6 9 4
Current Median Hourly Earnings $17.66 $27.90 $47.36
Average Educational Level MT OJT MT OJT Deg. + exp.
For workers to advance in the customer service and sales categories, they should be trained primarily in sales & marketing as well as negotiation and persuasion skills.
Customer service representatives
Sales representatives, wholesale and manufacturing, ex-cept technical and scientific products
Sales managers
Sales & MarketingAdministration & Management
Economics & Accounting
Customer & Personal Serv.
Communications & Media
Negotiation
Persuasion
Management of Financial ResourcesService Orientation
Mgt. of Personnel Resources
Speech Recognition
Fluency of Ideas
Originality
Speech Clarity
Written Expression 100
80
20
60
40

21 CALiFORNiA ENERGY EFFiCiENCY SECTOR ALiGNMENT
Figure 3.11: Career Pathway Option for Electrical Engineers
Figure 3.12: Career Pathway Option for Business Operations Workers
Table 3.11: Labor Market Data for Electrical Engineers Career Pathway
17-3023 17-2071 17-2072 11-9041
DATA CATEGORY
ELECTRICAL AND ELECTRONIC ENGINEER-
ING TECHNICIANSELECTRICAL ENGINEERS
ELECTRONICS ENGINEERS, EXCEPT
COMPUTERENGINEERING
MANAGERS
In-Sector Annual Openings 12 43 18 63
Current Median Hourly Earnings $28.04 $47.22 $47.60 $67.98
Average Educational Level Assoc. Bach. Bach. Deg. + exp.
Table 3.12: Labor Market Data for Business Operations Workers Career Pathway
43-4051 43-5061 13-1023 11-3061
DATA CATEGORYCUSTOMER SERVICE
REPRESENTATIVESPRODUCTION, PLANNING,
& EXPEDITING CLERKS
PURCHASING AGENTS, EXCEPT WHOLESALE, RE-TAIL, & FARM PRODUCTS
PURCHASING MANAGERS
In-Sector Annual Openings 6 7 13 3
Current Median Hourly Earnings $17.66 $23.11 $28.26 $46.30
Average Educational Level MT OJT ST OJT Exp. in field Deg. + exp.
The occupations in the electrical engineers group are marked by universally high KSAs in fields such as engineering and technology, design, and systems analysis. Progress in this career pathway is achieved mostly through advancement in business skills such as sales & marketing and economics & accounting (not shown in radar chart).
The greatest KSA gaps that hinder worker advancement in the business operations skill group are in categories such as accounting, management of material resources, and per-sonnel and human resource management.
Electrical and elctronic engineering technicians
Customer service representatives
Electronics engineers, except computer
Production, planning, and expediting clerks
Purchasing managers
Electrical engineersEngineering managers
Purchasing agents, except wholesale, retail, and farm products
Engineering & Technology
Sales & Marketing
Design
Administration & Management
Physics
Economics & Accounting
Mathematics
Customer & Personal Serv.
Production & Processing
Communications & Media
Negotiation
Negotiation
Systems Evaluation
Persuasion
Mathematics
Management of Financial Resources
Complex Problem Solving
Service Orientation
Judgment & Decision Making
Mgt. of Personnel Resources
Mathematical Reasoning
Speech Recognition
Deductive Reasoning
Fluency of Ideas
Written Comprehension
Originality
Information Ordering
Speech Clarity
Oral Comprehension
Written Expression 100
80
60
40
20
20
100
80
60
40
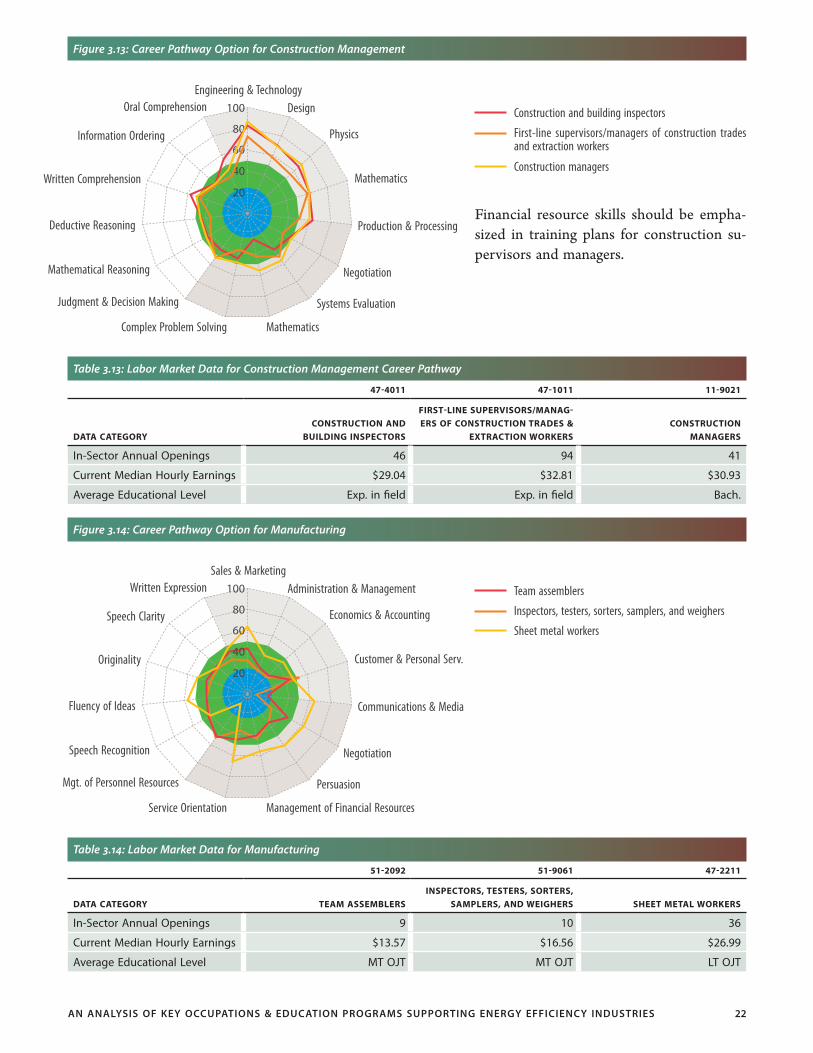
AN ANALYSiS OF KEY OCCUPATiONS & EDUCATiON PROGRAMS SUPPORTiNG ENERGY EFFiCiENCY iNDUSTRiES 22
Figure 3.13: Career Pathway Option for Construction Management
Figure 3.14: Career Pathway Option for Manufacturing
Table 3.13: Labor Market Data for Construction Management Career Pathway
47-4011 47-1011 11-9021
DATA CATEGORYCONSTRUCTION AND
BUILDING INSPECTORS
FIRST-LINE SUPERVISORS/MANAG-ERS OF CONSTRUCTION TRADES &
EXTRACTION WORKERSCONSTRUCTION
MANAGERS
In-Sector Annual Openings 46 94 41
Current Median Hourly Earnings $29.04 $32.81 $30.93
Average Educational Level Exp. in field Exp. in field Bach.
Table 3.14: Labor Market Data for Manufacturing
51-2092 51-9061 47-2211
DATA CATEGORY TEAM ASSEMBLERSINSPECTORS, TESTERS, SORTERS,
SAMPLERS, AND WEIGHERS SHEET METAL WORKERS
In-Sector Annual Openings 9 10 36
Current Median Hourly Earnings $13.57 $16.56 $26.99
Average Educational Level MT OJT MT OJT LT OJT
Financial resource skills should be empha-sized in training plans for construction su-pervisors and managers.
Construction and building inspectors
Team assemblers
First-line supervisors/managers of construction trades and extraction workers
Inspectors, testers, sorters, samplers, and weighers
Construction managers
Sheet metal workers
Engineering & Technology
Sales & Marketing
Design
Administration & Management
Physics
Economics & Accounting
Mathematics
Customer & Personal Serv.
Production & Processing
Communications & Media
Negotiation
Negotiation
Systems Evaluation
Persuasion
Mathematics
Management of Financial Resources
Complex Problem Solving
Service Orientation
Judgment & Decision Making
Mgt. of Personnel Resources
Mathematical Reasoning
Speech Recognition
Deductive Reasoning
Fluency of Ideas
Written Comprehension
Originality
Information Ordering
Speech Clarity
Oral Comprehension
Written Expression 100
80
20
20
100
80
60
40
60
40

23 CALiFORNiA ENERGY EFFiCiENCY SECTOR ALiGNMENT
Career Transitions from Outside of the Industry SectorFinding workers within the industry group is not always a feasible option, particularly in high-growth industries where companies’ demand for workers is sometimes far greater than supply. Additionally, the highly technical nature of some of the critical oc-cupations, such as engineers, designers, and business executives, can make career pathways very difficult to implement. In some cases, therefore, recruiting workers from other industries is the best option. As discussed in the section examining employment across all industries, drawing workers with the same occupational classification is usually the best option. The reasons for this are rather intuitive; a civil engi-neer who works in bridge construction is likely to have many of the same capabilities as a civil engineer who helps build energy infrastructure. It may become necessary to consider transitioning workers from other occupation types into the critical occupations. Table 3.16 displays 20 of the most compatible occu-pations with the critical Energy Efficiency occupations.
These have been selected based on high compatibility using emsi’s proprietary compatibility index, which compares the KSAs required in two different occu-pations.6 An ideal use of the compatibility index is to compare the KSAs required in an occupation that is declining in demand with the KSAs for an occupa-tion that is growing in demand. For this report, emsi considered non-energy sector occupations that would be compatible and be considered in decline; in other words, where workers would consider switching to a different sector. Each occupation on this list is either growing at a far slower than average rate or not dis-playing an adequate regional competitive advantage to retain all of its current workers.7
6 The compatibility index is based on the aptitude level and importance scores of each occupation. The index calculates the closest matches of each occupation against all other occupations in order to determine the best career transition matches.
7 The competitive effect category measures this factor. Negative competitive effects indicate that employment is contracting more rapidly than the national average, or that employment is not expanding as rapidly as the national average. In either case, the implication is that the region does not possess a competitive advantage for that occupation.
Figure 3.15: Career Pathway Option for Maintenance & Installation
Table 3.15: Labor Market Data for Maintenance & Installation
49-9042 49-9021 49-1011
DATA CATEGORYMAINTENANCE AND REPAIR
WORKERS, GENERAL
HEATING, AIR CONDITIONING, AND REFRIGERATION MECHANICS &
INSTALLERS
FIRST-LINE SUPERVISORS/ MANAGERS OF MECHANICS,
INSTALLERS, AND REPAIRERS
In-Sector Annual Openings 8 37 12
Current Median Hourly Earnings $19.00 $24.76 $32.49
Average Educational Level MT OJT LT OJT Exp. in field
Opportunities for advancement within the maintenance and installation group are abun-dant: mid-level maintenance workers can move from earning an average of $19.00 to an average of $32.00 by increasing their manage-ment skills and their knowledge of produc-tion and processing.
Maintenance and Repair Workers, General
Heating and Air Conditioning Mechanics and Installers
First-Line Supervisors/Managers of Mechanics, Installers, and Repairers
MechanicalEngineering & Technology
Design
Production & Processing
Building & Construction
Installation
Repairing
TroubleshootingEquipment Maintenance
Operation Monitoring
Finger Dexterity
Visualization
Manual Dexterity
Arm-Hand Steadiness
Control Precision
20
100
80
60
40

AN ANALYSiS OF KEY OCCUPATiONS & EDUCATiON PROGRAMS SUPPORTiNG ENERGY EFFiCiENCY iNDUSTRiES 24
The table does not indicate exactly which occupa-tion would be the best candidate for transitioning into, because most of the occupations on this list can transition into multiple occupations in that category. However, in most cases the ideal transition would be to an entry-level position within the skill group, unless the transitioning worker has management or technical experience. Based on the compatible occupations determined above, Table 3.17 lists the industries that have the high-est number of workers that are compatible with the key Energy Efficiency occupations. In order to focus primarily on workers who are most likely to make career transitions, this list has been limited to those industries that are either shrinking, or else growing too slowly to retain all its workers. Four of the most compatible industries are in the real estate sector. In total, this equates to more than 71,000 compatible jobs available in categories such as sales, operations, and finance. Many residential
contracting industries are still reeling from the hous-ing bust, and are projected to continue their struggle over the next five years. The three industries shown in Table 3.17 host more than 52,000 compatible jobs. These could be a key source of construction workers for the energy efficiency industry. Opportunities also exist to collect new employees for construction trades from agriculture and production positions. Occupa-tions like miscellaneous agricultural workers possess many of the same skills, but have seen a decline in their industry. Entry-level workers for the operations skills group can be found in largely declining occupational cat-egories such as computer operators and postmasters and mail superintendents. Meanwhile, the insurance industry hosts numerous occupations that could be transferred into the sales, marketing, and program management skills group, including insurance under-writers and brokerage clerks.
Table 3.16: Most Compatible Occupations for Career Transitions
SOC CODE DESCRIPTION GROUP
2011–2016 CHANGE % CHANGE
COMPETITIVE EFFECT
45-209A Miscellaneous agricultural workers Construction (2,575) (2%) (2,015)
51-1011 First-line supervisors/mgrs. of production & operating workers Construction (389) (2%) 35
43-9051 Mail clerks and mail machine operators, except postal service Tech & Install (375) (8%) (70)
43-9011 Computer operators Operations (355) (6%) 35
53-7063 Machine feeders and offbearers Tech & Install (305) (16%) (33)
13-2053 Insurance underwriters Sales (268) (8%) (245)
43-4011 Brokerage clerks Sales (157) (8%) (111)
43-4141 New accounts clerks Sales (103) (6%) (87)
43-9041 Insurance claims and policy processing clerks Sales (68) (1%) (259)
43-9022 Word processors and typists Sales (66) (1%) (84)
11-9131 Postmasters and mail superintendents Operations (39) (11%) (17)
53-1031 First-line supervisors/managers of transportation and material-moving machine and vehicle operators Operations (26) 0% 81
47-2071 Paving, surfacing, and tamping equipment operators Construction (9) 0% (97)
43-4131 Loan interviewers and clerks Sales 33 0% (235)
11-3071 Transportation, storage, and distribution managers Energy Assess. 39 1% (60)
47-2141 Painters, construction and maintenance Construction 65 0% (617)
11-3049 Human resources managers, all other HR 121 3% (40)
11-9051 Food service managers Energy Assess. 1,594 6% (1,621)
43-3031 Bookkeeping, accounting, and auditing clerks Finance 4,330 5% (601)

25 CALiFORNiA ENERGY EFFiCiENCY SECTOR ALiGNMENT
Table 3.17: Most Compatible Industries for Career Transitions
NAICS INDUSTRY
HIGHLY COM-PATIBLE JOBS IN INDUSTRY
INDUSTRY CHANGE
2011–20161
% OF COMPAT-IBLE JOBS IN
INDUSTRY CATEGORY
5312 Offices of Real Estate Agents and Brokers 30,824 (6,234) 25.0% Operations & Sales
5313 Activities Related to Real Estate 27,601 (4,191) 24.9% Operations
8111 Automotive Repair and Maintenance 23,395 (8,164) 50.5% Tech & Install
2383 Building Finishing Contractors 21,952 (37,151) 36.8% Construction
2389 Other Specialty Trade Contractors 16,395 (13,216) 39.2% Construction
2361 Residential Building Construction 14,176 (31,505) 25.3% Construction
5411 Legal Services 12,205 (2,688) 18.2% Sales
5241 Insurance Carriers 11,626 (14,632) 31.7% Sales & Operations
5412 Accounting, Tax Preparation, Bookkeeping, and Payroll Services 10,327 3,542 15.4% Finance
5311 Lessors of Real Estate 10,276 (2,774) 13.1% Sales
2381 Foundation, Structure, and Building Exterior Contrac-tors 9,697 (28,259) 27.9% Construction &
Tech. & Install
2382 Building Equipment Contractors 8,756 (18,115) 11.9% Construction & Tech. & Install
5221 Depository Credit Intermediation 7,583 (11,704) 12.7% Sales; Operations & Finance
8114 Personal & Household Goods Repair & Maintenance 6,808 (5,590) 36.7% Tech & Install
7211 Traveler Accommodation 5,901 (2,441) 9.2% Operations
5231 Securities and Commodity Contracts Intermediation and Brokerage 5,830 1,571 23.0% Finance
4921 Couriers and Express Delivery Services 5,249 (4,833) 22.4% Tech & Install
5511 Management of Companies and Enterprises 3,673 5,335 4.2% Finance & IT
5313 Activities Related to Real Estate 1,809 (4,191) 1.7% Finance
3341 Computer and Peripheral Equipment Manufacturing 1,607 4,205 3.2% IT

AN ANALYSiS OF KEY OCCUPATiONS & EDUCATiON PROGRAMS SUPPORTiNG ENERGY EFFiCiENCY iNDUSTRiES 26
A P P E N D I X A :
INDUSTRY METRIC
DEFINITIONS
Size and Historical Growth: Measures the past per-formance of an industry sector, identifies whether industries have been growing/declining/emerging, and determines the rate of change.
Future Growth Projection: Incorporates historical growth and performance with additional factors and expectations of growth/decline at a larger geographic scale (i.e., state, nation-wide, and even global expec-tations). Industry projection rates are based off of California state projections and adjusted to current employment estimates. Projections do not include consideration of policy changes.
Industry Concentration (Location Quotient): The loca-tion quotient variable is a comparative statistic used to calculate relative employment concentration of a given industry against the average employment of the industry in a larger geography (e.g., nation). Industries with a higher location quotient (usually greater than 1.2) indicate that a region/state has a comparative advantage or specialization in the production of that good or service.
Industry Competitiveness Effect (Shift Share Analysis): A standard method of regional economic analysis that attempts to separate regional job growth into its com-ponent causes. The three main causes identified are the “national growth effect,” which is regional growth that
can be attributed to the overall growth of the entire U.S. economy; the “industrial mix effect,” which is re-gional growth that can be attributed to positive trends in the specific industry or occupation at a national level; and the “regional competitiveness effect,” which is growth that cannot be explained by either overall or industry-specific trends. A positive value indicates that a local industry has a competitive advantage compared to the nation. Note: Positive shift share values do not explain why an industry has a competitive advantage; they can show only that there are potential factors that contribute to the industry’s ability to outperform the national average rate of growth/decline.
Export Orientation: This variable can be measured in multiple ways. Through the development of an input-output model, metrics estimating export amounts can be calculated for each six-digit naics code. Since em-ployment levels vary significantly between industries, production output and export amounts also vary. To account for this and provide a comparable metric, the percentage of exports per job was calculated. Industries that predominately export their product bring new money into the economy, which in turn drive many other local sectors and service providers. Furthermore, export-oriented industries that require less labor input per unit of output can generate significant amounts of new dollars for an economy through job and output growth. Identifying these sectors helps bring a stronger understanding of the economic benefits gained from targeted sector strategies.
Job Multiplier Effects: A jobs multiplier indicates how important an industry is to regional job creation. For example, a jobs multiplier of 3 would mean that for every job created by that industry, 2 other jobs would be created in other industries (for a total of 3 jobs). Higher job multipliers in industries that are associated with higher average wages tend to have larger positive impacts on an economy.
Earnings Multiplier Effects: An earnings multiplier in-dicates the level of additional earnings associated with the addition one new dollar of earnings to an industry in an economy. This variable is important in understanding how targeted investment in an industry
27 CALiFORNiA ENERGY EFFiCiENCY SECTOR ALiGNMENT
(especially higher-paying industries) affects the overall quality of jobs created.
Industry Average Wage: This metric is calculated on the wages of occupations typically employed in an industry. This provides a perspective on the quality of jobs within a given industry, answering the question of whether the industry typically provides family-sustaining wages.
Excess Demand: Measured using an input-output mod-el, excess demand can also be viewed as regional/ state imports. The metric describes how much of a good or service is purchased from outside the area and can indicate the area’s inability to produce its own supply. The consulting team cautions against over-interpreting this variable, as cross-hauling (inter-regional and inter-state trade) does exist due to specialization in other areas. However, if a region or state has a high level of industry requirements and is only producing a small portion of output to meet those requirements with the remaining amount being imported, then an op-portunity may exist to further develop that particular industry. This would be considered a demand-driven industry development approach.
Workforce Compatibility: The metric in this analysis is important to provide an understanding of the capa-bility of a region or state’s workforce to fill the labor needs within a given industry, especially the higher-skilled labor needs (measured using o*net job zone codes 3 and higher). Compatibility is derived from a proprietary dataset developed by emsi, which utilizes measured o*net occupational competencies to iden-tify similarities in skill sets. Workforce compatibility is broken into two variables. The first variable deter-mines the percentage of employment in a sector that is considered skilled. The second variable determines the percent of the region’s workforce that is highly compatible (90% compatibility or greater) to the sec-tor’s skilled labor. For example, if half of an industry’s labor needs are high-skill workers and a third of the regional workforce can fill those labor needs, we would conclude that the industry is a good fit for the region’s workforce capabilities.
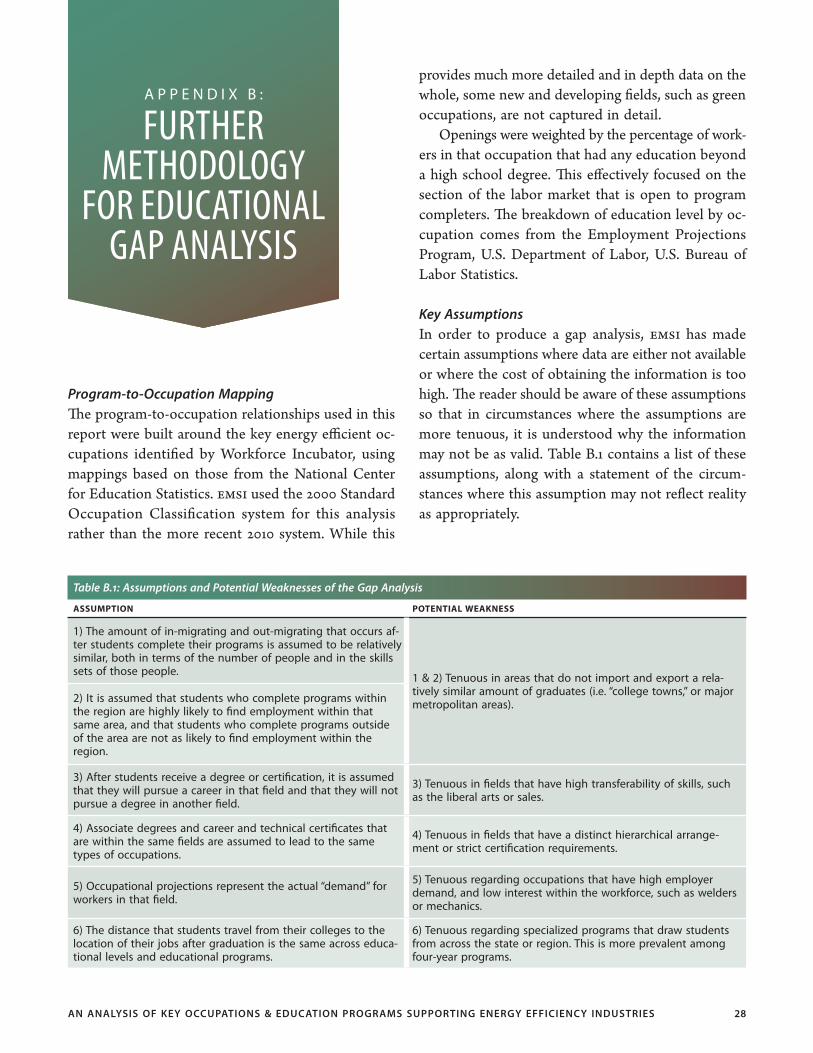
AN ANALYSiS OF KEY OCCUPATiONS & EDUCATiON PROGRAMS SUPPORTiNG ENERGY EFFiCiENCY iNDUSTRiES 28
A P P E N D I X B : FURTHER
METHODOLOGY FOR EDUCATIONAL
GAP ANALYSIS
Program-to-Occupation MappingThe program-to-occupation relationships used in this report were built around the key energy efficient oc-cupations identified by Workforce Incubator, using mappings based on those from the National Center for Education Statistics. emsi used the 2000 Standard Occupation Classification system for this analysis rather than the more recent 2010 system. While this
provides much more detailed and in depth data on the whole, some new and developing fields, such as green occupations, are not captured in detail. Openings were weighted by the percentage of work-ers in that occupation that had any education beyond a high school degree. This effectively focused on the section of the labor market that is open to program completers. The breakdown of education level by oc-cupation comes from the Employment Projections Program, U.S. Department of Labor, U.S. Bureau of Labor Statistics.
Key AssumptionsIn order to produce a gap analysis, emsi has made certain assumptions where data are either not available or where the cost of obtaining the information is too high. The reader should be aware of these assumptions so that in circumstances where the assumptions are more tenuous, it is understood why the information may not be as valid. Table B.1 contains a list of these assumptions, along with a statement of the circum-stances where this assumption may not reflect reality as appropriately.
Table B.1: Assumptions and Potential Weaknesses of the Gap Analysis
ASSUMPTION POTENTIAL WEAKNESS
1) The amount of in-migrating and out-migrating that occurs af-ter students complete their programs is assumed to be relatively similar, both in terms of the number of people and in the skills sets of those people. 1 & 2) Tenuous in areas that do not import and export a rela-
tively similar amount of graduates (i.e. “college towns,” or major metropolitan areas).2) It is assumed that students who complete programs within
the region are highly likely to find employment within that same area, and that students who complete programs outside of the area are not as likely to find employment within the region.
3) After students receive a degree or certification, it is assumed that they will pursue a career in that field and that they will not pursue a degree in another field.
3) Tenuous in fields that have high transferability of skills, such as the liberal arts or sales.
4) Associate degrees and career and technical certificates that are within the same fields are assumed to lead to the same types of occupations.
4) Tenuous in fields that have a distinct hierarchical arrange-ment or strict certification requirements.
5) Occupational projections represent the actual “demand” for workers in that field.
5) Tenuous regarding occupations that have high employer demand, and low interest within the workforce, such as welders or mechanics.
6) The distance that students travel from their colleges to the location of their jobs after graduation is the same across educa-tional levels and educational programs.
6) Tenuous regarding specialized programs that draw students from across the state or region. This is more prevalent among four-year programs.

29 CALiFORNiA ENERGY EFFiCiENCY SECTOR ALiGNMENT
A P P E N D I X C : DATA
SOURCES
To find the program completers for all colleges in the region, emsi used data from the Integrated Postsecond-ary Educational System (ipeds), which are publicly available through the National Center for Educational Statistics. For the purposes of this report, completers are individuals who complete either a degree-earning or certificate-earning program in the given academic year. To find current and projected occupational em-ployment, emsi used its own proprietary database of regional economic data. These estimates are derived from the Bureau of Labor Statistics’ (bls) Occupa-tional Employment Statistics (oes), the Census Bu-reau’s American Community Survey (acs), the bls Employment Projections Program, National Industry-Occupation Matrix (nioem), and finally from emsi’s own industry employment data which are derived for a host of bls, Census, and Bureau of Economic Analysis (bea) datasets. Projections do not include the impacts of potential policy changes, as it is difficult to predict either enactment or methods of implementation. The following is a comprehensive account of emsi’s data sources:
CD Light, llc, d.b.a. ZipInfo.com. zipList5 Plus Zip Code Data.
——. ZipInfo.com. Database on-line. Available from http://www.zipinfo.com; Internet (accessed May 2005).
U.S. Census Bureau.——. American Community Survey, 2005-2007 3-Year
Estimates.——. County Business Patterns (cbp) Employment
Reports.——. Current State Demographic data.——. Current County Demographic data.——. Decennial Census Reports.——. National Population Report.——. Nonemployer Statistics Reports.——. Projected State Demographic data.——. State Population Total Reports.
U.S. Department of Commerce, Bureau of Economic Analysis.——. Regional Economic Information Systems (reis).
Local Area Personal Income.——. Regional Economic Information Systems (reis).
County Demographic data.——. Regional Economic Information Systems (reis).
Employment & Earnings Reports.——. State Personal Income Employment and Earn-
ings Reports.
U.S. Department of Education, National Center for Education Statistics.——. Integrated Postsecondary Education Data Sys-
tem Institutional Characteristics Survey. Data-base online. Available from http://nces.ed.gov/Ipeds/ ic.asp;
——. Integrated Postsecondary Education Data Sys-tem Faculty Salaries Data. Database on-line. Availablefrom http://nces. ed.gov/Ipeds/fac-ultysalaries.asp;
——. Integrated Postsecondary Education Data System Fall Staff Data. Database on-line. Available from http://nces.ed.gov/ Ipeds/fallstaff.asp;
——. Occupation to cip (Classification of Instruc-tional Programs).
——. Public Elementary/Secondary School Universe Survey Data. Database on-line. Available from http:// nces.ed.gov/ccd/ pubschuniv.asp;
U.S. Department of Labor, Bureau of Labor Statistics.——. Current Employment Statistics.

AN ANALYSiS OF KEY OCCUPATiONS & EDUCATiON PROGRAMS SUPPORTiNG ENERGY EFFiCiENCY iNDUSTRiES 30
——. Current Year National Occupation Matrix.——. National Current Industry data.——. National Projected Industry data.——. National Replacement Jobs data.——. Projected National Occupation Matrix.——. Quarterly Census of Employment and Wages
(also known as es-202 Covered Employment & Wages Data).
Wisconsin Department of Workforce Development, Bureau of Workforce Information.
U.S. Department of Health and Human Services, Centers for Disease Control and Prevention, National Center for Health Statistics.——. Health, United States, 2004.

31 CALiFORNiA ENERGY EFFiCiENCY SECTOR ALiGNMENT
A P P E N D I X D : DETAILED
OCCUPATION DATA
Detailed Employment Data Across All Industries
Table D.1: Employment for Energy Assessment Occupations
SOC CODE DESCRIPTION
2011 JOBS
06–’11 CHANGE
06–’11 % CHANGE
11–’16 CHANGE
11–’16 % CHANGE
PROJECTED ANNUAL
OPENINGS
CURRENT HOURLY
EARNINGS ED LEVEL
11-9021 Construction managers 24,628 (5,027) (17%) 1,363 6% 468 $30.93 Bach.
13-1199 Business operation special-ists, all other 69,668 508 1% 3,808 5% 2,309 $31.47 Bach.
13-1111 Management analysts 70,004 10,480 18% 10,368 15% 3,275 $27.20 Deg. + exp.
11-1021 General and operations managers 86,290 (8,607) (9%) 300 0% 2,694 $52.27 Deg. + exp.
Subtotal 250,590 (2,646) (1%) 15,839 6% 8,746 $37.39 n/a
Table D.2: Employment for Technicians & Installation Occupations
SOC CODE DESCRIPTION
2011 JOBS
06–’11 CHANGE
06–’11 % CHANGE
11–’16 CHANGE
11–’16 % CHANGE
PROJECTED ANNUAL
OPENINGS
CURRENT HOURLY
EARNINGS ED LEVEL
17-3021 Aerospace engineering and operations technicians 316 (7) (2%) 3 1% 9 $28.94 Assoc.
17-3023 Electrical and electronic engineering technicians 8,414 (944) (10%) (225) (3%) 197 $28.04 Assoc.
17-3029 Engineering technicians, except drafters, all other 4,847 (24) 0% 76 2% 121 $30.73 Assoc.
47-2211 Sheet metal workers 5,555 (2,126) (28%) (48) (1%) 148 $26.99 LT OJT
51-8021 Stationary engineers and boiler operators 1,382 (7) (1%) 113 8% 46 $28.83 LT OJT
47-2132 Insulation workers, mech. 457 (168) (27%) 35 8% 23 $22.42 MT OJT
49-1011First-line supervisors/manag-ers of mechanics, installers, and repairers
14,005 (1,739) (11%) 284 2% 443 $32.49 Exp. in field
49-2011 Computer, automated teller, and office machine repairers 8,403 (632) (7%) (115) (1%) 164 $19.06 PSV Award

AN ANALYSiS OF KEY OCCUPATiONS & EDUCATiON PROGRAMS SUPPORTiNG ENERGY EFFiCiENCY iNDUSTRiES 32
SOC CODE DESCRIPTION
2011 JOBS
06–’11 CHANGE
06–’11 % CHANGE
11–’16 CHANGE
11–’16 % CHANGE
PROJECTED ANNUAL
OPENINGS
CURRENT HOURLY
EARNINGS ED LEVEL
49-2022Telecommunications equip-ment installers and repairers, except line installers
11,208 (3,593) (24%) 55 0% 290 $27.12 LT OJT
49-2094Electrical and electronics repairers, commercial and industrial equipment
1,837 (139) (7%) 34 2% 47 $30.21 PSV Award
49-9012Control and valve install-ers and repairers, except mechanical door
1,128 (6) (1%) 45 4% 30 $23.84 MT OJT
49-9021Heating, air conditioning, and refrigeration mechanics and installers
7,362 (1,360) (16%) 502 7% 220 $24.76 LT OJT
49-9041 Industrial machinery me-chanics 6,745 (77) (1%) 317 5% 179 $26.70 LT OJT
49-9042 Maintenance and repair workers, general 46,220 (1,781) (4%) 2,644 6% 1,240 $19.00 MT OJT
49-9043 Maintenance workers, ma-chinery 1,454 (68) (4%) 48 3% 35 $19.97 ST OJT
51-2022 Electrical and electronic equipment assemblers 10,112 (1,864) (16%) (872) (9%) 187 $15.30 ST OJT
51-2023 Electromechanical equip-ment assemblers 3,281 (602) (16%) (240) (7%) 63 $14.69 ST OJT
51-2091 Fiberglass laminators and fabricators 555 (170) (23%) (56) (10%) 13 $14.20 MT OJT
51-2092 Team assemblers 21,629 (3,996) (16%) (300) (1%) 594 $13.57 MT OJT
51-2093 Timing device assemblers, adjusters, and calibrators 84 (14) (14%) (9) (11%) 2 $14.89 MT OJT
51-2099 Assemblers and fabricators, all other 8,220 (2,775) (25%) (6) 0% 236 $14.13 MT OJT
51-4041 Machinists 8,236 (840) (9%) (577) (7%) 118 $20.47 LT OJT
51-9061 Inspectors, testers, sorters, samplers, and weighers 16,251 (1,983) (11%) (246) (2%) 351 $16.56 MT OJT
187,701 (24,915) (12%) 1,462 1% 4,756 $20.91 n/a
Table D.3: Employment for Sales, Marketing & Program Management Occupations
SOC CODE DESCRIPTION
2011 JOBS
06–’11 CHANGE
06–’11 % CHANGE
11–’16 CHANGE
11–’16 % CHANGE
PROJECTED ANNUAL
OPENINGS
CURRENT HOURLY
EARNINGS ED LEVEL
11-2011 Advertising and promotions managers 2,603 94 4% 130 5% 89 $37.61 Deg. + exp.
11-2021 Marketing managers 18,073 495 3% 928 5% 575 $60.79 Deg. + exp.
11-2022 Sales managers 23,979 (578) (2%) 1,857 8% 888 $47.36 Deg. + exp.
41-4011Sales representatives, whole-sale and mfg., technical and scientific products
19,434 (1,195) (6%) 1,125 6% 685 $41.10 MT OJT
41-4012Sales representatives, whole-sale and mfg., except techni-cal and scientific products
42,364 (3,388) (7%) 2,444 6% 1,485 $27.90 MT OJT
43-4151 Order clerks 8,963 (2,351) (21%) (880) (10%) 263 $15.84 ST OJT
43-4051 Customer service reps. 64,444 (4,575) (7%) 5,251 8% 3,083 $17.66 MT OJT
Subtotal 179,860 (11,498) (6%) 10,855 6% 7,068 $31.10 n/a

33 CALiFORNiA ENERGY EFFiCiENCY SECTOR ALiGNMENT
Table D.4: Employment for Construction Occupations
SOC CODE DESCRIPTION
2011 JOBS
06–’11 CHANGE
06–’11 % CHANGE
11–’16 CHANGE
11–’16 % CHANGE
PROJECTED ANNUAL
OPENINGS
CURRENT HOURLY
EARNINGS ED LEVEL
11-9021 Construction managers 24,628 (5,027) (17%) 1,363 6% 468 $30.93 Bach.
47-4011 Construction and building inspectors 4,731 (94) (2%) 334 7% 164 $29.04 Exp. in field
47-1011First-line supervisors/manag-ers of construction trades and extraction workers
26,686 (8,080) (23%) 1,474 6% 814 $32.81 Exp. in field
47-2031 Carpenters 50,775 (23,562) (32%) 2,390 5% 1,178 $25.60 LT OJT
13-1051 Cost estimators 9,160 (2,727) (23%) 702 8% 347 $33.42 Exp. in field
47-2111 Electricians 23,276 (6,152) (21%) (190) (1%) 692 $29.42 LT OJT
47-2132 Insulation Workers, Mech. 457 (168) (27%) 35 8% 23 $22.42 MT OJT
47-2152 Plumbers, Pipefitters, and Steamfitters 17,243 (4,531) (21%) 635 4% 510 $27.49 LT OJT
47-2131 Insulation Workers, Floor, Ceiling, and Wall 864 (736) (46%) 86 10% 50 $24.37 MT OJT
Subtotal 157,820 (51,077) (24%) 6,829 4% 4,246 $28.96 n/a
Table D.5: Employment for Operations & Supply Chain Occupations
SOC CODE DESCRIPTION
2011 JOBS
06–’11 CHANGE
06–’11 % CHANGE
11–’16 CHANGE
11–’16 % CHANGE
PROJECTED ANNUAL
OPENINGS
CURRENT HOURLY
EARNINGS ED LEVEL
11-3061 Purchasing managers 3,571 (157) (4%) 14 0% 116 $46.30 Deg. + exp.
13-1023Purchasing agents, except wholesale, retail, and farm products
11,939 (32) 0% 764 6% 475 $28.26 Exp. in field
11-3011 Administrative services managers 9,767 (36) 0% 586 6% 322 $37.78 Deg. + exp.
11-9199 Managers, all other 95,248 10,241 12% 9,354 10% 4,328 $21.90 Exp. in field
43-5061 Production, planning, and expediting clerks 12,354 (1,288) (9%) 56 0% 361 $23.11 ST OJT
15-2031 Operations research analysts 4,175 122 3% 425 10% 206 $36.65 Mast.
Subtotal 137,054 8,850 7% 11,199 8% 5,808 $24.78 n/a
Table D.6: Employment for Engineering Occupations
SOC CODE DESCRIPTION
2011 JOBS
06–’11 CHANGE
06–’11 % CHANGE
11–’16 CHANGE
11–’16 % CHANGE
PROJECTED ANNUAL
OPENINGS
CURRENT HOURLY
EARNINGS ED LEVEL
17-2051 Civil engineers 17,883 (697) (4%) 1,448 8% 605 $42.19 Bach.
17-2071 Electrical engineers 8,973 (806) (8%) (196) (2%) 249 $47.22 Bach.
41-9031 Sales engineers 10,033 (154) (2%) 458 5% 463 $50.02 Bach.
17-2072 Electronics engineers, except computer 12,584 (1,438) (10%) (296) (2%) 347 $47.60 Bach.
17-2081 Environmental engineers 2,368 136 6% 317 13% 112 $42.59 Bach.
17-2112 Industrial Engineers 7,651 (26) 0% 408 5% 296 $43.12 Bach.
17-2141 Mechanical Engineers 8,722 (289) (3%) 120 1% 283 $42.11 Bach.
17-2199 Engineers, All Other 13,554 (79) (1%) 326 2% 379 $45.04 Bach.
11-9041 Engineering Managers 14,647 (889) (6%) 85 1% 382 $67.98 Deg. + exp.
Subtotal 96,415 (4,242) (4%) 2,670 3% 3,116 $48.57 n/a

AN ANALYSiS OF KEY OCCUPATiONS & EDUCATiON PROGRAMS SUPPORTiNG ENERGY EFFiCiENCY iNDUSTRiES 34
Table D.7: Employment for Finance & Accounting Occupations
SOC CODE DESCRIPTION
2011 JOBS
06–’11 CHANGE
06–’11 % CHANGE
11–’16 CHANGE
11–’16 % CHANGE
PROJECTED ANNUAL
OPENINGS
CURRENT HOURLY
EARNINGS ED LEVEL
13-2011 Accountants and auditors 68,767 3,951 6% 6,510 9% 2,465 $27.37 Bach.
13-2051 Financial analysts 22,551 5,240 30% 3,360 15% 1,082 $31.48 Bach.
Subtotal 91,318 9,191 11% 9,870 11% 3,547 $28.38 n/a
Table D.8: Employment for Information Technology Occupations
SOC CODE DESCRIPTION
2011 JOBS
06–’11 CHANGE
06–’11 % CHANGE
11–’16 CHANGE
11–’16 % CHANGE
PROJECTED ANNUAL
OPENINGS
CURRENT HOURLY
EARNINGS ED LEVEL
15-1071 Network and computer systems administrators 18,057 869 5% 2,193 12% 740 $40.22 Bach.
15-1081 Network systems and data communications analysts 25,800 3,589 16% 4,219 16% 1,308 $32.35 Bach.
15-1041 Computer support specialists 26,009 343 1% 1,962 8% 1,120 $26.52 Assoc.
Subtotal 69,866 4,801 7% 8,374 12% 3,168 $32.21 n/a
Table D.9: Employment for Building Design Occupations
SOC CODE DESCRIPTION
2011 JOBS
06–’11 CHANGE
06–’11 % CHANGE
11–’16 CHANGE
11–’16 % CHANGE
PROJECTED ANNUAL
OPENINGS
CURRENT HOURLY
EARNINGS ED LEVEL
17-1011 Architects, except landscape and naval 9,365 (1,272) (12%) 589 6% 289 $29.14 Bach.
27-1021 Commercial and industrial designers 2,644 36 1% 156 6% 113 $21.70 Bach.
19-3051 Urban and regional planners 3,398 (14) 0% 327 10% 131 $38.42 Mast.
27-1025 Interior designers 4,350 (381) (8%) 331 8% 201 $19.12 Assoc.
Subtotal 19,757 (1,631) (8%) 1,403 7% 734 $27.53 n/a
Table D.10: Employment for Human Resources & Training Occupations
SOC CODE DESCRIPTION
2011 JOBS
06–’11 CHANGE
06–’11 % CHANGE
11–’16 CHANGE
11–’16 % CHANGE
PROJECTED ANNUAL
OPENINGS
CURRENT HOURLY
EARNINGS ED LEVEL
11-3042 Training and development managers 1,217 (18) (1%) 56 5% 38 $48.80 Deg. + exp.
13-1073 Training and development specialists 7,551 382 5% 803 11% 358 $31.40 Bach.
Subtotal 8,768 364 4% 859 10% 396 $33.82 n/a
In Sector Employment for Critical Energy Efficiency Occupations
Table D.11: In-Sector Employment for Construction Occupations
SOC CODE DESCRIPTION
2011 INDUSTRY
JOBS
ANNUAL OPENINGS IN
INDUSTRY
% OF ENERGY EFFICIENCY
SECTOR% OF
OCCUPATION
47-2111 Electricians 10,601 318 8% 46%
47-2031 Carpenters 6,800 163 5% 13%
47-2152 Plumbers, pipefitters, and steamfitters 5,985 180 4% 35%

35 CALiFORNiA ENERGY EFFiCiENCY SECTOR ALiGNMENT
SOC CODE DESCRIPTION
2011 INDUSTRY
JOBS
ANNUAL OPENINGS IN
INDUSTRY
% OF ENERGY EFFICIENCY
SECTOR% OF
OCCUPATION
47-1011 First-line supervisors/managers of construction trades and extraction workers 4,920 148 4% 18%
11-9021 Construction managers 4,067 73 3% 17%
13-1051 Cost estimators 1,785 68 1% 19%
47-4011 Construction and building inspectors 1,581 54 1% 33%
47-2131 Insulation workers, floor, ceiling, and wall 55 3 0% 6%
47-2132 Insulation workers, mechanical 64 3 0% 14%
Subtotal 35,858 1,010 26% n/a
Table D.12: In-Sector Employment for Engineering Occupations
2011 INDUSTRY JOBS ANNUAL OPENINGS IN INDUSTRY
% OF ENERGY EFFICIENCY
SECTOR% OF
OCCUPATION
% OF ENERGY EFFICIENCY
SECTOR% OF
OCCUPATION
17-2051 Civil engineers 9,289 316 7% 52%
11-9041 Engineering managers 2,277 59 2% 16%
17-2199 Engineers, all other 2,297 64 2% 17%
17-2072 Electronics engineers, except computer 638 18 0% 5%
17-2071 Electrical engineers 1,489 42 1% 17%
41-9031 Sales engineers 188 9 0% 2%
17-2141 Mechanical engineers 1,881 60 1% 22%
17-2112 Industrial engineers 396 15 0% 5%
17-2081 Environmental engineers 514 25 0% 22%
Subtotal 18,969 607 14% n/a
Table D.13: In-Sector Employment for Building Design Occupations
SOC CODE DESCRIPTION
2011 INDUSTRY
JOBS
ANNUAL OPENINGS IN
INDUSTRY
% OF ENERGY EFFICIENCY
SECTOR% OF
OCCUPATION
17-1011 Architects, except landscape and naval 7,162 215 5% 76%
27-1025 Interior designers 491 23 0% 11%
27-1021 Commercial and industrial designers 310 13 0% 12%
19-3051 Urban and regional planners 484 18 0% 14%
Subtotal 8,447 269 6% n/a
Table D.14: In-Sector Employment for Energy Assessment Occupations
SOC CODE DESCRIPTION
2011 INDUSTRY
JOBS
ANNUAL OPENINGS IN
INDUSTRY
% OF ENERGY EFFICIENCY
SECTOR% OF
OCCUPATION
13-1111 Management analysts 568 26 0% 1%
11-1021 General and operations managers 2,521 81 2% 3%
13-1199 Business operation specialists, all other 853 29 1% 1%
11-9021 Construction managers 4,067 73 3% 17%
Subtotal 8,009 209 6% n/a

AN ANALYSiS OF KEY OCCUPATiONS & EDUCATiON PROGRAMS SUPPORTiNG ENERGY EFFiCiENCY iNDUSTRiES 36
Table D.15: In-Sector Employment for Technician & Installation Occupations
SOC CODE DESCRIPTION
2011 INDUSTRY
JOBS
ANNUAL OPENINGS IN
INDUSTRY
% OF ENERGY EFFICIENCY
SECTOR% OF
OCCUPATION
51-2022 Electrical and electronic equipment assemblers 167 3 0% 2%
49-9042 Maintenance and repair workers, general 387 10 0% 1%
51-9061 Inspectors, testers, sorters, samplers, and weighers 502 11 0% 3%
17-3023 Electrical and electronic engineering technicians 480 12 0% 6%
51-2092 Team assemblers 332 9 0% 2%
49-2011 Computer, automated teller, & office machine repairers 43 1 0% 1%
49-9021 Heating, air conditioning, and refrigeration mechanics and installers 1,982 59 1% 27%
47-2211 Sheet metal workers 1,721 45 1% 31%
17-3029 Engineering technicians, except drafters, all other 345 9 0% 7%
49-1011 First-line supervisors/managers of mechanics, installers, and repairers 464 15 0% 3%
51-2023 Electromechanical equipment assemblers 113 2 0% 3%
49-9041 Industrial machinery mechanics 52 1 0% 1%
51-4041 Machinists 86 1 0% 1%
49-2022 Telecommunications equipment installers and repairers, except line installers 663 17 0% 6%
51-2099 Assemblers and fabricators, all other 89 2 0% 1%
49-9012 Control and valve installers and repairers, except me-chanical door 20 1 0% 2%
49-2094 Electrical and electronics repairers, commercial and industrial equipment 110 3 0% 6%
47-2132 Insulation workers, mechanical 64 3 0% 14%
49-9043 Maintenance workers, machinery 16 0 0% 1%
51-8021 Stationary engineers and boiler operators 16 1 0% 1%
17-3021 Aerospace engineering and operations technicians 42 1 0% 13%
51-2093 Timing device assemblers, adjusters, and calibrators 2 0 0% 2%
51-2091 Fiberglass laminators and fabricators - - 0% 0%
Subtotal 7,696 207 6% n/a
Table D.16: In-Sector Employment for Operations & Supply Chain Occupations
SOC CODE DESCRIPTION
2011 INDUSTRY
JOBS
ANNUAL OPENINGS IN
INDUSTRY
% OF ENERGY EFFICIENCY
SECTOR% OF
OCCUPATION
11-9199 Managers, all other 2,375 109 2% 2%
13-1023 Purchasing agents, except wholesale, retail, and farm products 359 14 0% 3%
43-5061 Production, planning, and expediting clerks 269 8 0% 2%
15-2031 Operations research analysts 33 2 0% 1%
11-3011 Administrative services managers 119 4 0% 1%
11-3061 Purchasing managers 84 3 0% 2%
Subtotal 3,239 140 2% n/a

37 CALiFORNiA ENERGY EFFiCiENCY SECTOR ALiGNMENT
Table D.17: In-Sector Employment for Sales, Marketing & Program Management Occupations
SOC CODE DESCRIPTION
2011 INDUSTRY
JOBS
ANNUAL OPENINGS IN
INDUSTRY
% OF ENERGY EFFICIENCY
SECTOR% OF
OCCUPATION
43-4051 Customer service representatives 169 8 0% 0%
11-2021 Marketing managers 354 11 0% 2%
41-4011 Sales representatives, wholesale and manufacturing, technical and scientific products 188 7 0% 1%
11-2022 Sales managers 121 5 0% 1%
41-4012 Sales representatives, wholesale and manufacturing, except technical and scientific products 302 11 0% 1%
43-4151 Order clerks 18 1 0% 0%
11-2011 Advertising and promotions managers - - 0% 0%
Subtotal 1,152 42 1% n/a
Table D.18: In-Sector Employment for Finance & Accounting Occupations
SOC CODE DESCRIPTION
2011 INDUSTRY
JOBS
ANNUAL OPENINGS IN
INDUSTRY
% OF ENERGY EFFICIENCY
SECTOR% OF
OCCUPATION
13-2011 Accountants and auditors 893 32 1% 1%
13-2051 Financial analysts 43 2 0% 0%
Subtotal 936 34 1% n/a
Table D.19: In-Sector Employment for Information Technology Occupations
SOC CODE DESCRIPTION
2011 INDUSTRY
JOBS
ANNUAL OPENINGS IN
INDUSTRY
% OF ENERGY EFFICIENCY
SECTOR% OF
OCCUPATION
15-1081 Network systems and data communications analysts 233 12 0% 1%
15-1041 Computer support specialists 277 12 0% 1%
15-1071 Network and computer systems administrators 334 13 0% 2%
Subtotal 844 37 1% n/a
Table D.20: In-Sector Employment for Human Resources & Training Occupations
SOC CODE DESCRIPTION
2011 INDUSTRY
JOBS
ANNUAL OPENINGS IN
INDUSTRY
% OF ENERGY EFFICIENCY
SECTOR% OF
OCCUPATION
13-1073 Training and development specialists 52 2 0% 1%
11-3042 Training and development managers 3 0 0% 0%
Subtotal 55 3 0% n/a
Table D.21: Distribution of Critical Energy Efficiency Occupations by Age Group
SOC TITLE 14–18 19–21 22–24 25–34 35–44 45–54 55–64 65–99GRAND
TOTAL
% OVER
45
11-9199 Managers, all other 201 217 213 10,069 24,634 28,713 20,888 10,312 95,248 63%
11-1021 General and opera-tions managers 106 99 261 11,734 27,191 30,216 15,284 1,398 86,290 54%

AN ANALYSiS OF KEY OCCUPATiONS & EDUCATiON PROGRAMS SUPPORTiNG ENERGY EFFiCiENCY iNDUSTRiES 38
SOC TITLE 14–18 19–21 22–24 25–34 35–44 45–54 55–64 65–99GRAND
TOTAL
% OVER
45
13-1111 Management analysts 89 142 205 8,677 15,683 16,207 18,130 10,870 70,004 65%
13-2011 Accountants & auditors 25 184 1,088 14,707 15,481 17,501 13,919 5,860 68,767 54%
49-9042 Maintenance and re-pair workers, general 200 406 814 7,112 10,414 14,887 9,641 2,746 46,220 59%
41-4012
Sales representatives, wholesale and mfg., except technical and scientific products
107 144 1,025 7,773 11,243 12,083 7,519 2,469 42,364 52%
11-9021 Construction mgrs. 17 162 139 3,656 7,197 9,027 3,649 781 24,628 55%
13-2051 Financial analysts 9 85 124 3,550 6,532 5,819 4,561 1,870 22,551 54%
17-2051 Civil engineers 3 72 170 3,680 3,810 5,235 3,308 1,604 17,883 57%
51-9061Inspectors, testers, sorters, samplers, and weighers
67 55 280 2,826 4,062 5,417 3,072 472 16,251 55%
49-1011First-line supervisors/mgrs. of mechanics, in-stallers, and repairers
0 140 150 1,375 3,744 5,034 2,982 582 14,005 61%
17-2199 Engineers, all other 0 42 91 1,296 3,577 4,973 3,093 482 13,554 63%
11-9041 Engineering managers 0 0 49 2,334 4,158 6,181 1,861 64 14,647 55%
13-1023Purchasing agents, ex-cept wholesale, retail, and farm products
0 103 97 1,937 2,955 3,753 2,686 408 11,939 57%
11-3011 Administrative services managers 6 86 120 678 2,213 3,666 2,413 586 9,767 68%
17-2072 Electronics engineers, except computer 0 39 109 2,023 3,772 4,238 2,119 284 12,584 53%
17-1011 Architects, except landscape and naval 0 20 155 1,221 1,709 2,583 2,142 1,535 9,365 67%
51-2022Electrical and elec-tronic equipment assemblers
35 78 54 1,539 2,176 4,320 1,826 85 10,112 62%
13-1051 Cost estimators 55 70 43 561 2,457 3,762 2,109 103 9,160 65%
51-4041 Machinists 8 78 97 923 1,844 3,205 1,765 315 8,236 64%
41-9031 Sales engineers 0 0 140 726 3,966 3,493 1,584 124 10,033 52%
17-2071 Electrical engineers 0 26 99 1,189 2,590 3,215 1,574 279 8,973 56%
17-3023Electrical and elec-tronic engineering technicians
28 84 144 1,292 2,062 3,006 1,508 289 8,414 57%
17-2141 Mechanical engineers 0 66 108 1,557 2,240 2,828 1,355 568 8,722 54%
17-2112 Industrial engineers 0 18 167 1,008 1,912 2,709 1,508 329 7,651 59%
49-9041 Industrial machinery mechanics 32 48 123 824 1,529 2,475 1,499 216 6,745 62%
47-4011 Construction and building inspectors 0 41 103 288 389 1,674 1,579 657 4,731 83%
17-3029Engineering techni-cians, except drafters, all other
18 62 65 770 1,132 1,693 946 161 4,847 58%
15-2031 Operations research analysts 0 39 70 473 953 1,598 953 89 4,175 63%
11-3061 Purchasing managers 0 55 234 165 708 1,415 774 221 3,571 67%

39 CALiFORNiA ENERGY EFFiCiENCY SECTOR ALiGNMENT
SOC TITLE 14–18 19–21 22–24 25–34 35–44 45–54 55–64 65–99GRAND
TOTAL
% OVER
45
27-1025 Interior designers 0 106 128 664 1,277 1,075 722 379 4,350 50%
51-2023 Electromechanical equipment assemblers 3 50 54 608 475 1,352 669 69 3,281 64%
19-3051 Urban and regional planners 0 41 116 557 815 946 752 171 3,398 55%
11-2011 Advertising and pro-motions managers 0 35 131 519 414 681 740 82 2,603 58%
17-2081 Environmental engi-neers 0 0 111 469 525 737 432 94 2,368 53%
51-8021 Stationary engineers and boiler operators 0 26 38 152 227 373 334 231 1,382 68%
49-2094
Electrical and electron-ics repairers, com-mercial and industrial equipment
0 67 138 378 322 537 320 74 1,837 51%
49-9043 Maintenance workers, machinery 0 58 61 231 238 466 259 142 1,454 60%
49-9012Control and valve installers and repairers, except mech. door
0 34 86 126 188 378 260 57 1,128 62%
11-3042 Training and develop-ment managers 0 9 98 177 308 345 222 58 1,217 51%
13-1199 Business operation specialists, all other 172 189 1,885 16,145 17,489 18,959 12,744 2,086 69,668 48%
43-4051 Customer service rep-resentatives 661 3,714 6,780 19,854 13,671 11,746 6,533 1,486 64,444 31%
47-2031 Carpenters 293 406 2,382 13,927 14,512 13,580 4,841 833 50,775 38%
47-1011
First-line supervisors/managers of construc-tion trades and extrac-tion workers
19 162 351 4,931 8,049 9,133 3,533 507 26,686 49%
51-2092 Team assemblers 151 90 785 4,544 5,712 6,491 3,278 577 21,629 48%
11-2022 Sales managers 25 132 112 5,396 8,276 6,311 3,050 677 23,979 42%
41-4011Sales reps., wholesale & mfg., technical & scientific products
69 99 265 3,907 6,027 5,454 2,856 758 19,434 47%
15-1041 Computer support specialists 102 100 75 8,440 8,237 6,552 2,410 93 26,009 35%
47-2111 Electricians 118 152 293 7,339 6,389 5,978 2,558 448 23,276 39%
11-2021 Marketing managers 0 106 146 4,077 6,516 4,612 2,101 515 18,073 40%
47-2152 Plumbers, pipefitters, and steamfitters 55 88 268 5,400 4,903 4,599 1,699 230 17,243 38%
43-5061 Production, planning, and expediting clerks 119 71 98 2,730 3,223 3,658 2,103 352 12,354 49%
15-1081Network systems and data communications analysts
93 132 662 9,839 9,166 4,078 1,573 258 25,800 23%
15-1071 Network and comput-er systems admin. 33 133 100 5,217 6,934 3,981 1,500 159 18,057 31%
49-2022
Telecommunications equipment installers and repairers, except line installers
53 130 263 2,850 3,138 3,046 1,532 197 11,208 43%

AN ANALYSiS OF KEY OCCUPATiONS & EDUCATiON PROGRAMS SUPPORTiNG ENERGY EFFiCiENCY iNDUSTRiES 40
SOC TITLE 14–18 19–21 22–24 25–34 35–44 45–54 55–64 65–99GRAND
TOTAL
% OVER
45
51-2099 Assemblers and fabri-cators, all other 78 90 95 1,668 2,382 2,417 1,232 258 8,220 48%
13-1073 Training and develop-ment specialists 42 120 97 1,545 2,173 1,983 1,309 282 7,551 47%
43-4151 Order clerks 132 82 330 2,555 2,300 1,996 1,216 352 8,963 40%
49-9021Heating, air condition-ing, and refrigeration mechanics & installers
102 101 108 1,935 1,896 2,174 796 250 7,362 44%
49-2011Computer, automated teller, and office ma-chine repairers
147 169 159 2,333 2,420 1,924 1,064 187 8,403 38%
47-2211 Sheet metal workers 71 68 149 1,495 1,589 1,506 557 121 5,555 39%
27-1021 Commercial and in-dustrial designers 0 49 189 401 715 648 464 177 2,644 49%
47-2131 Insulation workers, floor, ceiling, and wall 35 103 109 150 227 172 61 8 864 28%
51-2091 Fiberglass laminators and fabricators 1 37 43 121 121 126 79 26 555 42%
17-3021 Aerospace engineering and operations techs. 0 0 24 96 65 63 58 10 316 42%
47-2132 Insulation workers, mechanical 0 67 66 118 81 62 47 15 457 27%
51-2093Timing device assem-blers, adjusters, and calibrators
0 0 0 31 18 23 11 0 84 41%
Grand Total 3,583 9,677 23,335 226,883 313,352 339,091 200,165 57,975 1,174,062 51%
Table D.22: Distribution of Critical Energy Efficiency Occupations by Highest Educational Level
SOC TITLE2011 JOBS
LESS THAN HS DIPLOMA
HIGH SCHOOL
DIPLOMA/ EQUIV.
SOME COL-
LEGE, NO DEGREE
ASSOCI-ATE’S
DEGREE
BACH-ELOR’S
DEGREEMASTER’S
DEGREE
DOC-TORAL/
PROFESS.DEGREE
11-2011 Advertising and promotions managers 2,603 1.0% 7.7% 12.5% 5.9% 59.9% 12.1% 1.0%
11-2021 Marketing managers 18,073 1.0% 9.1% 17.6% 6.7% 47.7% 16.6% 1.4%
11-2022 Sales managers 23,979 1.0% 9.1% 17.6% 6.7% 47.7% 16.6% 1.4%
11-3011 Administrative services managers 9,767 2.2% 19.3% 28.6% 12.2% 27.5% 8.6% 1.6%
11-3042 Training and development mgrs. 1,217 2.3% 12.5% 21.7% 7.4% 36.3% 17.8% 2.0%
11-3061 Purchasing managers 3,571 1.1% 11.8% 21.7% 9.1% 38.7% 15.4% 2.2%
11-9021 Construction managers 24,628 7.8% 30.8% 24.6% 8.1% 23.2% 4.8% 0.8%
11-9041 Engineering managers 14,647 0.8% 4.0% 7.7% 5.5% 45.7% 31.8% 4.5%
11-9199 Managers, all other 95,248 2.9% 15.7% 20.2% 8.1% 33.7% 16.0% 3.5%
11-1021 General and operations mgrs. 86,290 2.2% 16.9% 23.9% 8.4% 33.7% 12.4% 2.4%
13-1023 Purchasing agents, except whole-sale, retail, & farm products 11,939 2.0% 20.7% 27.9% 10.8% 30.0% 7.6% 0.9%
13-1051 Cost estimators 9,160 3.6% 25.0% 30.3% 11.1% 26.5% 3.0% 0.4%

41 CALiFORNiA ENERGY EFFiCiENCY SECTOR ALiGNMENT
SOC TITLE2011 JOBS
LESS THAN HS DIPLOMA
HIGH SCHOOL
DIPLOMA/ EQUIV.
SOME COL-
LEGE, NO DEGREE
ASSOCI-ATE’S
DEGREE
BACH-ELOR’S
DEGREEMASTER’S
DEGREE
DOC-TORAL/
PROFESS.DEGREE
13-1073 Training and development specialists 7,551 1.6% 13.7% 22.9% 9.2% 37.7% 13.2% 1.8%
13-1111 Management analysts 70,004 0.6% 6.0% 12.5% 5.0% 40.4% 28.8% 6.8%
13-1199 Business operation specialists, all other 69,668 1.9% 15.5% 23.1% 11.6% 32.3% 12.9% 2.7%
13-2011 Accountants and auditors 68,767 0.3% 5.3% 8.9% 10.5% 55.6% 17.0% 2.4%
13-2051 Financial analysts 22,551 0.9% 4.4% 10.1% 2.7% 44.6% 31.0% 6.2%
15-1041 Computer support specialists 26,009 1.0% 12.5% 29.4% 16.0% 33.1% 7.2% 0.9%
15-1071 Network and computer systems administrators 18,057 0.7% 8.4% 25.2% 15.5% 39.0% 10.2% 1.0%
15-1081 Network systems and data com-munications analysts 25,800 0.7% 8.1% 21.6% 13.5% 42.8% 12.1% 1.2%
15-2031 Operations research analysts 4,175 0.6% 6.6% 18.4% 7.8% 40.0% 23.0% 3.6%
17-1011 Architects, except landscape and naval 9,365 0.3% 1.9% 4.8% 4.8% 51.6% 28.0% 8.6%
17-2051 Civil engineers 17,883 0.3% 3.5% 5.8% 6.0% 56.4% 23.9% 4.2%
17-2071 Electrical engineers 8,973 0.2% 4.1% 9.2% 8.9% 50.1% 22.5% 5.0%
17-2072 Electronics engineers, except computer 12,584 0.2% 4.1% 9.2% 8.9% 50.1% 22.5% 5.0%
17-2081 Environmental engineers 2,368 0.5% 4.5% 4.8% 3.7% 46.7% 33.4% 6.4%
17-2112 Industrial engineers 7,651 0.3% 8.1% 13.5% 10.2% 49.2% 16.6% 2.1%
17-2141 Mechanical engineers 8,722 0.3% 5.2% 10.1% 11.3% 51.1% 19.5% 2.4%
17-2199 Engineers, all other 13,554 0.3% 3.8% 7.8% 7.8% 48.3% 25.8% 6.3%
17-3021 Aerospace engineering and operations technicians 316 3.7% 23.5% 33.1% 22.7% 14.1% 2.3% 0.5%
17-3023 Electrical and electronic engi-neering technicians 8,414 3.7% 23.5% 33.1% 22.7% 14.1% 2.3% 0.5%
17-3029 Engineering technicians, except drafters, all other 4,847 3.7% 23.5% 33.1% 22.7% 14.1% 2.3% 0.5%
19-3051 Urban and regional planners 3,398 0.0% 0.9% 3.2% 3.4% 35.6% 52.5% 4.5%
27-1021 Commercial and industrial designers 2,644 2.7% 13.0% 19.3% 14.1% 42.5% 7.1% 1.1%
27-1025 Interior designers 4,350 2.7% 13.0% 19.3% 14.1% 42.5% 7.1% 1.1%
41-4011Sales representatives, wholesale and manufacturing, technical and scientific products
19,434 3.0% 18.6% 23.2% 8.1% 39.8% 6.6% 0.7%
41-4012Sales representatives, wholesale and manufacturing, except tech-nical and scientific products
42,364 3.0% 18.6% 23.2% 8.1% 39.8% 6.6% 0.7%
41-9031 Sales engineers 10,033 0.9% 5.0% 15.6% 8.3% 54.6% 14.7% 1.0%
43-4051 Customer service representatives 64,444 4.5% 30.5% 32.5% 10.9% 18.4% 2.8% 0.4%
43-4151 Order clerks 8,963 9.6% 37.8% 28.1% 8.7% 13.3% 2.0% 0.5%
43-5061 Production, planning, and expe-diting clerks 12,354 3.2% 27.2% 31.2% 11.1% 21.3% 5.5% 0.5%
47-1011First-line supervisors/manag-ers of construction trades and extraction workers
26,686 15.5% 42.8% 24.6% 6.6% 8.8% 1.4% 0.4%
47-2031 Carpenters 50,775 24.6% 43.8% 19.1% 5.2% 6.1% 0.9% 0.3%

AN ANALYSiS OF KEY OCCUPATiONS & EDUCATiON PROGRAMS SUPPORTiNG ENERGY EFFiCiENCY iNDUSTRiES 42
SOC TITLE2011 JOBS
LESS THAN HS DIPLOMA
HIGH SCHOOL
DIPLOMA/ EQUIV.
SOME COL-
LEGE, NO DEGREE
ASSOCI-ATE’S
DEGREE
BACH-ELOR’S
DEGREEMASTER’S
DEGREE
DOC-TORAL/
PROFESS.DEGREE
47-2111 Electricians 23,276 9.0% 40.1% 30.4% 12.9% 6.4% 0.9% 0.4%
47-2131 Insulation workers, floor, ceiling, and wall 864 30.9% 44.7% 16.2% 2.5% 5.3% 0.2% 0.1%
47-2132 Insulation workers, mechanical 457 30.9% 44.7% 16.2% 2.5% 5.3% 0.2% 0.1%
47-2152 Plumbers, pipefitters, and steam-fitters 17,243 19.4% 46.8% 23.2% 6.2% 3.5% 0.5% 0.3%
47-2211 Sheet metal workers 5,555 15.6% 49.8% 23.6% 6.8% 3.5% 0.6% 0.1%
47-4011 Construction and building inspectors 4,731 3.1% 27.0% 32.7% 12.8% 21.4% 2.7% 0.4%
49-1011First-line supervisors/manag-ers of mechanics, installers, and repairers
14,005 8.2% 38.3% 29.5% 11.9% 10.0% 1.9% 0.3%
49-2011 Computer, automated teller, and office machine repairers 8,403 2.7% 20.0% 33.0% 21.6% 19.5% 2.9% 0.3%
49-2022Telecommunications equipment installers and repairers, except line installers
11,208 3.7% 31.7% 34.1% 17.4% 11.3% 1.6% 0.1%
49-2094Electrical and electronics repair-ers, commercial and industrial equipment
1,837 2.7% 35.0% 31.9% 19.8% 9.3% 1.1% 0.2%
49-9012 Control and valve installers and repairers, except mech. door 1,128 9.5% 43.5% 29.7% 11.3% 5.3% 0.5% 0.3%
49-9021 Heating, air conditioning, and re-frigeration mechs. and installers 7,362 13.1% 42.8% 26.9% 11.8% 4.5% 0.6% 0.3%
49-9041 Industrial machinery mechanics 6,745 11.7% 43.8% 26.2% 12.0% 5.6% 0.5% 0.2%
49-9042 Maintenance and repair workers, general 46,220 14.2% 42.8% 26.0% 10.3% 5.6% 0.8% 0.3%
49-9043 Maintenance workers, machinery 1,454 13.0% 43.0% 27.3% 11.6% 4.5% 0.3% 0.3%
51-2022 Electrical and electronic equip-ment assemblers 10,112 22.5% 48.1% 17.4% 6.2% 4.9% 0.8% 0.2%
51-2023 Electromechanical equipment assemblers 3,281 22.5% 48.1% 17.4% 6.2% 4.9% 0.8% 0.2%
51-2091 Fiberglass laminators & fabricators 555 21.6% 48.6% 19.3% 5.4% 4.4% 0.5% 0.2%
51-2092 Team assemblers 21,629 21.6% 48.6% 19.3% 5.4% 4.4% 0.5% 0.2%
51-2093 Timing device assemblers, ad-justers, and calibrators 84 21.6% 48.6% 19.3% 5.4% 4.4% 0.5% 0.2%
51-2099 Assemblers & fabricators, all other 8,220 21.6% 48.6% 19.3% 5.4% 4.4% 0.5% 0.2%
51-4041 Machinists 8,236 11.1% 49.2% 26.7% 9.2% 3.2% 0.3% 0.2%
51-8021 Stationary engineers and boiler operators 1,382 7.1% 42.4% 30.5% 8.8% 8.9% 2.0% 0.3%
51-9061 Inspectors, testers, sorters, sam-plers, and weighers 16,251 12.7% 40.3% 24.4% 9.1% 10.7% 2.4% 0.4%

43 CALiFORNiA ENERGY EFFiCiENCY SECTOR ALiGNMENT
Detailed KSA Tables
Table D.23: Top KSAs for Building Construction Occupations
KNOWLEDGEGROUP
AVG.
GROUP AVG. PER-
CENTILE SKILLSGROUP
AVG.
GROUP AVG. PER-
CENTILE ABILITIESGROUP
AVG.
GROUP AVG. PER-
CENTILE
Building and Con-struction 67 95 Installation 58 80 Gross Body Equilib-
rium 42 95
Design 56 80 Repairing 51 <70 Gross Body Coordi-nation 40 80
Transportation 40 70 Management of Per-sonnel Resources 52 <70 Extent Flexibility 54 80
Engineering and Technology 52 70 Equipment Mainte-
nance 50 <70 Stamina 39 80
Mechanical 58 <70 Quality Control Analysis 49 <70 Dynamic Strength 37 80
Table D.24: Top KSAs for Management Construction Occupations
KNOWLEDGEGROUP
AVG.
GROUP AVG. PER-
CENTILE SKILLSGROUP
AVG.
GROUP AVG. PER-
CENTILE ABILITIESGROUP
AVG.
GROUP AVG. PER-
CENTILE
Building and Con-struction 73 99 Systems Analysis 44 <70 Number Facility 46 <70
Engineering and Technology 66 90 Management of Per-
sonnel Resources 47 <70 Mathematical Rea-soning 45 <70
Design 61 90 Management of Financial Resources 41 <70 Visualization 50 <70
Mathematics 66 75 Systems Evaluation 43 <70 Time Sharing 40 <70
Public Safety and Security 52 70 Negotiation 48 <70 Flexibility of Closure 46 <70
Table D.25: Top KSAs for Engineering Occupations
KNOWLEDGEGROUP
AVG.
GROUP AVG. PER-
CENTILE SKILLSGROUP
AVG.
GROUP AVG. PER-
CENTILE ABILITIESGROUP
AVG.
GROUP AVG. PER-
CENTILE
Engineering and Technology 84 95 Systems Analysis 60 90 Mathematical Rea-
soning 58 90
Design 75 95 Systems Evaluation 57 80 Deductive Reasoning 67 90
Physics 61 95 Mathematics 72 75 Written Comprehen-sion 69 85
Mathematics 72 85 Complex Problem Solving 69 70 Information Order-
ing 61 90
Production and Processing 51 75 Judgment and Deci-
sion Making 67 <70 Oral Comprehen-sion 71 90
Computers and Electronics 66 75 Category Flexibility 57 85
Visualization 58 85
Oral Expression 70 85
Fluency of Ideas 56 80
Originality 56 80
Written Expression 64 80
Problem Sensitivity 60 75

AN ANALYSiS OF KEY OCCUPATiONS & EDUCATiON PROGRAMS SUPPORTiNG ENERGY EFFiCiENCY iNDUSTRiES 44
Table D.26: Top KSAs for Building Design Occupations
KNOWLEDGEGROUP
AVG.
GROUP AVG. PER-
CENTILE SKILLSGROUP
AVG.
GROUP AVG. PER-
CENTILE ABILITIESGROUP
AVG.
GROUP AVG. PER-
CENTILE
Design 79 95 Complex Problem Solving 69 75 Originality 61 90
Building and Con-struction 58 90 Operations Analysis 59 75 Fluency of Ideas 58 85
Fine Arts 29 80 Persuasion 64 70 Visualization 61 90
Engineering and Technology 57 75 Coordination 73 70 Deductive Reason-
ing 63 80
Sales and Marketing 48 75 Negotiation 56 <70 Information Order-ing 57 80
Administration and Management 58 75
Clerical 62 75
Mathematics 65 75
Table D.27: Top KSAs for Energy Assessment Occupations
KNOWLEDGEGROUP
AVG.
GROUP AVG. PER-
CENTILE SKILLSGROUP
AVG.
GROUP AVG. PER-
CENTILE ABILITIESGROUP
AVG.
GROUP AVG. PER-
CENTILE
Administration and Management 64 90 Systems Evaluation 58 80 Mathematical Rea-
soning 49 75
Economics and Ac-counting 47 85 Management of
Financial Resources 57 80 Number Facility 49 75
Building and Con-struction 56 90 Systems Analysis 55 80 Fluency of Ideas 50 <70
Personnel and Hu-man Resources 54 85 Management of Per-
sonnel Resources 52 <70 Written Expression 59 <70
Sales and Marketing 53 85 Management of Material Resources 49 <70 Deductive Reason-
ing 58 <70
Clerical 63 75
Table D.28: Top KSAs for Technician & Installation Occupations
KNOWLEDGEGROUP
AVG.
GROUP AVG. PER-
CENTILE SKILLSGROUP
AVG.
GROUP AVG. PER-
CENTILE ABILITIESGROUP
AVG.
GROUP AVG. PER-
CENTILE
Mechanical 64 80 Installation 54 70 Finger Dexterity 49 <70
Engineering and Technology 48 <70 Repairing 56 75 Visualization 49 <70
Design 42 <70 Troubleshooting 57 <70 Manual Dexterity 46 <70
Production and Processing 42 <70 Equipment Mainte-
nance 55 <70 Arm-Hand Steadi-ness 46 <70
Building and Con-struction 34 <70 Operation Monitor-
ing 50 <70 Control Precision 46 <70

45 CALiFORNiA ENERGY EFFiCiENCY SECTOR ALiGNMENT
Table D.29: Top KSAs for Operations & Supply Chain Occupations
KNOWLEDGEGROUP
AVG.
GROUP AVG. PER-
CENTILE SKILLSGROUP
AVG.
GROUP AVG. PER-
CENTILE ABILITIESGROUP
AVG.
GROUP AVG. PER-
CENTILE
Economics and Ac-counting 48 90 Management of
Financial Resources 51 70 Mathematical Rea-soning 47 70
Production and Processing 58 85 Systems Evaluation 52 <70 Number Facility 48 75
Admin. and Mgt. 62 85 Operations Analysis 59 70 Deductive Reasoning 57 <70
Mathematics 66 75 Management of Material Resources 50 70 Category Flexibility 51 <70
Personnel and Hu-man Resources 48 75 Mathematics 66 75 Written Expression 58 <70
Table D.30: Top KSAs for Administrative Sales, Marketing, Program Management Occupations
KNOWLEDGEGROUP
AVG.
GROUP AVG. PER-
CENTILE SKILLSGROUP
AVG.
GROUP AVG. PER-
CENTILE ABILITIESGROUP
AVG.
GROUP AVG. PER-
CENTILE
Sales and Marketing 78 99 Negotiation 59 75 Speech Recognition 58 85
Admin. and Mgt. 62 80 Persuasion 65 70 Fluency of Ideas 53 75
Economics and Ac-counting 42 80 Management of
Financial Resources 49 <70 Originality 51 <70
Customer and Per-sonal Service 76 75 Service Orientation 61 <70 Speech Clarity 55 <70
Communications and Media 43 <70 Management of Per-
sonnel Resources 51 <70 Written Expression 56 <70
Table D.31: Top KSAs for Clerical Sales, Marketing, Program Management Occupations
KNOWLEDGEGROUP
AVG.
GROUP AVG. PER-
CENTILE SKILLSGROUP
AVG.
GROUP AVG. PER-
CENTILE ABILITIESGROUP
AVG.
GROUP AVG. PER-
CENTILE
Customer and Per-sonal Service 79 80 Service Orientation 61 <70 Speech Recognition 62 95
Clerical 60 70 Reading Compre-hension 64 <70 Memorization 38 <70
Sales and Marketing 42 <70 Active Listening 63 <70 Speed of Closure 40 <70
Telecommunications 24 <70 Writing 54 <70 Flexibility of Closure 46 <70
Econ. & Accounting 27 <70 Time Management 55 <70 Perceptual Speed 41 <70
Table D.32: Top KSAs for Finance & Accounting Occupations
KNOWLEDGEGROUP
AVG.
GROUP AVG. PER-
CENTILE SKILLSGROUP
AVG.
GROUP AVG. PER-
CENTILE ABILITIESGROUP
AVG.
GROUP AVG. PER-
CENTILE
Economics and Ac-counting 76 99 Management of
Financial Resources 71 95 Number Facility 63 95
Mathematics 76 90 Systems Evaluation 63 90 Math. Reasoning 59 90
Law and Govern-ment 59 90 Judgment and Deci-
sion Making 75 85 Deductive Reason-ing 66 90
Clerical 70 85 Programming 35 80 Flexibility of Closure 50 70
English Language 68 75 Mathematics 76 75 Written Compr. 63 <70
Operations Analysis 62 80
Systems Analysis 60 90
Time Management 71 75

AN ANALYSiS OF KEY OCCUPATiONS & EDUCATiON PROGRAMS SUPPORTiNG ENERGY EFFiCiENCY iNDUSTRiES 46
Table D.33: Top KSAs for Information Technology Occupations
KNOWLEDGEGROUP
AVG.
GROUP AVG. PER-
CENTILE SKILLSGROUP
AVG.
GROUP AVG. PER-
CENTILE ABILITIESGROUP
AVG.
GROUP AVG. PER-
CENTILE
Tele-communica-tions 61 99 Programming 47 95 Information Order-
ing 56 75
Computers and Electronics 82 95 Systems Analysis 56 80 Number Facility 45 <70
Engineering and Technology 48 <70 Systems Evaluation 55 75 Written Comprehen-
sion 60 <70
Clerical 55 <70 Troubleshooting 57 <70 Memorization 39 <70
Customer and Per-sonal Service 63 <70 Operation Monitor-
ing 50 <70 Deductive Reason-ing 57 <70
Table D.34: Top KSAs for Human Resources & Training Occupations
KNOWLEDGEGROUP
AVG.
GROUP AVG. PER-
CENTILE SKILLSGROUP
AVG.
GROUP AVG. PER-
CENTILE ABILITIESGROUP
AVG.
GROUP AVG. PER-
CENTILE
Education and Training 91 95 Systems Evaluation 54 75 Memorization 45 80
Personnel and Hu-man Resources 66 95 Learning Strategies 66 <70 Speech Clarity 60 80
Sociology and An-thropology 60 95 Systems Analysis 49 <70 Oral Expression 66 70
Sales and Marketing 58 90 Management of Per-sonnel Resources 51 <70 Originality 52 <70
English Language 75 90 Management of Financial Resources 44 <70 Fluency of Ideas 51 <70
Administration and Management 63 85
Communications and Media 53 85
Clerical 68 85
Philosophy and Theology 39 80
Therapy and Coun-seling 42 75