CALIBRATION TEST SYSTEM FOR FLICKERMETER · menghasilkan gelombang sinus, segi empat tepat, dan...
25
UNIVERSITI PUTRA MALAYSIA DEVELOPMENT OF A DIGITAL CALIBRATION TEST SYSTEM FOR FLICKERMETER SIA LIH HUOY FK 2007 56
Transcript of CALIBRATION TEST SYSTEM FOR FLICKERMETER · menghasilkan gelombang sinus, segi empat tepat, dan...
UNIVERSITI PUTRA MALAYSIA
DEVELOPMENT OF A DIGITAL CALIBRATION TEST SYSTEM FOR FLICKERMETER
SIA LIH HUOY
FK 2007 56
DEVELOPMENT OF A DIGITAL CALIBRATION TEST SYSTEM FOR FLICKERMETER
By
SIA LIH HUOY
Thesis Submitted to the School of Graduate Studies, Universiti Putra Malaysia, in Fulfilment of the Requirement for the Degree of Master of Science
August 2007
Abstract of thesis presented to the Senate of Universiti Putra Malaysia in fulfilment of the requirement for the degree of Master of Science
DEVELOPMENT OF A DIGITAL CALIBRATION TEST SYSTEM FOR FLICKERMETER
By
SIA LIH HUOY
August 2007
Chairman: Professor Sudhanshu Shekhar Jamuar, PhD Faculty: Engineering
Over last few decades, there has been deterioration in the power quality due to the
increase in non-linear domestic and industrial loads usage. There may be a systematic
low frequency variation of the voltage envelope or a series of random voltage changes,
which the magnitude may not normally exceed the voltage regulations laid down by the
supply authority. These phenomena known as voltage flicker have severe effect on
power quality. Flickermeter is the power analyzer for measuring the voltage flicker,
flicker sensation and flicker severity index. International Electrotechnical Commission
(IEC) has published IEC 61000-4-15 standard describing the functional and design
specifications for flickermeter.
Most of the flickermeter and flickermeter calibration test systems presented in the
literature are based on analog signal processing techniques. In this thesis, a digital
calibration test system for flickermeter based on digital signal processor (DSP) is
ii
presented. The system has been developed around DSP TMS320 and test signals
required as per IEC 61000-4-15 standard to test a flickermeter is generated.
A DSP based waveform generator, which can give sine, square, triangular waveform
with frequency of operation from 0.01 Hz to 24 kHz has been described in this thesis.
The DSP starter kit (DSK) TMS320C6713DSK with Code Composer Studio and C
programming language had been used in obtaining the desired signal. Amplitude
modulated test signals with different modulation index as per IEC 61000-4-15 standard
had been generated using DSP based waveform generator. A measurement system was
developed to capture the analog signals generated by DSP starter kit. LabVIEW had
been used to perform the data analysis and from which voltage fluctuation for P and Pst
measurement was obtained.
For the voltage fluctuation of P measurement, it was found that the percent modulation
of test signals measured by the oscilloscope is from 2.15% to 8.20% for sinusoidal
modulating frequency; and 0.67% to 7.65% for rectangular modulating frequency. The
average of the difference between the test signals generated and IEC standard value was
4.6% for sinusoidal voltage fluctuation; and 3.9% for the rectangular voltage fluctuation.
For the voltage fluctuation of Pst measurement, it was found out that test signals
generated are 2.8% deviated from IEC standard. The digital calibration test system
developed was able to generate test conditions which were within 5% from the standard
values required for testing.
iii
Abstrak tesis yang dikemukakan kepada Senat Universiti Putra Malaysia sebagai memenuhi keperluan untuk ijazah Master Sains
PEMBANGUNAN SISTEM UJIAN PENENTUKUR DIGIT BAGI METER KERDIPAN
Oleh
SIA LIH HUOY
Ogos 2007
Pengerusi: Profesor Sudhanshu Shekhar Jamuar, PhD Fakulti: Kejuruteraan
Dalam beberapa dekad yang lalu, terdapat kemerosotan dalam kualiti kuasa disebabkan
oleh pertambahan beban tidak lelurus dalam bidang domestik and industri. Terdapat
kemungkinan variasi frequensi rendah sistematik pada sampul voltan atau siri perubahan
voltan secara rawak, di mana magnitudnya tidak melebihi tahap voltan yang ditetapkan
oleh penguatkuasa bekalan. Fenomena ini dikenali sebagai kerdipan voltan yang
memberi kesan teruk kepada kualiti kuasa. Meter kerdipan ialah alat analisis kuasa untuk
mengukur kerdipan voltan, indeks sensasi kerdipan dan keparahan kerdipan.
International Electrotechnical Commission (IEC) telah mengumumkan standard
IEC61000-4-15 yang menyatakan fungsi dan spesifikasi reka bentuk bagi meter
kerdipan.
Kebanyakan meter kerdipan dan sistem ujian penentukur bagi meter kerdipan yang
dibentangkan menggunakan teknik pemprosesan isyarat analog. Dalam tesis ini, sistem
iv
ujian penentukur digit yang berdasarkan pemprosesan isyarat digit (DSP) diperkenalkan.
Sistem ini dibina menggunakan DSP TMS 320 dan isyarat ujian mengikut standard IEC
61000-4-15 bagi menguji meter kerdipan telah dijanakan.
Satu penjana gelombang berdasarkan pemprosesan isyarat digit yang boleh
menghasilkan gelombang sinus, segi empat tepat, dan segi tiga dengan frekuensi dari
0.01 Hz ke 24 kHz telah dibentang dalam tesis ini. DSP starter kit (DSK)
TMS320C6713DSK dengan Code Composer Studio dan bahasa program C telah
digunakan untuk mendapatkan isyarat ujian yang dihendaki. Penjana isyarat berasaskan
pemprosesan isyarat digit telah digunakan bagi menjana isyarat modulasi amplitud
dengan indeks modulasi yang berlainanan berdasarkan standard IEC 61000-4-15. Satu
sistem pengukuran telah dibina bagi mendapatkan isyarat analog yang dijana oleh DSP
starter kit. LabVIEW telah digunakan bagi analisis data di mana indeks modulasi bagi
ukuran P dan Pst telah diperolehi.
Untuk indeks modulasi bagi ukuran P, didapati bahawa peratus modulasi bagi isyarat
ujian yang diukur oleh osiloskop adalah dari 2.15% ke 8.20% bagi frekuensi modulasi
sinusoidal; dan 0.67% ke 7.65% bagi frekuensi modulasi segi empat. Purata bagi
perbezaan antara isyarat ujian dengan standard IEC adalah 4.6% bagi perubahan voltan
sinusoidal; dan 3.9% bagi perubahan voltan segi empat. Untuk indeks modulasi bagi
ukuran Pst, diperhatikan bahawa isyarat ujian adalah dalam 2.8% dari standard IEC.
Sistem ujian penentukur yang dibina dapat menghasilkan keadaan ujian dalam 5% dari
senarai nilai yang diperlukan bagi ujian.
v
ACKNOWLEDGEMENTS
First of all, I would like to extend my deepest gratitude and appreciation to my project
supervisor, Prof. S. S. Jamuar for his invaluable guidance, advice and patience. I would
like to thank my co-supervisors, Dr. Roslina Mohd Sidek and Dr. Mohammad Hamiruce
Marhaban, for the advices and precious time spared. Their constructive advices and
comments have been very inspiring for the success of this project.
I would like to acknowledge the grant received from Ministry of Science, Technology
and Innovation (MOSTI), Government of Malaysia for sponsoring this research through
IRPA funding. I would like to thank all the lecturers, technicians and staffs of the
Department of Electric and Electronic, Faculty of Engineering UPM for their
cooperation and helps during my post-graduate study life.
My sincere appreciation goes to my friends and my seniors for helping me throughout
the duration of this project. I owe a deep gratitude to Lini Lee for providing me
knowledge and moral supports during the post-grad year. Their precious helpfulness,
encouragements and supports are keys to the success of this master project.
Last but not least, I would like to take this opportunity to express my deepest gratitude to
my parents and family for their love, supports and encouragements all along my life. A
special thank to Mr. Alvin Ch’ng, for his endless love and supports throughout these
years. Thanks for always be there for me no matter what happens.
vi
I certify that an Examination Committee has met on 24th August 2007 to conduct the final examination of Sia Lih Huoy on her Master of Science thesis entitled “Development of A Digital Calibration Test System for Flickermeter” in accordance with Universiti Pertanian Malaysia (Higher Degree) Act 1980 and Universiti Pertanian Malaysia (Higher Degree) Regulations 1981. The Committee recommends that the student be awarded the degree of Master of Science. Members of the Examination Committee were as follows: Samsul Bahari Mohd Noor, PhD Deputy Dean (Development) Faculty of Engineering Universiti Putra Malaysia (Chairman) Borhanuddin Mohd Ali, PhD Professor Faculty of Engineering Universiti Putra Malaysia (Internal Examiner) Syed Javaid Iqbal, PhD Lecturer Faculty of Engineering Universiti Putra Malaysia (Internal Examiner) Ruzain Hj Abdul Rahman, PhD Professor Faculty of Electrical Engineering Universiti Teknologi Malaysia (External Examiner)
________________________________ HASANAH MOHD. GHAZALI, PhD Professor and Deputy Dean School of Graduate Studies Universiti Putra Malaysia
Date:
vii
This thesis was submitted to the Senate of Universiti Putra Malaysia and has been accepted as fulfilment of the requirement for the degree of Master of Science. The members of the Supervisory Committee are as follows:
S. S. Jamuar, PhD Professor Faculty of Engineering Universiti Putra Malaysia (Chairman)
Roslina Mohd Sidek, PhD Lecturer Faculty of Engineering Universiti Putra Malaysia (Member)
Mohd Hamiruce Marhaban, PhD Lecturer Faculty of Engineering Universiti Putra Malaysia (Member)
_____________________
AINI IDERIS, PhD Professor and Dean School of Graduate Studies Universiti Putra Malaysia Date: 13th December 2007
viii
DECLARATION
I hereby declare that the thesis is based on my original work except for quotations and citations which have been duly acknowledged. I also declare that it has not been previously or concurrently submitted for any other degree at UPM or other institutions.
_________________ SIA LIH HUOY
Date: 8th October 2007
ix
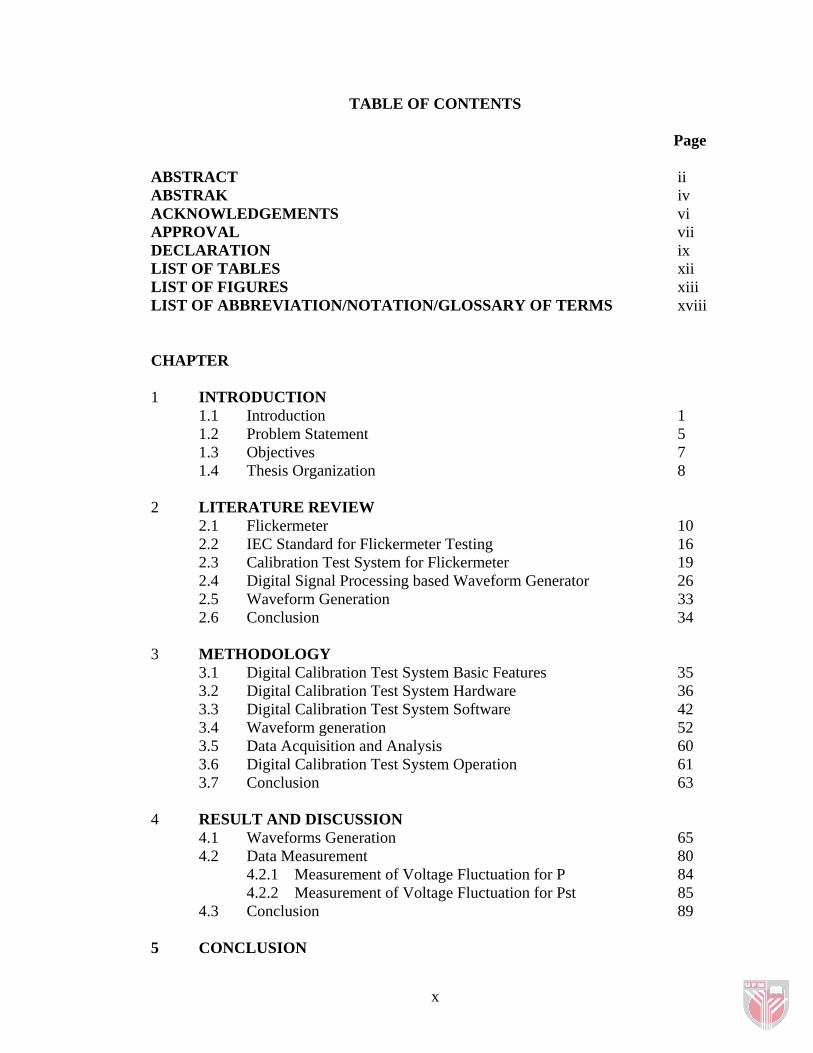
TABLE OF CONTENTS Page ABSTRACT ii ABSTRAK iv ACKNOWLEDGEMENTS vi APPROVAL vii DECLARATION ix LIST OF TABLES xii LIST OF FIGURES xiii LIST OF ABBREVIATION/NOTATION/GLOSSARY OF TERMS xviii CHAPTER 1 INTRODUCTION
1.1 Introduction 1 1.2 Problem Statement 5 1.3 Objectives 7 1.4 Thesis Organization 8
2 LITERATURE REVIEW
2.1 Flickermeter 10 2.2 IEC Standard for Flickermeter Testing 16 2.3 Calibration Test System for Flickermeter 19 2.4 Digital Signal Processing based Waveform Generator 26 2.5 Waveform Generation 33 2.6 Conclusion 34
3 METHODOLOGY
3.1 Digital Calibration Test System Basic Features 35 3.2 Digital Calibration Test System Hardware 36 3.3 Digital Calibration Test System Software 42 3.4 Waveform generation 52 3.5 Data Acquisition and Analysis 60 3.6 Digital Calibration Test System Operation 61 3.7 Conclusion 63
4 RESULT AND DISCUSSION
4.1 Waveforms Generation 65 4.2 Data Measurement 80
4.2.1 Measurement of Voltage Fluctuation for P 84 4.2.2 Measurement of Voltage Fluctuation for Pst 85
4.3 Conclusion 89 5 CONCLUSION
x

5.1 Conclusion 90 5.2 Suggestions for Future Study 93
REFERENCES 94 APPENDICES 97 BIODATA OF THE AUTHOR 122
xi
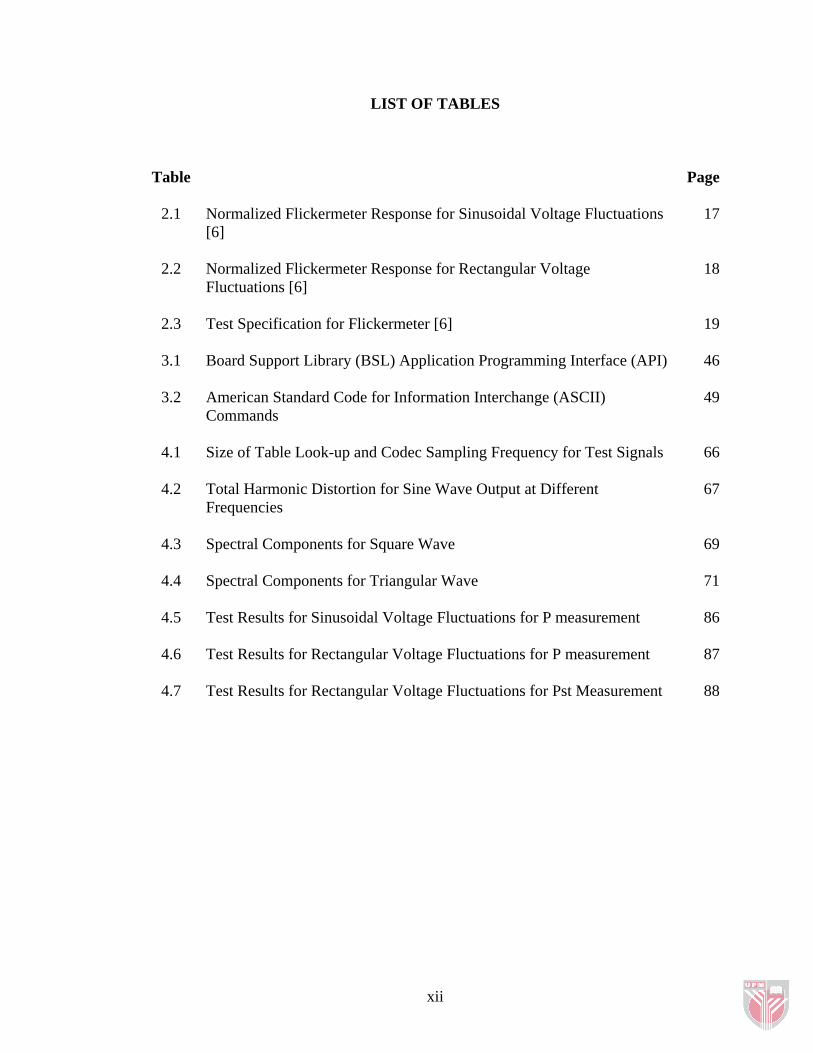
LIST OF TABLES
Table Page
2.1 Normalized Flickermeter Response for Sinusoidal Voltage Fluctuations [6]
17
2.2 Normalized Flickermeter Response for Rectangular Voltage Fluctuations [6]
18
2.3 Test Specification for Flickermeter [6]
19
3.1 Board Support Library (BSL) Application Programming Interface (API)
46
3.2 American Standard Code for Information Interchange (ASCII) Commands
49
4.1 Size of Table Look-up and Codec Sampling Frequency for Test Signals
66
4.2 Total Harmonic Distortion for Sine Wave Output at Different Frequencies
67
4.3 Spectral Components for Square Wave
69
4.4 Spectral Components for Triangular Wave
71
4.5 Test Results for Sinusoidal Voltage Fluctuations for P measurement
86
4.6 Test Results for Rectangular Voltage Fluctuations for P measurement
87
4.7 Test Results for Rectangular Voltage Fluctuations for Pst Measurement
88
xii
LIST OF FIGURES
Figure Page
1.1 Sample Voltage Flicker Waveform and Mathematical Relationship [4]
3
1.2 Functional Block Diagram of Flickermeter [2]
5
1.3 Basic Features of Digital Flickermeter Calibration Test System
8
2.1 Functional Diagram of IEC Flickermeter (IEC 61000-4-15) [6]
11
2.2 Block Diagram of Digital Flickermeter [8]
14
2.3 Software Algorithm of Digital Voltage Flickermeter [9]
15
2.4 Block Diagram of Calibration System [7]
21
2.5 Typical Modulation Measurement Result [7]
21
2.6 Square Wave Modulation of Mains Voltage for Flickermeter Calibration [12]
22
2.7 UK’s National Physical Laboratory’s System for Calibration of Flickermeters [12]
23
2.8 Block Diagram of Calibration Test System [13]
25
2.9 Block Diagram of DSP System [13]
25
2.10 Basic Configuration of Waveform Generator [15]
28
2.11 Synthesis Module [15]
29
2.12 Architecture of Arbitrary Waveform Generator [16]
31
2.13 Arbitrary Waveform Generated by Spline Technique [16]
32
3.1 Block Diagram of Digital Calibration Test System
36
3.2 Flow Chart of the Digital Flickermeter Calibration Test System
38
3.3 Digital Flickermeter Calibration Test System Set Up
39
3.4 Block Diagram of TMS320C6713DSK [17]
40
xiii
3.5 TLV320AIC23 Codec Interface [17]
41
3.6 Control Switch and Amplifier
42
3.7 Block Diagram of Signal Measurement
43
3.8 Software Development Flow of CCS [18]
44
3.9 Development Environment with DSP/BIOS of CCS
45
3.10 Flow Chart of Sine Wave Generation
47
3.11 Flow Chart of Square Wave Generation
47
3.12 Flow Chart of Amplitude Modulated Waveform Generation
48
3.13 Front Panel of LabVIEW Programming
49
3.14 Block Diagram of LabVIEW Programming
51
3.15 GPIB Write.vi
52
3.16 GPIB Read.vi
52
3.17 Build Array.vi
52
3.18 Arbitrary Waveforms [19]
54
3.19 Block Diagram of Waveforms Generation [19]
54
3.20 Sine Wave Output
57
3.21 Square Wave Output
57
3.22 Triangular Wave Output
58
3.23 Sine Wave Modulation
60
3.24 Square Wave Modulation
60
3.25 Flow of the Digital Calibration Test System Operation
62
3.26 Digital Calibration Test System Developed
63
4.1(a) Sine Wave Output at 50 Hz, 3.20V Peak-to-peak Amplitude
68
4.1(b) FFT Spectrum of 50 Hz Sine Wave 68
xiv
4.2(a) Sine Wave Output at 33.33 Hz, 3.20V Peak-to-peak Amplitude
68
4.2(b) FFT Spectrum of 33.33 Hz Sine Wave
68
4.3(a) Sine Wave Output at 33.33 Hz, 3.16V Peak-to-peak Amplitude
68
4.3(b) FFT Spectrum of 0.5 Hz Sine Wave
68
4.4(a) Square Wave Output at 50 Hz, 3.30V Peak-to-peak Amplitude
70
4.4(b) FFT Spectrum of 50 Hz Square Wave
70
4.5(a) Square Wave Output at 33.33 Hz, 3.22V Peak-to-peak Amplitude
70
4.5(b) FFT Spectrum of 33.33 Hz Square Wave
70
4.6(a) Square Wave Output at 0.5 Hz, 3.36V Peak-to-peak Amplitude
70
4.6(b) FFT Spectrum of 0.5 Hz Square Wave
70
4.7(a) Triangular Wave Output at 50 Hz, 3.30V Peak-to-peak Amplitude
72
4.7(b) FFT Spectrum of 50 Hz Triangular Wave
72
4.8(a) Triangular Wave Output at 25 Hz, 0.80V Peak-to-peak Amplitude
72
4.8(b) FFT Spectrum of 25 Hz Triangular Wave
72
4.9(a) Triangular Wave Output at 1 Hz, 0.80V Peak-to-peak Amplitude
72
4.9(b) FFT Spectrum of 1 Hz Triangular Wave
72
4.10 Arbitrary Waveforms Consisting Sine Wave and Square Wave
73
4.11 Arbitrary Waveforms Consisting Triangular Wave and Square Wave
73
4.12(a) Amplitude Modulated Output (Carrier frequency - 50 Hz sine wave; modulating signal - 5 Hz sine wave; index modulation = 0.5)
75
4.12(b) FFT Spectrum of Amplitude Modulated Output
75
4.13(a) Amplitude Modulated Output (Carrier frequency - 50 Hz sine wave; modulating signal - 33.33 Hz sine wave; index modulation = 0.0213)
75
4.13(b) FFT Spectrum of Amplitude Modulated Output
75
xv
4.14(a) Amplitude Modulated Output (Carrier frequency - 50 Hz sine wave; modulating signal - 0.5 Hz sine wave; index modulation = 0.0234)
75
4.14(b) FFT Spectrum of Amplitude Modulated Output
75
4.15(a) Amplitude Modulated Output (Carrier frequency - 50 Hz sine wave; modulating signal - 5 Hz square wave; index modulation = 0.5)
76
4.15(b) FFT Spectrum of Amplitude Modulated Output
76
4.16(a) Amplitude Modulated Output (Carrier frequency - 50 Hz sine wave; modulating signal - 8.8 Hz square wave; index modulation = 0.00199)
76
4.16(b) FFT Spectrum of Amplitude Modulated Output
76
4.17(a) Amplitude Modulated Output (Carrier frequency - 50 Hz sine wave; modulating signal - 0.5 Hz square wave; index modulation = 0.00514)
76
4.17(b) FFT Spectrum of Amplitude Modulated Output
76
4.18 Dual Outputs from the DSP – Amplitude Modulated Waveform and Sine Wave
77
4.19 Dual Outputs from the DSP – Amplitude Modulated Waveform and Square Wave
77
4.20 Starting Point for Both Waveform
77
4.21 Single Cycle of Sinusoidal Amplitude Modulated Waveform and Modulating Frequency (Carrier signal = 50 Hz; modulating signal = 5 Hz)
79
4.22 Samples of Waveform in One Amplitude Modulated Waveform
79
4.23 Single Cycle of Rectangular Amplitude Modulated Waveform and Modulating Frequency (Carrier signal = 50 Hz; modulating signal = 5 Hz)
79
4.24 Flow Chart of Dual Waveform Generation
81
4.25 Vmax Determination using Sine Modulating Frequency and Sampling Circuitry
82
4.26 Vmin Determination using Sine Modulating Frequency and Sampling Circuitry
82
4.27 Vmax Determination using Square Modulating Frequency and 83
xvi
Sampling Circuitry
4.28 Vmin Determination using Square Modulating Frequency and Sampling Circuitry
83
4.29 Front Panel of LabVIEW
84
xvii
LIST OF ABBREVIATIONS
ADC Analog-to-digital converter
AM Amplitude modulation
ACSII American Standard Code for Information Interchange
CCS Code Composer Studio
DAC Digital-to-analog converter
DFCTS Digital flickermeter calibration test system
DMA Direct memory access
DSP Digital signal processor
EMIF External memory interface
EPROM Erasable programmable read only memory
FFT Fast Fourier Transform
FIFO First In, First Out
GPIB General Purpose Interface Bus
IEC Electrotechnical Commission
IEEE Institute of Electrical and Electronics Engineers
ISO International Organization for Standardization
IVD Inductive voltage divider
LC Inductor-capacitor
M Percent modulation
m Modulation index
McBSP Multi-channel buffered serial port
NI National Instrument
xviii
P Instantaneous flicker sensation
Plt Long-term flicker severity
Pst Short-term flicker severity level
PU IEC perceptibility unit
RAM Random access memory
RC Resistor-capacitor
RMS Root mean square
SCR Silicon controlled rectifiers
THD Total harmonic distortion
TI Texas Instrument
UIE International Union for Electroheat
Vpp Peak-to-peak voltage
Vp Peak voltage
xix
CHAPTER 1
INTRODUCTION
1.1 Introduction
Power quality issues are mostly considered as very high speed events such as voltage
impulses / transients, high frequency noise, wave shape faults, voltage swells and sags
[1]. These problems have become worse over past few decades with the growth of non-
linear load usage in domestic and industry field [2]. Voltage supplied to the electrical
equipment is a sine wave operating at 50 Hz. Incandescent lamps, heaters and motors are
linear systems as the applied voltage sine wave will cause a sinusoidal current to be
drawn. Resistance in the system is consistence. However, some of the modern
equipment such as computers, variable frequency drives, electronic ballasts and
uninterruptible power supply systems do not have consistent resistance and the
resistance varies during each sine wave. These non-linear systems affect the stability of
the voltage supply causing voltage fluctuations. The foremost effect caused by voltage
fluctuations is light flicker.
Voltage fluctuations are repetitive or random variations in the magnitude of the supply
voltage due to sudden changes in the real and reactive power drawn by a load. Effects of
voltage fluctuations depend on the type and magnitude of loads and power system
capacity. For example, switching operations of industrial processes or electrical
appliances connected to the power supply. These operations generate voltage depression
to the power system. The voltage depression becomes more obvious with the increase in
uses of heavy electrical equipment and appliances, and is more prominent with uses of
modern electrical equipment using solid state devices like Thyristors, silicon controlled
rectifiers (SCRs) to control its operation. This equipment, acting as non-linear load on
the power line, might cause a voltage drop across the electricity supply network,
resulting in a lower voltage supplied to the lightning system. The varying of voltage,
which causes light flicker, will influence the visual perception of light and create
annoyance to human eye. The light flicker can be sufficiently large to affect people from
minor irritation to health risk if the flicker occurs too often. Furthermore, voltage
changes caused by non-linear loads might propagate in an attenuated form throughout
the distribution system and would affect many users [2].
Effects towards improving quality of the power supply have led electricity supply
companies and regulatory bodies to identify flicker problem and type of equipment
which causes these problems. The International Electrotechnical Commission (IEC) has
published some standards concerning the power quality issues. In November 2005, IEC
61000-3-2 has issued standards relating to limit the harmonics currents that an electrical
appliance can inject into the mains supply. It specifies limits of harmonic components of
the input current which might be produced by equipment tested under specified
conditions. Another standard published in the same year, IEC 61000-3-3 imposes limits
on voltage changes, voltage fluctuations and flicker that can be impressed on public
supply system. It specifies limits of voltage changes which may be produced by
equipment tested under specified conditions and gives guidance on methods of
assessment [3].
2
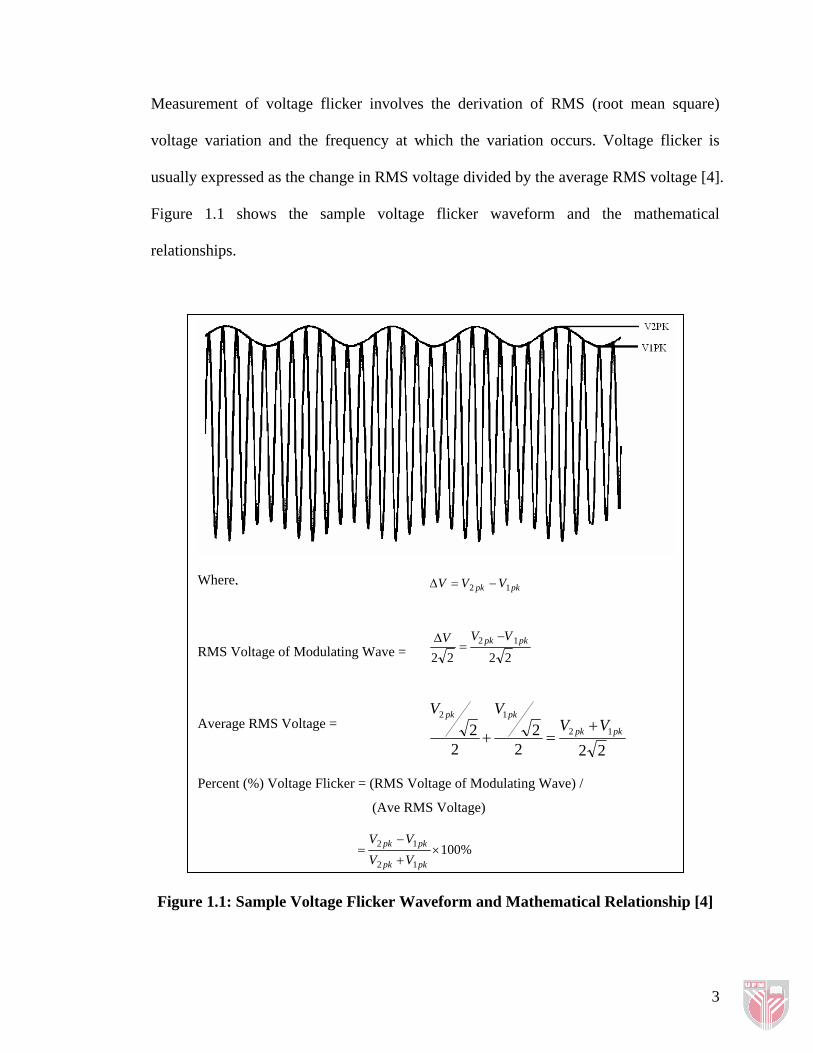
Measurement of voltage flicker involves the derivation of RMS (root mean square)
voltage variation and the frequency at which the variation occurs. Voltage flicker is
usually expressed as the change in RMS voltage divided by the average RMS voltage [4].
Figure 1.1 shows the sample voltage flicker waveform and the mathematical
relationships.
pkpk VVV 12 −=Δ
RMS Voltage of Modulating Wave = 222212 pkpk VVV −
=Δ
2222
22 12
12
pkpk
pkpkVV
VV+
=+
Percent (%) Voltage Flicker = (RMS Voltage of Modulating Wave) /
(Ave RMS Voltage)
%10012
12 ×+
−=
pkpk
pkpk
VVVV
Where,
Average RMS Voltage =
Figure 1.1: Sample Voltage Flicker Waveform and Mathematical Relationship [4]
3
The flicker produced by equipment is measured using flickermeter, which is a power
analyzer designed to monitor the voltage changes of the mains supply and to qualify to
what degree the light intensity variation caused by voltage changes will irritate test
subjects. IEC in the standard 61000-4-15 gives a functional description and design
specification for flickermeter.
Flickermeter is designed to detect voltage fluctuation in the range of 0.5 – 30 Hz
frequency and indicate the impression of visual observer. The device considered the
limited visual sensitivity and the effect of thermal time-constant of incandescent lamps
[5]. Flickermeter output is given in units of flicker severity (Pst), a value which is
acceptable by human tolerance limit. This device mimics the way that a human
perceives flicker and simulates the lamp-eye-brain chain of human. Generally,
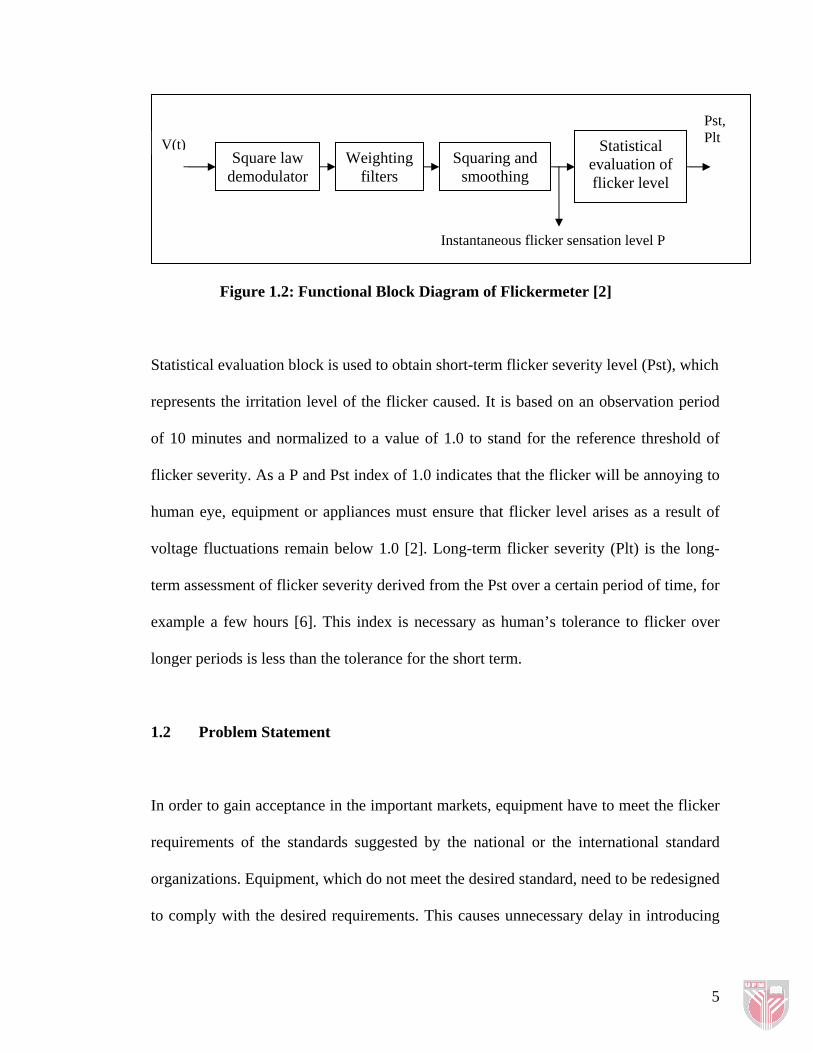
flickermeter has the design and functionality as shown in Figure 1.2. Square law
demodulator, weighting filters and squaring and smoothing filters perform the signal
conditioning operation on the measured voltage waveform V(t). These blocks represent
how the voltage fluctuations are transformed into light fluctuations. Perceptibility of
light fluctuation to human eye is determined, which gives the instantaneous flicker
sensation (P) index.
One unit of P (P=1.0) corresponds to the reference human flicker perceptibility threshold,
which is based on a criterion that flicker levels created by voltage fluctuations will
annoy 50% of persons tested. The test is carried out by varying the amplitude of
modulation input to maintain the unity for the peak value of output reading to P=1.0.
4
Square law demodulator
Weighting filters
Squaring and smoothing
Statistical evaluation of flicker level
Instantaneous flicker sensation level P
Pst, Plt V(t)
Figure 1.2: Functional Block Diagram of Flickermeter [2]
Statistical evaluation block is used to obtain short-term flicker severity level (Pst), which
represents the irritation level of the flicker caused. It is based on an observation period
of 10 minutes and normalized to a value of 1.0 to stand for the reference threshold of
flicker severity. As a P and Pst index of 1.0 indicates that the flicker will be annoying to
human eye, equipment or appliances must ensure that flicker level arises as a result of
voltage fluctuations remain below 1.0 [2]. Long-term flicker severity (Plt) is the long-
term assessment of flicker severity derived from the Pst over a certain period of time, for
example a few hours [6]. This index is necessary as human’s tolerance to flicker over
longer periods is less than the tolerance for the short term.
1.2 Problem Statement
In order to gain acceptance in the important markets, equipment have to meet the flicker
requirements of the standards suggested by the national or the international standard
organizations. Equipment, which do not meet the desired standard, need to be redesigned
to comply with the desired requirements. This causes unnecessary delay in introducing
5