Calibration of the Absolute Efficiency of Well-Type NaI(Tl ...
7
Research Article Calibration of the Absolute Efficiency of Well-Type NaI(Tl) Scintillation Detector in 0.121–1.408 MeV Energy Range Dalal Al Oraini Physics Department, Faculty of Science, Princess Nourah Bint Abdulrahman University, Riyadh 11544-55532, Saudi Arabia Correspondence should be addressed to Dalal Al Oraini; [email protected] Received 30 September 2017; Accepted 16 November 2017; Published 1 February 2018 Academic Editor: Arkady Serikov Copyright © 2018 Dalal Al Oraini. is is an open access article distributed under the Creative Commons Attribution License, which permits unrestricted use, distribution, and reproduction in any medium, provided the original work is properly cited. Well-type NaI(Tl) detectors are beneficial for low-level photon activity measurements because of the near 4 solid angle that can be gained with them. e detection efficiency can differ with the source-to-detector system geometries, the absorption of the photon in the detector material, and attenuation layers in front of the detector face. For these purposes, the absolute efficiency and the coincidence corrections of the well-type sodium iodide detector have been measured at 0.121–1.408MeV energy range (obtained from 152 Eu, 137 Cs, and 60 Co radioactive isotopes). e covenant between the experimental (present work) and the published theoretical values is good, with the high discrepancies being less than 1%. 1. Theoretical Viewpoint In the case where an isotropic radiating axial point source is in the detector well-cavity at a distance, ℎ, from cavity bottom (see Figure 1), the path of the photon is well defined by the geometrical solid angle, Ω, subtended by the source-to-de- tector system at the point of entry. e solid angle is given as Ω=∫ ∫ sin () (1) e usage of well-type gamma spectrometry systems is useful for low-level gamma activity measurements. To measure the sample’s activity, the photopeak efficiency (FEPE) of the detector for each photon energy is needed. is is usually obtained by the efficiency calibration by the use of stan- dard radioactive sources of identical geometrical shape and dimensions with the samples under study [1]. However, the MC simulations consider the detailed characteristics of the source-to-detector system in calculating the photopeak effi- ciency. is approach (MC) is inadequate in its accuracy because of the inaccuracy in the parameters accompanying the detector’s geometrical dimensions and the structure of the sample [2]. e accuracy is also affected by the uncertainty in nuclear data and the calculation uncertainties of the MC code [3], but these are likely to be as important as the parameters linked with the detector’s geometrical dimensions and the material composition of the sample. e physical dimensions provided by suppliers are usually unsatisfactory for accurate efficiency calculations because any slight change in some of these geometrical parameters can cause significant deviations from experimental values. Several studies of the response of -ray spectrometers using MC simulations have been published. Most of the authors report agreement with experimentally obtained efficiency values within 10%. One useful way to stun these complications is the use of the straightforward direct mathematical method [4–17] and the experimental measurements. For the polar () and azimuthal () angles, the azimuthal angle, , earns the values from 0 to 2, while the polar angle, (), earns four different values built on the source-to-detector configuration. 1 = tan −1 ( 1 ℎ ), 2 =− tan −1 ( 1 −ℎ ), 3 =− tan −1 ( 2 −ℎ ), 4 = tan −1 ( 2 −+ℎ ), (2) Hindawi Science and Technology of Nuclear Installations Volume 2018, Article ID 6432380, 6 pages https://doi.org/10.1155/2018/6432380
Transcript of Calibration of the Absolute Efficiency of Well-Type NaI(Tl ...

Research ArticleCalibration of the Absolute Efficiency of Well-Type NaI(Tl)Scintillation Detector in 0.121–1.408MeV Energy Range
Dalal Al Oraini
Physics Department, Faculty of Science, Princess Nourah Bint Abdulrahman University, Riyadh 11544-55532, Saudi Arabia
Correspondence should be addressed to Dalal Al Oraini; [email protected]
Received 30 September 2017; Accepted 16 November 2017; Published 1 February 2018
Academic Editor: Arkady Serikov
Copyright © 2018 Dalal Al Oraini. This is an open access article distributed under the Creative Commons Attribution License,which permits unrestricted use, distribution, and reproduction in any medium, provided the original work is properly cited.
Well-type NaI(Tl) detectors are beneficial for low-level photon activity measurements because of the near 4𝜋 solid angle that can begained with them. The detection efficiency can differ with the source-to-detector system geometries, the absorption of the photonin the detector material, and attenuation layers in front of the detector face. For these purposes, the absolute efficiency and thecoincidence corrections of the well-type sodium iodide detector have been measured at 0.121–1.408MeV energy range (obtainedfrom 152Eu, 137Cs, and 60Co radioactive isotopes). The covenant between the experimental (present work) and the publishedtheoretical values is good, with the high discrepancies being less than 1%.
1. Theoretical Viewpoint
In the case where an isotropic radiating axial point source isin the detector well-cavity at a distance, ℎ, from cavity bottom(see Figure 1), the path of the photon is well defined by thegeometrical solid angle, Ω, subtended by the source-to-de-tector system at the point of entry. The solid angle is given as
Ω = ∫𝜙∫𝜃sin (𝜃) 𝑑𝜃 𝑑𝜙 (1)
The usage of well-type gamma spectrometry systems is usefulfor low-level gamma activity measurements. To measure thesample’s activity, the photopeak efficiency (FEPE) of thedetector for each photon energy is needed. This is usuallyobtained by the efficiency calibration by the use of stan-dard radioactive sources of identical geometrical shape anddimensions with the samples under study [1]. However, theMC simulations consider the detailed characteristics of thesource-to-detector system in calculating the photopeak effi-ciency. This approach (MC) is inadequate in its accuracybecause of the inaccuracy in the parameters accompanyingthe detector’s geometrical dimensions and the structure of thesample [2]. The accuracy is also affected by the uncertaintyin nuclear data and the calculation uncertainties of the MCcode [3], but these are likely to be as important as theparameters linkedwith the detector’s geometrical dimensions
and the material composition of the sample. The physicaldimensions provided by suppliers are usually unsatisfactoryfor accurate efficiency calculations because any slight changein some of these geometrical parameters can cause significantdeviations from experimental values. Several studies of theresponse of 𝛾-ray spectrometers using MC simulations havebeen published. Most of the authors report agreement withexperimentally obtained efficiency values within 10%. Oneuseful way to stun these complications is the use of thestraightforward direct mathematical method [4–17] and theexperimental measurements.
For the polar (𝜃) and azimuthal (𝜑) angles, the azimuthalangle, 𝜑, earns the values from 0 to 2𝜋, while the polar angle,(𝜃), earns four different values built on the source-to-detectorconfiguration.
𝜃1 = tan−1 (𝑅1ℎ ) ,𝜃2 = 𝜋 − tan−1 ( 𝑅1𝑆 − ℎ) ,𝜃3 = 𝜋 − tan−1 ( 𝑅2𝑆 − ℎ) ,𝜃4 = tan−1 ( 𝑅2𝐿 − 𝑆 + ℎ) ,
(2)
HindawiScience and Technology of Nuclear InstallationsVolume 2018, Article ID 6432380, 6 pageshttps://doi.org/10.1155/2018/6432380
2 Science and Technology of Nuclear Installations
S
h
L
R2
R1
1
23
4
Figure 1: Well-type detector with an isotropic radiating axial pointsource in the detector well-cavity.
where 𝑅1 is the detector well-cavity inner radius, 𝑅2 is theouter radius, 𝑆 is the well depth, and 𝐿 is the detector sidelength, as exposed in Figure 1. There are two main cases todetermine the detector efficiency depending on the source-to-detector well bottom, ℎ; these two main cases containfive subcases. The photons have different five possible pathlengths affording to the photon entrance and emittance pointfrom the detector body.These path lengths are represented inFigure 2 and are specified by equation (3) as follows:
𝑑1 = 𝐿 − 𝑆cos (𝜃) ,
𝑑2 = 𝑅2sin (𝜃) − ℎ
cos (𝜃) ,𝑑3 = 𝐿 − 𝑆 + ℎ
cos (𝜃) − 𝑅1sin (𝜃) ,
𝑑4 = 𝑅2sin (𝜃) − 𝑅1
sin (𝜃) ,𝑑5 = 𝑆 − ℎ
cos (𝜃) − 𝑅1sin (𝜃) .
(3)
(a) In case of 𝜃2 > 𝜃3 > 𝜃1 > 𝜃4 existing in Figure 2(a),the four possible path lengths have been initiated to be(𝑑1, 𝑑2, 𝑑4, and 𝑑5) and the detection efficiency will bespecified by
𝜀 = 14𝜋 ∫2𝜋0
(∫𝜃40𝑓att𝑓1 sin (𝜃) 𝑑𝜃
+ ∫𝜃1𝜃4
𝑓att𝑓2 sin (𝜃) 𝑑𝜃 + ∫𝜃3𝜃1
𝑓att𝑓4 sin (𝜃) 𝑑𝜃+ ∫𝜃2𝜃3
𝑓att𝑓5 sin (𝜃) 𝑑𝜃)𝑑𝜑.(4)
(b) In case of 𝜃2 > 𝜃3 > 𝜃4 > 𝜃1 existing in Figure 2(b),the four possible path lengths have been initiated tobe 𝑑1, 𝑑3, 𝑑4, and 𝑑6 and the detection efficiency willbe specified by
𝜀 = 14𝜋 ∫2𝜋0
(∫𝜃10𝑓att𝑓1 sin (𝜃) 𝑑𝜃
+ ∫𝜃4𝜃1
𝑓att𝑓3 sin (𝜃) 𝑑𝜃 + ∫𝜃3𝜃4
𝑓att𝑓4 sin (𝜃) 𝑑𝜃+ ∫𝜃2𝜃3
𝑓att𝑓5 sin (𝜃) 𝑑𝜃)𝑑𝜑,(5)
where
𝑓att = 1 − 𝑒−𝜇⋅𝑑𝑖 , 𝑖 = 1–5, (6)
where 𝜇 is the detector attenuation coefficient for a photonwith energy, 𝐸𝛾, and 𝑑𝑖 are the possible path lengths coveredby the photons in the detector.Meanwhile the factor𝑓att is theattenuation factor for the absorbing layers with attenuationcoefficient 𝜇1, 𝜇2, . . . , 𝜇𝑛 and with the thickness 𝑡1, 𝑡2, . . . , 𝑡𝑛in front of the detector face and it is described as
𝑓att = 𝑒−∑𝑛𝑖=1 𝜇𝑖𝛿𝑖 , (7)
where
𝛿𝑖 = ( 𝑡𝑖cos 𝜃) for the horizontal absorber layers,
𝛿𝑖 = ( 𝑡𝑖sin 𝜃) for the vertical absorber layers. (8)
2. Experimental Setup
The 7.62 × 7.62 cm2 well-type sodium iodide detector, modelnumber 802, made by CANBERRA Company was used (seeFigure 3).
The detector was mounted vertically, the cathode toanode voltage was equal to +600Vdc, the dynode to dynodewas +80Vdc, the cathode to dynode was +150V dc, and thetotal weight was 1.8 kg. The detector dimensions were givenas 0.5mm Al end cap thickness, 2.5mm Al2O3 face reflectorlayer, 1.85mm Al2O3 side reflector layer, 8.33mm cavityradius, and 49.87 cavity depth.The detector energy resolution(FWHM) was 9% at the 661 keV 𝛾-ray line of 137Cs sourceground on the manufactory certificate and the shaping modewas Gaussian. The detector was coupled to a CANBERRAdata acquisition system (Osprey� Base) applying a Genie2000 analysis software, with many functions including peakarea determination. The type of the used sources is radioac-tive point sources 152Eu, 137Cs, and 60Co (see Tables 1 and 2).
The photopeak efficiencies were obtained experimentallyby using (9) as follows:
𝜀 (𝐸) = 𝑁 (𝐸)𝑡 ⋅ 𝐴𝑆 ⋅ 𝑃 (𝐸) ∏𝐶𝑖, (9)
where𝑁(𝐸) is the counts number in the photopeak (obtainedusing Genie 2000 software), 𝑡 is the time of measurement

Science and Technology of Nuclear Installations 3
L
h
S
R2
R1
1
23
4
d4
d5
d2
d1
(a) Case 1. 𝜃2 > 𝜃3 > 𝜃1 > 𝜃4
L
h
S
R2
R1
1
23
4
d4
d3 d1
d5
(b) Case 2. 𝜃2 > 𝜃3 > 𝜃4 > 𝜃1
Figure 2: The two possible cases of the photon path lengths.
② 3.0 photomultiplier tube③ Bicron proprietary optical coupling
④ Aluminum housing with well: chrome finish⑤ MU-metal light shield: chrome finish⑥ Light shield grounded to pin 14 (cathode) performance: PHR ≤ 9.0% for Cs 137
①
①②③
④⑤⑥
2.312 ± 0.010
3.250 ± 0.010
0.062 MAX
8.750 ± 0.031
2.062
0.656+0.010−0.000
3.178
Crystal 7.62 × 7.62 =G2 NaI(Tl)
Figure 3: The manufactory diagram of 7.62 × 7.62 cm2 well-type NaI(Tl) scintillation detector.
Table 1: PTB radioactive sources activities and their uncertainties.
PTBNuclide
ActivitykBq
UncertaintykBq
152Eu 290.0 ±4.0137Cs 385.0 ±4.060Co 212.1 ±1.5
(in seconds), 𝑃(𝐸) is the photon branching ratio at energy 𝐸,𝐴𝑆 is the nuclide activity, and 𝐶𝑖 are the correction factorsbecause of coincidence summing corrections, radionuclidedecay, and dead time. The decay correction (𝐶𝑑) was givenby
𝐶𝑑 = 𝑒𝜆⋅Δ𝑇, (10)
4 Science and Technology of Nuclear Installations
Table 2: Specifications of the radionuclides.
PTBNuclide
EnergykeV
Emissionprobability
%
Half LifeDays
152Eu
121.78 28.4
4943.29
244.69 7.49344.28 26.6778.90 12.96964.13 14.01408.01 20.87
137Cs 661.66 85.21 11004.98
60Co 1173.23 99.9 1925.311332.50 99.982
where 𝜆 is the decay constant and Δ𝑡 is the time intervalbetween the source decay time and the run time. The mainsource of uncertainty in the efficiency calculations was theuncertainties of the activities of the standard source solutions.The uncertainty in the photopeak efficiency, 𝜎𝜀, was given by
𝜎𝜀= 𝜀⋅ √( 𝜕𝜀𝜕𝐴)
2 ⋅ 𝜎𝐴2 + ( 𝜕𝜀𝜕𝑃)2 ⋅ 𝜎𝑃2 + ( 𝜕𝜀𝜕𝑁)2 ⋅ 𝜎𝑁2,
(11)
where the uncertainties 𝜎𝐴, 𝜎𝑃, and, 𝜎𝑁 are linked with thequantities 𝐴𝑆, 𝑃(𝐸), and 𝑁(𝐸), respectively. The percentageof deviation among the calculated and measured efficienciesis given by
Δ% = 𝜀Th − 𝜀Exp𝜀Th × 100, (12)
where 𝜀Th and 𝜀Exp are the theoretically and experimentallymeasured efficiencies, respectively.
3. Energy Calibrations and Resolution
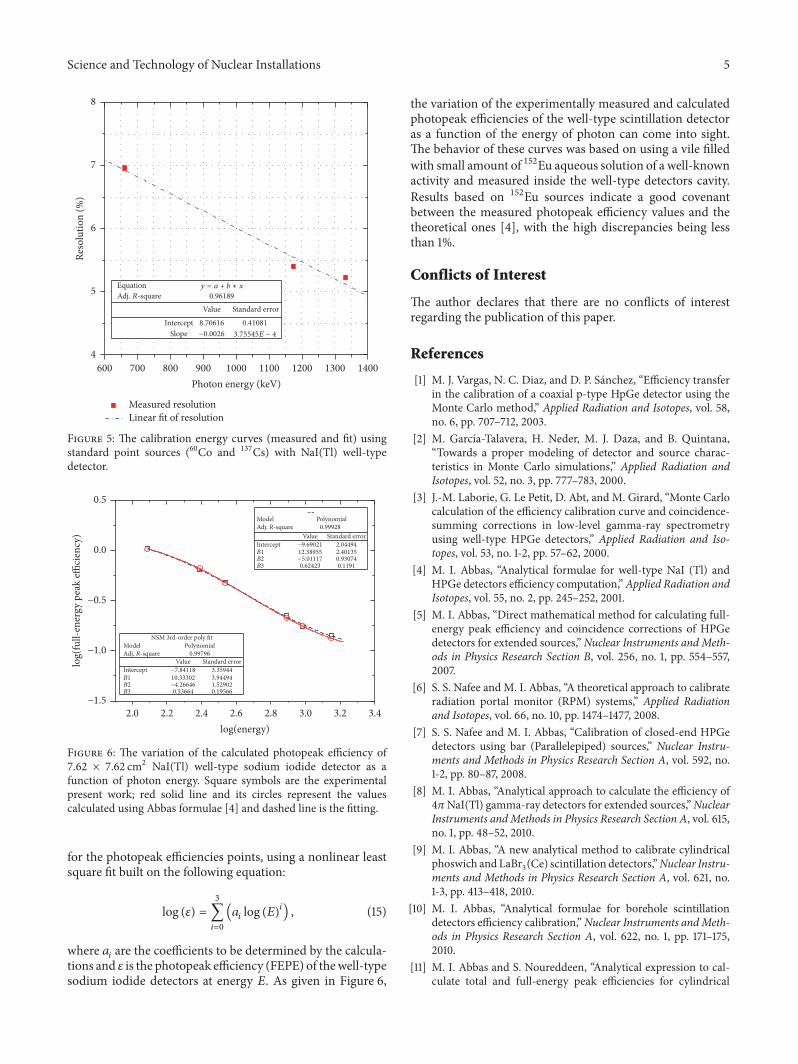
The detection system must be calibrated before the use inradiation detection to hide channel number to energy scale.The energy, shape, and efficiency calibration of the NaI(Tl)well-type detector was a procedure occasionally made toestablish the linking between the energy of the photon, thechannel number, and the detector efficiency. This processwas done by using Osprey Universal Digital MultichannelAnalyzer Base for scintillation spectrometry, where afterthe identification of the energy using standard sources, theefficiency values were calculated considering the probabilityof disintegration for each energy. The typical energy andshape calibration of the amplitudes from standard (60Co and137Cs) radioactive sources used for calibration at position25 cm are shown in Figures 4 and 5. The NaI(Tl) well-typedetector energy resolutionwas found to be∼6.9% for 662 keVgammas from 137Cs.The relation between the energy and the
Measured energyLinear fit of energy
Reduced Chi-S 0.09133Adj. R-square 1
Value Standard errora −41.47075 0.69137b 2.94174 0.00179
100 200 300 400 500 6000Channel number
0
200
400
600
800
1000
1200
1400
1600
Phot
on en
ergy
(keV
)
--
Equation y = a + b ∗ x
Figure 4: The calibration energy curves (measured and fit) usingstandard point sources (60Co and 137Cs) with NaI(Tl) well-typedetector.
channel number (𝑋) is a first-degree polynomial and can begiven by
𝐸 = 𝑎 + 𝑏 ⋅ 𝑋, (13)
where 𝐸 is the 𝛾-ray energy in keV and 𝑋 is the spectralchannel number of the center of the peak correspondingto the energy 𝐸, while the parameters 𝑎 = −41.47075 and𝑏 = 2.94174 are constants to be calculated by the energycalibration process.
The resolution (FWHM) calibration curve was estab-lished as a role to pronounce the peak width against thespectral energy. It is considered as significant limit illustratingthe system act in separating different photon emissions inan energy range, The relation between the FWHM and theenergy is a first-degree polynomial and can be given by
FWHM [keV] = 𝑎 + 𝑏 ⋅ 𝐸, (14)
while the parameters 𝑎 = 8.70616 and 𝑏 = −0.00269 areconstants to be calculated by the shape calibration process.
4. Results and Conclusions
The well-type sodium iodide detector photopeak efficiency(FEPE) was measured and compared with the calculatedvalues.The disparity of efficiency with the photon energy wasalso investigated. The overall efficiency curves are obtainedby fitting a polynomial logarithmic function of third order
Science and Technology of Nuclear Installations 5
Measured resolutionLinear fit of resolution
Adj. R-square 0.96189Value Standard error
Intercept 8.70616 0.41081Slope −0.0026
4
5
6
7
8
Reso
lutio
n (%
)
700 800 900 1000 1100 1200 1300 1400600Photon energy (keV)
3.75545E − 4
Equation y = a + b ∗ x
Figure 5: The calibration energy curves (measured and fit) usingstandard point sources (60Co and 137Cs) with NaI(Tl) well-typedetector.
NSM 3rd-order poly fitModel PolynomialAdj. R-square 0.99796
Value Standard errorIntercept −7.84118 3.35944B1 10.33302 3.94494B2 −4.26646 1.52902B3 0.53664 0.19566
Model PolynomialAdj. R-square 0.99928
Value Standard errorIntercept −9.69021 2.04494B1 12.38955 2.40135B2 −5.01117 0.93074B3 0.62423 0.1191
−1.5
−1.0
−0.5
0.0
0.5
log(
full-
ener
gy p
eak
effici
ency
)
2.2 2.4 2.6 2.8 3.0 3.2 3.42.0log(energy)
--
Figure 6: The variation of the calculated photopeak efficiency of7.62 × 7.62 cm2 NaI(Tl) well-type sodium iodide detector as afunction of photon energy. Square symbols are the experimentalpresent work; red solid line and its circles represent the valuescalculated using Abbas formulae [4] and dashed line is the fitting.
for the photopeak efficiencies points, using a nonlinear leastsquare fit built on the following equation:
log (𝜀) = 3∑𝑖=0
(𝑎𝑖 log (𝐸)𝑖) , (15)
where 𝑎𝑖 are the coefficients to be determined by the calcula-tions and 𝜀 is the photopeak efficiency (FEPE) of thewell-typesodium iodide detectors at energy 𝐸. As given in Figure 6,
the variation of the experimentally measured and calculatedphotopeak efficiencies of the well-type scintillation detectoras a function of the energy of photon can come into sight.The behavior of these curves was based on using a vile filledwith small amount of 152Eu aqueous solution of a well-knownactivity and measured inside the well-type detectors cavity.Results based on 152Eu sources indicate a good covenantbetween the measured photopeak efficiency values and thetheoretical ones [4], with the high discrepancies being lessthan 1%.
Conflicts of Interest
The author declares that there are no conflicts of interestregarding the publication of this paper.
References
[1] M. J. Vargas, N. C. Diaz, and D. P. Sanchez, “Efficiency transferin the calibration of a coaxial p-type HpGe detector using theMonte Carlo method,” Applied Radiation and Isotopes, vol. 58,no. 6, pp. 707–712, 2003.
[2] M. Garcıa-Talavera, H. Neder, M. J. Daza, and B. Quintana,“Towards a proper modeling of detector and source charac-teristics in Monte Carlo simulations,” Applied Radiation andIsotopes, vol. 52, no. 3, pp. 777–783, 2000.
[3] J.-M. Laborie, G. Le Petit, D. Abt, and M. Girard, “Monte Carlocalculation of the efficiency calibration curve and coincidence-summing corrections in low-level gamma-ray spectrometryusing well-type HPGe detectors,” Applied Radiation and Iso-topes, vol. 53, no. 1-2, pp. 57–62, 2000.
[4] M. I. Abbas, “Analytical formulae for well-type NaI (Tl) andHPGe detectors efficiency computation,”Applied Radiation andIsotopes, vol. 55, no. 2, pp. 245–252, 2001.
[5] M. I. Abbas, “Direct mathematical method for calculating full-energy peak efficiency and coincidence corrections of HPGedetectors for extended sources,”Nuclear Instruments and Meth-ods in Physics Research Section B, vol. 256, no. 1, pp. 554–557,2007.
[6] S. S. Nafee andM. I. Abbas, “A theoretical approach to calibrateradiation portal monitor (RPM) systems,” Applied Radiationand Isotopes, vol. 66, no. 10, pp. 1474–1477, 2008.
[7] S. S. Nafee and M. I. Abbas, “Calibration of closed-end HPGedetectors using bar (Parallelepiped) sources,” Nuclear Instru-ments and Methods in Physics Research Section A, vol. 592, no.1-2, pp. 80–87, 2008.
[8] M. I. Abbas, “Analytical approach to calculate the efficiency of4𝜋NaI(Tl) gamma-ray detectors for extended sources,”NuclearInstruments andMethods in Physics Research Section A, vol. 615,no. 1, pp. 48–52, 2010.
[9] M. I. Abbas, “A new analytical method to calibrate cylindricalphoswich andLaBr3(Ce) scintillation detectors,”Nuclear Instru-ments and Methods in Physics Research Section A, vol. 621, no.1-3, pp. 413–418, 2010.
[10] M. I. Abbas, “Analytical formulae for borehole scintillationdetectors efficiency calibration,”Nuclear Instruments andMeth-ods in Physics Research Section A, vol. 622, no. 1, pp. 171–175,2010.
[11] M. I. Abbas and S. Noureddeen, “Analytical expression to cal-culate total and full-energy peak efficiencies for cylindrical

6 Science and Technology of Nuclear Installations
phoswich and lanthanum bromide scintillation detectors,”Radiation Measurements, vol. 46, no. 4, pp. 440–445, 2011.
[12] M. S. Badawi, I. Ruskov, M. M. Gouda et al., “A numericalapproach to calculate the full-energy peak efficiency of HPGewell-type detectors using the effective solid angle ratio,” Journalof Instrumentation, vol. 9, no. 7, p. P07030, 2014.
[13] M. I. Abbas, M. S. Badawi, I. N. Ruskov et al., “Calibration of1 single hexagonal NaI(Tl) detector using a new numericalmethod based on the efficiency transfer method,” NuclearInstruments andMethods in Physics Research Section A, vol. 771,pp. 110–114, 2015.
[14] M. I. Abbas, S. Hammoud, T. Ibrahim, and M. Sakr, “Analyticalformulae to calculate the solid angle subtended at an arbitrarilypositioned point source by an elliptical radiation detector,”Nuclear Instruments and Methods in Physics Research Section A,vol. 771, pp. 121–125, 2015.
[15] A. Hamzawy, D. N. Grozdanov, M. S. Badawi et al., “Newnumerical simulationmethod to calibrate the regular hexagonalNaI(Tl) detector with radioactive point sources situated non-axial,” Review of Scientific Instruments, vol. 87, no. 11, Article ID115105, 2016.
[16] M. I. Abbas, M. M. Gouda, M. S. Badawi, and A. M. El-Khatib,“Direct mathematical solutions for the gamma-ray detectorsgeometrical andtotal efficiencies integrable formulae,” Journalof Engineering Science & Technology, vol. 12, no. 3, pp. 701–715,2017.
[17] S. F. Noureldine, M. S. Badawi, and M. I. Abbas, “A hybridanalytical-numerical method for efficiency calculations ofspherical scintillation NaI(Tl) detectors and arbitrarily locatedpoint sources,” Nuclear Technology and Radiation Protection,vol. 32, no. 2, pp. 140–147, 2017.

Hindawiwww.hindawi.com Volume 2018
Nuclear InstallationsScience and Technology of
TribologyAdvances in
Hindawiwww.hindawi.com Volume 2018
International Journal of
AerospaceEngineeringHindawiwww.hindawi.com Volume 2018
OpticsInternational Journal of
Hindawiwww.hindawi.com Volume 2018
Antennas andPropagation
International Journal of
Hindawiwww.hindawi.com Volume 2018
Power ElectronicsHindawiwww.hindawi.com Volume 2018
Advances in
CombustionJournal of
Hindawiwww.hindawi.com Volume 2018
Journal of
Hindawiwww.hindawi.com Volume 2018
Renewable Energy
Acoustics and VibrationAdvances in
Hindawiwww.hindawi.com Volume 2018
EnergyJournal of
Hindawiwww.hindawi.com Volume 2018
Hindawiwww.hindawi.com
Journal ofEngineeringVolume 2018
Hindawiwww.hindawi.com Volume 2018
International Journal ofInternational Journal ofPhotoenergy
Hindawiwww.hindawi.com Volume 2018
Solar EnergyJournal of
Hindawiwww.hindawi.com Volume 2018
Shock and Vibration
Hindawiwww.hindawi.com Volume 2018
Advances in Condensed Matter Physics
International Journal of
RotatingMachinery
Hindawiwww.hindawi.com Volume 2018
Hindawiwww.hindawi.com Volume 2018
High Energy PhysicsAdvances in
Hindawiwww.hindawi.com Volume 2018
Active and Passive Electronic Components
Hindawi Publishing Corporation http://www.hindawi.com Volume 2013Hindawiwww.hindawi.com
The Scientific World Journal
Volume 2018
Submit your manuscripts atwww.hindawi.com


![Radiation Background Studies for Neutrinoless Double …tin.tin/People/neha_thesis.pdf · Radiation Background Studies for Neutrinoless Double Beta Decay ... -NaI[Tl] Phoswich detector](https://static.fdocuments.in/doc/165x107/5b3175b47f8b9a744a8bc8d5/radiation-background-studies-for-neutrinoless-double-tintinpeopleneha-radiation.jpg)


![Particle Detection via Luminescenceschleper/lehre/Det_Dat/SS_2018/02...Inorganic Crystals – Light Output Intensity [a.u.] Wavelength [nm] Scintillation Spectrum for NaI and CsI NaI(Tl)](https://static.fdocuments.in/doc/165x107/5f969d5fe2968b3c6c19b815/particle-detection-via-luminescence-schleperlehredetdatss201802-inorganic.jpg)