Calibration of angle standards Report Final - BIPM · Calibration of angle standards Report ... SIM...
42
SIM L-K3 Final Report Page 1 of 42 Key Comparison SIM.L-K3.2008 Calibration of angle standards Report – Final Mr.Luiz Henrique Brum Vieira (INMETRO), Dr. Jack Stone (NIST), Dr. Miguel Viliesid (CENAM), Mr. Bruno R. Gastaldi (INTI), Ms. Joanna Przybylska (GUM), Dr. K. P Chaudhary (NPL-India). INMETRO, Jun 2015
Transcript of Calibration of angle standards Report Final - BIPM · Calibration of angle standards Report ... SIM...

SIM L-K3 Final Report Page 1 of 42
Key Comparison
SIM.L-K3.2008
Calibration of angle standards
Report – Final
Mr.Luiz Henrique Brum Vieira (INMETRO),
Dr. Jack Stone (NIST), Dr. Miguel Viliesid (CENAM),
Mr. Bruno R. Gastaldi (INTI), Ms. Joanna Przybylska (GUM),
Dr. K. P Chaudhary (NPL-India).
INMETRO, Jun 2015

SIM L-K3 Final Report Page 2 of 42
Contents
Contents ....................................................................................................................................................... 2
1 Introduction ......................................................................................................................................... 3
2 Organization ....................................................................................................................................... 3
2.1 Participants .................................................................................................................................. 3
2.2 Schedule ..................................................................................................................................... 4
3 Standards ........................................................................................................................................... 4
4 Measurement instructions and reporting of results ............................................................................ 5
5 Measurement methods and instruments used by the participants ..................................................... 6
6 Stability and condition of the gauges.................................................................................................. 6
6.1 Stability of the gauges ................................................................................................................. 6
6.2 Condition of the gauges .............................................................................................................. 8
7 Measurement results, as reported by participants ............................................................................. 8
7.1 Polygon: Deviation from nominal angle in the Normal position................................................... 8
7.2 Polygon: Deviation from nominal angle in Inverted position. .................................................... 15
7.3 Angle blocks: Deviation from nominal angle ............................................................................. 21
8 Measurement uncertainties .............................................................................................................. 25
8.1 Model equations ........................................................................................................................ 25
9 Analysis of the reported results ........................................................................................................ 26
9.1 Weighted mean, internal and external uncertainties and the Birge ratio test ........................... 27
9.2 Polygon: Calculations and discussions ..................................................................................... 28
9.3 Polygons: Calculations and discussions, excluding outliers ..................................................... 30
9.4 Polygons: Calculation of KCRV, excluding outliers ................................................................... 32
9.5 Polygons: Calculation of Degrees of Equivalence .................................................................... 32
9.6 Angle blocks: Calculations and discussions.............................................................................. 34
9.7 Angle blocks: Calculations and discussions, excluding outliers ............................................... 38
9.8 Angle blocks: Calculation of KCRV, excluding outliers ............................................................. 40
9.9 Angle blocks: Calculation of Degrees of Equivalence ............................................................... 41
10 Conclusions ...................................................................................................................................... 42
11 Acknowledgements .......................................................................................................................... 42
12 References ....................................................................................................................................... 42

SIM L-K3 Final Report Page 3 of 42
1 Introduction
The metrological equivalence of national measurement standards and calibration certificates issued by national metrology institutes is established by a set of key comparisons chosen and organised by the Consultative Committees of the CIPM or by the regional metrology organisations in collaboration with the Consultative Committees.
In 2000, a CCL-K3 key comparison (optical polygon and angle blocks) was started, piloted by NMISA (former CSIR-NML).
Based on this model, in 2007, the SIM metrological region started a SIM.L-K3 key comparison piloted by INMETRO.
The results of this regional comparison (RMO key comparison) contribute to the Mutual Recognition Arrangement (MRA) between the national metrology institutes of the Metre Convention. It is linked with the CCL-K3 key comparison via laboratories that participated in both, the CIPM and the RMO comparisons. This common participation establishes the link between the comparisons and ensures equivalence of national metrology institutes, according to the MRA between NMIs. The SIM NMIs which took part on the CCL-K3 were NIST, NRC and CENAM. However, NRC withdrew from the SIM.L-K3 comparison.
GUM from Poland (EURAMET) and NPLI from India (APMP) were invited to participate in the SIM.L-K3 key comparison.
2 Organization
According to the rules set up by the CIPM [1], a detailed technical protocol was drafted and distributed to the participants to express their opinion. The technical protocol and this report were based on the corresponding
documents for the key comparison CCL-K3 [2]. The technical protocol was sent to all participants before starting the comparison.
2.1 Participants
The comparison was a circulation of artifacts scheduled in accordance with the participants’ availability.
Prior to beginning the artifacts’ circulation, the pilot laboratory performed its initial measurements. After the artifacts’ circulation, the pilot laboratory performed its final measurements.
The list of participants is given in Table 1, below.
Pilot Laboratory
Mr. Luiz H. B. Vieira
Instituto Nacional de Metrologia, Qualidade e Tecnologia (INMETRO) Av. N. Sra. das Graças, 50 Xerém - D. Caxias - RJ CEP: 20250-020 - BRAZIL
Tel: + 55 212679 9020 / 9045 Fax + 55 212679 1505 e-mail: [email protected]
SIM
Dr. Miguel Viliesid
Centro Nacional de Metrologia (CENAM) Apartado Postal 1-100 - Centro 7600 Queretaro, Qro - MEXICO
Tel: 52 42 11 0574 Fax: 52 42 11 0577 e-mail: [email protected]
Dr. Jack Stone National Institute of Standards and Technology (NIST) Metrology (220) Room B113, 100 Bureau Drive, Stop 8211 Gaithersburg, MD, 20899-8211 USA
Tel: 1 301 975 5638 Fax: 1 301 869 0822 e-mail: [email protected]
Mr. Bruno R. Gastaldi
Instituto Nacional de Tecnología Industrial (INTI). Av. Vélez Sarsfield 1561 CP.: X5000JKC. Córdoba, Córdoba - Argentina
Tel: 54 0351 4684835/4681662 Fax: 54 0351 4699459/4681021 e-mail: [email protected]
EURAMET
Ms. Joanna Przybylska
Central Office of Measures (GUM) 2, Elektoralna Str. 00-139 Warsaw, Poland
Tel: 48 22 581 9558 Fax: 48 22 620 83 78
e-mail: [email protected]

SIM L-K3 Final Report Page 4 of 42
APMP
Dr. K. P Chaudhary
National Physical Laboratory (NPL-India) Dr. K.S. Krishnan Road, New Delhi - 110012 - India
Tel: 0091-11-25732865 Fax: 0091-11-25726938 e-mail: [email protected]
Table 1 Participating laboratories
Note: INMS/NRC from Canada took part in the comparison, but later asked the pilot to withdraw its measurement results. At the time when they requested that the results be withdrawn, NRC had stopped angle calibration activities and had withdrawn their angle CMCs .
2.2 Schedule
Four weeks were allocated to each laboratory to make all needed measurements and two weeks to send the artefacts to the next participant.
The schedule was organized to ensure enough time for the laboratories run their measurements, but due to delays caused in transport and customs during shipment of the artefacts between laboratories, a longer time was necessary than the pre-scheduled one.
The final circulation schedule is in table 2 below.
Region Laboratory Start Date
SIM (Pilot laboratory) INMETRO 21 January 2008
SIM CENAM 30 June 2008
SIM NIST 12 August 2008
APMP NPL (India) 10 October 2008
EURAMET GUM 17 December 2008
SIM INTI 12 February 2009
SIM (Pilot laboratory) INMETRO 10 November 2009*
Table 2 Final circulation’s schedule of the comparison.
*The measurement period of INMS/NRC was removed from the table above. Therefore, the time lapse between the artefacts exit from INTI and their arrival at INMETRO was relatively large.
3 Standards
3.1 The artefacts to be measured consisted of a 12-sided optical polygon and 4 angle blocks.
3.2 Four angle blocks, 5"; 30"; 5' and 5° were used to test the Calibration and Measurement Capabilities (CMC) of the laboratories to demonstrate the extreme of their calibration range. The angle blocks were chrome carbide (“CROBLOX”) manufactured by “Starrett / Webber Gage Division” and all of them had the serial number 3ZP24. The angle blocks had measuring faces of 25 mm x 51 mm.
3.3 The optical polygon, serial number 10.1168 OP 10, was also manufactured by “Starrett / Webber Gage Division” and made of chrome carbide (“CROBLOX”). It had 12 measuring faces of 14.5 mm x 16 mm each. The polygon had a center hole of 25.4 mm for mounting purposes and a thickness of 17.5 mm. The polygon was used to test the Calibration and Measurement Capabilities (CMCs) of the laboratories.
3.4 The angle blocks had to be measured using an aperture, which was 1 mm less (on the edge) than the overall face.

SIM L-K3 Final Report Page 5 of 42
3.5 Drawing:
Figure 1: Schematic drawing of the polygon. The pitch angles i are the angles between the projections of two adjacent normals Ni-1 and Ni in the measuring plane with the counting index (i=1, 2,...,n). The deviations of the pitch angles from their nominal values of 360°/n are referred to as pitch angle deviations.
The standards were stowed in two separated original boxes and both fitted in a custom-made box to be transported. The box for transportation was manufactured of wood and filled with high-density foam sculpted to a tight fit to each one of the original boxes, in order to prevent any motion thereof.
With these precautions adopted, the standards were not damaged during transportation between laboratories.
4 Measurement instructions and reporting of results
Before calibration, each laboratory had to inspect the artifacts to check possible damage on the measurement surfaces. In the case of detecting scratches, rusty spots or other kind of damage this had to be documented by forms appended to the technical protocol. This document, describing the damages, was sent to the pilot laboratory.
The protocol recommended that both normal and inverted orientations should be measured and the two measurements would be treated as independent results. This procedure and analysis were adopted because of the interest in observing a poorly-understood source of error, as far as in some circumstances these results have different values.
It is believed that a combination of imperfections in surface figure interacting with imperfections of the autocollimator can give rise to different results for the two orientations, but the effect is not well understood, and it is therefore of interest to see results for both orientations. It is clear, however, that the physical angle between two surfaces is independent of the normal/inverted orientation, and the average of the two results is a better indicator of the physical angle than is either individual result.
In summary, it is unclear if the individual results for the two orientations or the average of the two gives a better indicator of typical calibration performance, as this depends on the practices of individual laboratories. In any event the analysis for the SIM L-K3 comparison must be carried out in according with the previously agreed on protocol.

SIM L-K3 Final Report Page 6 of 42
5 Measurement methods and instruments used by the participants
A wide variety of instruments and techniques were used to make measurements. The details of these instruments are recorded in Table 3 with the uncertainties of the equipment appearing in brackets. Nothing had been recommended related to uncertainty’s limitations that should be declared by the participants.
For the movement of the polygon/angle block, the majority of the participants used index tables (Moore), with a few exceptions where laboratories used other devices such as the RT 400 (GUM) and AG Davis AAMACS (NIST). For the measurements of the deviations from nominals, all laboratories used autocollimators.
Laboratory Autocollimator/Interferometer (uncertainty in seconds)
Table (uncertainty in seconds)
CENAM (México)
Rank Taylor Hobson DA 20 (0.035) Rank Taylor Hobson DA 400 (0.11)
Moore 1440 Mec. (0.06) Moore 1440 Hydr. (0.06)
NIST (USA)
Möller-Wedel Elcomat 2000 (0.03) Möller-Wedel Elcomat HR (0.03)
Moore 1440 Hydr. (0.073) AG Davis AAMACS (0.01)
GUM (Poland)
Möller-Wedel Elcomat HRC (0.0035)
RT 400 UP (RON 905 Heidenhain) (0.002)
NPLI (India)
Möller-Wedel Elcomat 2000 (0.015)
Moore 1440 (0.05)
INTI (Argentina)
Rank Taylor Hobson DA 400 (0.07)
Moore 1440 (0.2)
INMETRO (Brazil)
Leitz Wetzlar Photoeletric Autocolimator (0.1) Moore 1440 Hydr. (0.15)
Table 3 Measurement instruments and their uncertainties (k=1) as reported by the participating laboratories.
6 Stability and condition of the gauges
6.1 Stability of the gauges
In order to evaluate the stability of the gauges, INMETRO made measurements before starting the comparison and at the end of it, using the same reference equipment.
Graph 1(a) Stability of the polygon in the normal position
-0,60
-0,40
-0,20
0,00
0,20
0,40
0,60
0,80
1,00
before
after
1-2 2-3 3-4 4-5 5-6 6-7 7-8 8-9 9-10 10-11 11-12 12-1
Stability of the Polygon (Normal position)
Faces
Devia
tio
n f
rom
n
om
inal
an
gle
(seco
nd
s)

SIM L-K3 Final Report Page 7 of 42
Graph 1(b) Stability of the polygon in inverted position
Results obtained by the pilot laboratory are shown in the graphs 1(a) and 1(b). The graphs show the deviation from the nominal values for each polygon angle, as measured before starting of the circulation of the gauges and at the end of the comparison. Considering the 0.15” standard uncertainty of the measurements, the data are consistent with the assumption that the polygon was stable. The stability of the angular blocks was also measured by the pilot laboratory. Graphs 2(a) and 2(b) show deviations from the nominal angle for each angular block before and after the circulation.
Graph 2(a) Stability of the angle blocks in normal position
-0,60
-0,40
-0,20
0,00
0,20
0,40
0,60
0,80
1,00
before
after
0
0.1
0.2
0.3
0.4
0.5
0.6
0.7
0.8
before after
1-2 2-3 3-4 4-5 5-6 6-7 7-8 8-9 9-10 10-11 11-12 12-13
Stability of the Polygon (Inverted position)
Faces
Devia
tio
n f
rom
n
om
inal
an
gle
(seco
nd
s)
5” 30” 5’ 5º
Stability of Angle Blocks (Normal position)
Angle Blocks
Devia
tio
n f
rom
n
om
inal
an
gle
(seco
nd
s)
SIM L-K3 Final Report Page 8 of 42
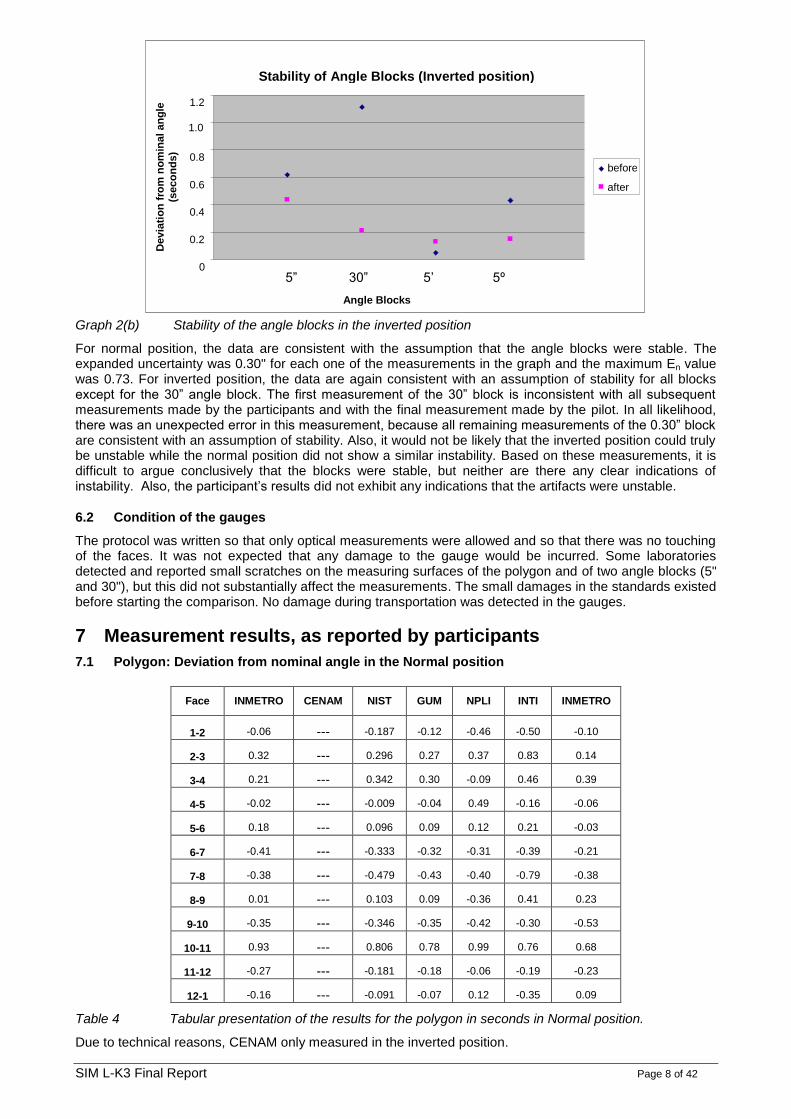
Graph 2(b) Stability of the angle blocks in the inverted position
For normal position, the data are consistent with the assumption that the angle blocks were stable. The expanded uncertainty was 0.30" for each one of the measurements in the graph and the maximum En value was 0.73. For inverted position, the data are again consistent with an assumption of stability for all blocks except for the 30” angle block. The first measurement of the 30” block is inconsistent with all subsequent measurements made by the participants and with the final measurement made by the pilot. In all likelihood, there was an unexpected error in this measurement, because all remaining measurements of the 0.30” block are consistent with an assumption of stability. Also, it would not be likely that the inverted position could truly be unstable while the normal position did not show a similar instability. Based on these measurements, it is difficult to argue conclusively that the blocks were stable, but neither are there any clear indications of instability. Also, the participant’s results did not exhibit any indications that the artifacts were unstable.
6.2 Condition of the gauges
The protocol was written so that only optical measurements were allowed and so that there was no touching of the faces. It was not expected that any damage to the gauge would be incurred. Some laboratories detected and reported small scratches on the measuring surfaces of the polygon and of two angle blocks (5" and 30"), but this did not substantially affect the measurements. The small damages in the standards existed before starting the comparison. No damage during transportation was detected in the gauges.
7 Measurement results, as reported by participants
7.1 Polygon: Deviation from nominal angle in the Normal position
Table 4 Tabular presentation of the results for the polygon in seconds in Normal position.
Due to technical reasons, CENAM only measured in the inverted position.
Face INMETRO CENAM NIST GUM NPLI INTI INMETRO
1-2 -0.06 --- -0.187 -0.12 -0.46 -0.50 -0.10
2-3 0.32 --- 0.296 0.27 0.37 0.83 0.14
3-4 0.21 --- 0.342 0.30 -0.09 0.46 0.39
4-5 -0.02 --- -0.009 -0.04 0.49 -0.16 -0.06
5-6 0.18 --- 0.096 0.09 0.12 0.21 -0.03
6-7 -0.41 --- -0.333 -0.32 -0.31 -0.39 -0.21
7-8 -0.38 --- -0.479 -0.43 -0.40 -0.79 -0.38
8-9 0.01 --- 0.103 0.09 -0.36 0.41 0.23
9-10 -0.35 --- -0.346 -0.35 -0.42 -0.30 -0.53
10-11 0.93 --- 0.806 0.78 0.99 0.76 0.68
11-12 -0.27 --- -0.181 -0.18 -0.06 -0.19 -0.23
12-1 -0.16 --- -0.091 -0.07 0.12 -0.35 0.09
0
0.2
0.4
0.6
0.8
1.0
1.2
before
after
5” 30” 5’ 5º
Stability of Angle Blocks (Inverted position)
Angle Blocks
Devia
tio
n f
rom
no
min
al an
gle
(seco
nd
s)

SIM L-K3 Final Report Page 9 of 42
Graphs 3(a) to 3(l) show all measurement results from the polygon in the normal position. The deviations from the nominal angles are given along with their combined standard uncertainties as reported by the participants. The INMETRO data presented in the graphs and used in the analysis are those results of their first measurement, in January 2008.
Graph 3(a) Results for the polygon, face 1 to 2 (error bars are combined standard uncertainty). INTI had measurement problems on face 2, as can be seen from the opposite deviation directions in graphs 3(a) and 3(b).
Graph 3(b) Results for the polygon, face 2 to 3 (error bars are combined standard uncertainty).
-1.00
-0.80
-0.60
-0.40
-0.20
0.00
0.20
-0.20
0.00
0.20
0.40
0.60
0.80
1.00
1.20
INMETRO NIST GUM NPLI INTI
Devia
tio
n f
rom
no
min
al an
gle
(seco
nd
s)
Polygon (face 1-2 – Normal position)
Laboratories
Polygon (face 2-3 – Normal position)
INMETRO NIST GUM NPLI INTI
Devia
tio
n f
rom
no
min
al an
gle
(seco
nd
s)
Laboratories

SIM L-K3 Final Report Page 10 of 42
Graph 3(c) Results for the polygon, face 3 to 4 (error bars are combined standard uncertainty). NPLI had measurement problems on face 4, as can be seen from the opposite deviation directions in graphs 3(c) and 3(d).
Graph 3(d) Results for the polygon, face 4 to 5 (error bars are combined standard uncertainty).
-0.60
-0.40
-0.20
0.00
0.20
0.40
0.60
0.80
-0.40
-0.20
0.00
0.20
0.40
0.60
0.80
1.00
Polygon (face 3-4 – Normal position)
INMETRO NIST GUM NPLI INTI
Devia
tio
n f
rom
no
min
al an
gle
(seco
nd
s)
Laboratories
Polygon (face 4-5 – Normal position)
INMETRO NIST GUM NPLI INTI
Devia
tio
n f
rom
no
min
al an
gle
(sec
on
ds)
Laboratories

SIM L-K3 Final Report Page 11 of 42
Graph 3(e) Results for the polygon, face 5 to 6 (error bars are combined standard uncertainty).
Graph 3(f) Results for the polygon, face 6 to 7 (error bars are combined standard uncertainty).
-0.30
-0.20
-0.10
0.00
0.10
0.20
0.30
0.40
0.50
0.60
-0.80
-0.70
-0.60
-0.50
-0.40
-0.30
-0.20
-0.10
0.00
0.10
0.20
Polygon (face 5-6 – Normal position)
INMETRO NIST GUM NPLI INTI
Devia
tio
n f
rom
no
min
al an
gle
(seco
nd
s)
Laboratories
INMETRO NIST GUM NPLI INTI
Devia
tio
n f
rom
no
min
al an
gle
(sec
on
ds)
Polygon (face 6-7 – Normal position)
Laboratories

SIM L-K3 Final Report Page 12 of 42
Graph 3(g) Results for the polygon, face 7 to 8 (error bars are combined standard uncertainty). INTI had measurement problems on face 8, as can be seen from the opposite deviation directions in graphs 3(g) and 3(h).
Graph 3(h) Results for the polygon, face 8 to 9 (error bars are combined standard uncertainty). NPLI had measurement problems on angle 8 - 9, as can be seen in graph.
-1.20
-1.00
-0.80
-0.60
-0.40
-0.20
0.00
0.20
-0.80
-0.60
-0.40
-0.20
0.00
0.20
0.40
0.60
0.80
INMETRO NIST GUM NPLI INTI
Devia
tio
n f
rom
no
min
al an
gle
(seco
nd
s)
Polygon face 7-8 – Normal position)
Laboratories
INMETRO NIST GUM NPLI INTI
Devia
tio
n f
rom
no
min
al an
gle
(seco
nd
s)
Polygon (face 8-9 – Normal position)
Laboratories

SIM L-K3 Final Report Page 13 of 42
Graph 3(i) Results for the polygon, face 9 to 10 (error bars are combined standard uncertainty).
Graph 3(j) Results for the polygon, face 10 to 11 (error bars are combined standard uncertainty).
-1.00
-0.80
-0.60
-0.40
-0.20
0.00
0.40
0.60
0.80
1.00
1.20
1.40
INMETRO NIST GUM NPLI INTI
Devia
tio
n f
rom
no
min
al an
gle
(seco
nd
s)
Polygon (face 9-10 – Normal position)
Laboratories
INMETRO NIST GUM NPLI INTI
Devia
tio
n f
rom
no
min
al an
gle
(sec
on
ds)
Polygon (face 10-11 – Normal position)
Laboratories

SIM L-K3 Final Report Page 14 of 42
Graph 3(k) Results for the polygon, face 11 to 12 (error bars are combined standard uncertainty).
Graph 3(l) Results for the polygon, face 12 to 1 (error bars are combined standard uncertainty).
-0.60
-0.40
-0.20
0.00
0.20
0.40
-0.60
-0.40
-0.20
0.00
0.20
0.40
0.60
INMETRO NIST GUM NPLI INTI
Devia
tio
n f
rom
no
min
al an
gle
(seco
nd
s)
Polygon (face 11-12 – Normal position)
Laboratories
INMETRO NIST GUM NPLI INTI
Devia
tio
n f
rom
no
min
al an
gle
(sec
on
ds)
Polygon (face 12-1 – Normal position)
Laboratories
SIM L-K3 Final Report Page 15 of 42
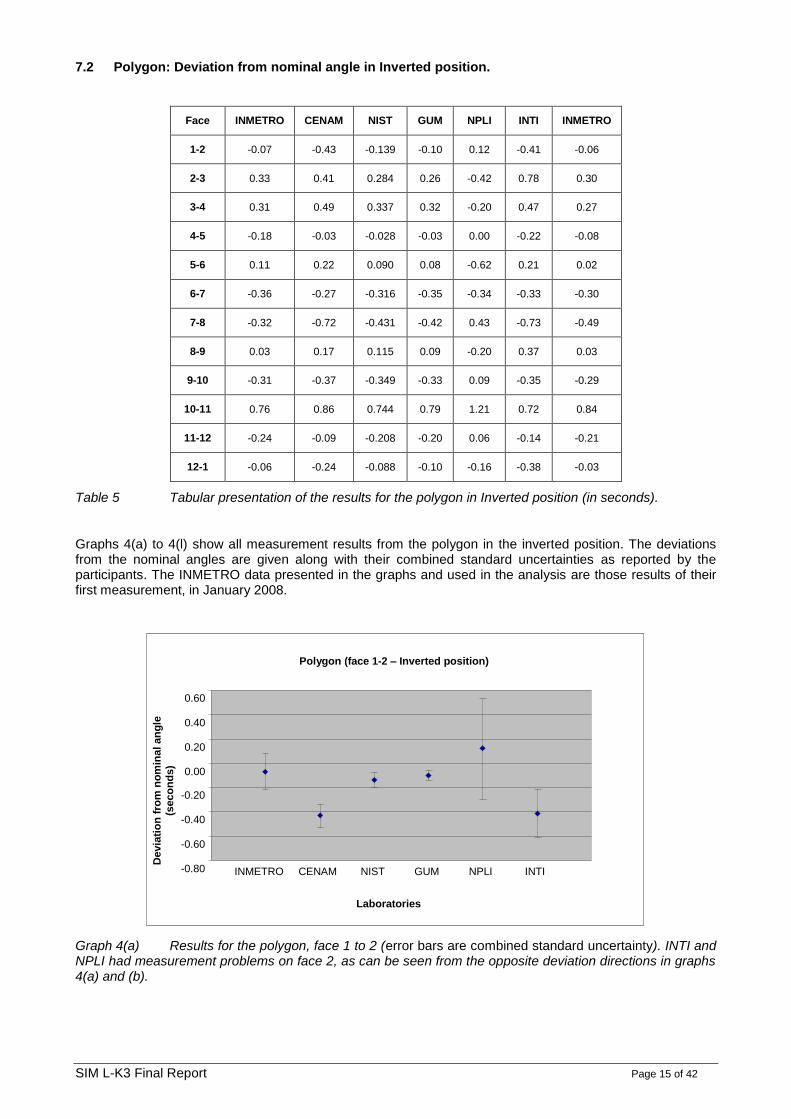
7.2 Polygon: Deviation from nominal angle in Inverted position.
Face INMETRO CENAM NIST GUM NPLI INTI INMETRO
1-2 -0.07 -0.43 -0.139 -0.10 0.12 -0.41 -0.06
2-3 0.33 0.41 0.284 0.26 -0.42 0.78 0.30
3-4 0.31 0.49 0.337 0.32 -0.20 0.47 0.27
4-5 -0.18 -0.03 -0.028 -0.03 0.00 -0.22 -0.08
5-6 0.11 0.22 0.090 0.08 -0.62 0.21 0.02
6-7 -0.36 -0.27 -0.316 -0.35 -0.34 -0.33 -0.30
7-8 -0.32 -0.72 -0.431 -0.42 0.43 -0.73 -0.49
8-9 0.03 0.17 0.115 0.09 -0.20 0.37 0.03
9-10 -0.31 -0.37 -0.349 -0.33 0.09 -0.35 -0.29
10-11 0.76 0.86 0.744 0.79 1.21 0.72 0.84
11-12 -0.24 -0.09 -0.208 -0.20 0.06 -0.14 -0.21
12-1 -0.06 -0.24 -0.088 -0.10 -0.16 -0.38 -0.03
Table 5 Tabular presentation of the results for the polygon in Inverted position (in seconds).
Graphs 4(a) to 4(l) show all measurement results from the polygon in the inverted position. The deviations from the nominal angles are given along with their combined standard uncertainties as reported by the participants. The INMETRO data presented in the graphs and used in the analysis are those results of their first measurement, in January 2008.
Graph 4(a) Results for the polygon, face 1 to 2 (error bars are combined standard uncertainty). INTI and NPLI had measurement problems on face 2, as can be seen from the opposite deviation directions in graphs 4(a) and (b).
-0.80
-0.60
-0.40
-0.20
0.00
0.20
0.40
0.60
INMETRO CENAM NIST GUM NPLI INTI
Devia
tio
n f
rom
no
min
al an
gle
(seco
nd
s)
Polygon (face 1-2 – Inverted position)
Laboratories

SIM L-K3 Final Report Page 16 of 42
Graph 4(b) Results for the polygon, face 2 to 3 (error bars are combined standard uncertainty).
Graph 4(c) Results for the polygon, face 3 to 4 (error bars are combined standard uncertainty). NPLI had measurement problems on angle 3 - 4, as can be seen in graph.
-1.00
-0.80
-0.60
-0.40
-0.20
0.00
0.20
0.40
0.60
0.80
1.00
-0.80
-0.60
-0.40
-0.20
0.00
0.20
0.40
0.60
0.80
INMETRO CENAM NIST GUM NPLI INTI
Devia
tio
n f
rom
no
min
al an
gle
(seco
nd
s)
Polygon (face 3-4 – Inverted position)
Laboratories
INMETRO CENAM NIST GUM NPLI INTI
Devia
tio
n f
rom
no
min
al an
gle
(seco
nd
s)
Polygon (face 2-3 – Inverted position)
Laboratories

SIM L-K3 Final Report Page 17 of 42
Graph 4 (d) Results for the polygon, face 4 to 5 (error bars are combined standard uncertainty).
Graph 4(e) Results for the polygon, face 5 to 6 (error bars are combined standard uncertainty). NPLI had measurement problems on angle 5 - 6, as can be seen in graph.
-0.60
-0.40
-0.20
0.00
0.20
0.40
0.60
-1.20
-1.00
-0.80
-0.60
-0.40
-0.20
0.00
0.20
0.40
0.60
INMETRO CENAM NIST GUM NPLI INTI
Devia
tio
n f
rom
no
min
al an
gle
(seco
nd
s)
Polygon (face 5-6 – Inverted position)
Laboratories
INMETRO CENAM NIST GUM NPLI INTI
Devia
tio
n f
rom
no
min
al an
gle
(seco
nd
s)
Polygon (face 4-5 – Inverted position)
Laboratories
SIM L-K3 Final Report Page 18 of 42
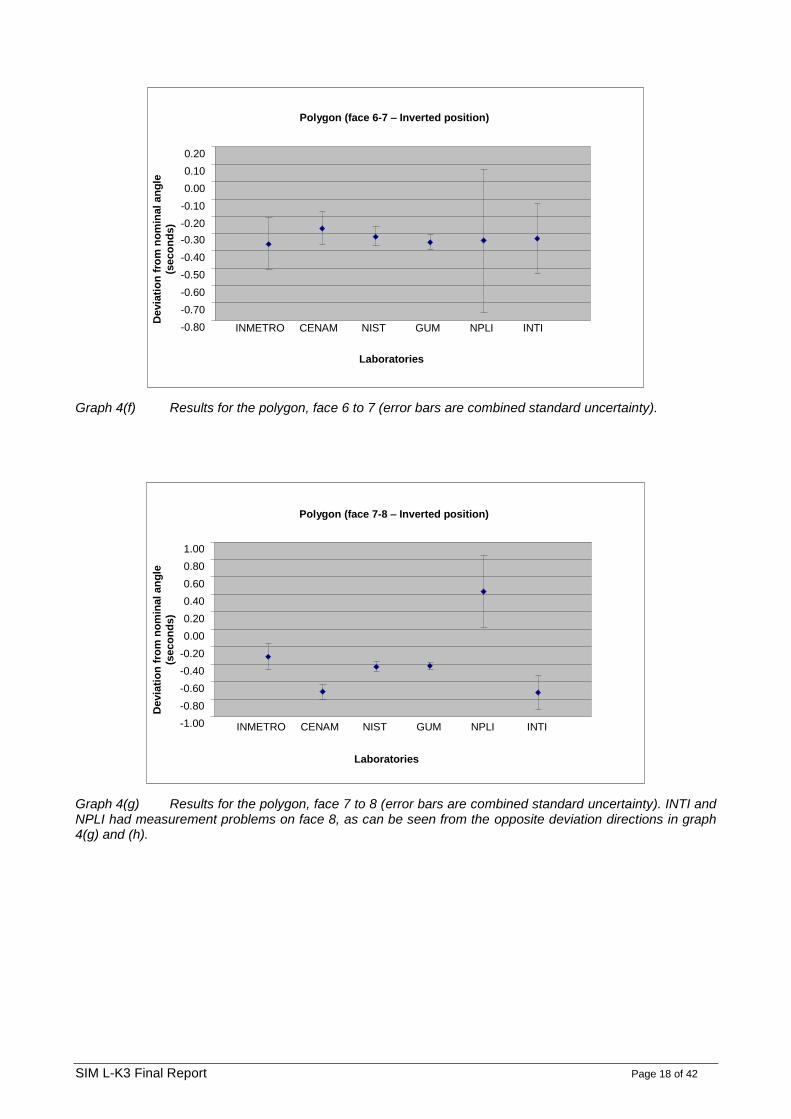
Graph 4(f) Results for the polygon, face 6 to 7 (error bars are combined standard uncertainty).
Graph 4(g) Results for the polygon, face 7 to 8 (error bars are combined standard uncertainty). INTI and NPLI had measurement problems on face 8, as can be seen from the opposite deviation directions in graph 4(g) and (h).
-0.80
-0.70
-0.60
-0.50
-0.40
-0.30
-0.20
-0.10
0.00
0.10
0.20
-1.00
-0.80
-0.60
-0.40
-0.20
0.00
0.20
0.40
0.60
0.80
1.00
INMETRO CENAM NIST GUM NPLI INTI
Devia
tio
n f
rom
no
min
al an
gle
(seco
nd
s)
Polygon (face 6-7 – Inverted position)
Laboratories
INMETRO CENAM NIST GUM NPLI INTI
Devia
tio
n f
rom
no
min
al an
gle
(seco
nd
s)
Polygon (face 7-8 – Inverted position)
Laboratories

SIM L-K3 Final Report Page 19 of 42
Graph 4(h) Results for the polygon, face 8 to 9 (error bars are combined standard uncertainty). INTI had measurement problems on angle 8 - 9, as can be seen in graph.
Graph 4(i) Results for the polygon, face 9 to 10 (error bars are combined standard uncertainty). NPLI had measurement problems on angle 9 -10, as can be seen in graph.
-0.80
-0.60
-0.40
-0.20
0.00
0.20
0.40
0.60
-0.60
-0.40
-0.20
0.00
0.20
0.40
0.60
INMETRO CENAM NIST GUM NPLI INTI
Devia
tio
n f
rom
no
min
al an
gle
(seco
nd
s)
Polygon (face 9-10 – Inverted position)
Laboratories
INMETRO CENAM NIST GUM NPLI INTI
Devia
tio
n f
rom
no
min
al an
gle
(seco
nd
s)
Polygon (face 8-9 – Inverted position)
Laboratories

SIM L-K3 Final Report Page 20 of 42
Graph 4(j) Results for the polygon, face 10 to 11 (error bars are combined standard uncertainty).
Graph 4(k) Results for the polygon, face 11 to 12 (error bars are combined standard uncertainty).
0.40
0.60
0.80
1.00
1.20
1.40
1.60
1.80
-0.40
-0.20
0.00
0.20
0.40
0.60
INMETRO CENAM NIST GUM NPLI INTI
Devia
tio
n f
rom
no
min
al an
gle
(seco
nd
s)
Polygon (face 11-12 – Inverted position)
Laboratories
INMETRO CENAM NIST GUM NPLI INTI
Devia
tio
n f
rom
no
min
al an
gle
(seco
nd
s)
Polygon (face 10-11 – Inverted position)
Laboratories

SIM L-K3 Final Report Page 21 of 42
Graph 4(l) Results for the polygon, face 12 to 1 (error bars are combined standard uncertainty).
7.3 Angle blocks: Deviation from nominal angle
Graphs 5(a) to 5(h) show all measurement results from the four angle blocks. The deviations from the nominal angles are given along with their combined standard uncertainties as reported by the participants. The INMETRO data presented in the graphs and used in the analysis are those results of their first measurement, in January 2008.
Angle block INMETRO CENAM NIST GUM NPLI INTI INMETRO
5" (normal) 0.69 0.60 0.46 0.52 0.73 0.44 0.39
5" (inverted) 0.62 0.26 0.52 0.50 0.56 0.48 0.44
Uncertainty 0.15 0.11 0.11 0.04 0.26 0.30 0.15
30” (normal) 0.57 0.24 0.28 0.26 0.44 0.27 0.26
30" (inverted) 1.11 0.11 0.28 0.27 0.40 0.31 0.21
Uncertainty 0.15 0.11 0.11 0.04 0.26 0.30 0.15
5' (normal) 0.06 0.92 0.33 0.31 0.36 0.36 0.11
5' (inverted) 0.05 0.87 0.45 0.33 0.38 0.33 0.13
Uncertainty 0.15 0.15 0.11 0.04 0.26 0.30 0.15
5° (normal) 0.44 0.52 0.41 0.42 0.45 0.36 0.14
5° (inverted) 0.43 0.24 0.48 0.41 0.53 0.40 0.15
Uncertainty 0.15 0.11 0.11 0.04 0.26 0.30 0.15
Table 6 Tabular presentation of the results for the four angle blocks in seconds. Uncertainties are combined standard uncertainties (k=1).
-0.60
-0.40
-0.20
0.00
0.20
0.40
INMETRO CENAM NIST GUM NPLI INTI
Devia
tio
n f
rom
no
min
al an
gle
(seco
nd
s)
Polygon (face 12-1 – Inverted position)
Laboratories

SIM L-K3 Final Report Page 22 of 42
Graph 5(a) Results for the angle block, 5 seconds (error bars are combined standard uncertainty).
Graph 5(b) Results for the angle block, 5 seconds (error bars are combined standard uncertainty). CENAM had measurement problems, as can be seen in graph.
0.00
0.20
0.40
0.60
0.80
1.00
0.00
0.20
0.40
0.60
0.80
1.00
INMETRO CENAM NIST GUM NPLI INTI
Devia
tio
n f
rom
no
min
al an
gle
(seco
nd
s)
Angle block 5 seconds (inverted)
Laboratories
Laboratories
INMETRO CENAM NIST GUM NPLI INTI
Devia
tio
n f
rom
no
min
al an
gle
(seco
nd
s)
Angle block 5 seconds (normal)

SIM L-K3 Final Report Page 23 of 42
Graph 5(c) Results for the angle block, 30 seconds (error bars are combined standard uncertainty). INMETRO had measurement problems, as can be seen in graph.
Graph 5(d) Results for the angle block, 30 seconds (error bars are combined standard uncertainty). INMETRO had measurement problems, as can be seen in graph.
-0.20
0.00
0.20
0.40
0.60
0.80
1.00
0.00
0.20
0.40
0.60
0.80
1.00
1.20
1.40
Devia
tio
n f
rom
no
min
al an
gle
(seco
nd
s)
Angle block 30 seconds (Normal)
INMETRO CENAM NIST GUM NPLI INTI
Devia
tio
n f
rom
no
min
al an
gle
(seco
nd
s)
Angle block 30 seconds (inverted)
Laboratories
INMETRO CENAM NIST GUM NPLI INTI
Laboratories

SIM L-K3 Final Report Page 24 of 42
Graph 5(e) Results for the angle block, 5 minutes (error bars are combined standard uncertainty). INMETRO and CENAM had measurement problems, as can be seen in graph.
Graph 5(f) Results for the angle block, 5 minutes (error bars are combined standard uncertainty). INMETRO and CENAM had measurement problems, as can be seen in graph.
Graph 5(g) Results for the angle block, 5 degrees (error bars are combined standard uncertainty).
-0.20
0.00
0.20
0.40
0.60
0.80
1.00
1.20
-0.20
0.00
0.20
0.40
0.60
0.80
1.00
0.00
0.20
0.40
0.60
0.80
INMETRO CENAM NIST GUM NPLI INTI
Devia
tio
n f
rom
no
min
al an
gle
(seco
nd
s)
Angle block 5 minutes (normal)
Laboratories
INMETRO CENAM NIST GUM NPLI INTI
Devia
tio
n f
rom
no
min
al an
gle
(seco
nd
s)
Angle block 5 minutes (inverted)
Laboratories
INMETRO CENAM NIST GUM NPLI INTI
Devia
tio
n f
rom
no
min
al an
gle
(seco
nd
s)
Angle block 5 degrees (normal)
Laboratories
SIM L-K3 Final Report Page 25 of 42
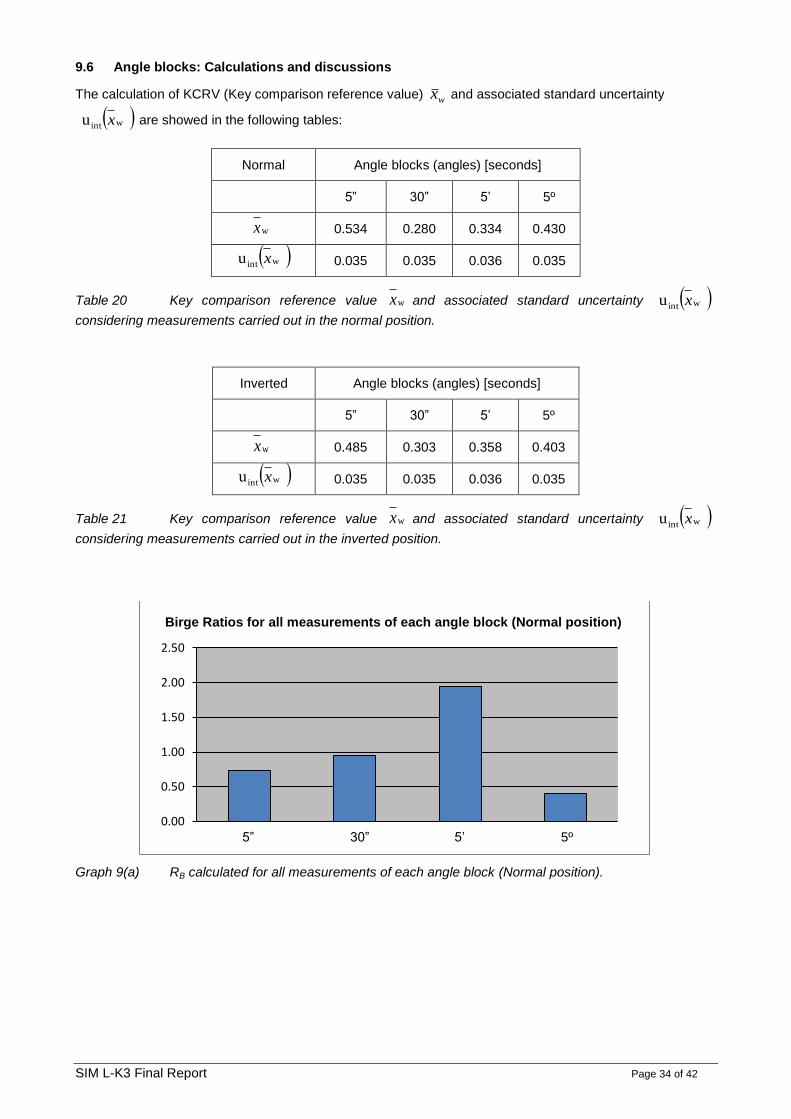
Graph 5(h) Results for the angle block, 5 degrees (error bars are combined standard uncertainty). CENAM had measurement problems, as can be seen in graph.
8 Measurement uncertainties
8.1 Model equations
The participants were asked (in the technical protocol) to estimate the uncertainty of measurement according to the ISO Guide to the Expression of Uncertainty in Measurement. An example of a mathematical model was given [2], but participants were encouraged to use their own. This was due to a variety of measurement techniques and equipment used, and some ambiguities in how the uncertainty budget should be constructed if it is based on this model. The majority of participants took the following contributions to the combined standard uncertainty into account: The pitch angle deviations are described by:
i = i - n
360 + AF + AP + AE (i = 2, 3, …, 12) (1)
i = Ç - § (2)
Where:
i the pitch angle
AF correction for flatness deviations of measuring face
AP correction for pyramidal errors of measuring face
AE correction for eccentricity errors in setup of polygon/angle block
§ autocollimator / interferometer reading
Ç index table reading
i measuring face index
In Table 7, the uncertainty contributions are summarised for all laboratories for the polygon. The uncertainties are given in seconds. Careful consideration of the measurement model was required before assigning values in table 7, and the precise meaning of some terms in the table may be subject to differing interpretations.
0.00
0.20
0.40
0.60
0.80
INMETRO CENAM NIST GUM NPLI INTI
Devia
tio
n f
rom
no
min
al an
gle
(seco
nd
s)
Angle block 5 degrees (inverted)
Laboratories

SIM L-K3 Final Report Page 26 of 42
Laboratory
§
Ç
AF
AP
AE
Repeat.
Combined standard
uncertainty
INMETRO (Brazil)
0.10
0.02
0.078
0.15
CENAM (Mexico)
0.035
0.031
0.080
0.004
0.007
0.093
NIST (USA)
0.025
0.003
0.03
0.012
0.004
0.041
0.058
NPLI (India)
0.015
0.050
0.030
0.030
0.030
0.400
0.410
GUM (Poland)
0.0035
0.01
0.00151
0.00306
0.0139
0.0266
0.037
INTI (Argentina)
0.07
0.20
0.200
Table 7 Standard uncertainties (in seconds) for the polygon quoted by the different laboratories for the different uncertainty contributions, and combined standard uncertainties calculated from these values. The value given in the table by the GUM is an approximation, but actually this laboratory gave different uncertainties for each face. The actual uncertainties given by the laboratory (and used in the analysis) were 0.037, 0.032, 0.035, 0.036, 0.034, 0.035, 0.034, 0.035, 0.032, 0.032, 0.036, and 0.040 respectively.
In Table 8, the uncertainty contributions are summarised for all laboratories for each angle block. The uncertainties are given in seconds.
Laboratory
§
Ç
AF
AP
AE
Repeat.
Combined standard
uncertainty
INMETRO (Brazil)
0.1
0.15
0.08
0.15
CENAM (Mexico)
0.035
0.06
0.031
0.042
0.05
0.03
0.11
NIST (USA)
0.08
0.013
0.06
0.02
0.03
0.107
NPLI (India)
0.015
0.050
0.030
0.020
0.020
0.25
0.26
GUM (Poland)
0.0035
0.01
0.0188
0.00306
0.013
0.0304
0.0414
INTI (Argentina)
0.07
0.20
0.30
Table 8 Standard uncertainties (in seconds) for the angle blocks quoted by the different laboratories with the different uncertainty contributions, and combined standard uncertainties calculated from these values.
Tables 7 and 8 show that uncertainties contributions are, in general, well specified. The laboratories stated uncertainty contributions inherent to the index table, to the autocollimator and to the repeatability. INTI didn’t show details of its uncertainty calculation.
9 Analysis of the reported results
The weighted mean is used as the reference value, in accord with a decision made at the the 12
th WGDM
meeting [2].

SIM L-K3 Final Report Page 27 of 42
9.1 Weighted mean, internal and external uncertainties and the Birge ratio test The KCRV (Key Comparison Reference Value) was calculated as the weighted mean value from equation 3, as follows [2]:
i
n
i
n
i
ii
xu
xxu
x
1
2
1
2
w (3)
The uncertainty of the KCRV is calculated as the internal standard deviation. The internal standard deviation is based on the estimated uncertainties as reported by the laboratories and is calculated from equation 4, as follows:
I
i ixu
x
1
2wint
1
1 u (4)
The external standard deviation is calculated, with I (number of participants):
I
i
I
i
wi
i
xu
xxxu
Ix
12
1
1
2
2
wext1
1
1
1 u (5)
The Birge ratio has an expectation value of 1(for a large number of I) where the Birge ratio is calculated:
w
wextB
xu
xuR
int
(6)
The Birge ratio has an expectation value of BR =1, when considering standard uncertainties. For a coverage
factor of k=2, the expectation value is increased and the data in a comparison are consistent provided that:
)1/(81 IRB (7)
where I is the number of laboratories. For I = 6, a value of BR < 1.50 indicates consistency, as well as for
I = 5, a value of BR < 1.55, and for I = 4, a value of BR < 1.62.
Calculating the En value for the result of each laboratory is a check for statistical consistency of the laboratories’ results with their uncertainties as used in the intercomparison [2]. The En value (for coverage factor k=1) is calculated according to (8). The minus sign in the denominator is due to correlation between the single measurement results and the KCRV.
2int
2nE
wi
wi
xuxu
xx
(8)

SIM L-K3 Final Report Page 28 of 42
For the determination of the key comparison reference value KCRV, statistical consistency of the results
contributing to the KCRV is required. A check for statistical consistency of the results with their associated
uncertainties can be made by calculating the En value for each laboratory’s result. The results are examined
and any for which |En|> 2 is considered to be an inconsistent result. The result with the largest |En| should be
excluded from contributing to the weighted mean, and then results should be re-calculated. This process is
iterated until there are no inconsistent results contributing to the weighted mean.
When calculating the En value for an excluded result, a positive sign is used in the denominator of equation
(8) because it is no longer correlated. Sometimes, the change of sign may give a new value of |En| which is
less than 2, but once a result has been declared an outlier it remains an outlier and should not be brought
back into the analysis of the KCRV. This is also true if subsequent exclusion of outliers causes a previously
excluded result to have |En|< 2.
After reaching consistency, the calculated weighted mean is the KCRV.
9.2 Polygon: Calculations and discussions
The calculation of KCRV (Key comparison reference value) wx and associated standard uncertainty
u wint x are showed in the following tables:
Normal Polygon faces (angles) [seconds]
1-2 2-3 3-4 4-5 5-6 6-7 7-8 8-9 9-10 10-11 11-12 12-1
wx - 0.146 0.288 0.309 -0.031 0.097 -0.328 -0.447 0.095 -0.349 0.791 -0.183 -0.086
u wint x 0.030 0.027 0.029 0.030 0.028 0.029 0.028 0.029 0.027 0.027 0.030 0.032
Table 9 Key comparison reference value wx and associated standard uncertainty u wint x for
measurements carried out in the normal position.
Inverted Polygon faces (angles) [seconds]
1-2 2-3 3-4 4-5 5-6 6-7 7-8 8-9 9-10 10-11 11-12 12-1
wx - 0.148 0.289 0.340 -0.038 0.093 -0.336 -0.447 0.104 -0.336 0.785 -0.189 -0.114
u wint x 0.030 0.028 0.029 0.028 0.026 0.027 0.027 0.027 0.028 0.028 0.031 0.028
Table 10 Key comparison reference value wx and associated standard uncertainty u wint x for
measurements carried out in the inverted position.
Graph 6(a) RB calculated for all the face to face readings on the polygon (Normal position).
0.00.20.40.60.81.01.21.41.6
Face to face
Birge Ratios for measurements of polygon face-to-face angles (Normal position)
1-2 2-3 3-4 4-5 5-6 6-7 7-8 8-9 9-10 10-11 11-12 12-1

SIM L-K3 Final Report Page 29 of 42
Graph 6(b) RB calculated for all the face to face readings on the polygon (Inverted position).
Graph 7(a) En values calculated for all the angular deviations reported by laboratories for the polygon (measurements made in the normal position).
Graph 7(b) En values calculated for all the angular deviations reported by laboratories for the polygon (measurements made in the inverted position).
0.00.20.40.60.81.01.21.41.61.82.0
-2.0
-1.0
0.0
1.0
2.0
3.0
-4.0
-3.0
-2.0
-1.0
0.0
1.0
2.0
3.0
Face to face
Birge ratios for measurements of polygon face-to-face angles (Inverted position)
En value with weighted mean as KCRV (Normal position)
INMETRO NIST GUM NPLI INTI
En value with weighted mean as KCRV (Inverted position)
INMETRO CENAM NIST GUM NPLI INTI
1-2 2-3 3-4 4-5 5-6 6-7 7-8 8-9 9-10 10-11 11-12 12-1

SIM L-K3 Final Report Page 30 of 42
Graph 8(a) Histogram of the En values for all results obtained by the laboratories for all angles of the polygon, as shown in graph 7(a), for the measurements made in normal position.
Graph 8(b) Histogram of the En values for all results obtained by the laboratories for all angles of the polygon, as shown in graph 7(b), for the measurements made in inverted position.
For the measurements made in normal position, from graph 7(a) it can be seen that 9 out of a total of 60 (5 participants and 12 measurements on the polygon) had En values larger than 1. It must be remembered that k=1 is used. For this case, the upper limit of the expected En value should be 2. Only one measurement result was larger than 2. The comparisons of the Birge ratio, graph 6(a), show consistency of the measurement results. For the measurements made in inverted position, from the graph 7(b) it can be seen that 4 out of 72 (6 participants and 12 measurements on the polygon) had En values larger than 2. The comparisons of Birge ratio, graph 6(b), show that, for three angles the RB values were larger than 1.5.
9.3 Polygons: Calculations and discussions, excluding outliers
For the measurements carried out in the normal position, in spite of the fact that the RB value was 1.39, it was decided to exclude the measurement result for the angle 2-3, declared by INTI, due to the fact that it presented an En value of 2.74.
0
10
20
30
40
50
60
-1 0 1 2 En values
Fre
quency
0
10
20
30
40
50
60
-3 -2 -1 0 1 2
Histogram of En values (Inverted position)
Fre
quency
Histogram of En values (Normal position)
En values

SIM L-K3 Final Report Page 31 of 42
The following table shows the change in the Birge ratio, after this exclusion.
Angle Birge ratio with all participants included
Birge ratio excluding the INTI measurement result
2 – 3 1.39 0.30
Table 11 Birge ratios before and after the exclusion of INTI measurement result, for the angle 2-3 in the normal position.
The following table shows the change in the En values, after the mentioned exclusion.
INMETRO NIST GUM NPLI INTI
En with all participants included 0.19 0.15 -1.08 0.20 2.74
En excluding the INTI measurement result
0.26 0.36 -0.48 0.23 2.74*
Table 12 Comparison of the En value considering all the participants and the En value with “outlier” excluded, for measurements carried out in the normal position. The measurement result for the angle 2-3, declared by INTI, was excluded.
* INTI En value after exclusion was calculated with the plus sign in the denominator because the result obtained by that institute did not contribute to the weighted mean (no correlation between this result and the KCRV).
For the measurements carried out in the inverted position, it was decided to exclude the measurement results showed in the next table, which presented an En value larger than 2.
Angle CENAM NPLI INTI
1 - 2 -3.20 --- ---
2 - 3 ---- --- 2.48
7 - 8 -3.07 2.14 ---
Table 13 En values larger than two, for measurements carried out in the inverted position.
The following table show the change in the Birge ratio compared to the ratio before the four results were excluded.
Angle Birge ratio with all participants included
Birge ratio excluding the results above
1 – 2 1.62 0.85
2 – 3 1.51 1.15
7 - 8 1.83 0.98
Table 14 Comparison of the Birge ratio considering all the participants and the one with “outliers” excluded, for measurements carried out in the inverted position. Measurement results for the angles 1-2 and 7-8, declared by CENAM; 2-3 declared by INTI and 7-8 declared by NPLI were excluded.

SIM L-K3 Final Report Page 32 of 42
The following table shows the change in the En values, after the mentioned exclusions.
Angle En INMETRO CENAM NIST GUM NPLI INTI
1-2
En with all participants included 0.50 -3.20 0.18 1.89 0.66 -1.32
En excluding the CENAM measurement result
0.28 -3.20* -0.46 0.70 0.58 -1.49
2-3
En with all participants included 0.30 1.36 -0.10 -1.30 -1.73 2.48
En excluding the INTI measurement result
0.37 1.48 0.10 -0.87 -1.71 2.48*
7-8
En with all participants included 0.88 -3.07 0.31 1.30 2.14 -1.43
En excluding the CENAM and NPLI measurement results
0.74 -3.03* -0.11 0.28 2.08* -1.54
Table 15 Comparison of the En value considering all the participants and the En value with “outliers” excluded, for measurements carried out in the inverted position. The measurement results for the angles 1-2 and 7-8, declared by CENAM; 2-3 declared by INTI and 7-8 declared by NPLI were excluded.
* INTI, CENAM and NPLI En values after exclusion were calculated with the plus sign in the denominator because the results obtained by those institutes did not contribute to the weighted mean (no correlation between this results and the KCRV).
9.4 Polygons: Calculation of KCRV, excluding outliers
Normal Polygon faces (angles) [seconds]
1-2 2-3 3-4 4-5 5-6 6-7 7-8 8-9 9-10 10-11 11-12 12-1
wx - 0.146 0.278 0.309 -0.031 0.097 -0.328 -0.447 0.095 -0.349 0.791 -0.183 -0.086
u wint x 0.030 0.027 0.029 0.030 0.028 0.029 0.028 0.029 0.027 0.027 0.030 0.032
Table 16 Key comparison reference value wx and associated standard uncertainty u wint x with
“outliers” excluded, for measurements carried out in the normal position. Measurement result for the angle 2-3, declared by INTI was excluded.
Inverted Polygon faces (angles) [seconds]
1-2 2-3 3-4 4-5 5-6 6-7 7-8 8-9 9-10 10-11 11-12 12-1
wx - 0.116 0.279 0.340 -0.038 0.093 -0.336 -0.425 0.104 -0.336 0.785 -0.189 -0.114
u wint x 0.031 0.028 0.029 0.028 0.026 0.027 0.028 0.027 0.028 0.028 0.031 0.028
Table 17 Key comparison reference value wx and associated standard uncertainty u wint x with
“outliers” excluded, for measurements carried out in the inverted position. Measurement results for the angles 1-2 and 7-8, declared by CENAM; 2-3 declared by INTI and 7-8 declared by NPLI were excluded.
9.5 Polygons: Calculation of Degrees of Equivalence
The Degree of Equivalence, DoE, for a laboratory result xi is calculated simply as wi xx . The uncertainty
of the DoE is calculated using either [4]:
22
wintiwi xuxuxxu for results which contributed to the weighted mean (9)
or
2int
2
wiwi xuxuxxu for results which made no contribution. (10)

SIM L-K3 Final Report Page 33 of 42
The followings tables show the degrees of equivalence (DoE) = wxxi and associated expanded
uncertainty U(DoE) = 2int
22)( wiwi xuxuxxU for the measurements carried out in the normal
and inverted position, with “outliers” excluded.
Normal INMETRO NIST GUM NPLI INTI
DoE U(DoE) DoE U(DoE) DoE U(DoE) DoE U(DoE) DoE U(DoE)
1-2 0.09 0.29 -0.04 0.10 0.03 0.04 -0.31 0.82 -0.35 0.40
2-3 0.04 0.29 0.02 0.10 -0.01 0.03 0.09 0.82 0,55 0.40*
3-4 -0.10 0.29 0.03 0.10 -0.01 0.04 -0.40 0.82 0.15 0.40
4-5 0.01 0.29 0.02 0.10 -0.01 0.04 0.52 0.82 -0.13 0.40
5-6 0.09 0.29 0.00 0.10 -0.01 0.04 0.02 0.82 0.11 0.40
6-7 -0.08 0.29 -0.01 0.10 0.01 0.04 0.02 0.82 -0.06 0.40
7-8 0.06 0.29 -0.03 0.10 0.02 0.04 0.05 0.82 -0.34 0.40
8-9 -0.09 0.29 0.01 0.10 0.00 0.04 -0.45 0.82 0.32 0.40
9-10 0.00 0.30 0.00 0.10 0.00 0.03 -0.07 0.82 0.05 0.40
10-11 0.13 0.30 0.01 0.10 -0.01 0.03 0.20 0.82 -0.03 0.40
11-12 -0.08 0.29 0.00 0.10 0.00 0.04 0.12 0.82 -0.01 0.40
12-1 -0.07 0.29 0.00 0.10 0.02 0.05 0.21 0.82 -0.26 0.39
Table 18 Degrees of equivalence and associated expanded uncertainty with “outliers” excluded and measurements carried out in the normal position. All values are in seconds. Measurement result for the angle 2-3, declared by INTI was excluded.
*The U(DoE) value for the INTI after exclusion was calculated from equation 10 because the result obtained by that institute did not contribute to the weighted mean (no correlation between this result and the KCRV).
Inverted INMETRO CENAM NIST GUM NPLI INTI
DoE U(DoE) DoE U(DoE) DoE U(DoE) DoE U(DoE) DoE U(DoE) DoE U(DoE)
1-2 0.04 0.29 -0.31 0.20* -0.02 0.10 0.02 0.05 0.24 0.82 -0.29 0.40
2-3 0.05 0.29 0.13 0.18 0.00 0.10 -0.02 0.04 -0.70 0.82 0.50 0.40*
3-4 -0.03 0.29 0.15 0.18 0.00 0.10 -0.02 0.05 -0.54 0.82 0.13 0.40
4-5 -0.14 0.29 0.01 0.18 0.01 0.10 0.01 0.04 0.04 0.82 -0.18 0.40
5-6 0.02 0.30 0.13 0.18 0.00 0.10 -0.01 0.04 -0.71 0.82 0.12 0.40
6-7 -0.02 0.30 0.07 0.18 0.02 0.10 -0.01 0.04 0.00 0.82 0.01 0.40
7-8 0.11 0.29 -0.29 0.19* -0.01 0.10 0.01 0.04 0.86 0.82* -0.30 0.40
8-9 -0.08 0.30 0.07 0.18 0.01 0.10 -0.01 0.04 -0.30 0.82 0.27 0.40
9-10 0.03 0.29 -0.03 0.18 -0.01 0.10 0.01 0.04 0.43 0.82 -0.01 0.40
10-11 -0.03 0.29 0.07 0.18 -0.04 0.10 0.00 0.04 0.42 0.82 -0.07 0.40
11-12 -0.05 0.29 0.10 0.18 -0.02 0.10 -0.01 0.06 0.25 0.82 0.05 0.40
12-1 0.06 0.29 -0.13 0.18 0.03 0.10 0.01 0.04 -0.05 0.82 -0.27 0.40
Table 19 Degrees of equivalence and associated expanded uncertainty with “outliers” excluded and measurements carried out in the inverted position. All values are in seconds. Measurement results for the angles 1-2 and 7-8, declared by CENAM; 2-3 declared by INTI and 7-8 declared by NPLI were excluded.
*The U(DoE) values for the INTI, CENAM and NPLI after exclusion were calculated from equation 10 because the results obtained by those institutes did not contribute to the weighted mean (no correlation between this results and the KCRV).
SIM L-K3 Final Report Page 34 of 42
9.6 Angle blocks: Calculations and discussions
The calculation of KCRV (Key comparison reference value) wx and associated standard uncertainty
u wint x are showed in the following tables:
Normal Angle blocks (angles) [seconds]
5” 30” 5’ 5º
wx 0.534 0.280 0.334 0.430
u wint x 0.035 0.035 0.036 0.035
Table 20 Key comparison reference value wx and associated standard uncertainty u wint x
considering measurements carried out in the normal position.
Inverted Angle blocks (angles) [seconds]
5” 30” 5’ 5º
wx 0.485 0.303 0.358 0.403
u wint x 0.035 0.035 0.036 0.035
Table 21 Key comparison reference value wx and associated standard uncertainty u wint x
considering measurements carried out in the inverted position.
Graph 9(a) RB calculated for all measurements of each angle block (Normal position).
0.00
0.50
1.00
1.50
2.00
2.50
Birge Ratios for all measurements of each angle block (Normal position)
5” 30” 5’ 5º

SIM L-K3 Final Report Page 35 of 42
Graph 9(b) RB calculated for all measurements of each angle block (Inverted position).
Graph 10(a) En values for all the results on the 5” angle block with measurements made in normal position.
Graph 10(b) En values for all the results on the 5” angle block with measurements made in inverted position. The graph shows CENAM having an En value larger than two.
0.00
0.50
1.00
1.50
2.00
2.50
3.00
-0.8
-0.6
-0.4
-0.2
0.0
0.2
0.4
0.6
0.8
1.0
1.2
-2.5
-2.0
-1.5
-1.0
-0.5
0.0
0.5
1.0
1.5
En values for the 5 seconds angle block (Normal position)
INMETRO CENAM NIST GUM NPLI INTI
En values for the 5 seconds angle block (Inverted position)
INMETRO CENAM NIST GUM NPLI INTI
Birge Ratios for all measurements of each angle block (Inverted position)
5” 30” 5’ 5º

SIM L-K3 Final Report Page 36 of 42
Graph 11(a) En values for all the results on the 30” angle block with measurements made in normal position.
Graph 11(b) En values for all the results on the 30” angle block with measurements made in inverted position. The graph shows INMETRO having an En value larger than two.
Graph 12(a) En values for all the results on the 5’ angle block with measurements made in normal position. The graph shows CENAM having an En value larger than two.
-1.5
-1.0
-0.5
0.0
0.5
1.0
1.5
2.0
2.5
-3.0
-2.0
-1.0
0.0
1.0
2.0
3.0
4.0
5.0
6.0
-3.0
-2.0
-1.0
0.0
1.0
2.0
3.0
4.0
En values for the 30 seconds angle block (Normal position)
INMETRO CENAM NIST GUM NPLI INTI
En values for the 30 seconds angle block (Inverted position)
INMETRO CENAM NIST GUM NPLI INTI
En values for the 5 minutes angle block (Normal position)
INMETRO CENAM NIST GUM NPLI INTI
SIM L-K3 Final Report Page 37 of 42
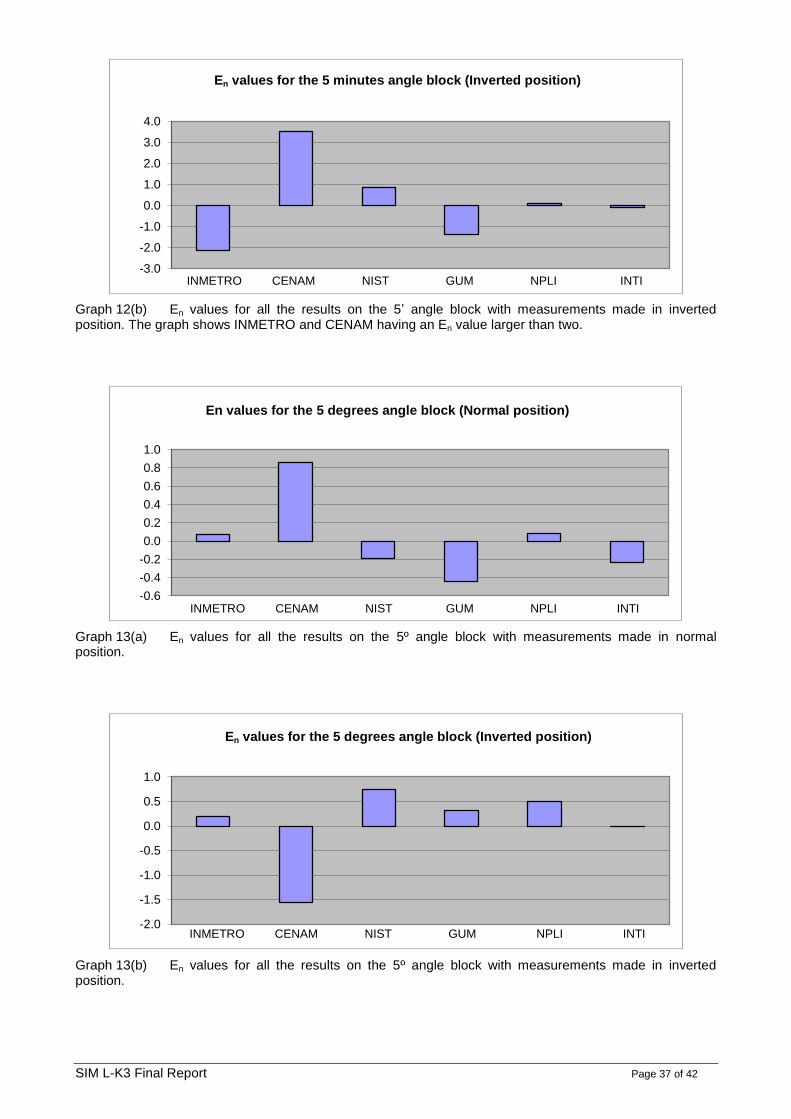
Graph 12(b) En values for all the results on the 5’ angle block with measurements made in inverted position. The graph shows INMETRO and CENAM having an En value larger than two.
Graph 13(a) En values for all the results on the 5º angle block with measurements made in normal position.
Graph 13(b) En values for all the results on the 5º angle block with measurements made in inverted position.
-3.0
-2.0
-1.0
0.0
1.0
2.0
3.0
4.0
-0.6
-0.4
-0.2
0.0
0.2
0.4
0.6
0.8
1.0
-2.0
-1.5
-1.0
-0.5
0.0
0.5
1.0
En values for the 5 minutes angle block (Inverted position)
INMETRO CENAM NIST GUM NPLI INTI
En values for the 5 degrees angle block (Normal position)
INMETRO CENAM NIST GUM NPLI INTI
En values for the 5 degrees angle block (Inverted position)
INMETRO CENAM NIST GUM NPLI INTI

SIM L-K3 Final Report Page 38 of 42
Graph 14(a) Histogram of the En values for all angle blocks and all laboratories in the normal position.
Graph 14(b) Histogram of the En values for all angle blocks and all laboratories in the inverted position.
From graphs 10(a) to 13(b), it can be seen that 5 measurement results out of 48 (6 participants and four angle blocks measured in two positions – normal and inverted) had En values larger than 2. Graph 14(a) shows a histogram of all the En values calculated for all angle blocks in normal position and the graph 14(b) in inverted position.
9.7 Angle blocks: Calculations and discussions, excluding outliers
For the measurements in normal position, it was decided to exclude the measurement result from CENAM declared for the 5’ (minutes) angle block (En = 4.02).
0
2
4
6
8
10
12
14
16
18
20
0
2
4
6
8
10
12
14
16
18
Histogram of En values for all angle blocks (Normal position)
-1 0 1 2 3 4
Histogram of En values for all angle blocks (Inverted position)
-2 -1 0 1 3 5
En values
Fre
quency
En values
Fre
quency
SIM L-K3 Final Report Page 39 of 42
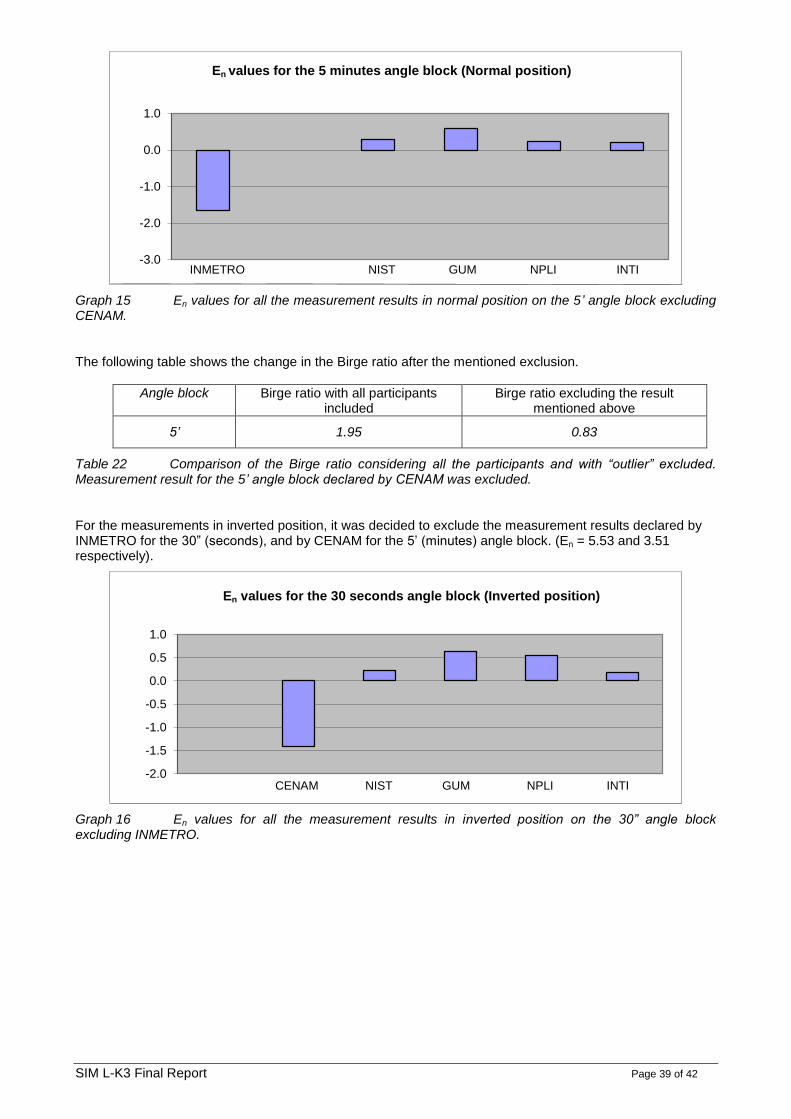
Graph 15 En values for all the measurement results in normal position on the 5’ angle block excluding CENAM. The following table shows the change in the Birge ratio after the mentioned exclusion.
Angle block Birge ratio with all participants included
Birge ratio excluding the result mentioned above
5’ 1.95 0.83
Table 22 Comparison of the Birge ratio considering all the participants and with “outlier” excluded. Measurement result for the 5’ angle block declared by CENAM was excluded. For the measurements in inverted position, it was decided to exclude the measurement results declared by INMETRO for the 30” (seconds), and by CENAM for the 5’ (minutes) angle block. (En = 5.53 and 3.51 respectively).
Graph 16 En values for all the measurement results in inverted position on the 30” angle block excluding INMETRO.
-3.0
-2.0
-1.0
0.0
1.0
-2.0
-1.5
-1.0
-0.5
0.0
0.5
1.0
En values for the 5 minutes angle block (Normal position)
INMETRO NIST GUM NPLI INTI
En values for the 30 seconds angle block (Inverted position)
CENAM NIST GUM NPLI INTI

SIM L-K3 Final Report Page 40 of 42
Graph 17 En values for all the measurement results in inverted position on the 5‘ angle block excluding CENAM. The following table shows the change in the Birge ratio after the mentioned exclusions.
Angle Birge ratio with all participants included
Birge ratio excluding the results above.
30” 2.56 0.75
5’ 1.85 1.08
Table 23 Comparison of the Birge ratio considering all the participants and with “outliers” excluded, to measurements carried out in the inverted position. Measurement results for the 30” angle block declared by INMETRO and the 5’ angle block declared by CENAM were excluded.
9.8 Angle blocks: Calculation of KCRV, excluding outliers
Normal Angle blocks (angles) [seconds]
5” 30” 5’ 5º
wx 0.534 0.280 0.299 0.430
u wint x 0.035 0.035 0.037 0.035
Table 24 Key comparison reference value wx and associated standard uncertainty u wint x with
“outliers” excluded, considering measurements carried out in the normal position. Measurement result for the 5’ angle block declared by CENAM was excluded.
Inverted Angle blocks (angles) [seconds]
5” 30” 5’ 5º
wx 0.485 0.257 0.328 0.403
u wint x 0.035 0.036 0.037 0.035
Table 25 Key comparison reference value wx and associated standard uncertainty u wint x with
“outliers” excluded, considering measurements carried out in the inverted position. Measurement results for the 30” angle block declared by INMETRO and the 5’ angle block declared by CENAM were excluded.
-3.0
-2.0
-1.0
0.0
1.0
2.0
En values for the 5 minutes angle block (Inverted position)
INMETRO NIST GUM NPLI INTI

SIM L-K3 Final Report Page 41 of 42
9.9 Angle blocks: Calculation of Degrees of Equivalence
The Degree of Equivalence, DoE, and the uncertainty of the DoE for a laboratory result xi is calculated in
according with the item 9.5.
The followings tables shows the degrees of equivalence (DoE) and associated expanded uncertainty U(DoE) for the measurements carried out in the normal and inverted position, with “outliers” excluded.
Normal INMETRO CENAM NIST GUM NPLI INTI
DoE U(DoE) DoE U(DoE) DoE U(DoE) DoE U(DoE) DoE U(DoE) DoE U(DoE)
5” 0.16 0.29 0.07 0.21 -0.07 0.21 -0.01 0.04 0.20 0.52 -0.09 0.60
30” 0.29 0.29 -0.04 0.21 0.00 0.21 -0.02 0.04 0.16 0.52 -0.01 0.60
5’ -0.24 0.29 0.62 0.31* 0.03 0.21 0.01 0.04 0.06 0.51 0.06 0.60
5º 0.01 0.29 0.09 0.21 -0.02 0.21 -0.01 0.04 0.02 0.52 -0.07 0.60
Table 26 Degrees of equivalence and associated expanded uncertainty considering “outliers” excluded and measurements carried out in the normal position. All values are in seconds. Measurement result for the 5’ angle block declared by CENAM was excluded.
*The U(DoE) value for the CENAM after exclusion was calculated from equation 10 because the result obtained by that institute did not contribute to the weighted mean (no correlation between this result and the KCRV).
Inverted INMETRO CENAM NIST GUM NPLI INTI
DoE U(DoE) DoE U(DoE) DoE U(DoE) DoE U(DoE) DoE U(DoE) DoE U(DoE)
5” 0.13 0.29 -0.23 0.21 0.03 0.21 0.01 0.04 0.07 0.52 -0.01 0.60
30” 0.85 0.31* -0.15 0.21 0.02 0.21 0.01 0.04 0.14 0.52 0.05 0.60
5’ -0.28 0.29 0.54 0.31* 0.12 0.21 0.00 0.04 0.05 0.51 0.00 0.60
5º 0.03 0.29 -0.16 0.21 0.08 0.21 0.01 0.04 0.13 0.52 0.00 0.60
Table 27 Degrees of equivalence and associated expanded uncertainty considering “outliers” excluded and measurements carried out in the inverted position. All values are in seconds. Measurement results for the 30” angle block declared by INMETRO and the 5’ angle block declared by CENAM were excluded.
*The U(DoE) values for the INMETRO and CENAM after exclusion were calculated from equation 10 because the results obtained by those institutes did not contribute to the weighted mean (no correlation between this results and the KCRV).

SIM L-K3 Final Report Page 42 of 42
10 Conclusions
From the SIM L-K3 angle standards key comparison, the following preliminary conclusions can be drawn:
The preparation of this report was based on the Final Report of the CCL-K3 [2].
The circulation of the standards until their return to the pilot laboratory has taken approximately 2 years. There was some delay due to transport and customs problems.
For angle blocks, there were two instances (INMETRO, 30 block and CENAM 5” block) where the difference between results in the normal and inverted position differ by more than might be reasonably
expected (i.e., differences that exceed 2√2.u, where u is the standard uncertainty).
Due to technical reasons, CENAM didn’t measure the optical polygon in its normal position.
In spite of having good equipment, the NPLI stated a relatively high measurement uncertainty, compared to the other participants.
The laboratories showed good agreement for the optical polygon, except INTI in the normal position, CENAM, NPLI and INTI in the inverted position, due to En values larger than 2.
For angle blocks, there wasn’t so good agreement. The worst case was the INMETRO’s measurement result for the 30" angle block in the inverted position.
The aim of this international comparison was to determine the level at which the laboratories can be equivalent with/to their calibration services. The artefacts were chosen to verify the calibration and measurement capability (CMC) of the participants. The optical polygon’s measurement results declared by the participants were, in general, very good. However, the angle blocks’ measurement results showed that some further investigation with regard to demonstrating of the CMCs is required.
Development of a careful and unambiguous uncertainty model would be helpful. We recommend that Discussion Group 3 of the WG-MRA undertake the development of such a model.
11 Acknowledgements
The pilot laboratory would like to acknowledge all our colleagues from participating laboratories for their assistance in the smooth running of this comparison.
12 References
[1] T. J. Quinn, Guidelines for CIPM key comparisons, 1 March 1999, BIPM, Paris.
[2] O. A. Kruger, National Metrology Institute of South Africa (NMISA), Final report, CCL-K3
[3] R Probst, Euromet angle comparison. Final report, Euromet project 371
[4] Document CCL-WG/-MRA-GD-32. (Report Template) on the BIPM web site at http://www.bipm.org/wg/AllowedDocuments.jsp?wg=CCL-WG. Accessed in Jan 6
th 2015.