Calibration and AMR validation example
1
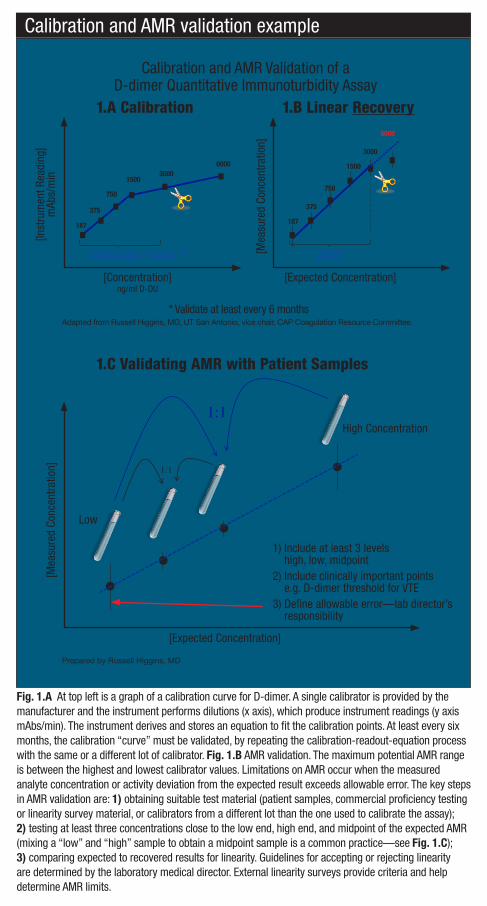
6000 3000 1500 750 375 3000 1500 750 375 187 187 1:1 1:1 Fig. 1.A At top left is a graph of a calibration curve for D-dimer. A single calibrator is provided by the manufacturer and the instrument performs dilutions (x axis), which produce instrument readings (y axis mAbs/min). The instrument derives and stores an equation to fit the calibration points. At least every six months, the calibration “curve” must be validated, by repeating the calibration-readout-equation process with the same or a different lot of calibrator. Fig. 1.B AMR validation. The maximum potential AMR range is between the highest and lowest calibrator values. Limitations on AMR occur when the measured analyte concentration or activity deviation from the expected result exceeds allowable error. The key steps in AMR validation are: 1) obtaining suitable test material (patient samples, commercial proficiency testing or linearity survey material, or calibrators from a different lot than the one used to calibrate the assay); 2) testing at least three concentrations close to the low end, high end, and midpoint of the expected AMR (mixing a “low” and “high” sample to obtain a midpoint sample is a common practice—see Fig. 1.C); 3) comparing expected to recovered results for linearity. Guidelines for accepting or rejecting linearity are determined by the laboratory medical director. External linearity surveys provide criteria and help determine AMR limits. Calibration and AMR Validation of a D-dimer Quantitative Immunoturbidity Assay 1.A Calibration 1.B Linear Recovery Adapted from Russell Higgins, MD, UT San Antonio, vice chair, CAP Coagulation Resource Committee. [Concentration] ng/ml D-DU [Expected Concentration] [Instrument Reading] mAbs/min [Measured Concentration] Calibration and AMR validation example 1.C Validating AMR with Patient Samples [Measured Concentration] Prepared by Russell Higgins, MD [Expected Concentration] High Concentration 1) Include at least 3 levels high, low, midpoint 2) Include clinically important points e.g. D-dimer threshold for VTE 3) Define allowable error—lab director’s responsibility Calibration “curve”* AMR* 6000 Low * Validate at least every 6 months
Transcript of Calibration and AMR validation example
November 2012 page 68
values vs. the target values has a lin-ear relationship because there is a known quantitative relationship be-tween the concentrations or activities in the sample set. Alternatively, one can make admixtures of appropriate materials of high and low analyte concentrations and demonstrate that there is the expected linear relation-ship between measured values of these admixtures and the expected values based on the proportion of low and high concentration samples in each admixture. With either ap-
proach, the values should be suitably spaced across the AMR, preferably equidistant from each other.”
The new regulations may spark confusion for some because of a dif-ference between the way in which coagulation results and chemistry re-sults are generally reported. Some coagulation results are reported as a percentage, whereas chemistry results, of course, tend to be reported in terms such as “20 milliliters per deciliter.”
Did the accreditation program take that fact into account when creating the new requirements? “Yes, and that was then brought to the CAP Instru-mentation Resource Committee and
the Coagulation Resource Committee for our input,” Dr. Eby says. “We agreed that many coagulation tests do not have purified standards, as are available in chemistry. But there are standards, nevertheless, that are des-ignated by international units, or IU. And it is very common in coagulation testing to equate 100 percent with 1 IU. And many assays that we do re-port in percentages can be traced back to an international unit standard.”
He and Anthony Killeen, MD, PhD, chair of the Instrumentation Resource Committee, felt it was ap-propriate to apply the principles of AMR and calibration verification to these methods if there was a calibra-tor in IU available to manufacturers when they create their calibrators, he says. “So it is different than chemis-try. You cannot purify many of the coagulation tests the way you can purify glucose or sodium. But we do have an alternative way to standard-ize calibrators.”
Speaking of manufacturers, don’t
expect them to provide guidance im-mediately regarding AMR calibra-tion validation on coagulation tests. “Unfortunately, the manufacturers and vendors of these tests are also new to these requirements,” says Dr. Eby. “And so package inserts are not consistent in providing guidance or information on this. We’re looking forward to that improving over time, so manufacturers can provide assis-tance that’s in compliance with these requirements.”
In the meantime, laboratories seek-ing advice or assistance regarding the new requirements are asked to e-mail [email protected]. Alternatively, Dr. Eby and Dr. Hoeltge encourage coagula-tion specialists to confer with their chemistry colleagues about the new regulations. Says Dr. Eby: “I really think this is a wonderful opportunity for chemists and coagulation experts to do a lot of cross-talking and inter-nal consulting.”
Anne Ford is a writer in Evanston, Ill.
68 / CAP TODAY November 2012
KRgen_twothirdCAP1211_x1a.pdf 1 10/14/12 5:09 PM
Checklist requirementscontinued from page 67
40
AMR Linearity
*Verify at least every 6 months
[Concentration] ng/ml D-DU
[Ins
trum
ent R
eadi
ng]
m
Abs
/min
*AMR
[Expected Concentration]
6000 3000
1500
750
375
3000
1500
750
375
Calibration Linear Recovery
187
187
42
[expected concentration]
[mea
sure
d co
ncen
trat
ion]
Validating AMR with Patient Samples
1:1
1:1
Fig. 1.A At top left is a graph of a calibration curve for D-dimer. A single calibrator is provided by the manufacturer and the instrument performs dilutions (x axis), which produce instrument readings (y axis mAbs/min). The instrument derives and stores an equation to fit the calibration points. At least every six months, the calibration “curve” must be validated, by repeating the calibration-readout-equation process with the same or a different lot of calibrator. Fig. 1.B AMR validation. The maximum potential AMR range is between the highest and lowest calibrator values. Limitations on AMR occur when the measured analyte concentration or activity deviation from the expected result exceeds allowable error. The key steps in AMR validation are: 1) obtaining suitable test material (patient samples, commercial proficiency testing or linearity survey material, or calibrators from a different lot than the one used to calibrate the assay); 2) testing at least three concentrations close to the low end, high end, and midpoint of the expected AMR (mixing a “low” and “high” sample to obtain a midpoint sample is a common practice—see Fig. 1.C); 3) comparing expected to recovered results for linearity. Guidelines for accepting or rejecting linearity are determined by the laboratory medical director. External linearity surveys provide criteria and help determine AMR limits.
Calibration and AMR Validation of a D-dimer Quantitative Immunoturbidity Assay
1.A Calibration 1.B Linear Recovery
Adapted from Russell Higgins, MD, UT San Antonio, vice chair, CAP Coagulation Resource Committee.
[Concentration] ng/ml D-DU
[Expected Concentration]
[Inst
rum
ent R
eadi
ng]
mAb
s/m
in
[Mea
sure
d Co
ncen
tratio
n]
Calibration and AMR validation example
1.C Validating AMR with Patient Samples
[Mea
sure
d Co
ncen
tratio
n]
Prepared by Russell Higgins, MD
[Expected Concentration]
High Concentration
1) Include at least 3 levels high, low, midpoint
2) Include clinically important points e.g. D-dimer threshold for VTE
3) Define allowable error—lab director’s responsibility
Calibration “curve”* AMR*
6000
Low
* Validate at least every 6 months
1112_67-68_Coag-LAP.indd 68 11/7/12 4:55 PM